software applications into your own dedicated scalable infrastructure without needing any sysadmin skills. Try https://www.squarescale.com with 100 o er using SNOWCAMP18 at account creation Snowcamp 2018 | docker run --rm squarescale/ybrissaud | @_crev_ | @sqscale
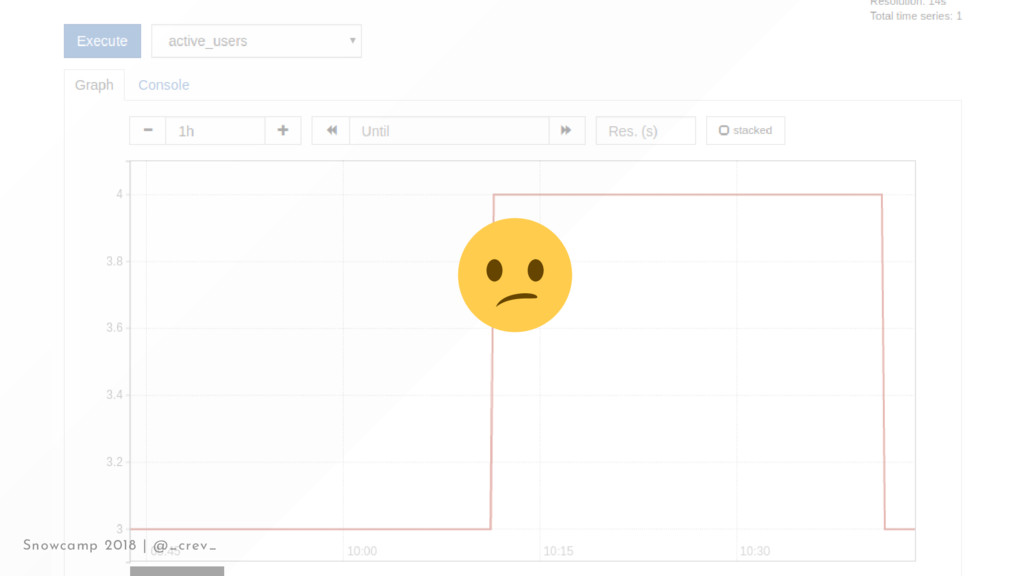
0 connection_pool{details="idle"} 3 connection_pool{details="waiting"} 0 active_users 3 # HELP version Version number version{service="web"} 0.1299 Snowcamp 2018 | @_crev_