Upgrade to Pro — share decks privately, control downloads, hide ads and more …

Auto profiling apps on every build (Droidcon SF 2016)

Auto profiling apps on every build (Droidcon SF 2016)

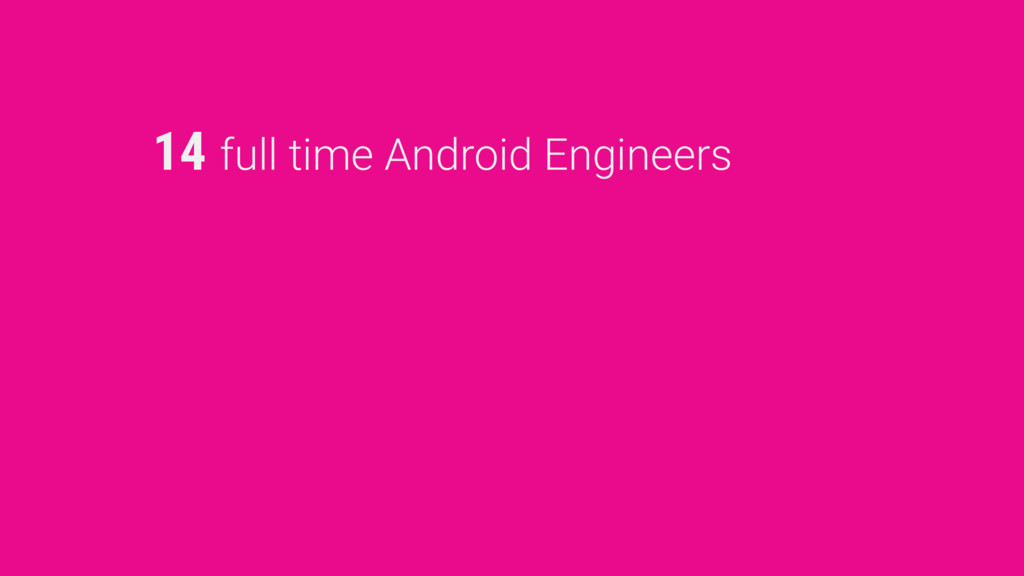
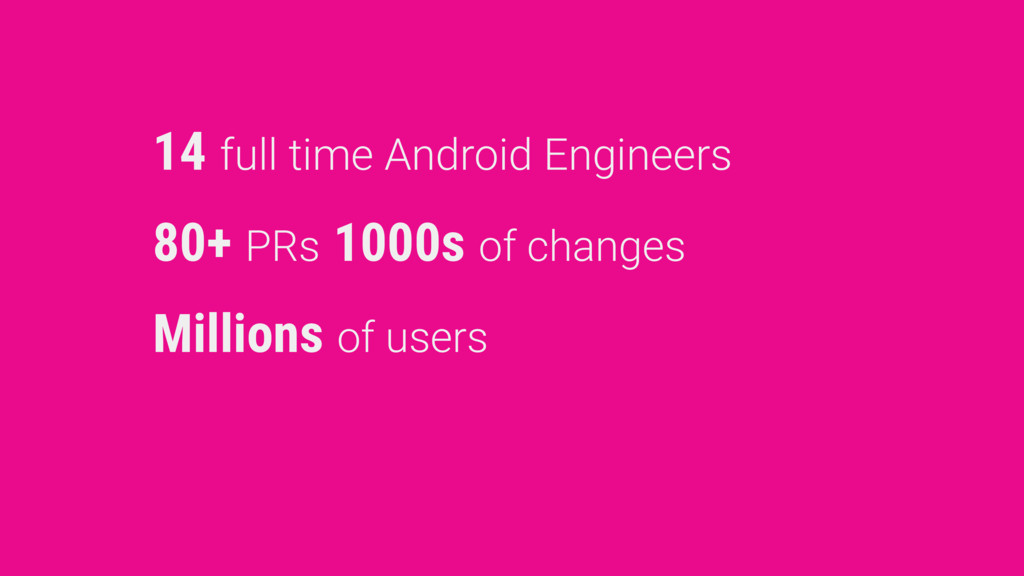
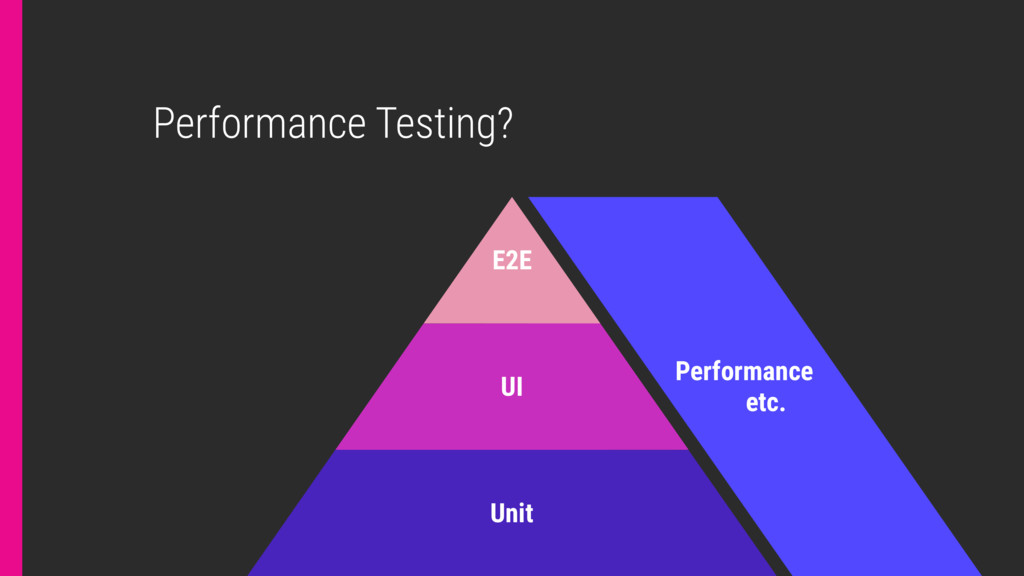
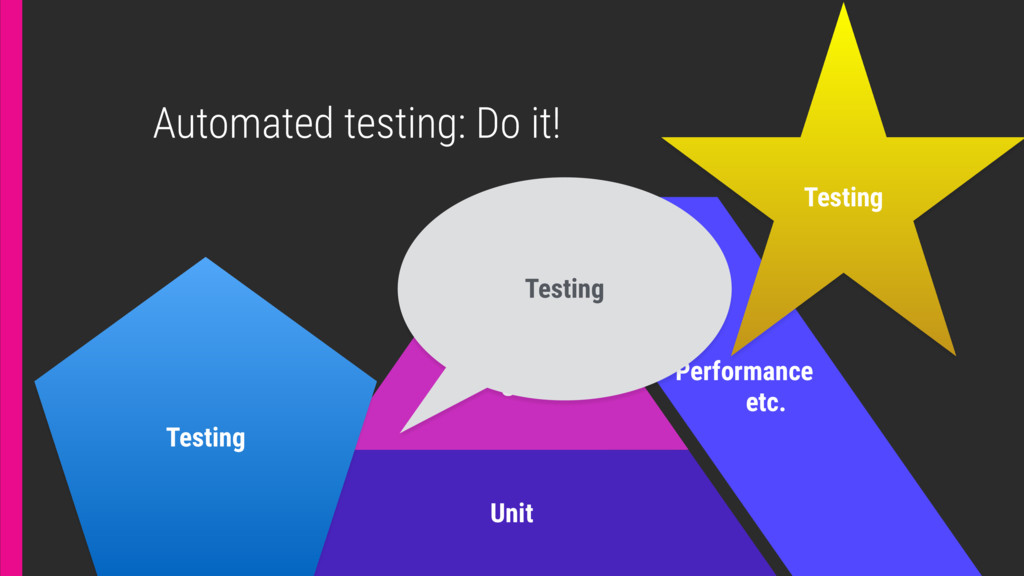
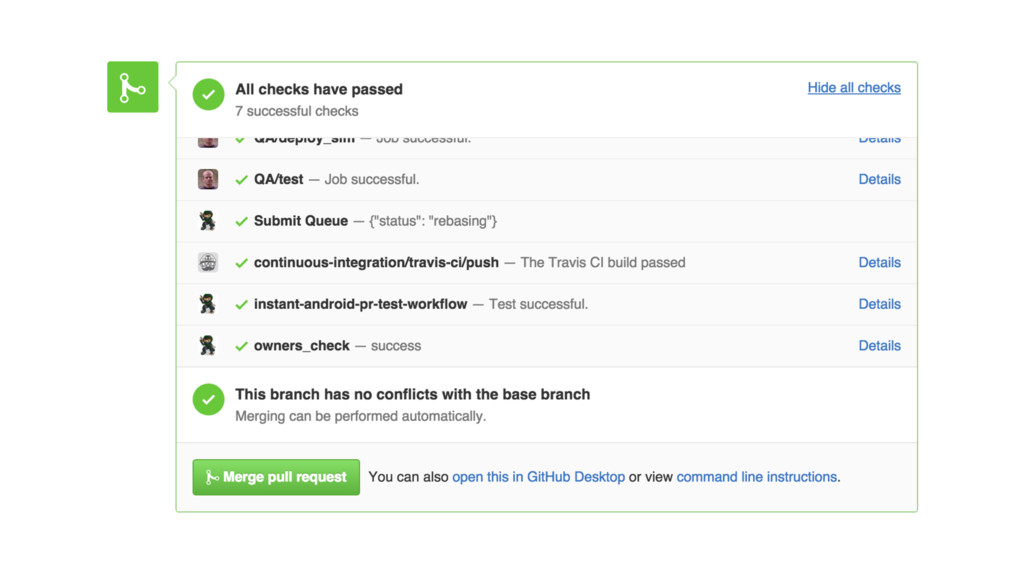
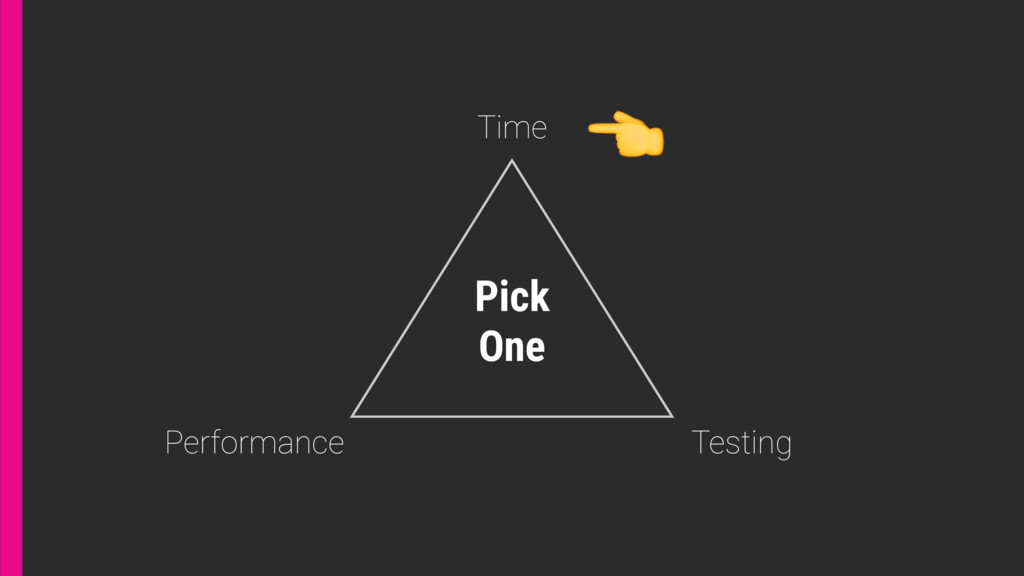
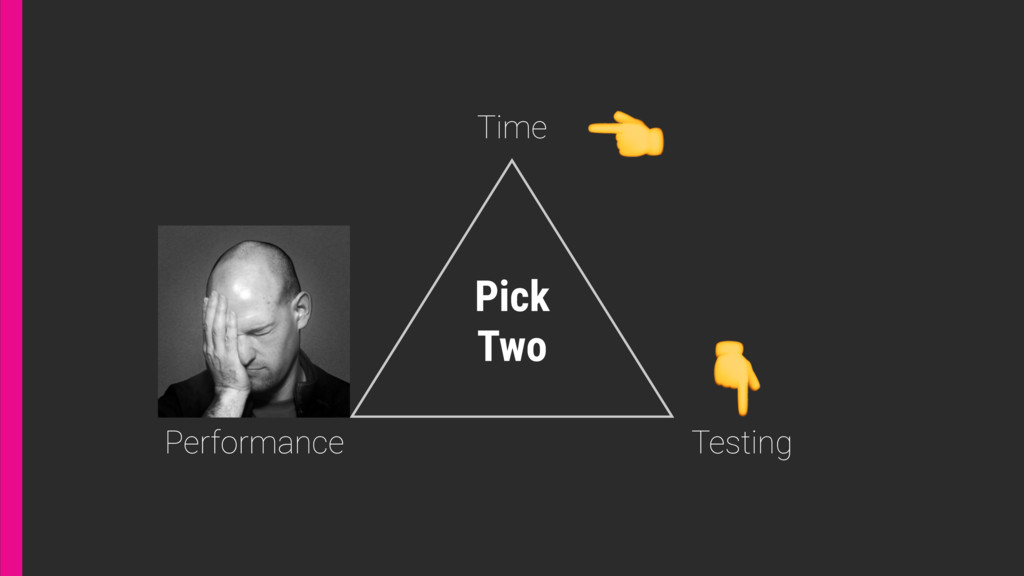
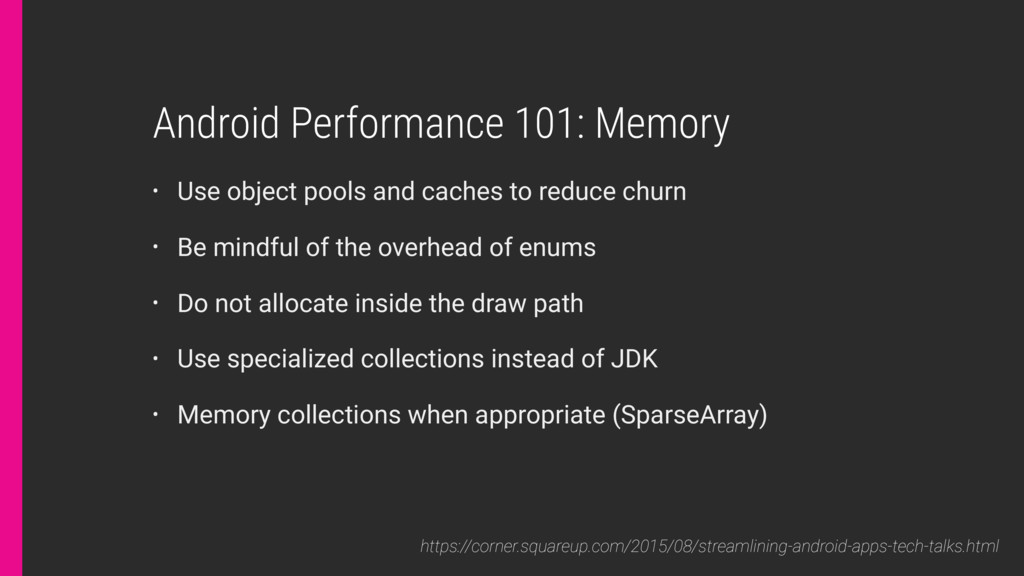
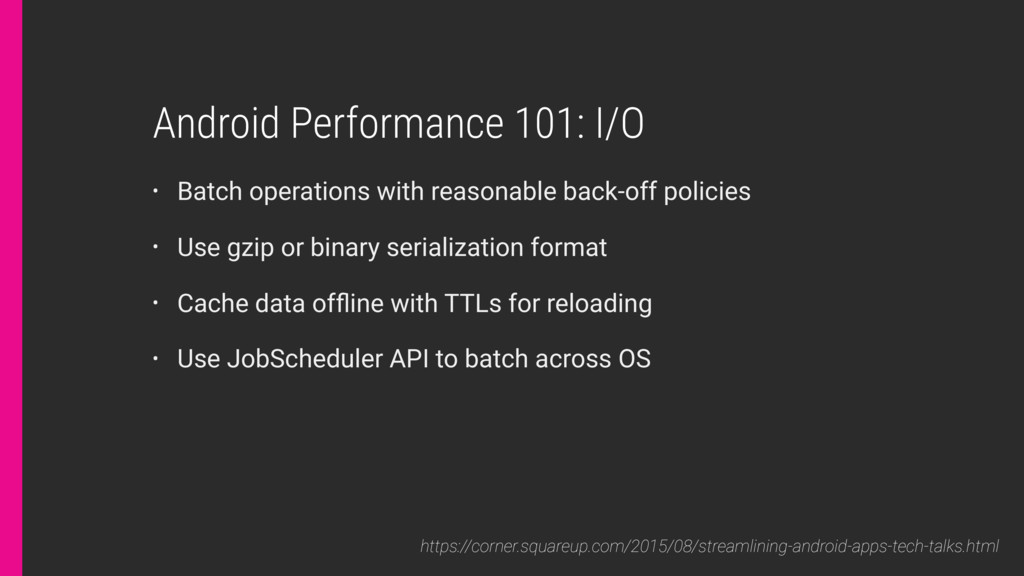
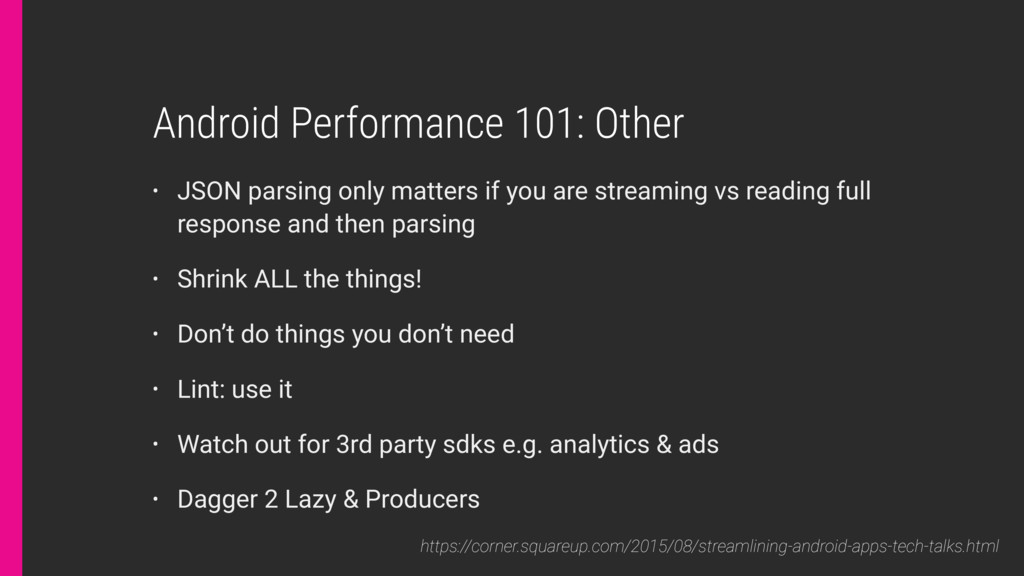
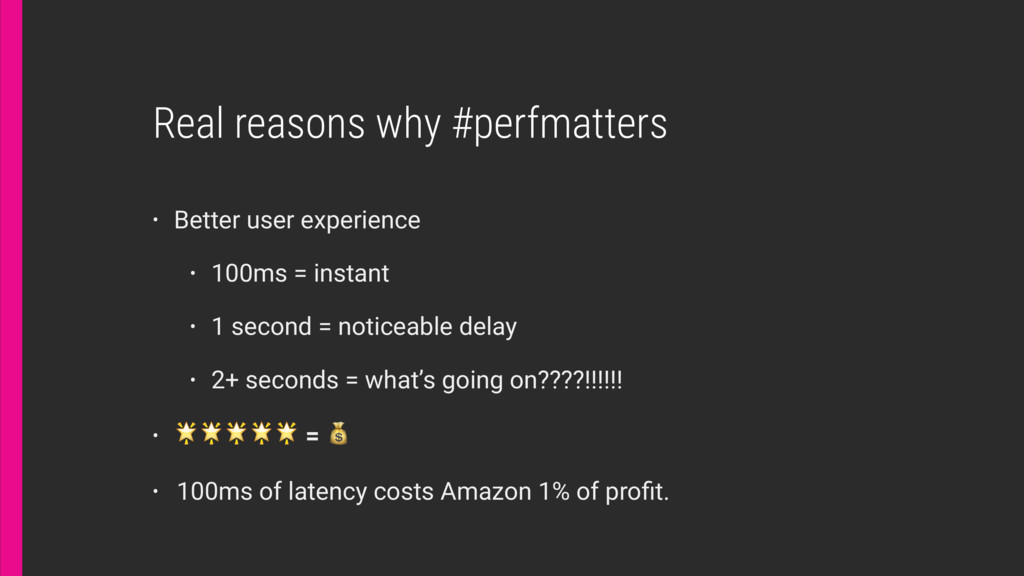
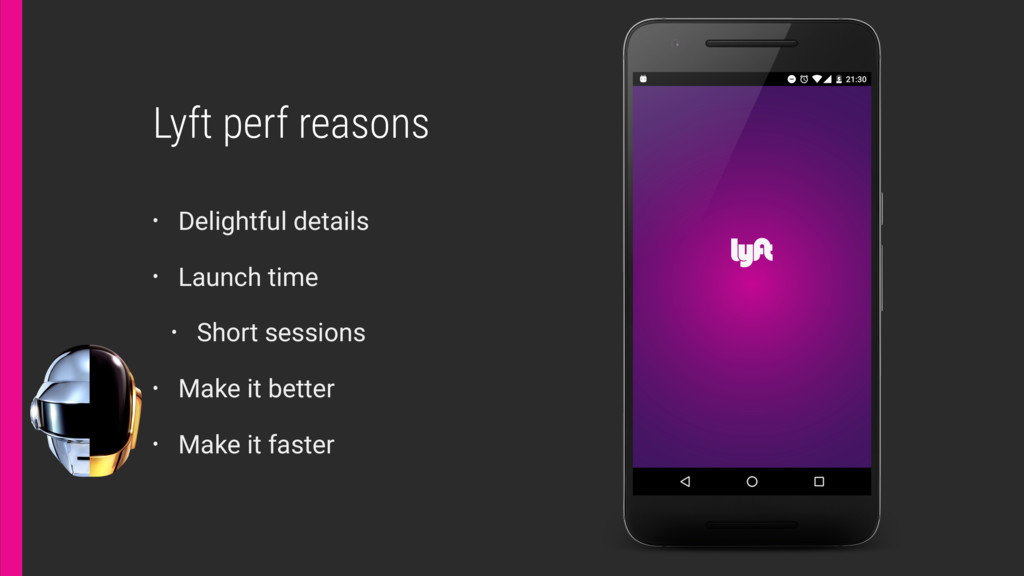
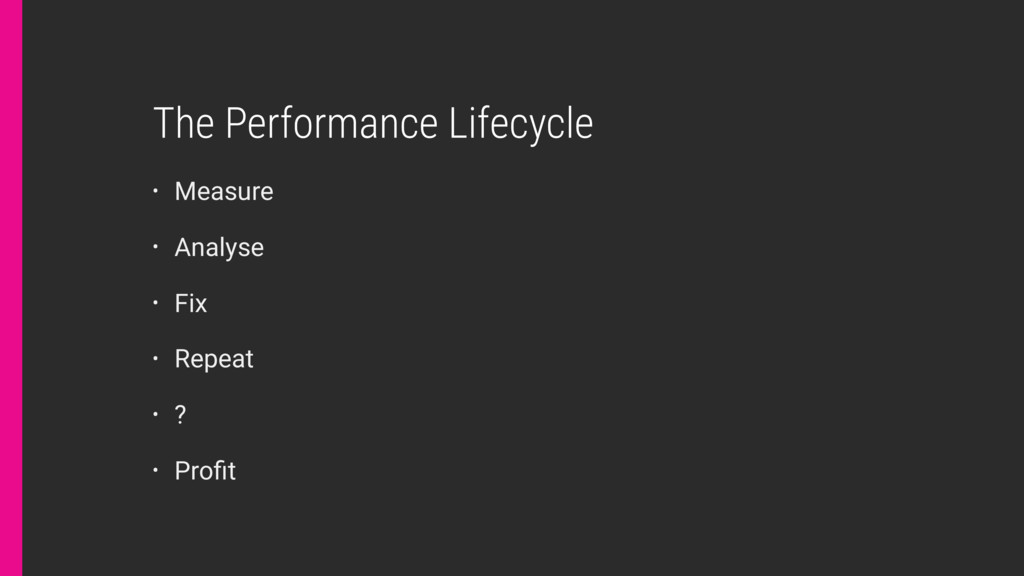
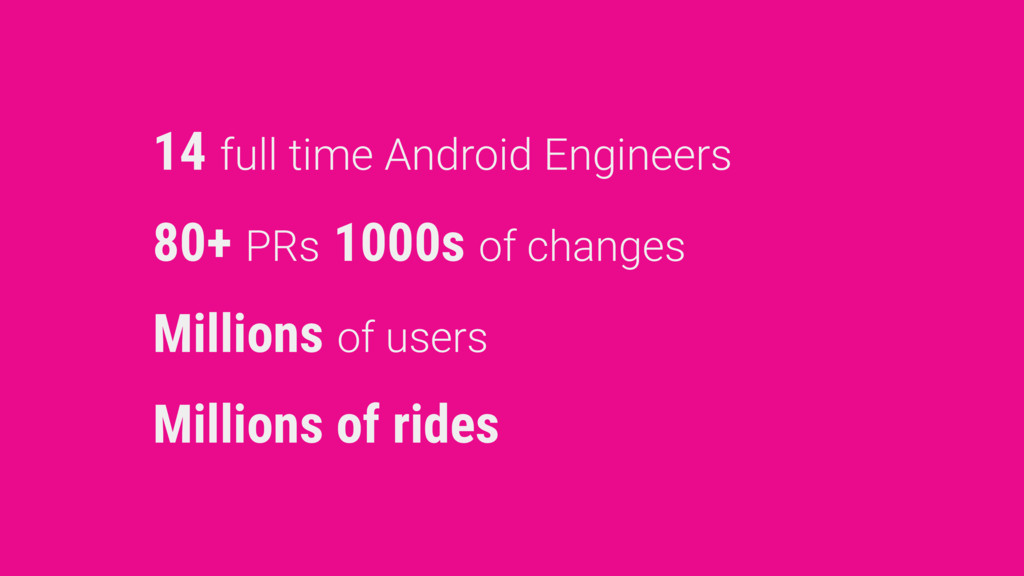
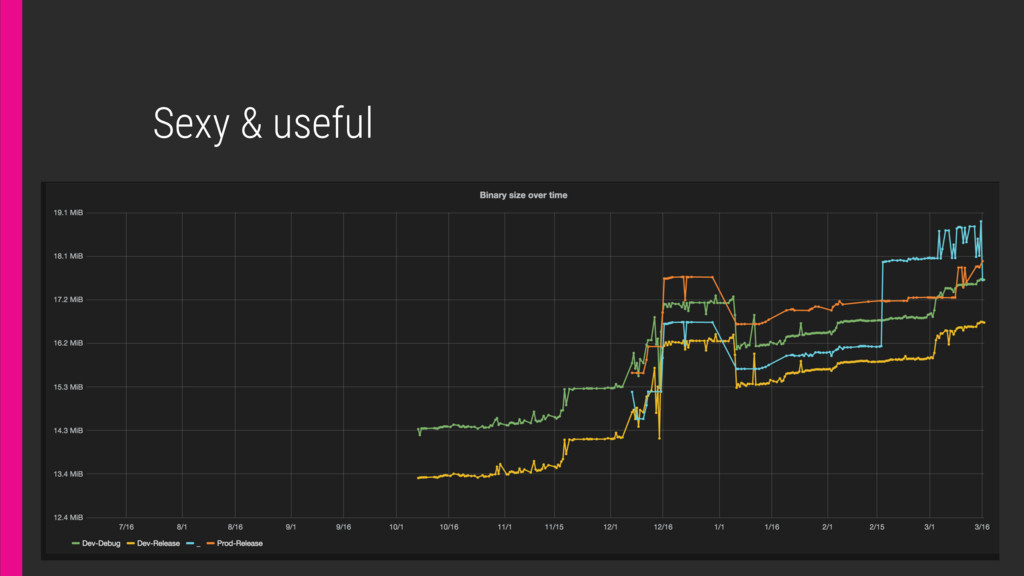
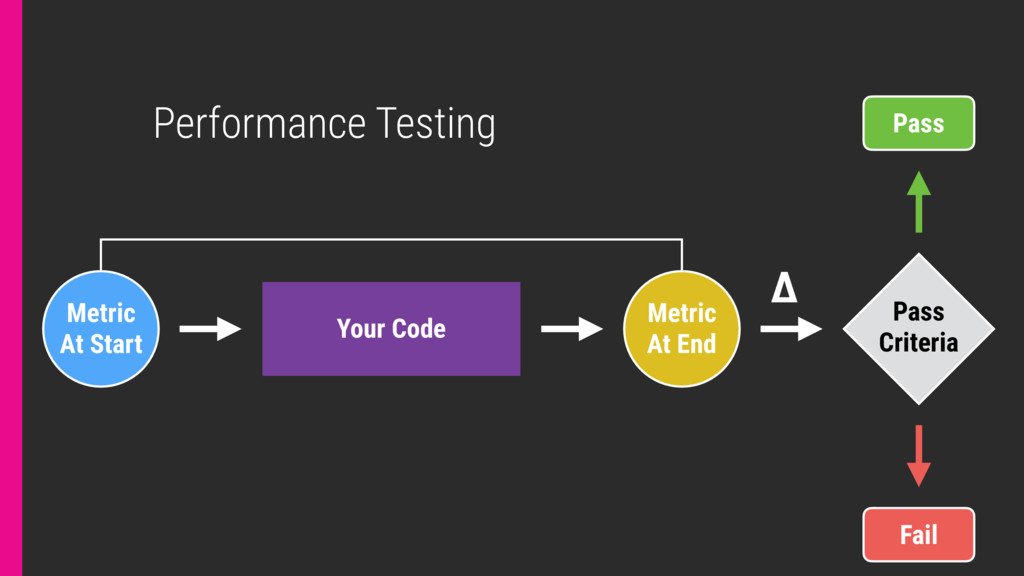
Performance is always a concern when working with resource constrained environments like Android. In addition to that, developers also have to deal with another limited resource: time. It is quite common that adding new features or fixing bugs is way more relevant than ensuring application works smoothly. Just measuring the performance of certain view takes a good amount of time, so why not automate it? At Lyft we found that gathering data with every continuous integration build would help us to not only detect regressions but also to ensure a smooth ride for all our users.

Conference: http://sf.droidcon.com/
Video: https://www.youtube.com/watch?v=cCuhUrmVpSo

Evelio Tarazona Cáceres

March 17, 2016
Tweet

More Decks by Evelio Tarazona Cáceres

Other Decks in Programming

Transcript

  1. 14 full time Android Engineers 80+ PRs 1000s of changes

    Millions of users Millions of rides
  2. Agenda • Building stuff at Lyft • Testing & Automation

    • #xyzmatters • Mo’ money mo’ problems • Auto profiling
  3. CI

  4. Automated builds & deployment Dev Per commit Dozens of us

    Alpha Nightly Hundreds Beta 2-3/week Thousands Prod Weekly Millions
  5. Testing Unit UI E2E 10% 15% 70% * or whatever

    % makes sense for you Maintenance Coverage Fragility Duration Cost 5%
  6. Other stuff • Common stuff like • Code review •

    Syncs & arch meetings • Pair programming • Refactor proposals • CI Enforced coverage, ownership, code styles, etc.
  7. Other stuff • Code review, syncs, arch meetings, pair programming,

    etc. • CI Enforced coverage, ownership, code styles, etc. • CI Static analysis & reporting
  8. Android Performance 101: CPU • Do not nest multi-pass layouts

    • Lazily compute complex data when needed • Cache heavy computational results for re-use • Consider RenderScript for performance • Keep work off of the main thread https://corner.squareup.com/2015/08/streamlining-android-apps-tech-talks.html
  9. Android Performance 101: Memory • Use object pools and caches

    to reduce churn • Be mindful of the overhead of enums • Do not allocate inside the draw path • Use specialized collections instead of JDK • Memory collections when appropriate (SparseArray) https://corner.squareup.com/2015/08/streamlining-android-apps-tech-talks.html
  10. Android Performance 101: I/O • Batch operations with reasonable back-off

    policies • Use gzip or binary serialization format • Cache data offline with TTLs for reloading • Use JobScheduler API to batch across OS https://corner.squareup.com/2015/08/streamlining-android-apps-tech-talks.html
  11. Android Performance 101: Other • JSON parsing only matters if

    you are streaming vs reading full response and then parsing • Shrink ALL the things! • Don’t do things you don’t need • Lint: use it • Watch out for 3rd party sdks e.g. analytics & ads • Dagger 2 Lazy & Producers https://corner.squareup.com/2015/08/streamlining-android-apps-tech-talks.html
  12. - Some wise dude We should forget about small efficiencies,

    say about 97% of the time: premature optimization is the root of all evil. Yet we should not pass up our opportunities in that critical 3% “
  13. #qualitymatters • Document yourself • Understand your code • Have

    your own opinions • Do it with purpose • There are always tradeoffs • Prioritize, what’s best for your business?
  14. Warning: Opinions • Multidex use it, but minifyEnabled true in

    prod • enum vs. IntDef: enums FTW! • Type safety, enforces well formed input for you • EnumSet instead of bitwise flags • EnumMap cause #perfmatters • Effective way of creating singletons • Small overhead when compared with dependencies & resources
  15. Real reasons why #perfmatters • Better user experience • 100ms

    = instant • 1 second = noticeable delay • 2+ seconds = what’s going on????!!!!!! • = • 100ms of latency costs Amazon 1% of profit.
  16. Lyft perf reasons • Delightful details • Launch time •

    Short sessions • Make it better • Make it faster
  17. Challenges • Observer effect • Measuring code overhead • Results

    variance • Thread scheduling & garbage collection • Device vs. emulator • Thermal throttling • Network
  18. Android Basic Profiling Toolbelt • Logs + Android Monitor on

    Android Studio • Rendering: Hierarchy Viewer, on device fps, overdraw, hardware layers, etc. • Memory: Memory Monitor, Heap Viewer, Allocation Tracker, MAT • Battery: Batterystats, Battery Historian • Computing: • Traceview • Systrace
  19. Android Profiling Toolbelt • dumpsys • Rendering: Hierarchy Viewer, gfxinfo:

    fps, overdraw, hardware layers, etc. • Memory: Memory Monitor, Heap Viewer, Allocation Tracker, MAT • Battery: Batterystats, Battery Historian • Computing: • Logs • Traceview • Systrace ✋ ✋
  20. Findings (Not many surprises here) • Wait on async bootstrap

    network call to complete • Busy main thread • Huge Bitmaps resources • Complex and nested XML layouts • Third party SDKs like Google Maps • Reflection based JSON parsing
  21. Fix

  22. Quick Fixes • Move required bootstrap network call as early

    as possible • Remove/lazy load tailored Bitmap resources • Simplify XML layouts/Flattening view hierarchy • Defer/parallelize third party SDKs initialization
  23. WIP/Future Fixes • Decomposition • HTTP2 • Caching • Better

    JSON parsing e.g. TypeAdapters • Binary protocol: protobuf, capnproto, flatbuffers, etc. • Less stuff in the main thread • Scoop migration (Scoped down dependencies)
  24. 14 full time Android Engineers 80+ PRs 1000s of changes

    Millions of users Millions of rides
  25. Analytics • Some manual work and code • SpaningEvents •

    Initiation time, end time, delta • Network calls, app launch time, etc. • Device status
  26. Pre-Analytics, thanks archive! ➜ aws s3 ls --recursive s3://lyft-client-ci/android/ |

    sort -k1 -n | sed 's/ / /g' > /tmp/apks-sorted.txt ➜ ./plotapksize > apksize.png
  27. plotapksize script 1. #!/usr/local/bin/gnuplot 2. reset 3. set term png

    size 2400,1200 4. set xdata time 5. set timefmt "%Y-%m-%d %H:%M:%S" 6. set format x "%Y-%m" 7. set xlabel "date" 8. set ylabel "size in bytes" 9. set title "APK size over time" 10. set key reverse Left outside 11. set grid 12. set style data linespoints 13. plot "apks-sorted.txt" using 1:($3 == 0 ? NaN : $3) title "size"
  28. Comercial tools • Google Cloud Test Lab • Enerlytics Essert

    (Battery + CI) • Nimbledroid (Droidcon) • Monkop (not at Droidcon)
  29. Too easy? Roll your own • Custom ROM/Instrumentation • Annotation

    processor + AspectJ • Analytics • Systrace Trace calls • Method tracing • adb commands ➜ adb logcat | grep 'ActivityManager: Displayed' … ActivityManager: Displayed me.lyft.android.dev/.ui.MainActivity: +2s217ms ➜ adb screenrecord • gfxinfo • dumpsys
  30. Lyft’s • Appium & Espresso tests • Start/stop systrace and

    other collection tools at test init/end • Store them in S3 • Generate reports • and most importantly…
  31. Takeaways • Define your process and streamline it • #perfmatters

    but #qualitymatters too • Understand your code • There is always a tradeoff, balance it out. • Testing: Do it. • Automation: Do it. ✅