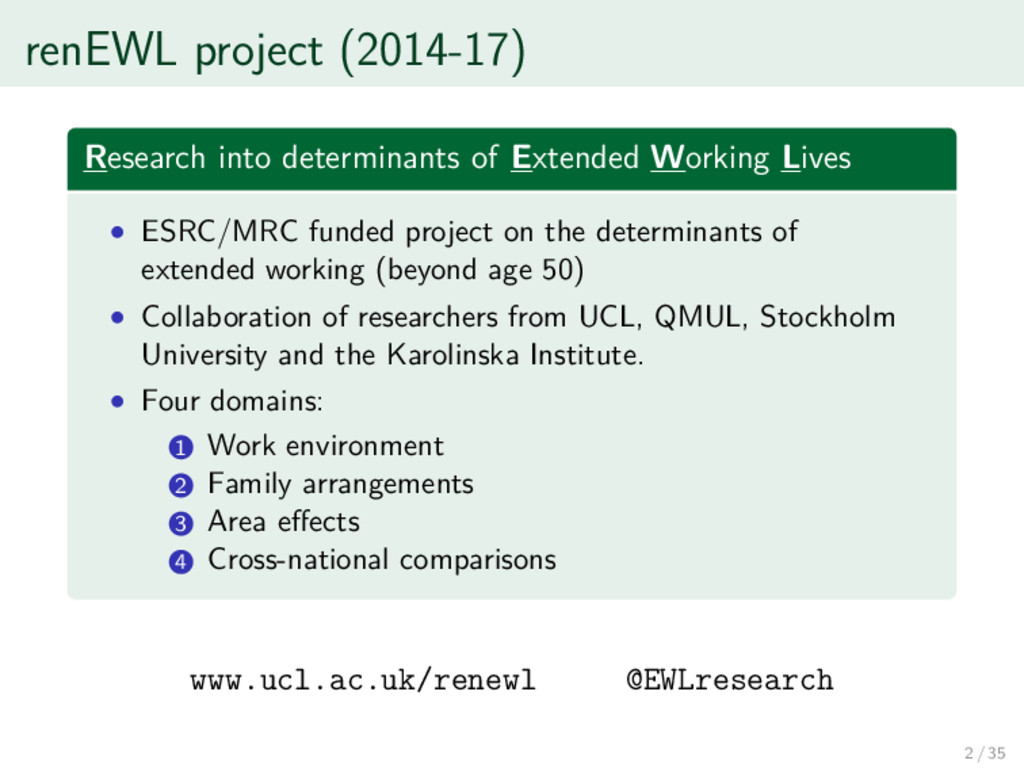
• ESRC/MRC funded project on the determinants of extended working (beyond age 50) • Collaboration of researchers from UCL, QMUL, Stockholm University and the Karolinska Institute. • Four domains: 1 Work environment 2 Family arrangements 3 Area effects 4 Cross-national comparisons www.ucl.ac.uk/renewl @EWLresearch 2 / 35
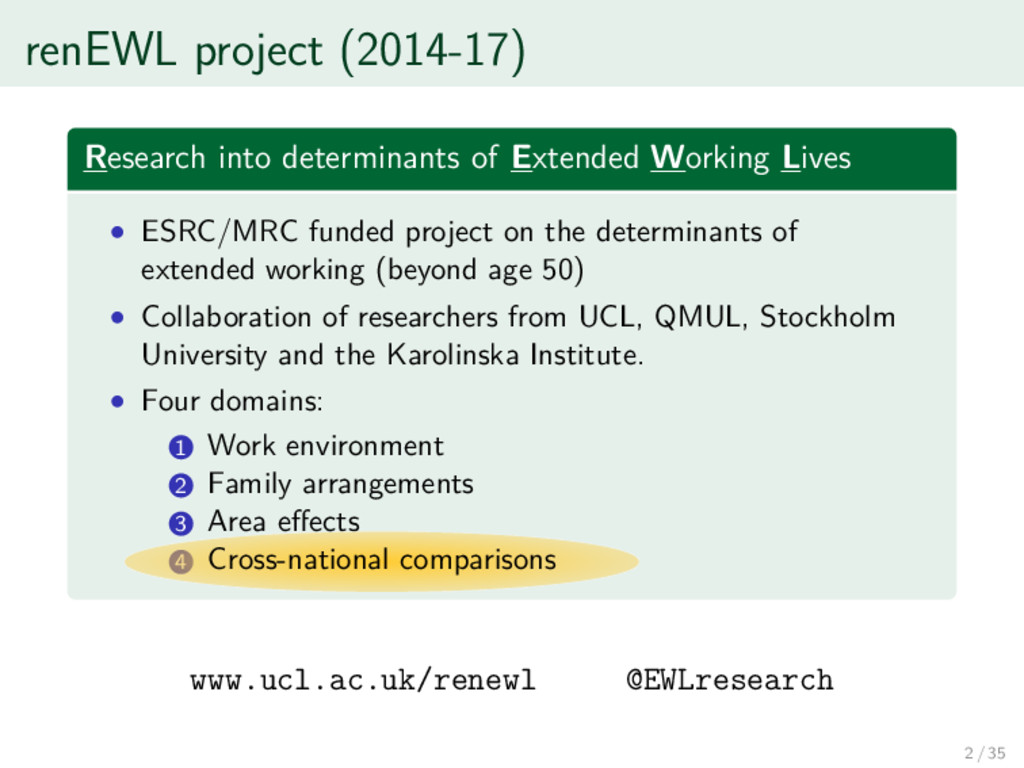
• ESRC/MRC funded project on the determinants of extended working (beyond age 50) • Collaboration of researchers from UCL, QMUL, Stockholm University and the Karolinska Institute. • Four domains: 1 Work environment 2 Family arrangements 3 Area effects 4 Cross-national comparisons Cross-national comparisons www.ucl.ac.uk/renewl @EWLresearch Cross-national comparisons 2 / 35
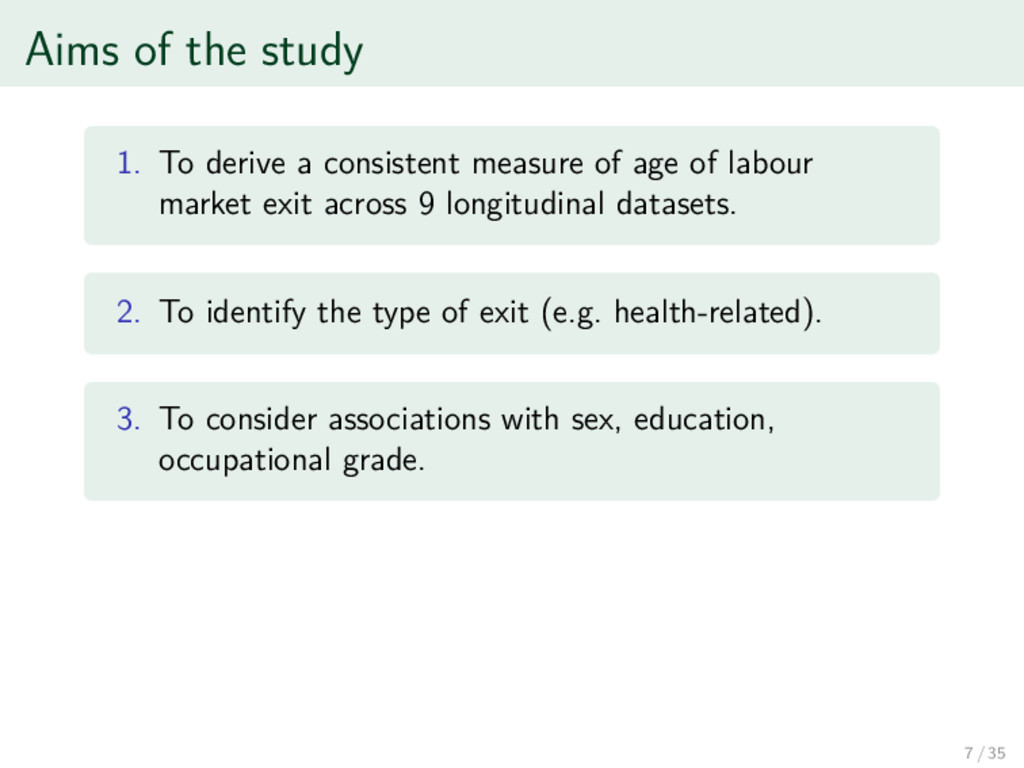
of age of labour market exit across 9 longitudinal datasets. 2. To identify the type of exit (e.g. health-related). 3. To consider associations with sex, education, occupational grade. 7 / 35
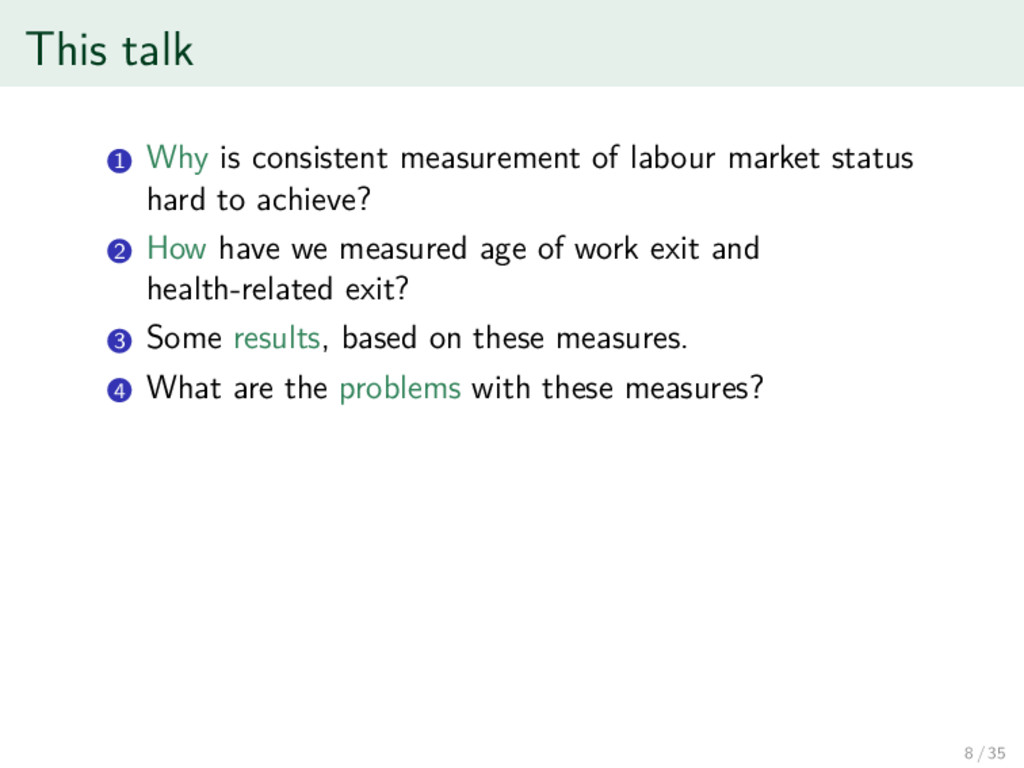
status hard to achieve? 2 How have we measured age of work exit and health-related exit? 3 Some results, based on these measures. 4 What are the problems with these measures? 8 / 35
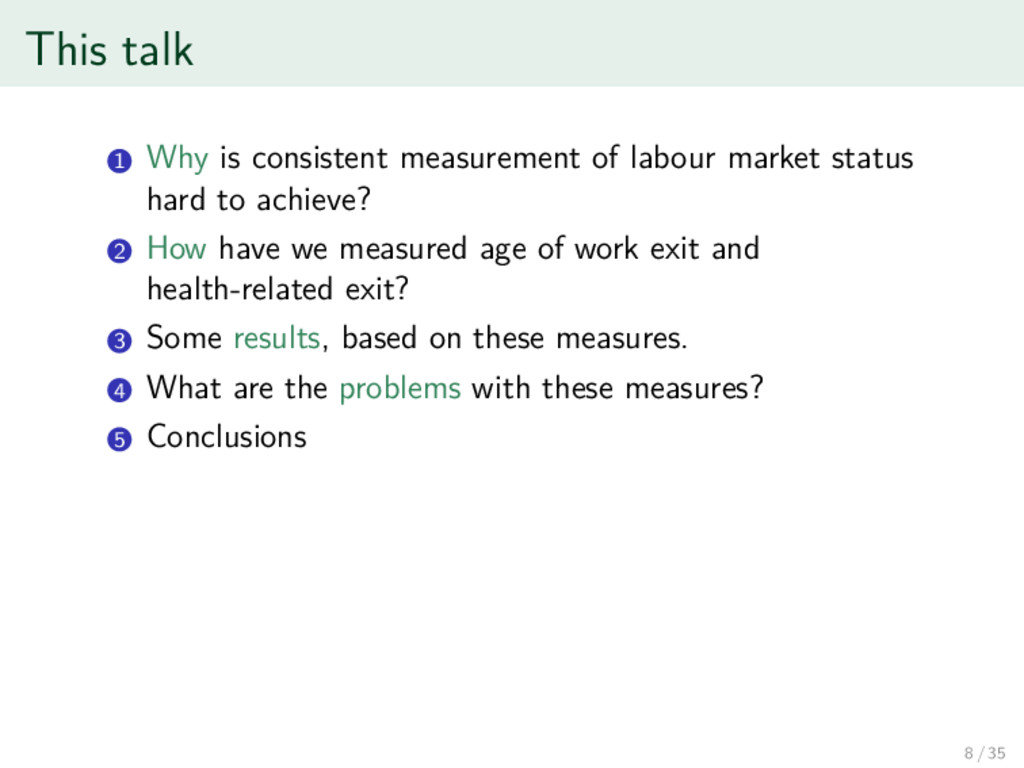
status hard to achieve? 2 How have we measured age of work exit and health-related exit? 3 Some results, based on these measures. 4 What are the problems with these measures? 5 Conclusions 8 / 35
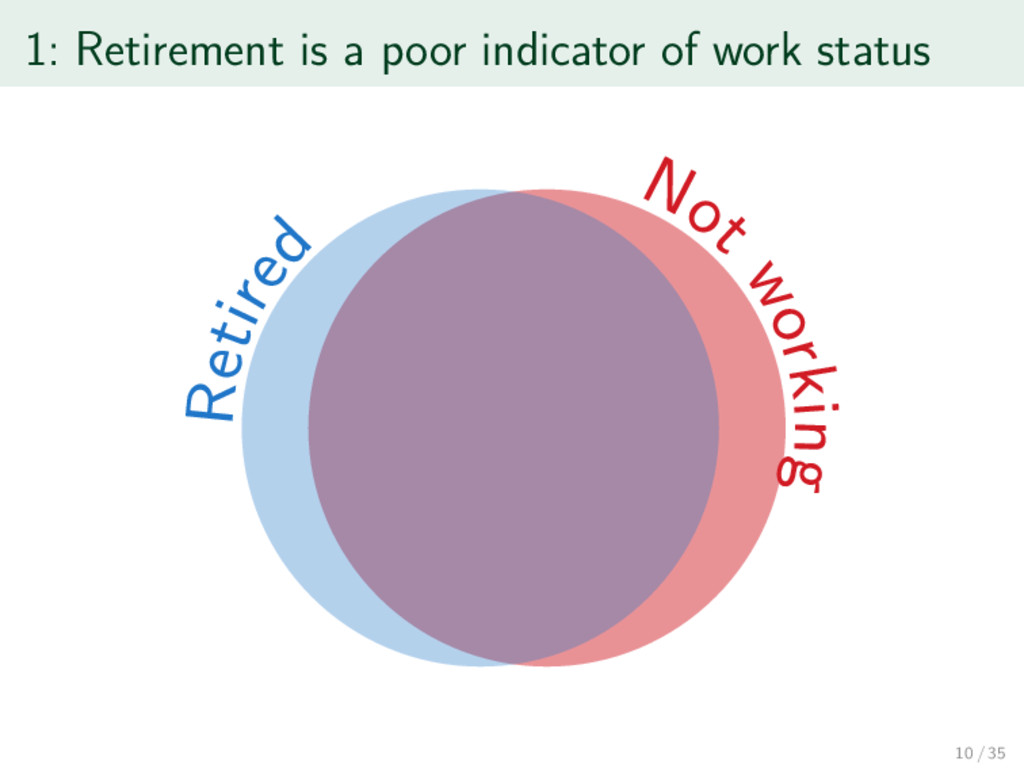
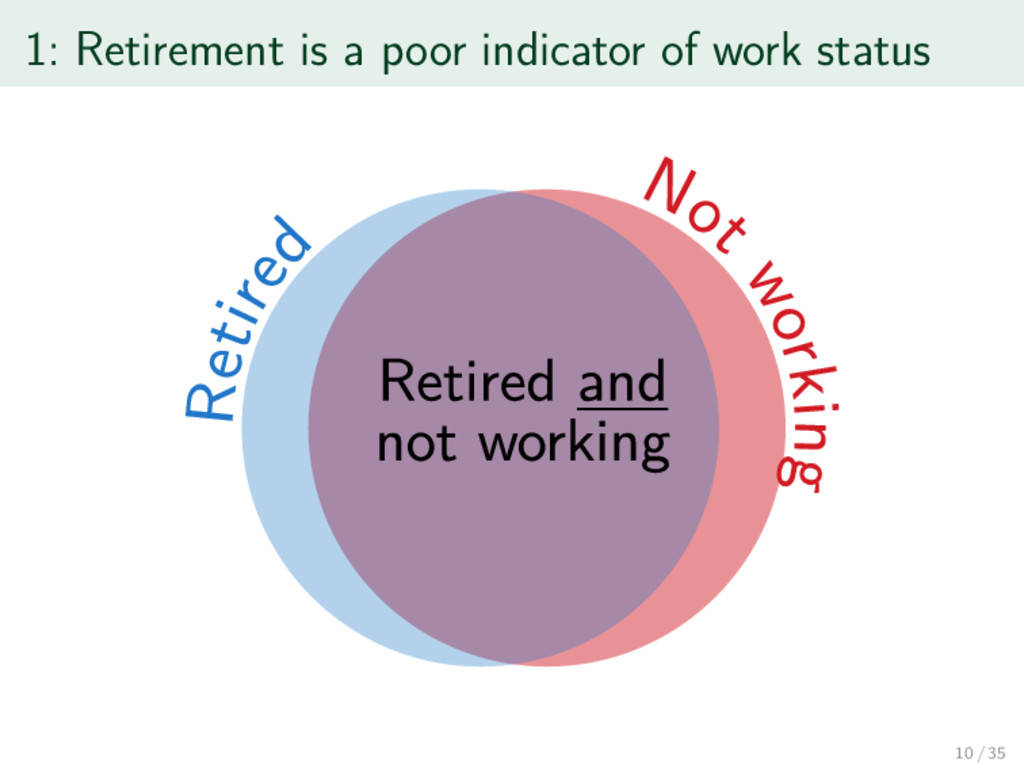
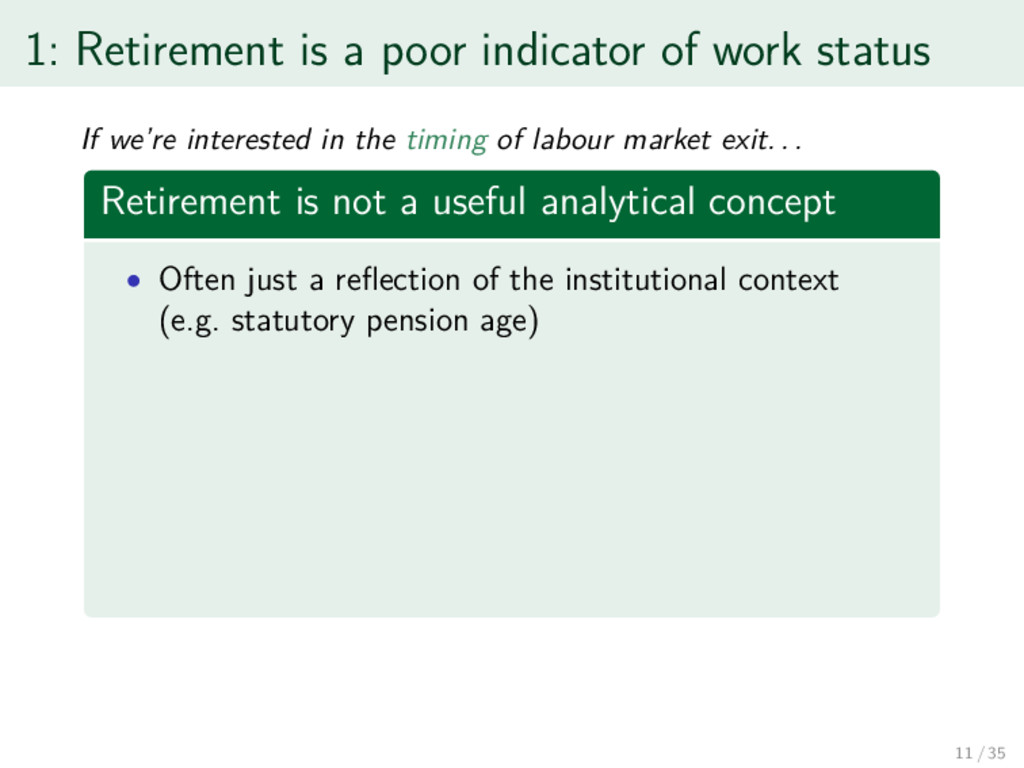
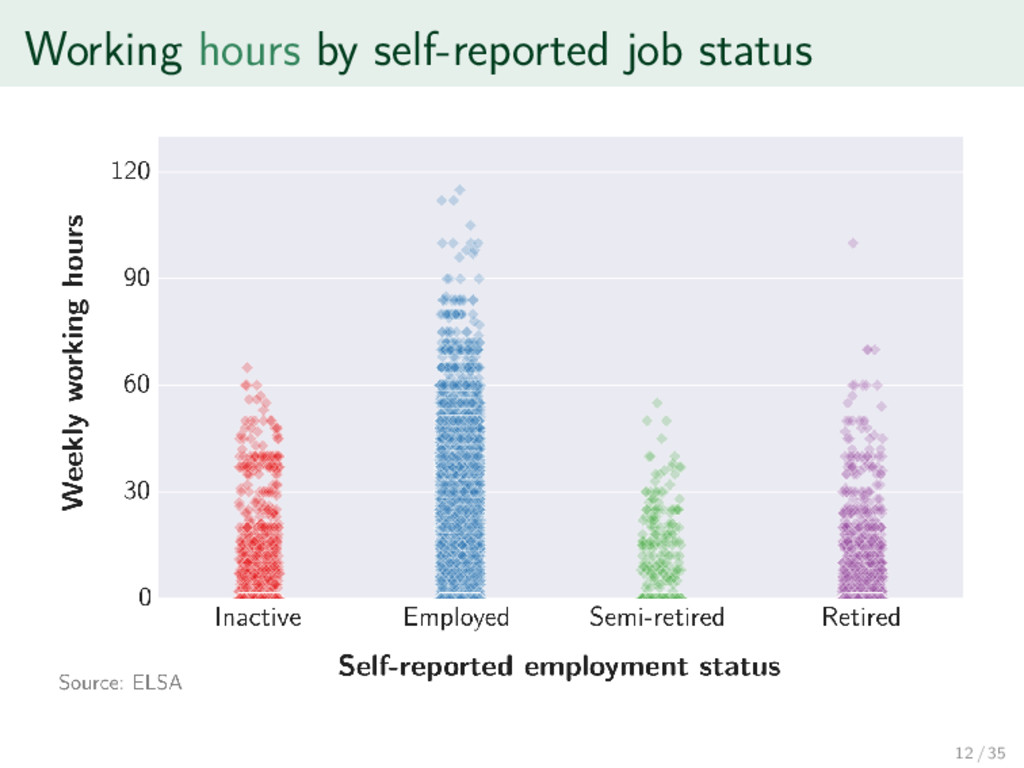
we’re interested in the timing of labour market exit. . . Retirement is not a useful analytical concept • Often just a reflection of the institutional context (e.g. statutory pension age) 11 / 35
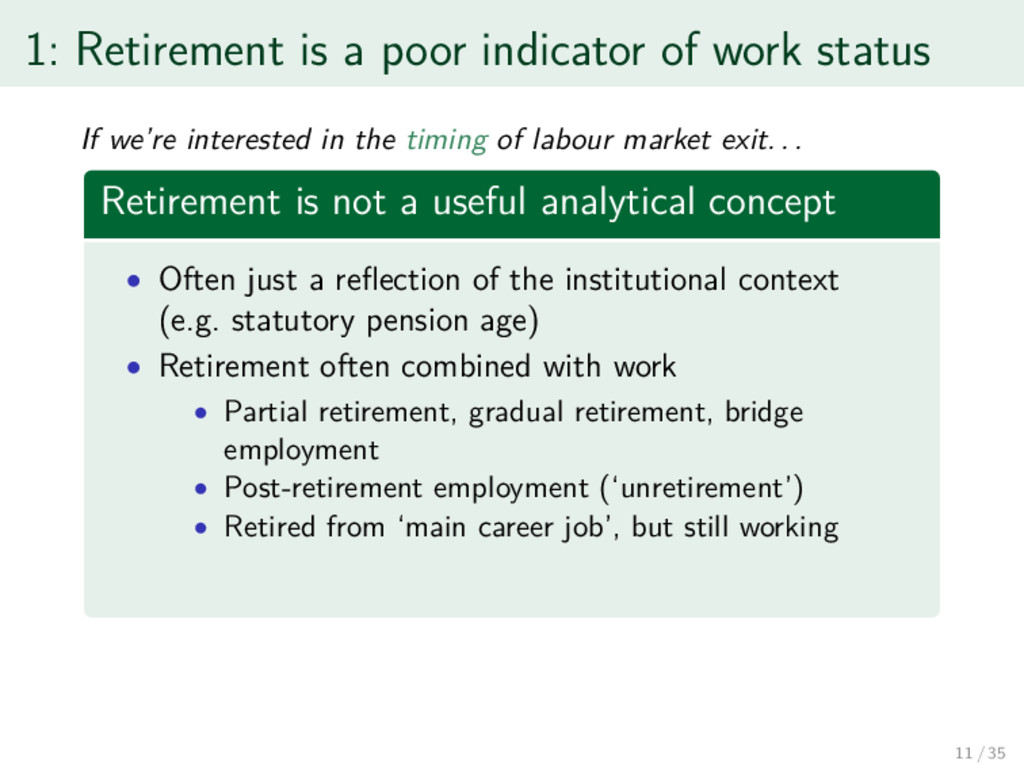
we’re interested in the timing of labour market exit. . . Retirement is not a useful analytical concept • Often just a reflection of the institutional context (e.g. statutory pension age) • Retirement often combined with work • Partial retirement, gradual retirement, bridge employment • Post-retirement employment (‘unretirement’) • Retired from ‘main career job’, but still working 11 / 35
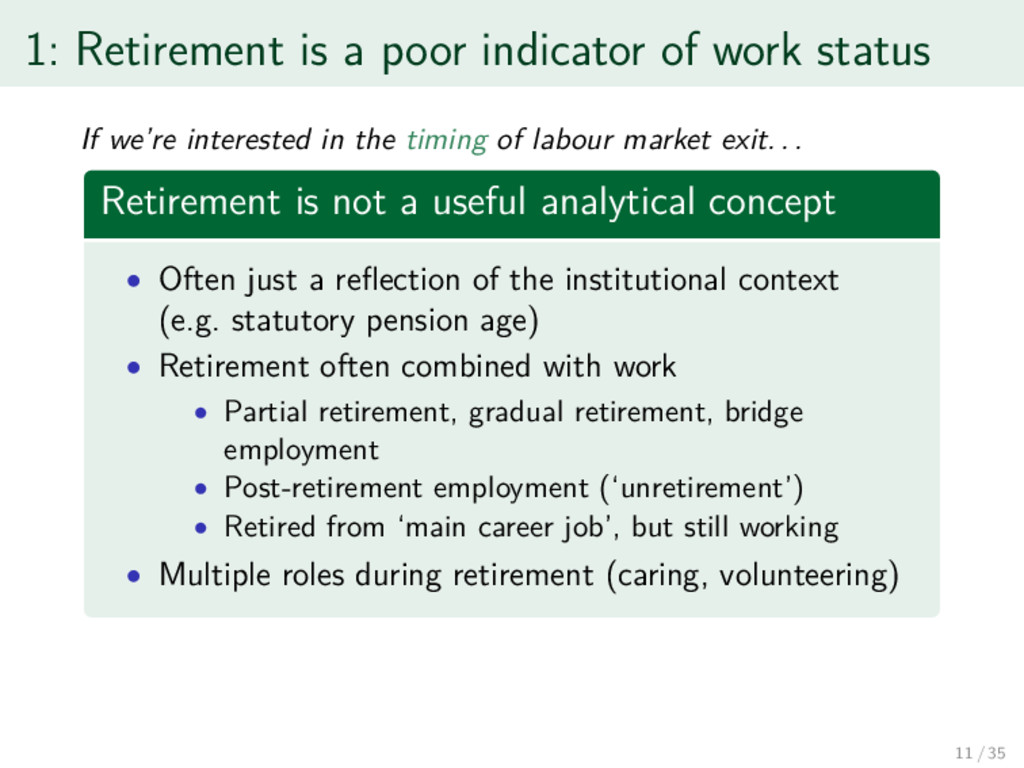
we’re interested in the timing of labour market exit. . . Retirement is not a useful analytical concept • Often just a reflection of the institutional context (e.g. statutory pension age) • Retirement often combined with work • Partial retirement, gradual retirement, bridge employment • Post-retirement employment (‘unretirement’) • Retired from ‘main career job’, but still working • Multiple roles during retirement (caring, volunteering) 11 / 35
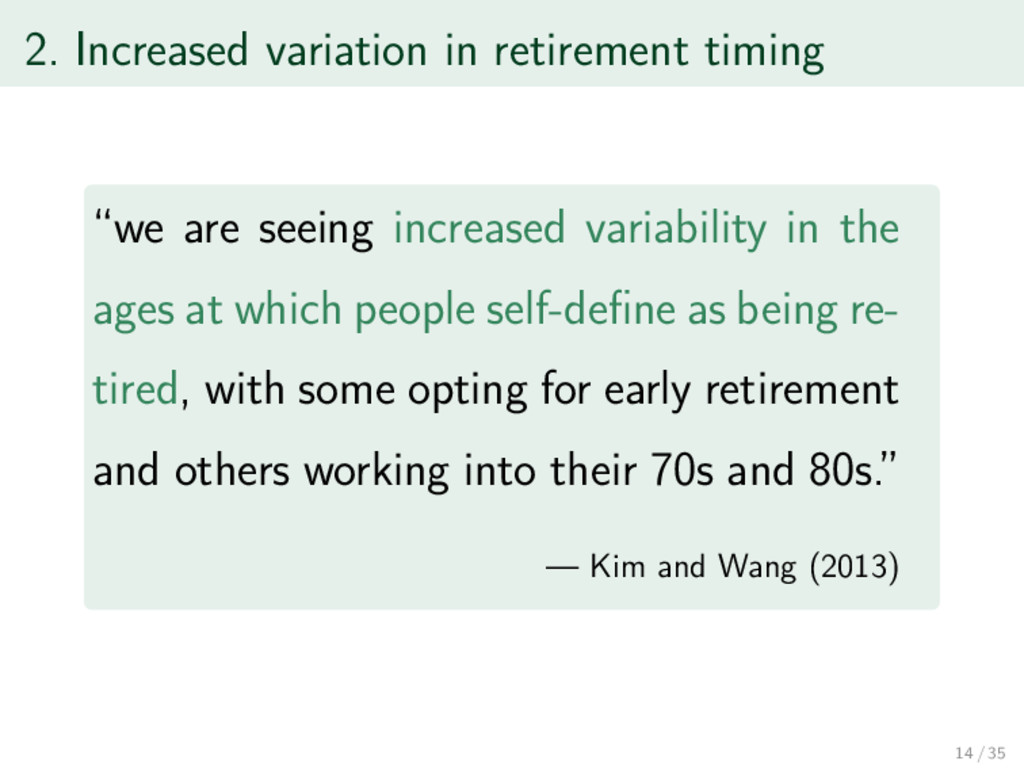
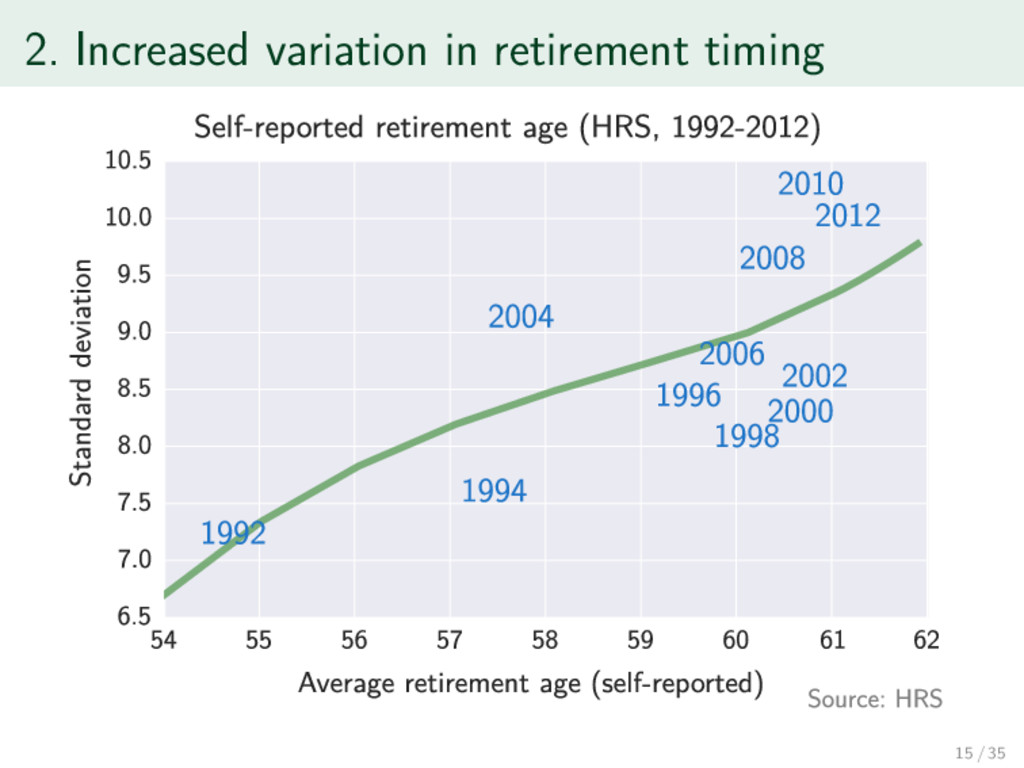
variability in the ages at which people self-define as being re- tired, with some opting for early retirement and others working into their 70s and 80s.” — Kim and Wang (2013) 14 / 35
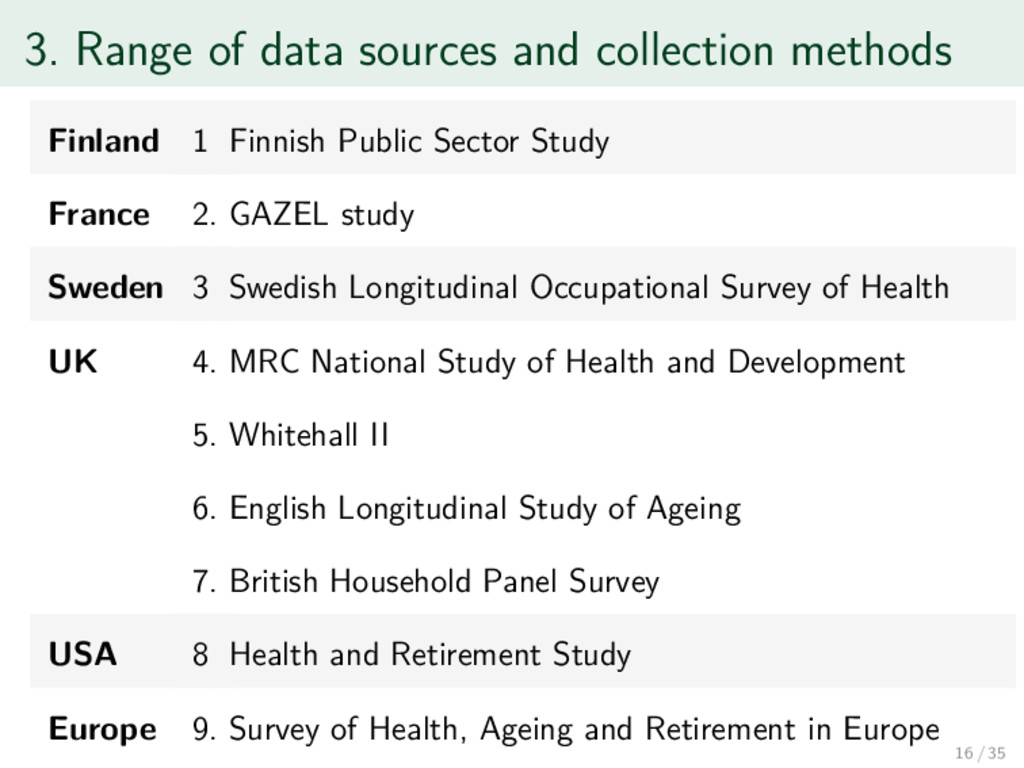
Finnish Public Sector Study France 2. GAZEL study Sweden 3. Swedish Longitudinal Occupational Survey of Health UK 4. MRC National Study of Health and Development 5. Whitehall II 6. English Longitudinal Study of Ageing 7. British Household Panel Survey USA 8. Health and Retirement Study Europe 9. Survey of Health, Ageing and Retirement in Europe 16 / 35
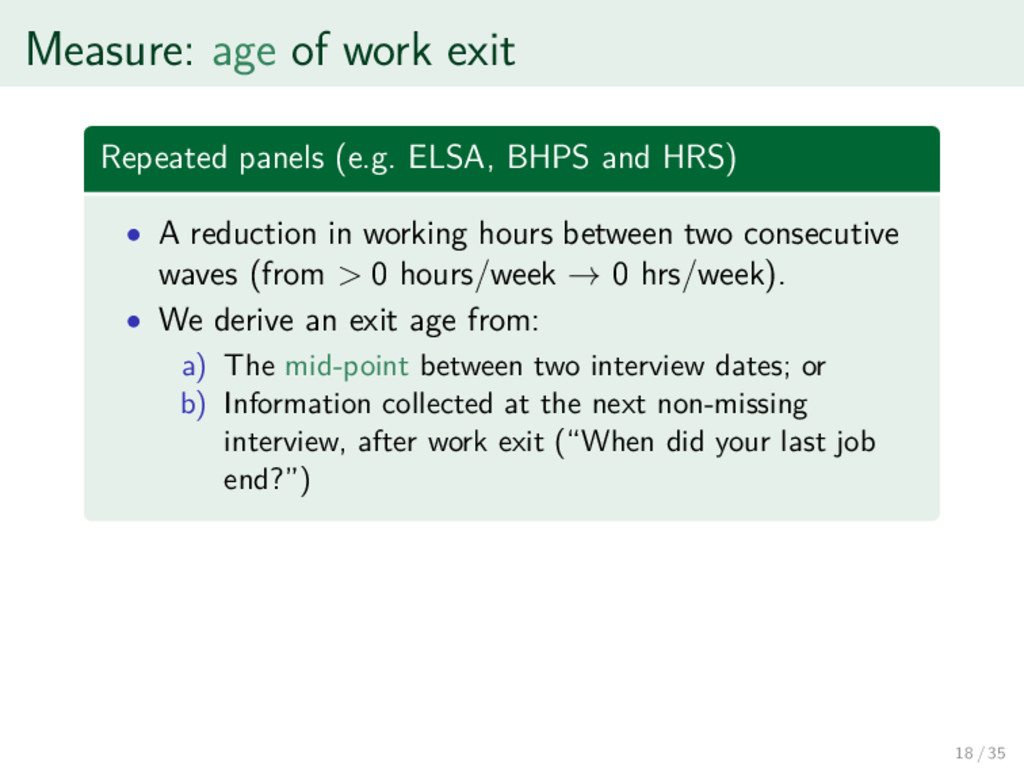
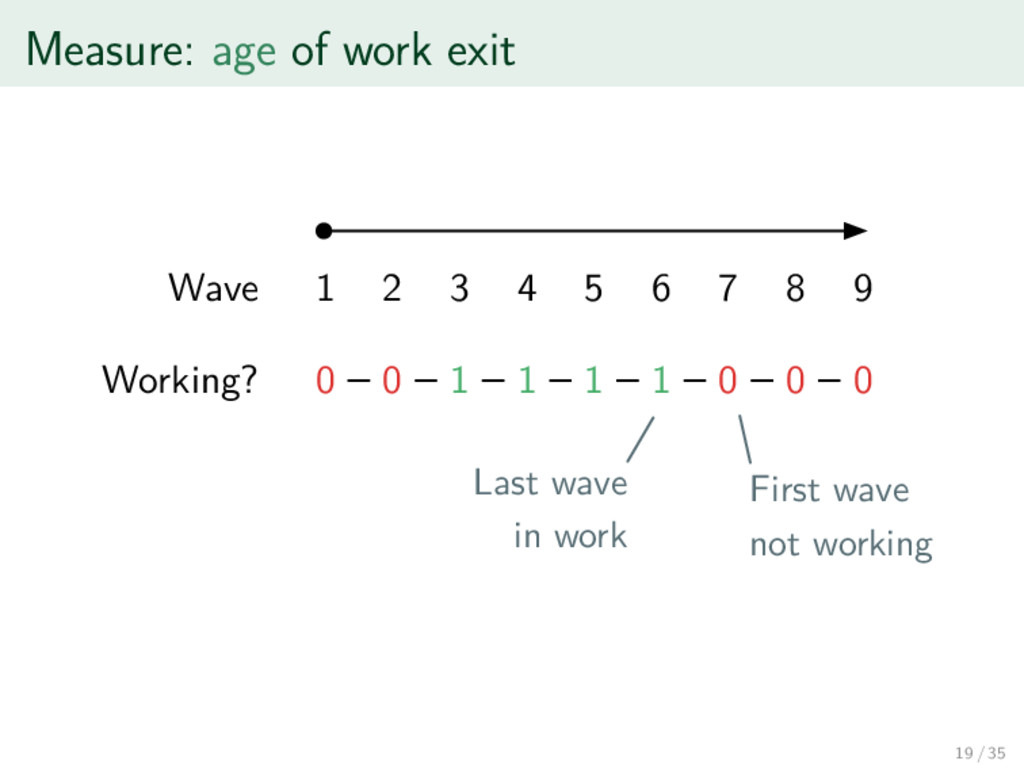
and HRS) • A reduction in working hours between two consecutive waves (from > 0 hours/week → 0 hrs/week). • We derive an exit age from: a) The mid-point between two interview dates; or b) Information collected at the next non-missing interview, after work exit (“When did your last job end?”) 18 / 35
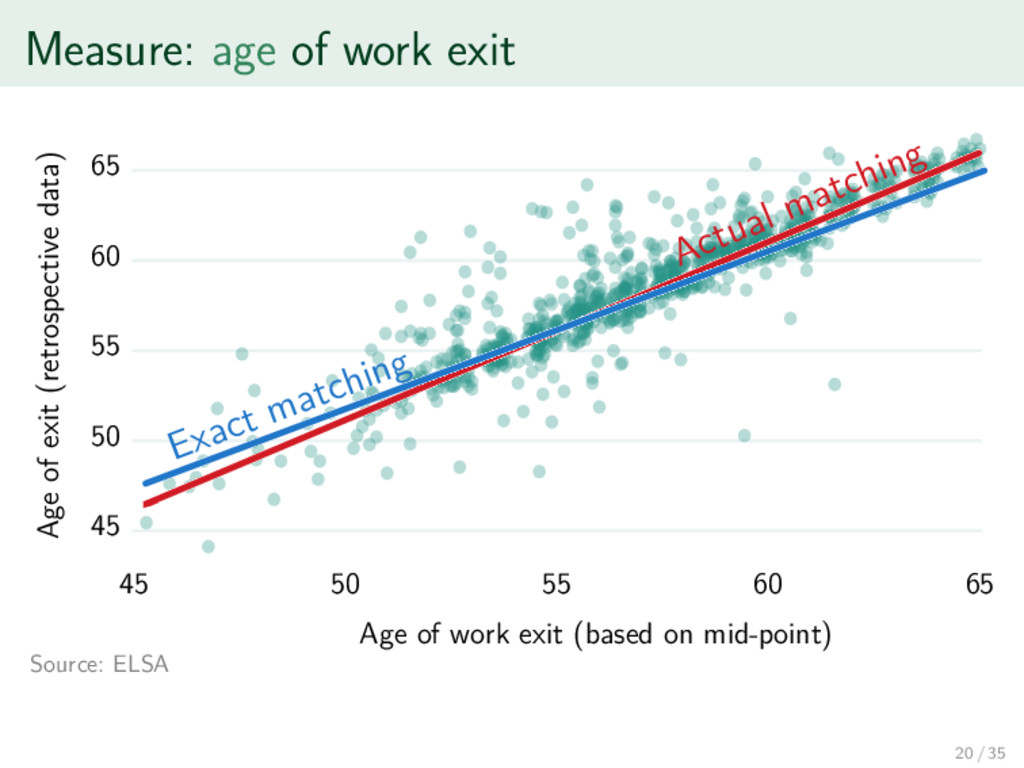
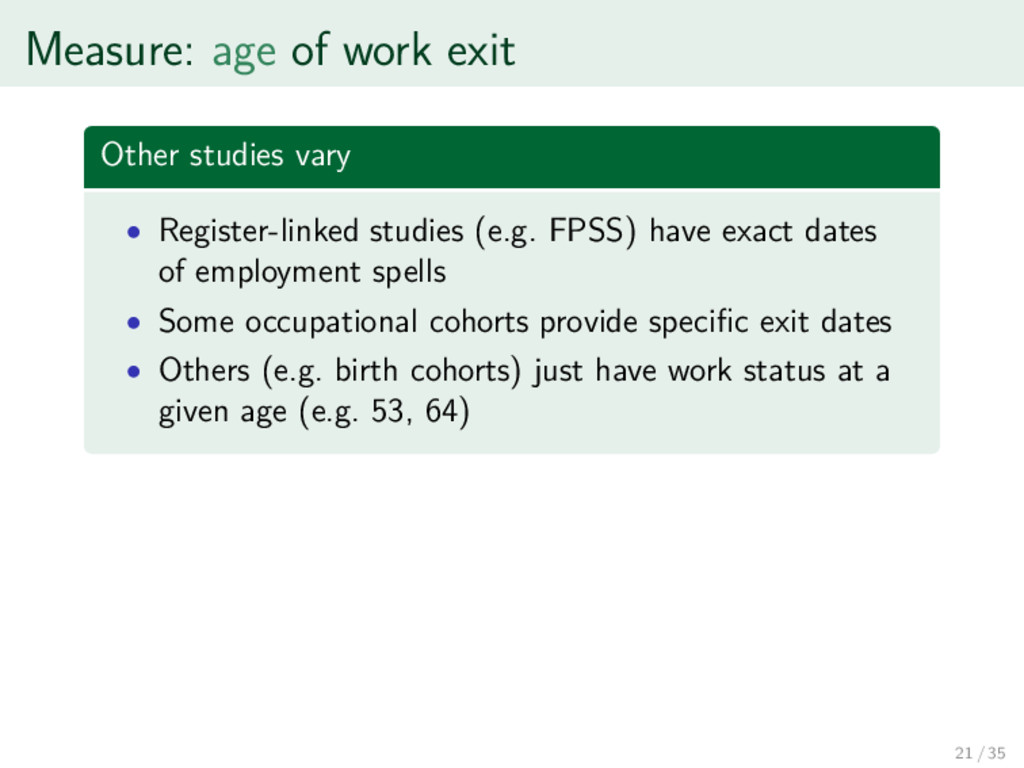
studies (e.g. FPSS) have exact dates of employment spells • Some occupational cohorts provide specific exit dates • Others (e.g. birth cohorts) just have work status at a given age (e.g. 53, 64) 21 / 35
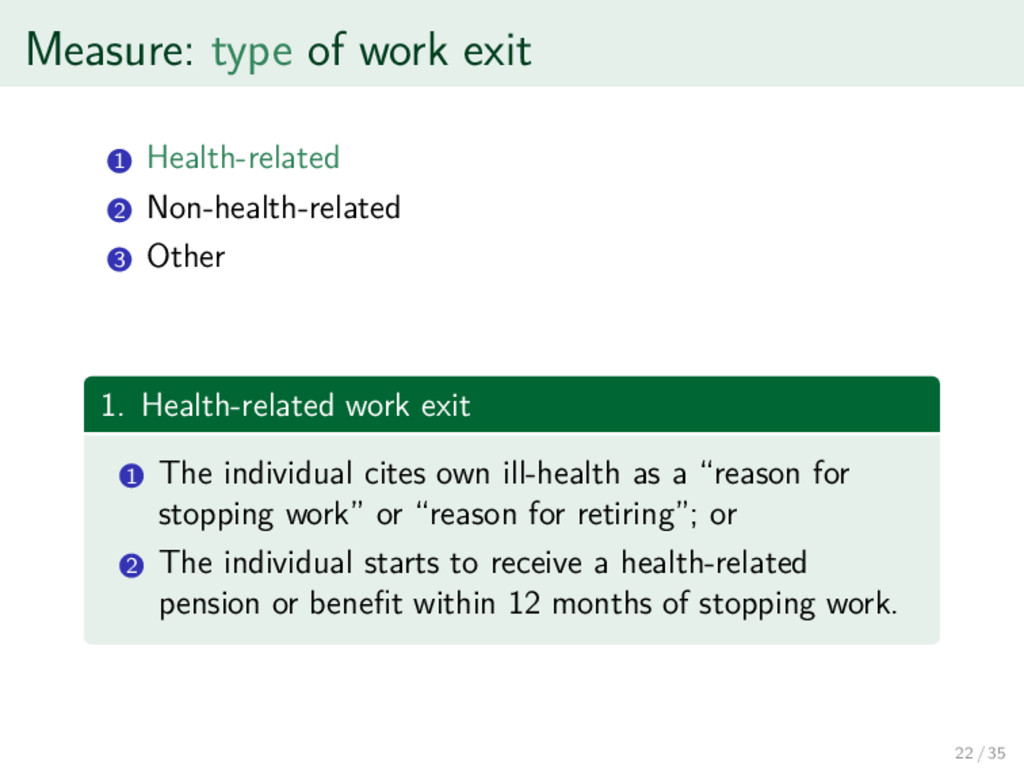
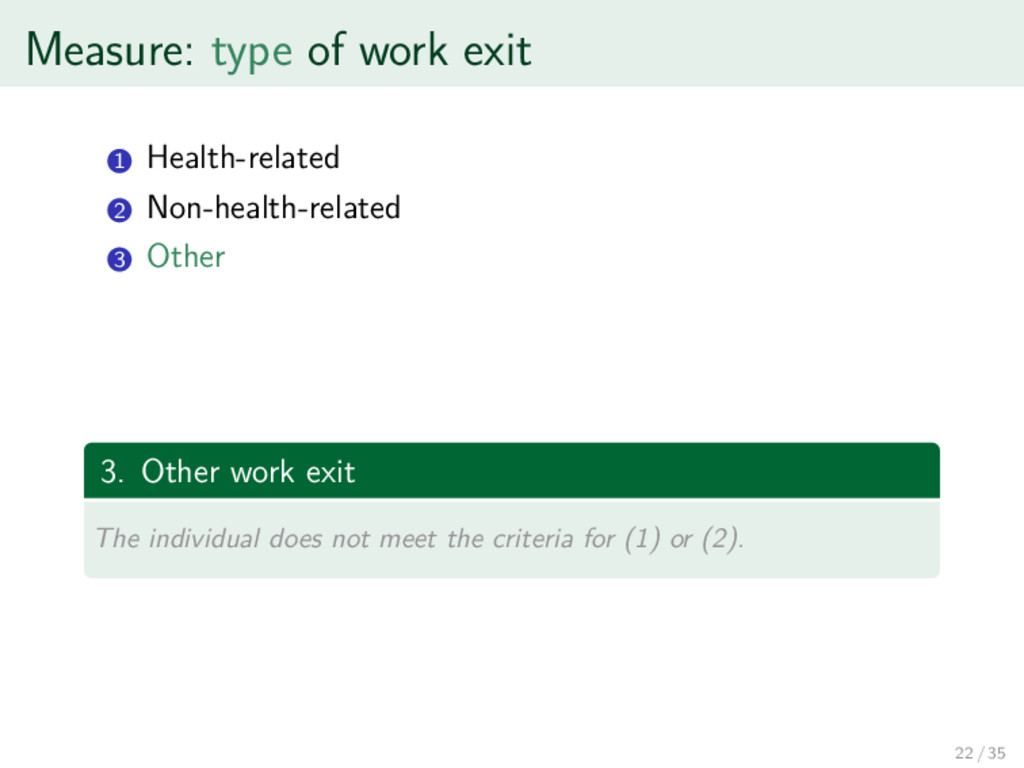
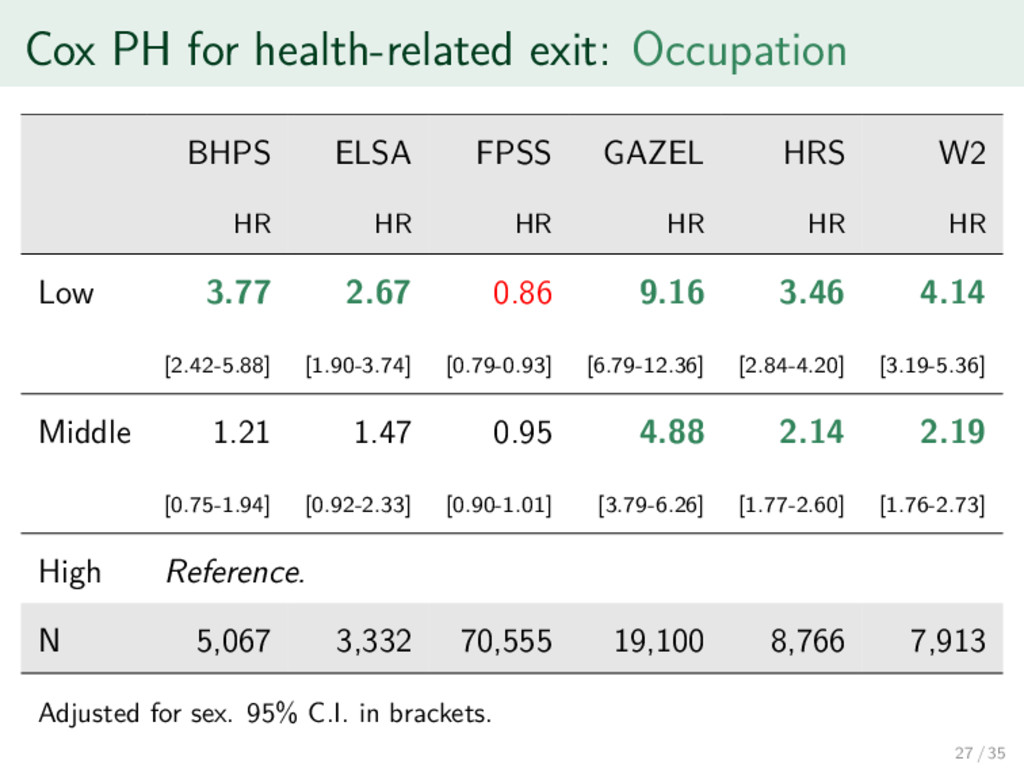
Other 1. Health-related work exit 1 The individual cites own ill-health as a “reason for stopping work” or “reason for retiring”; or 2 The individual starts to receive a health-related pension or benefit within 12 months of stopping work. 22 / 35
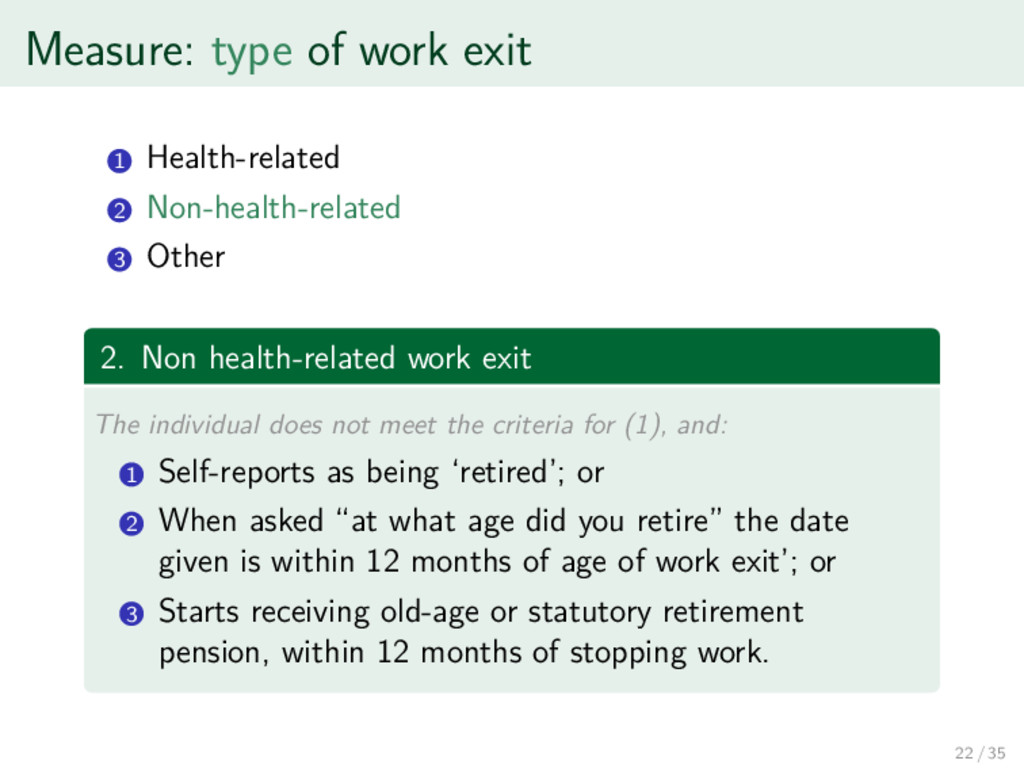
Other 2. Non health-related work exit The individual does not meet the criteria for (1), and: 1 Self-reports as being ‘retired’; or 2 When asked “at what age did you retire” the date given is within 12 months of age of work exit’; or 3 Starts receiving old-age or statutory retirement pension, within 12 months of stopping work. 22 / 35
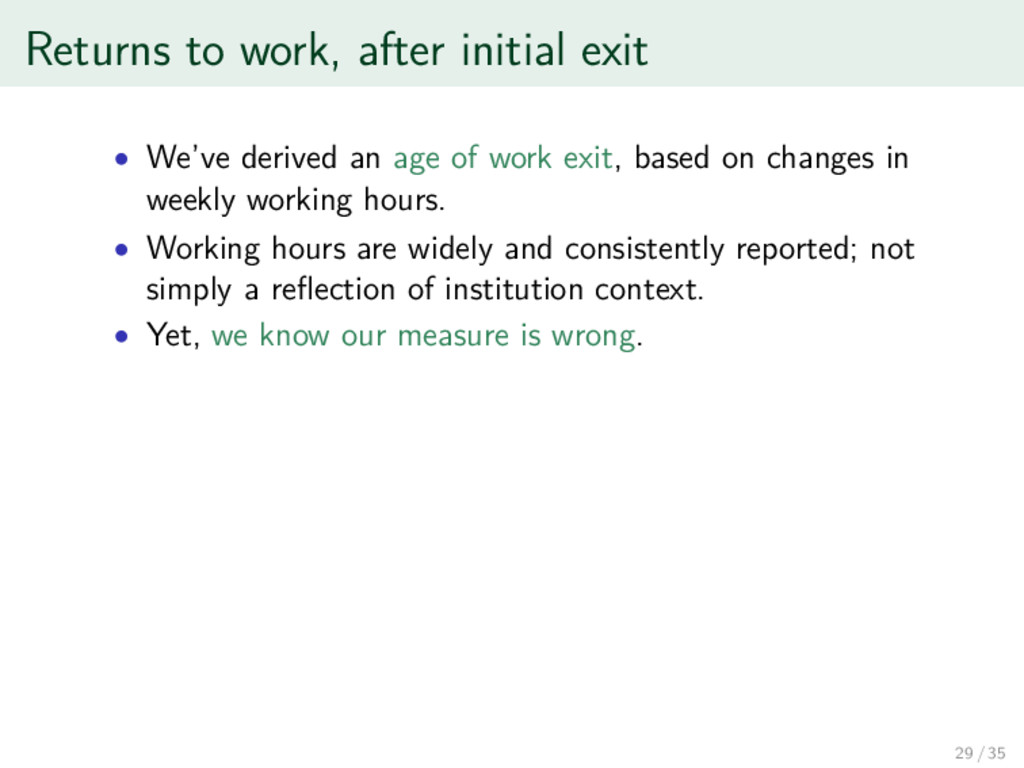
age of work exit, based on changes in weekly working hours. • Working hours are widely and consistently reported; not simply a reflection of institution context. 29 / 35
age of work exit, based on changes in weekly working hours. • Working hours are widely and consistently reported; not simply a reflection of institution context. • Yet, we know our measure is wrong. 29 / 35
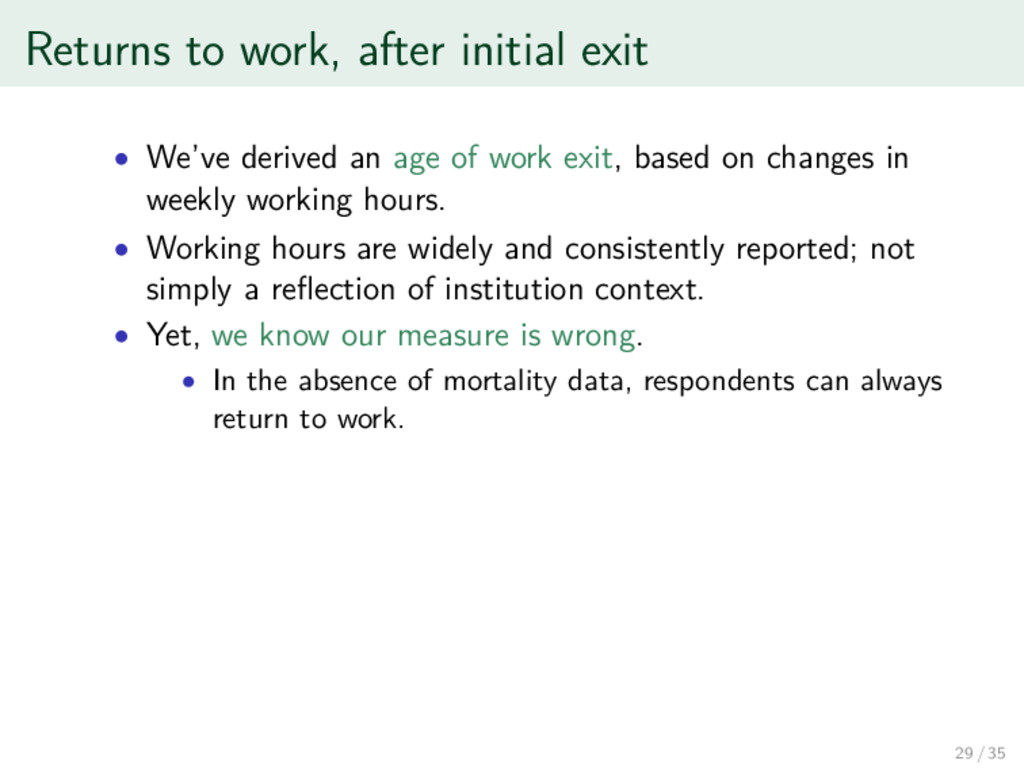
age of work exit, based on changes in weekly working hours. • Working hours are widely and consistently reported; not simply a reflection of institution context. • Yet, we know our measure is wrong. • In the absence of mortality data, respondents can always return to work. 29 / 35
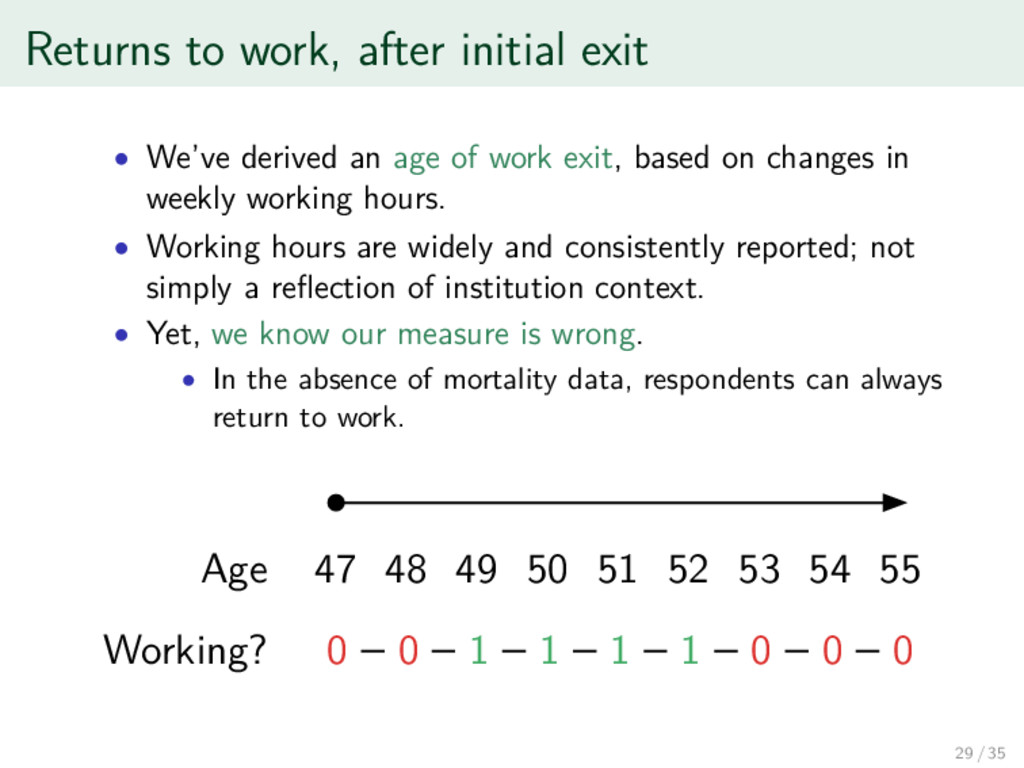
age of work exit, based on changes in weekly working hours. • Working hours are widely and consistently reported; not simply a reflection of institution context. • Yet, we know our measure is wrong. • In the absence of mortality data, respondents can always return to work. 0 0 1 1 1 1 0 0 0 Working? 47 48 49 50 51 52 53 54 55 Age 29 / 35
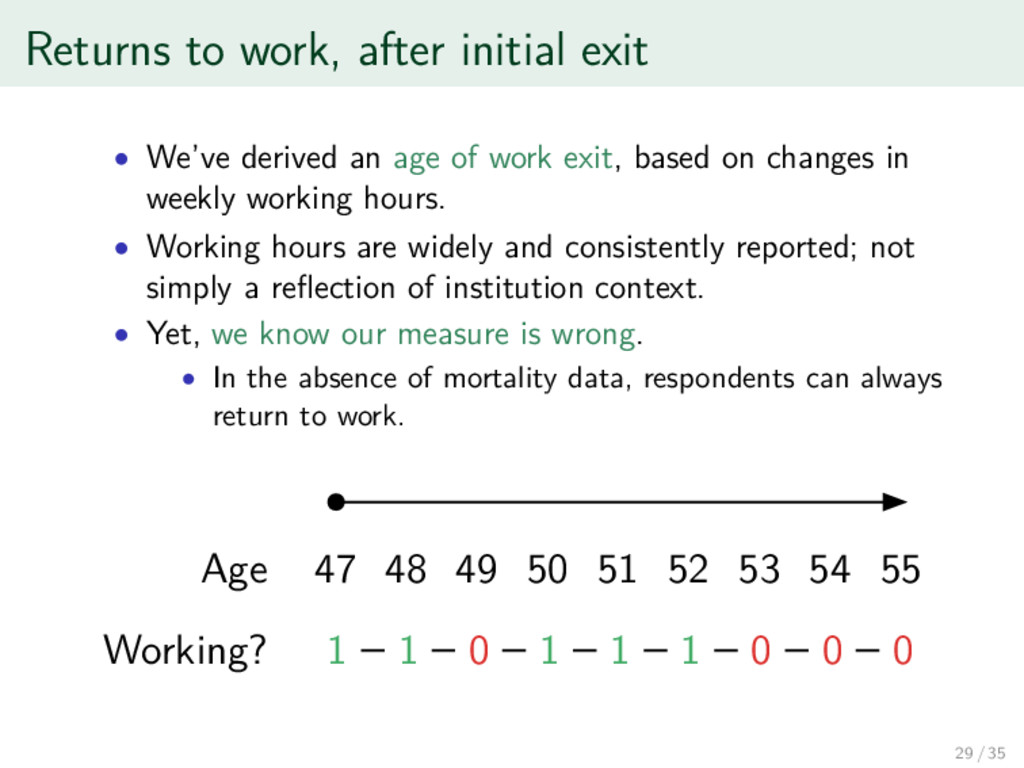
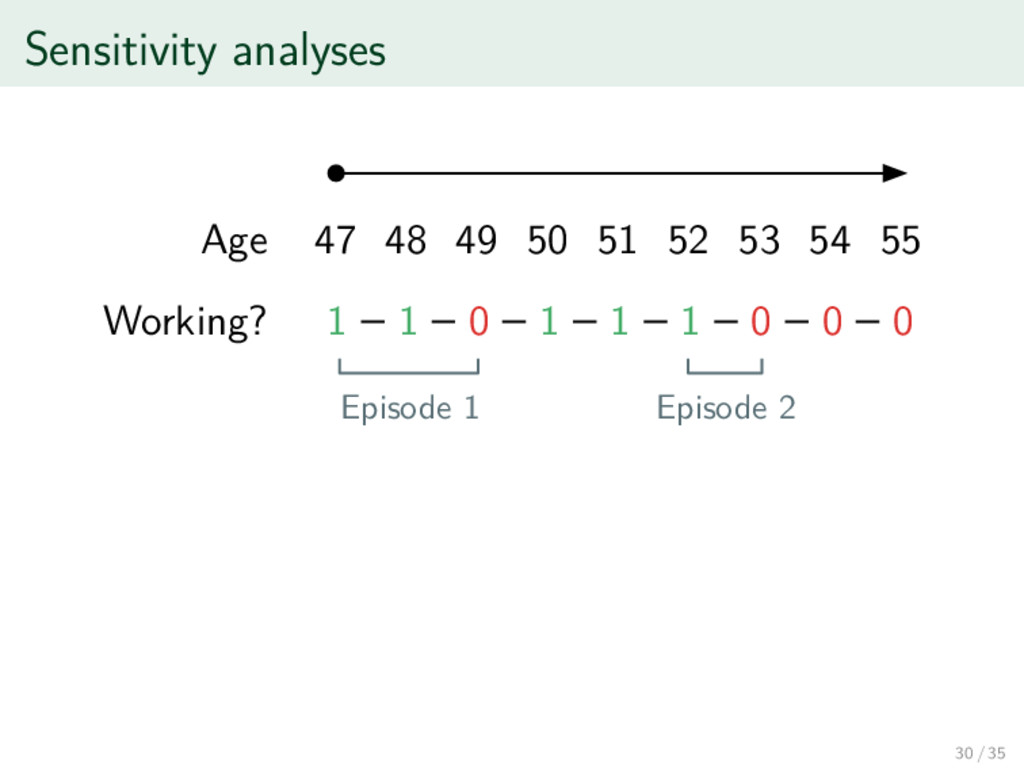
age of work exit, based on changes in weekly working hours. • Working hours are widely and consistently reported; not simply a reflection of institution context. • Yet, we know our measure is wrong. • In the absence of mortality data, respondents can always return to work. 1 1 0 1 1 1 0 0 0 Working? 47 48 49 50 51 52 53 54 55 Age 29 / 35
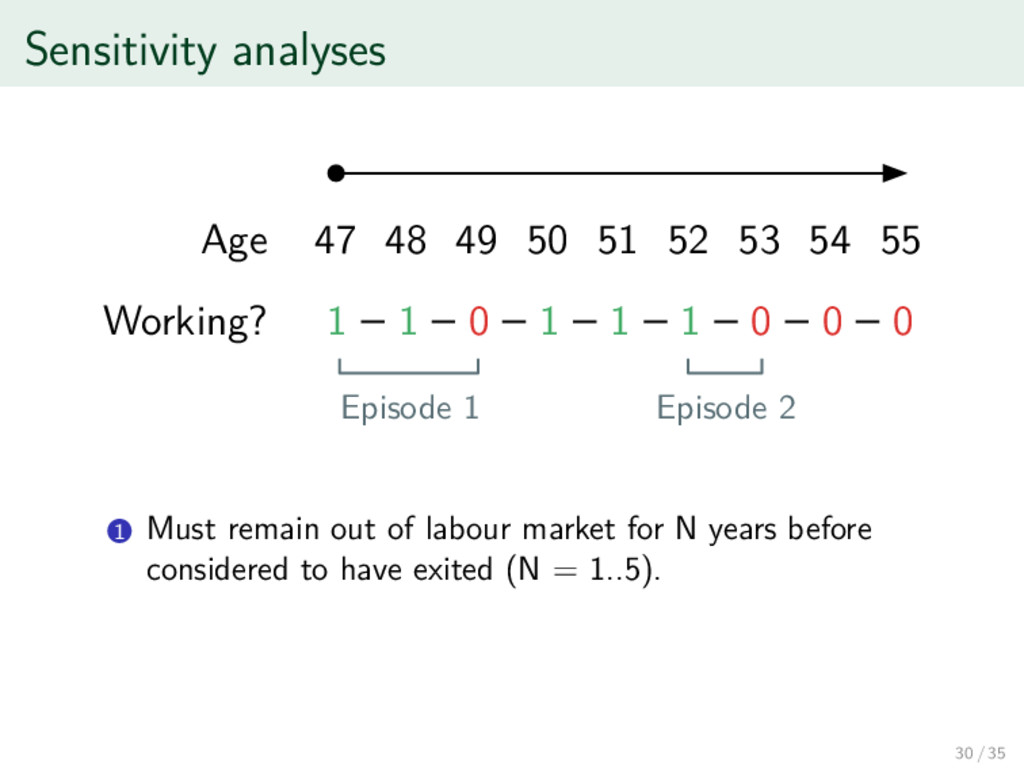
0 Working? Episode 1 Episode 2 47 48 49 50 51 52 53 54 55 Age 1 Must remain out of labour market for N years before considered to have exited (N = 1..5). 30 / 35
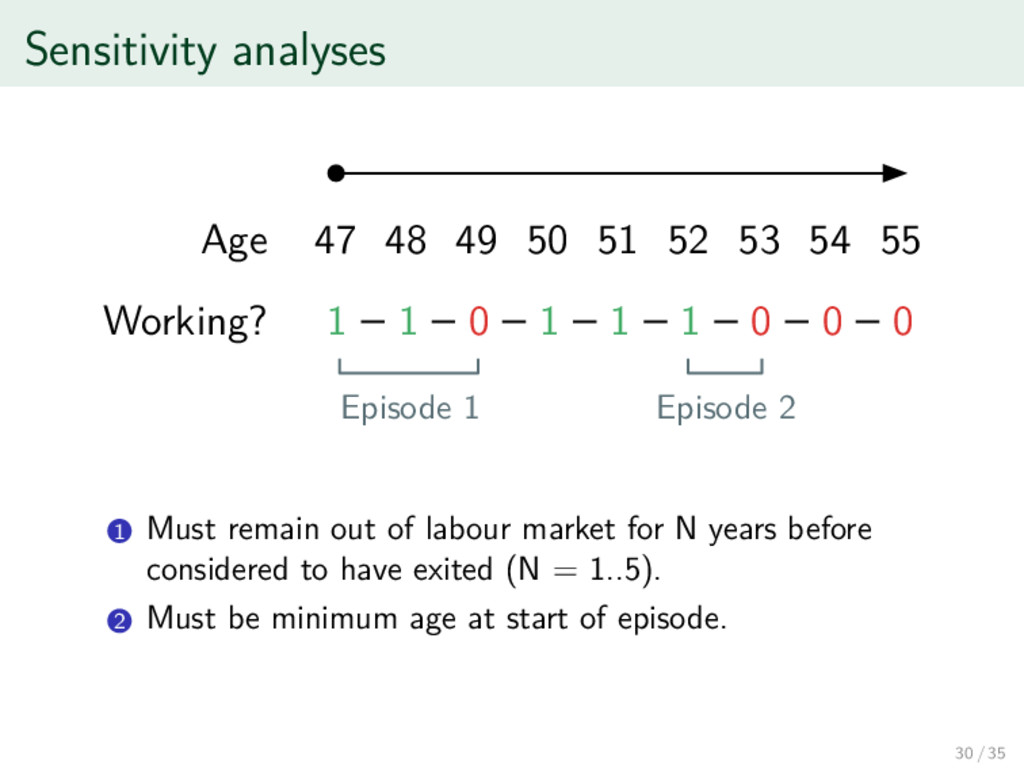
0 Working? Episode 1 Episode 2 47 48 49 50 51 52 53 54 55 Age 1 Must remain out of labour market for N years before considered to have exited (N = 1..5). 2 Must be minimum age at start of episode. 30 / 35
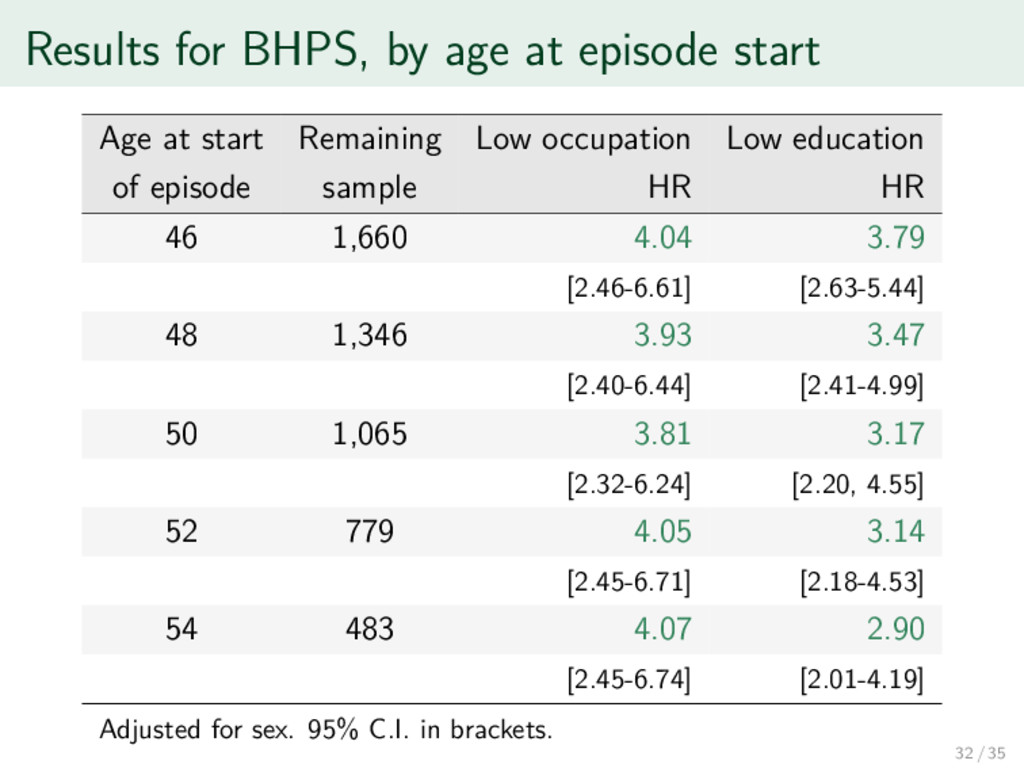
by differing socio-economic and cultural contexts. • Cross-national comparison is important, but consistent measurement is hard. • Our approach is based on working hours (widely and consistently reported), combined with registry data (where available). • Initial results suggest low education and low occupational grade are predictive of health-related work exit. • But this approach has drawbacks. • Next. . . 1 Test sensitivity to measure of health-related exit 2 Harmonise the remaining studies (NSHD, SLOSH, etc.) 34 / 35
![Thank you [email protected] @ewancarr 35 / 35](https://files.speakerdeck.com/presentations/76abce7bfeaa45c896600e71b97602ce/slide_54.jpg)