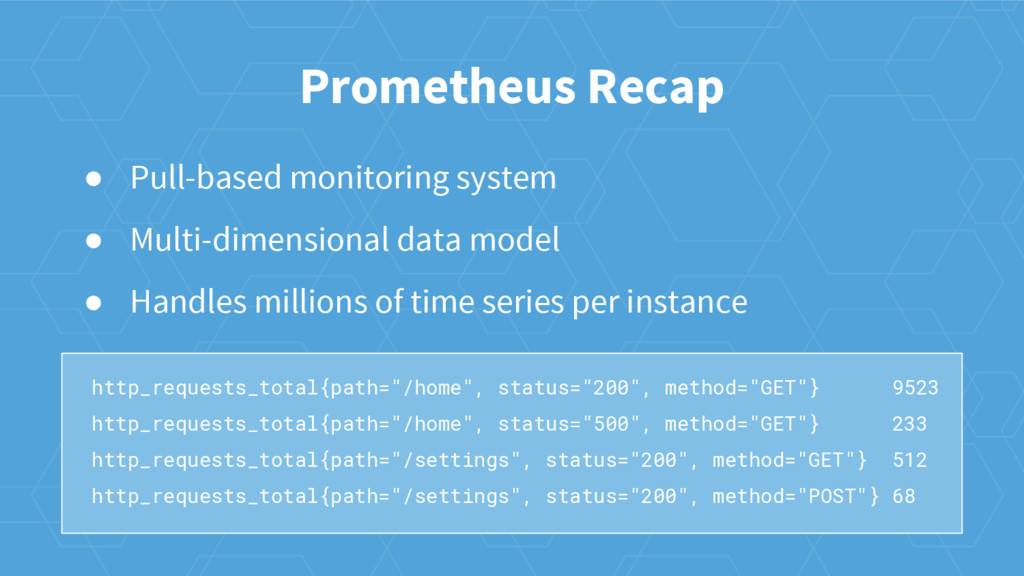
• Handles millions of time series per instance http_requests_total{path="/home", status="200", method="GET"} 9523 http_requests_total{path="/home", status="500", method="GET"} 233 http_requests_total{path="/settings", status="200", method="GET"} 512 http_requests_total{path="/settings", status="200", method="POST"} 68
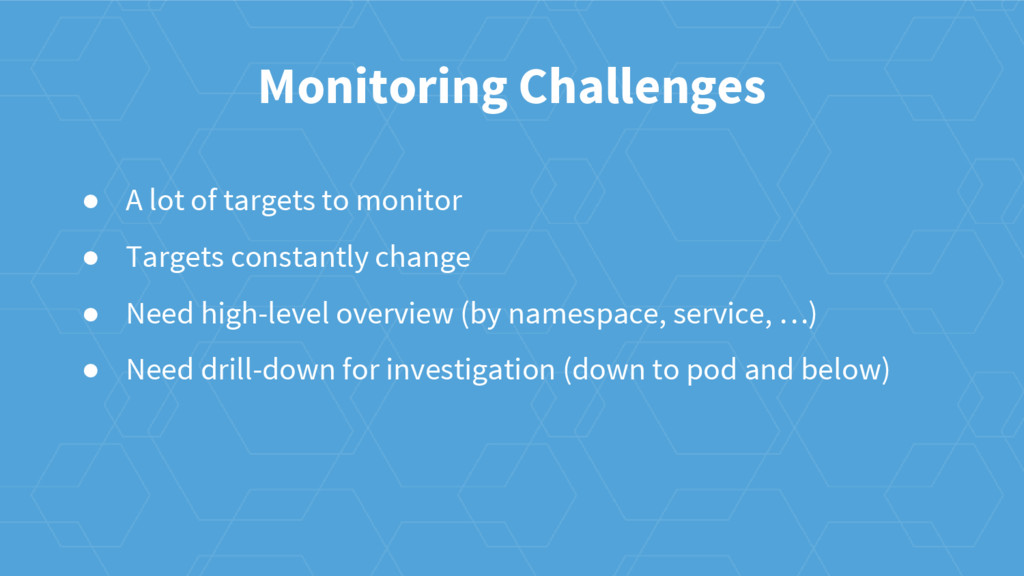
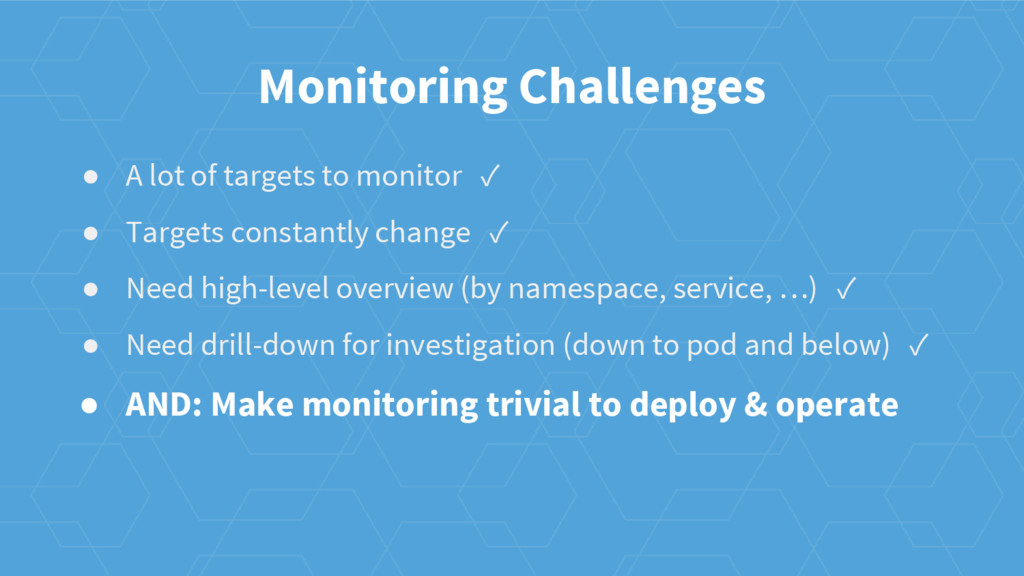
• Targets constantly change ✓ • Need high-level overview (by namespace, service, …) ✓ • Need drill-down for investigation (down to pod and below) ✓ • AND: Make monitoring trivial to deploy & operate
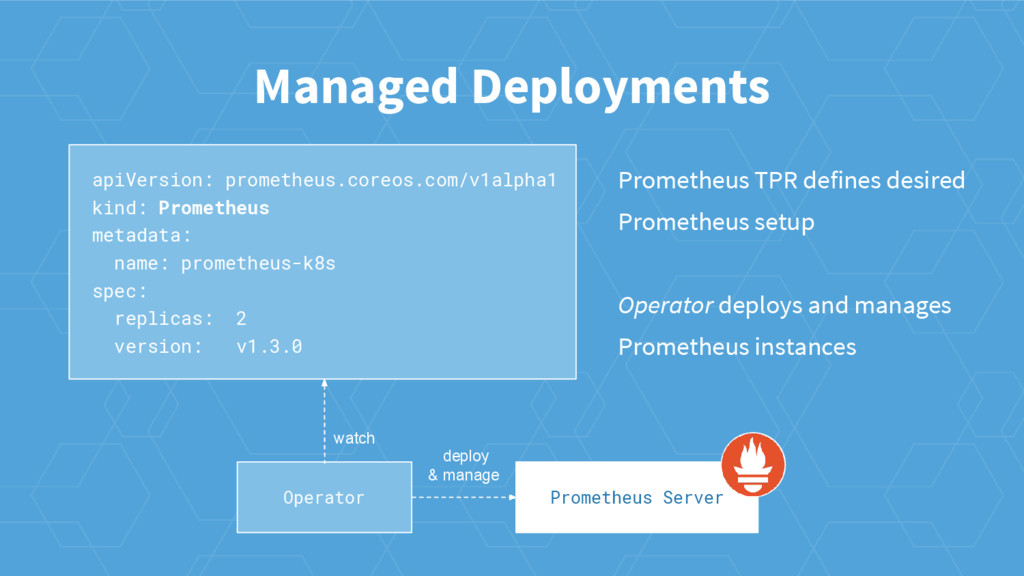
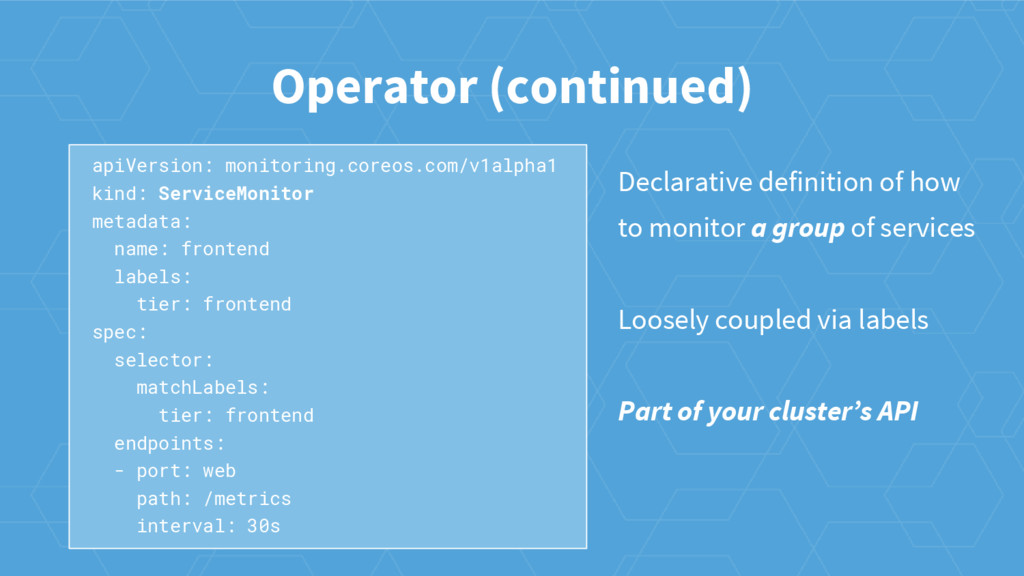
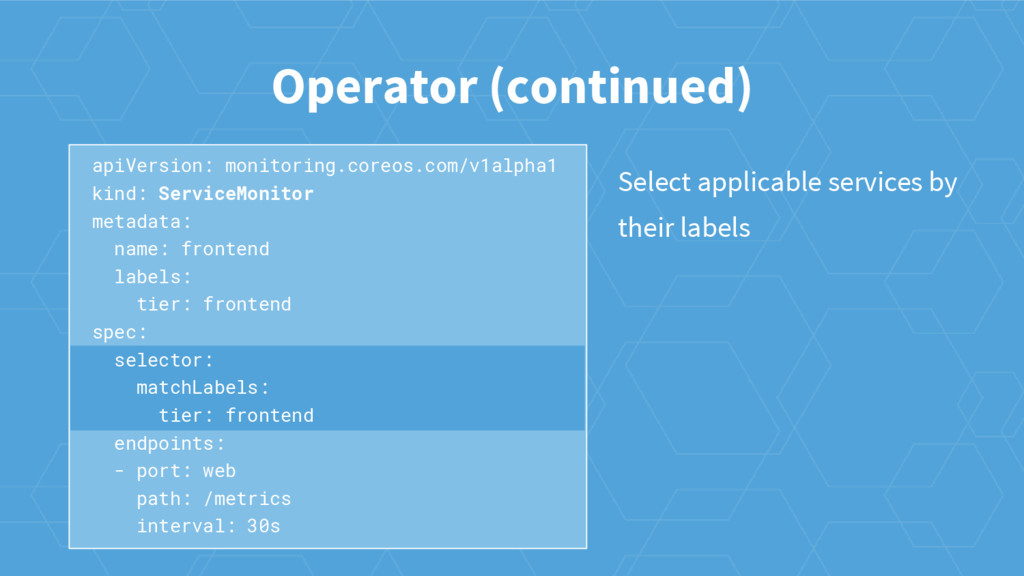
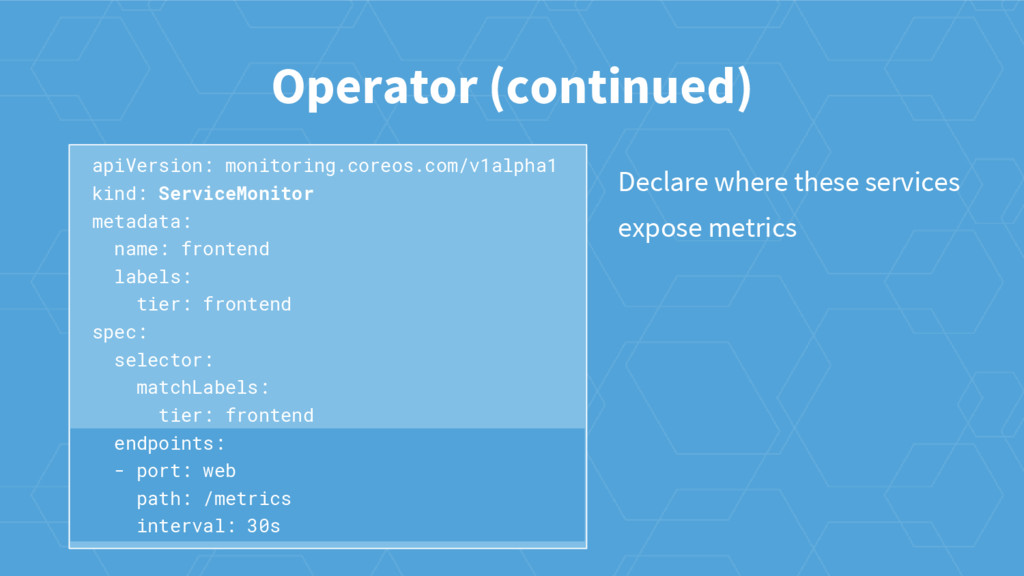
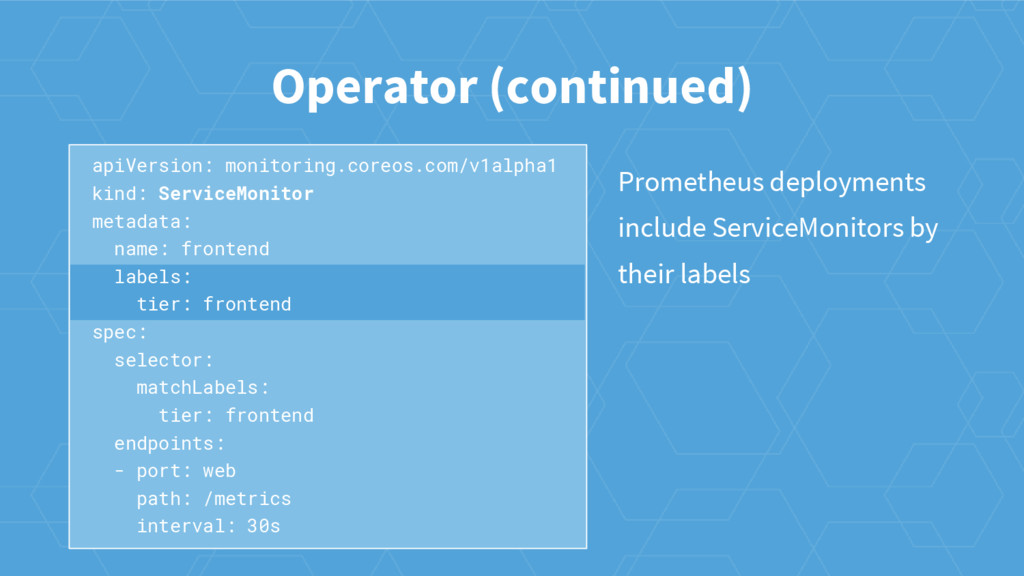
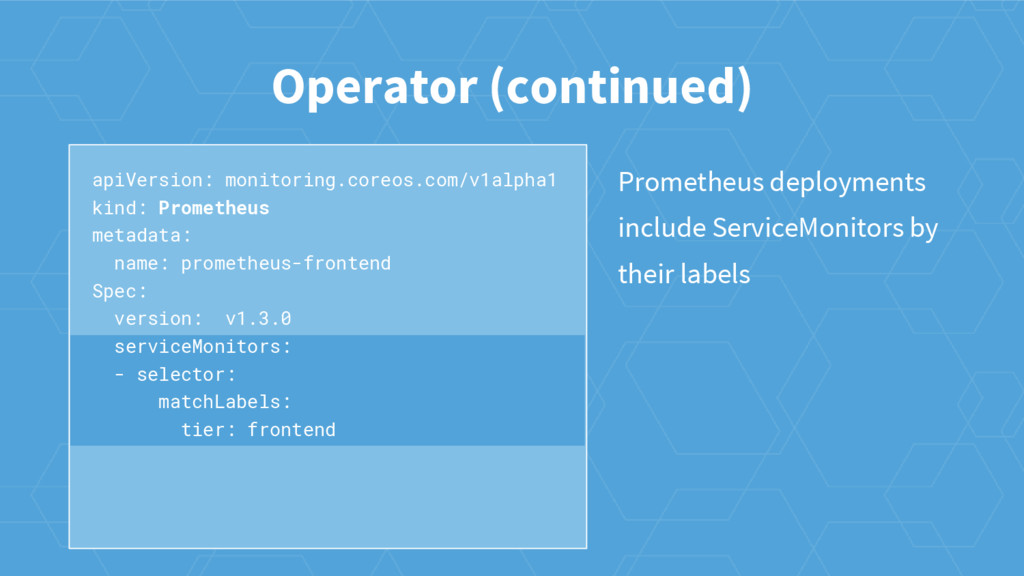
tier: frontend spec: selector: matchLabels: tier: frontend endpoints: - port: web path: /metrics interval: 30s Declarative definition of how to monitor a group of services Loosely coupled via labels Part of your cluster’s API
![Powerful Querying histogram_quantile(0.99, sum by(path, le) (rate(request_latency_seconds_bucket[5m])) ) 99th percentile](https://files.speakerdeck.com/presentations/8f32ce2701154caab431b5390cc4fe13/slide_3.jpg)
![Powerful Querying ALERT DiskWillFillIn4Hours IF predict_linear(node_filesystem_free[1h], 4*3600) < 0 Is](https://files.speakerdeck.com/presentations/8f32ce2701154caab431b5390cc4fe13/slide_4.jpg)
![[email protected] @fabxc QUESTIONS? Thanks! We’re hiring: coreos.com/careers Let’s talk! #prometheus](https://files.speakerdeck.com/presentations/8f32ce2701154caab431b5390cc4fe13/slide_24.jpg)