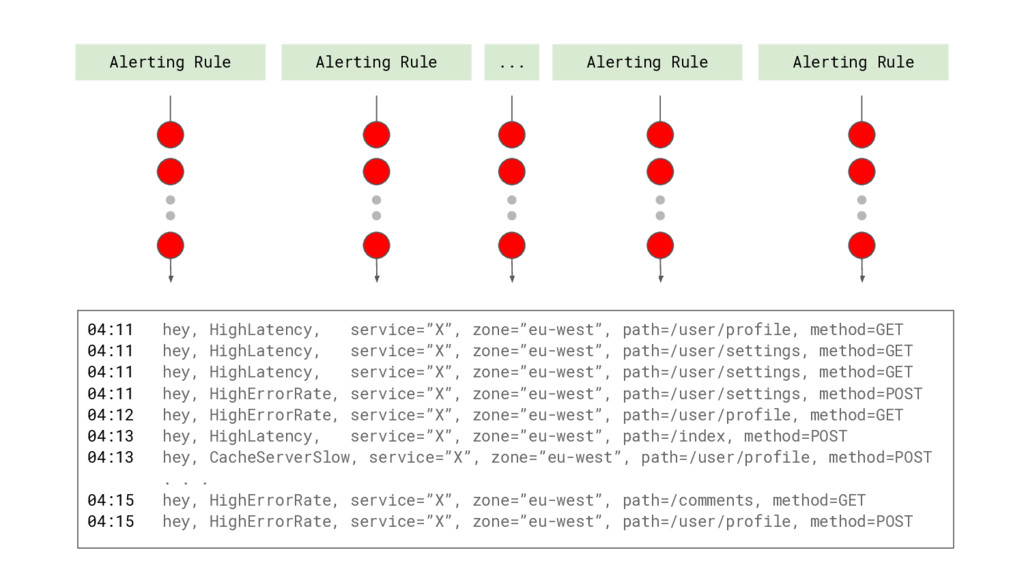
hey, HighLatency, service=”X”, zone=”eu-west”, path=/user/profile, method=GET 04:11 hey, HighLatency, service=”X”, zone=”eu-west”, path=/user/settings, method=GET 04:11 hey, HighLatency, service=”X”, zone=”eu-west”, path=/user/settings, method=GET 04:11 hey, HighErrorRate, service=”X”, zone=”eu-west”, path=/user/settings, method=POST 04:12 hey, HighErrorRate, service=”X”, zone=”eu-west”, path=/user/profile, method=GET 04:13 hey, HighLatency, service=”X”, zone=”eu-west”, path=/index, method=POST 04:13 hey, CacheServerSlow, service=”X”, zone=”eu-west”, path=/user/profile, method=POST . . . 04:15 hey, HighErrorRate, service=”X”, zone=”eu-west”, path=/comments, method=GET 04:15 hey, HighErrorRate, service=”X”, zone=”eu-west”, path=/user/profile, method=POST
![ALERT HighErrorRate IF sum(rate(request_errors_total[5m])) > 500 {} 534](https://files.speakerdeck.com/presentations/6d8872b0b5a34f34bcb0eef5f24bfdb9/slide_24.jpg)
![ALERT HighErrorRate IF sum(rate(request_errors_total[5m])) > 500 {} 534 WRONG Absolute](https://files.speakerdeck.com/presentations/6d8872b0b5a34f34bcb0eef5f24bfdb9/slide_25.jpg)
![ALERT HighErrorRate IF sum(rate(request_errors_total[5m])) > 500 {} 534 traffic changes](https://files.speakerdeck.com/presentations/6d8872b0b5a34f34bcb0eef5f24bfdb9/slide_26.jpg)
![ALERT HighErrorRate IF sum(rate(request_errors_total[5m])) > 500 {} 534 traffic changes](https://files.speakerdeck.com/presentations/6d8872b0b5a34f34bcb0eef5f24bfdb9/slide_27.jpg)
![ALERT HighErrorRate IF sum(rate(request_errors_total[5m])) > 500 {} 534 traffic when](https://files.speakerdeck.com/presentations/6d8872b0b5a34f34bcb0eef5f24bfdb9/slide_28.jpg)
![ALERT HighErrorRate IF sum(rate(request_errors_total[5m])) / sum(rate(requests_total[5m])) > 0.01 {} 1.8354](https://files.speakerdeck.com/presentations/6d8872b0b5a34f34bcb0eef5f24bfdb9/slide_29.jpg)
![ALERT HighErrorRate IF sum(rate(request_errors_total[5m])) / sum(rate(requests_total[5m])) > 0.01 {} 1.8354](https://files.speakerdeck.com/presentations/6d8872b0b5a34f34bcb0eef5f24bfdb9/slide_30.jpg)
![ALERT HighErrorRate IF sum(rate(request_errors_total[5m])) / sum(rate(requests_total[5m])) > 0.01 {} 1.8354](https://files.speakerdeck.com/presentations/6d8872b0b5a34f34bcb0eef5f24bfdb9/slide_31.jpg)
![ALERT HighErrorRate IF sum(rate(request_errors_total[5m])) / sum(rate(requests_total[5m])) > 0.01 {} 1.8354](https://files.speakerdeck.com/presentations/6d8872b0b5a34f34bcb0eef5f24bfdb9/slide_32.jpg)
![ALERT HighErrorRate IF sum by(instance, path) (rate(request_errors_total[5m])) / sum by(instance,](https://files.speakerdeck.com/presentations/6d8872b0b5a34f34bcb0eef5f24bfdb9/slide_33.jpg)
![ALERT HighErrorRate IF sum by(instance, path) (rate(request_errors_total[5m])) / sum by(instance,](https://files.speakerdeck.com/presentations/6d8872b0b5a34f34bcb0eef5f24bfdb9/slide_34.jpg)
![ALERT HighErrorRate IF sum by(instance, path) (rate(request_errors_total[5m])) / sum by(instance,](https://files.speakerdeck.com/presentations/6d8872b0b5a34f34bcb0eef5f24bfdb9/slide_35.jpg)
![ALERT HighErrorRate IF sum without(instance) (rate(request_errors_total[5m])) / sum without(instance) (rate(requests_total[5m]))](https://files.speakerdeck.com/presentations/6d8872b0b5a34f34bcb0eef5f24bfdb9/slide_36.jpg)
![ALERT DiskWillFillIn4Hours IF predict_linear(node_filesystem_free{job='node'}[1h], 4*3600) < 0 FOR 5m ...](https://files.speakerdeck.com/presentations/6d8872b0b5a34f34bcb0eef5f24bfdb9/slide_37.jpg)
![ALERT DiskWillFillIn4Hours IF predict_linear(node_filesystem_free{job='node'}[1h], 4*3600) < 0 FOR 5m ANNOTATIONS](https://files.speakerdeck.com/presentations/6d8872b0b5a34f34bcb0eef5f24bfdb9/slide_38.jpg)
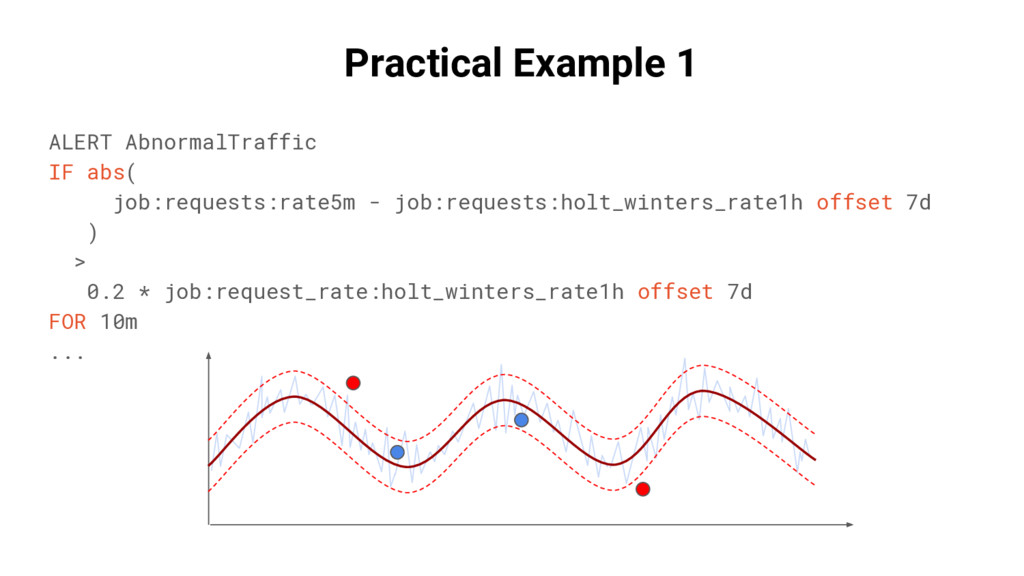
![Practical Example 1 job:requests:rate5m = sum by(job) (rate(requests_total[5m])) job:requests:holt_winters_rate1h =](https://files.speakerdeck.com/presentations/6d8872b0b5a34f34bcb0eef5f24bfdb9/slide_45.jpg)