Upgrade to Pro — share decks privately, control downloads, hide ads and more …

Enhancing the Quality of Predictive Modeling on College Enrollment

Enhancing the Quality of Predictive Modeling on College Enrollment

Predictive modeling has gained popularity in studying college enrollment due to fierce competition in higher education. To make informed decisions and allocate limited resources to improve enrollment, predictive modeling has been applied to challenge and change the traditional recruitment process. This session is intended for two learning outcomes:

Participants who are not familiar with predictive modeling will learn how to lay out a plan to collect and build a comprehensive data infrastructure and conduct predictive modeling.
Participants who have run predictive modeling will learn how to critically examine the quality of their predictive analyses.
Co-authored with Yun Xiang

Feyzi R. Bagirov

October 25, 2016
Tweet

More Decks by Feyzi R. Bagirov

Other Decks in Education

Transcript

  1. Agenda • Enrollment in the US • Background • Predictive

    Analytics Workflow – Business Understanding – Data Understanding – Data Preparation – Modeling – Evaluation – Deployment • Next Steps • Take Away Messages • Q&A
  2. Data Science Advisor at Metadata.io (ABM, B2B Demand Generation) Started

    at Dassault Systemes as a BI Analyst in 2006 Was a Founding Director of Data Science program at Becker College Analytics Faculty at Harrisburg University of Science and Technology
  3. Enrollment in the US • The 10-year average for college

    closures is five annually. • The two types of colleges with the biggest declines in enrollment are community colleges and for-profit universities. Those schools draw heavily from low-income and minority households.* • The main struggle for many small colleges is declining enrollment • Moody’s report predicts that inability of small colleges to increase revenue will result in triple the number of closures and double the number of mergers in the coming years. * Source: http://money.cnn.com/2016/05/20/news/economy/college-enrollment-down/
  4. Background A Private, 4-year College Enrollment: 2,000 undergraduates Location: Central

    Massachusetts Expectation: § 1st year—Build the data structure § 2nd year—Run the predictive models
  5. Cross Industry Process for Data Mining (CRISP-DM) The most popular

    methodology for analytics, data science, data mining projects Issues with CRISP-DM: the official site, CRISP-DM.org, is no longer being maintained. the framework itself has not been updated on issues on working with new technologies, such as Big Data Possible Alternatives: • SEMMA • MS Data Science Lifecycle
  6. “Skunk” Team • Vice President of Enrollment Management • Chief

    Information Officer • Director of Institutional Research • Dean of Admissions • Director of Financial Aid • Director of Data Science • Director of Enterprise Applications • Data Engineer
  7. Start with a high-level idea • Who is my customer?

    • What is making my customer complain so much? Admissions/Enrollment team
  8. Enrollment Management Process Process: • Prospect/Inquiry Generation • Applicant Management

    • Deposit/Confirmation Management • Event Management • Marketing • Registrar Goals: • Maintain or increase class size • Increase ethnic diversity • Improve academic profile • Increase net tuition revenue • Lower the tuition discount rate • Strengthen weak academic programs • Maximize the return of strong academic programs • Support athletic or other specialized programs on campus Hossler, D., & Bontrager, B. (2015). Handbook of strategic enrollment management. San Francisco, CA: Jossey-Bass.
  9. Enrollment Management & Admission Funnel Definition: Enrollment Management is the

    organizational integration of functions such as academic advising, admissions, financial aid, and orientation into a comprehensive institutional approach designed to enable college and university administrators to exert greater influence over the factors that shape their enrollments (Hossler & Bontrager, 2015, p. 7-8). Rules of Progression Response % Conversion % Completion % Acceptance % Confirmation % Capture % Persistence % Graduation %
  10. Use cases studied prior to design • University of Alabama

    • Started experimenting with analytics in 2003 • Used all available data in modeling • Leveraged Clearing House data to see where they were losing students; this allowed to have a better idea of true competitors. This led to a completely restructured understanding of their competition. • Used ACT datasets for profiling
  11. Use cases studied prior to design • Game-changers and take-away

    messages: – Visits to campus made a difference in predicting which students would enroll – Freshmen were required to live on campus and that made students persist better – Targeting of the out-of-state students based on geographies where they had a large populations already. By visualizing large populations with maps it showed concentrations by the area
  12. Use cases studied prior to design • Determining target markets,

    the Admission’s business model changed drastically: – Hiring regional recruiters in areas of high prospect concentration – Changing target prospects (high-probability prospects require less time, more efforts on 60-80% probability prospects) – Changed the targeting process. Customize targeting messages. – Changed the types of recruiters they’ve hired – the ones that better understand data and use that data to bring in the prospects – Hired a campaign director to track the success of the campaigns – Used in-house callers to spend a lot of time on calling campaigns talking to students – Overlaid prospective students with alumni data sets and reached out to alumni to host lunches in areas outside of the home state to engage prospects.
  13. Use cases studied prior to design • Outcomes: – Launched

    predictive models in 2003. Most information was in Excel. Overtime, acquired a CRM system and leveraged that for consolidation and accrual of applicant and event data. – Redundant and irrelevant data in CRM was removed over time (for example, all students wanted a scholarship, so they did not include that in their model) – Enrollment increase from 20k to 35k over a targeted period, predominantly due to out-of-state students
  14. Be Realistic, Expect Changes! Goal: Increase freshmen yield rate Question:

    What admitted students are more likely to deposit? Reality
  15. Initial Questions for Becker • Determining data sources: – ACT,

    what data elements are included and can be collected – SAT, what data elements are included and can be collected – Clearing House, how long will it take to perform validation of students’ enrollment to Becker – Accessing population data to be used in targeting areas – Do we know who are our true competitors? – What are we doing to target students differently?
  16. Explorative Data Analysis (EDA), Data Cleanup and Manipulation According to

    IDG, cleaning and organizing data takes up to 60% of the data scientists’ time The process took 75% of time of the whole project!
  17. Student Profile Non- White 29% White 71% Ethnicity 2014/15 Out-

    of- State 46% In- State 54% Non- First Gen 48% First Gen 52% Femal e 56% Male 44% Gender 2014/15 Female 64% Male 36% Gender 2016 Non- White 26% White 74% Ethnicity 2016 Non- FirstGe n 38% First Gen 62% Out-of- State 44% In- State 56% FirstGen vs. Non FirstGen 2014/15 FirstGen vs. Non FirstGen 2016 In-State vs. Out-of- State 2014/15 In-State vs. Out-of- State 2016
  18. Predictive Modeling Details • Two years of historical data •

    Descriptive: Characteristics and demographics (gender, race/ethnicity, geography, first-gen, Pell grant receiver, etc.) • Financial aid: Need-based, merit-based, other grant, loan, work-study, etc. • Behavioral: Application date; deposited date; Admission activities (phone call, email, campus visits, etc.) • Logistic regression • Predict “deposit” probability for each student (values from 0 to 1) • Test each predictor separately first vs putting everything in the model • R/RStudio • Learning curve, but it’s worth Data Model Tools
  19. • Descriptive (Characteristics and demographics) – Age – gender –

    race/ethnicity – Geography (regional – New England/Non-New England, MA/Non-MA, Worcester/Non-Worcester) – first generation (parental education) – Pell grant receiver – Sports activities count – External activities count Data
  20. • Financial aid: – need-based – merit-based – other grant

    – loan – work-study – family contribution Data
  21. • Behavioral: – Application date/applied term – deposited date –

    Admission activities • phone call count • email • campus visits (Acceptance Student Day, campus tours, etc.) Data Admitted Accepted Deposited
  22. • Over 800 lines of code • Majority of code

    is data transformation and cleanup • Supervised modeling/Logistic regression Model
  23. • A classification algorithm, that predicts a binary (1/0 or

    True/False) outcome • Dependent variable is categorical • Logistic Regression, Decision Trees, SVM, Random Forest. Model Why Logistic Regression?
  24. • We are using log of dependent variable • Predicts

    the probability of occurrence of an event to a logit function • Part of a larger class of algorithms known as Generalized Linear Models (glm) Model • g() – the link function (to ‘link’ the expectation of y to the predictor) • E(y) – expectation of target variable • α + βx1 + γx2 is the linear predictor ( α,β,γ to be predicted)
  25. Why R? • Open-source (free to use, improve on, and

    redistribute) • Runs on most standard OS • Released frequently • Graphics capabilities are better than in the most other analytical packages • Huge and very active user community • It provides analysts more control over what changes to make and what assumptions to test. Tools
  26. Why In-house? • Why in-house? • Most data cleaning can

    only be done in-house. • Colleges have a better control of the modeling process. • The process can be repeated once the codes are written. • More transparency and evaluation can be done in house.
  27. Evaluation step 1 – score models • Are predictions accurate?

    – Confusion matrix • Is model good enough? – Area under the Receiving Operating Characteristic (ROC) curve – a plot illustrating diagnostic ability of a model
  28. Evaluation Question – Are predictions accurate? • Confusion matrix is

    a tabular representation of Actual vs Predicted. • Determines how many predictions have been done right and how many have been done wrong • Helps to find the accuracy of the model and avoid overfitting • Error rate (ERR) and accuracy (ACC) are the most common and intuitive measures derived from the confusion matrix. Predicted Good Bad Actual Good True Positive (d) False Negative (c) Bad False Positive (b) True Negative (a)
  29. Evaluation Question – Are predictions accurate? • Error rate (ERR)

    and accuracy (ACC) are the most common and intuitive measures derived from the confusion matrix.
  30. Confusion matrix – Error rate • Error rate (ERR) is

    calculated as the number of all incorrect predictions divided by the total number of the dataset. The best error rate is 0.0, whereas the worst is 1.0.
  31. Confusion matrix –Accuracy rate • Accuracy (ACC) is calculated as

    the number of all correct predictions divided by the total number of the dataset. The best accuracy is 1.0, whereas the worst is 0.0. It can also be calculated by 1 – ERR.
  32. Confusion matrix – other basic measures • Sensitivity* • Specificity*

    • Precision • Recall • F-measure** • The support * Sensitivity and specificity are more informative than accuracy and error rate if you want to avoid false negatives more than false positives ** F-measure is a weighted harmonic mean of the precision and recall
  33. Evaluation Question – Are predictions accurate? • Receiver Operating Characteristic(ROC)

    summarizes the model’s performance by evaluating the trade offs between true positive rate and false positive rate. • library(ROCR) • Assume p > 0.5 • Performance metric for ROC curve is the area under curve (AUC) -Higher the area under curve, better the prediction power of the model. -The ROC of a perfect predictive model has TP equals 1 and FP equals 0. -This curve will touch the top left corner of the graph.
  34. Evaluation step 2 – review the model • Did we

    miss anything? • Any assumptions violated?
  35. Actually using your model! • Automation • Getting feedback from

    model’s output users • Experimenting and feeding the new learning back to the model to improve its accuracy • Monitoring outcomes of the model use
  36. Deploy Results— Be Responsive & Improve the Admissions Practice 1.

    The admissions office will receive a file every two weeks. 2. The file will be uploaded to Recruiter. 3. The VP of Enrollment will take actions.
  37. Challenges in Using Predictive Analytics • Obstacles in management No

    champion for the work • Obstacles with data Data need à Data infrastructure à Data consistency • Obstacles with modeling Analyst too zealous or too ambitious Model is too complex (overfitting – significant relationshpis are just noise)
  38. Next Steps Build more analytic work • What areas or

    school districts should we spend more resources on (visits, calls, marketing campaign)? • How do we improve the academic profile of incoming students? • How can we create new aid models to leverage our intuitional aid to achieve higher yield? • Retention - which students are most likely to drop out/transfer? • Utilizing unstructured data to gain additional insights Actually USING the results • What actions need to take place based on scores generated from predictive models? • How do we assess the effectiveness of our uplifting marketing campaigns (including customized emails, number of phone calls, and other marketing activities)?
  39. How else can data analytics help my school? • Increasing

    students’ retention • Increasing students’ graduation • Increasing students’/teachers’ performance • Reducing students’ absence • Adaptive learning
  40. Take Away Messages • Be realistic to narrow the scope

    of the predicative modeling work at the initial stage • Evaluation of models should be in the process • Building data structure is more important than methodology
  41. Predictive Modeling Steps and Details in the Context of College

    Enrollment Details in strategic enrollment management process but very general guideline on modeling (Page 223-227). Practical suggestions on predictive analytics but focus on the economic field of fraud detection & customer satisfaction. Link the two sides Build predictive analytics in the context of college enrollment
  42. References Abbot, D. (2014). Overview of predictive analytics. Applied predictive

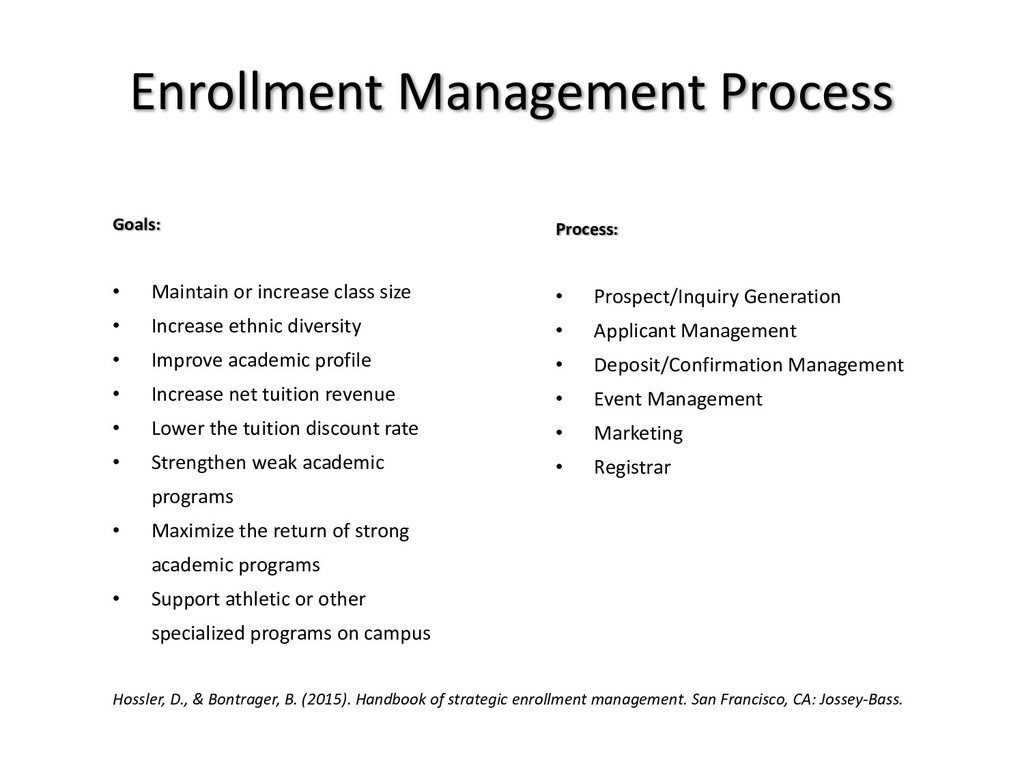
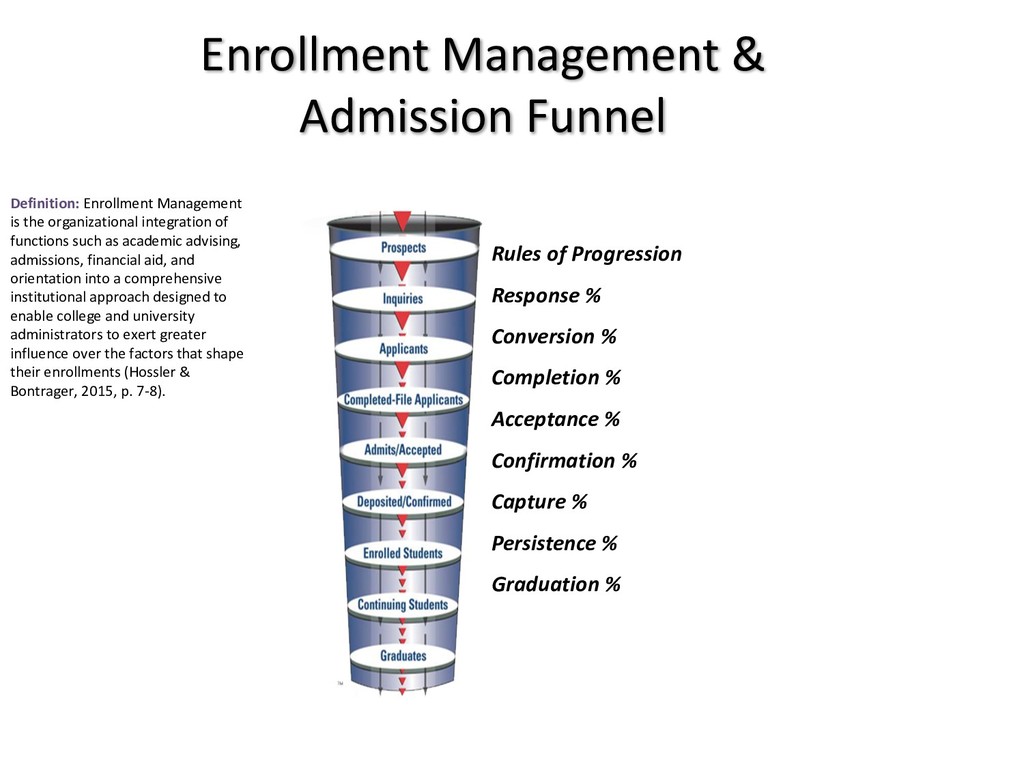
    analytics: Principles and techniques for the professional data analyst (17). Indianapolis, IN: Wiley. Abbot, D. (2014). Setting up the problem. Applied predictive analytics: Principles and techniques for the professional data analyst (19). Indianapolis, IN: Wiley. Berg, B. (2012). Predictive modeling: A tool, not the answer: Benefits and cautions of using historical data to predict the future. University Business. Retrieved from: http://www.universitybusiness.com/article/predictive-modeling-tool-not- answer Bergerson, A.A. (2010). College choice and access to college: Moving policy, research and practice to the 21st century. ASHE Higher Education Report, 35(4). San Francisco, CA: Jossey-Bass. Cabrera, A.F. (1994). Logistic regression analysis in higher education: An applied perspective. In J.C. Smart (ed.), Higher Education: Handbook of Theory and Research, 10, (225-256). New York, NY: Agathon Press. Davis, C.M., Hardin, J.M., Bohannon, T., Oglesby, J. (2007). Data mining applications in higher education. In K.D. Lawrence, S. Kudyba, & R.K. Klimberg (Eds.), Data Mining Methods and Applications (123-147). Boca Raton, FL: Auerbach Publications. Hosmer, D.W., Lemeshow, S. (2000). Applied logistic regression. (2). New York, NY: John Wiley & Sons, Inc. Hossler, D. (1991). Evaluating student recruitment and retention programs. New Directions for Institutional Research, 70. San Francisco, CA: Jossey-Bass. Hossler, D., & Bontrager, B. (2015). Handbook of strategic enrollment management. San Francisco, CA: Jossey-Bass. Hossler, D., Gallagher, K. S. (1987). Studying student college choice: A three- phase model and the implications for policymakers. College and University, 62(3), 207-221. Hovland, M. (2004). Unraveling the mysteries of student college selection. Paper presented at the 2004 ACT Enrollment Planner’s Conference. Chicago, IL. Prescott B. & Bransberger, P. (2013). Knocking at the College Door: Projections of High School Graduates by State, Income, and Race/Ethnicity, Boulder, CO: Western Interstate Commission for Higher Education. Luan, J. (2002). Data mining and its applications in higher education. New Directions for Institutional Research, 113,17-36. McPherson, M.S. (1991). Does student aid affect college enrollment? New evidence on a persistent controversy. The American Economic Review, 81(1), 309-318. Perna, L. (2006). Studying college access and choice: A proposed conceptual model. Higher Education: Handbook of Theory and Research, 21, 99-151. Sigillo, A. (2015). Predictive modeling in enrollment management: New insights and techniques. Retrieved from: http://www.uversity.com/downloads/research/EI%20Whitepaper_R6.pdf