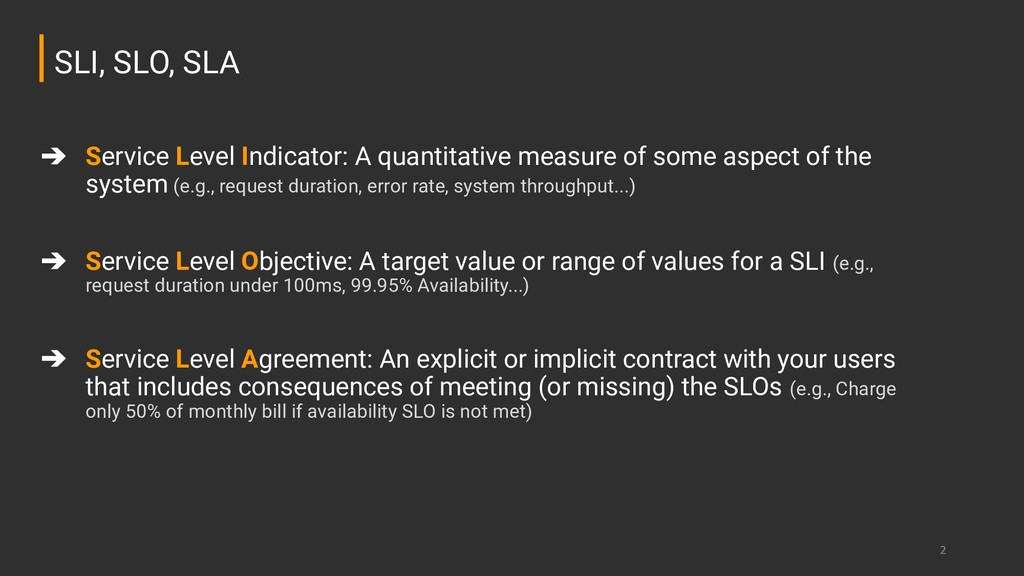
aspect of the system (e.g., request duration, error rate, system throughput...) ➔ Service Level Objective: A target value or range of values for a SLI (e.g., request duration under 100ms, 99.95% Availability...) ➔ Service Level Agreement: An explicit or implicit contract with your users that includes consequences of meeting (or missing) the SLOs (e.g., Charge only 50% of monthly bill if availability SLO is not met) SLI, SLO, SLA
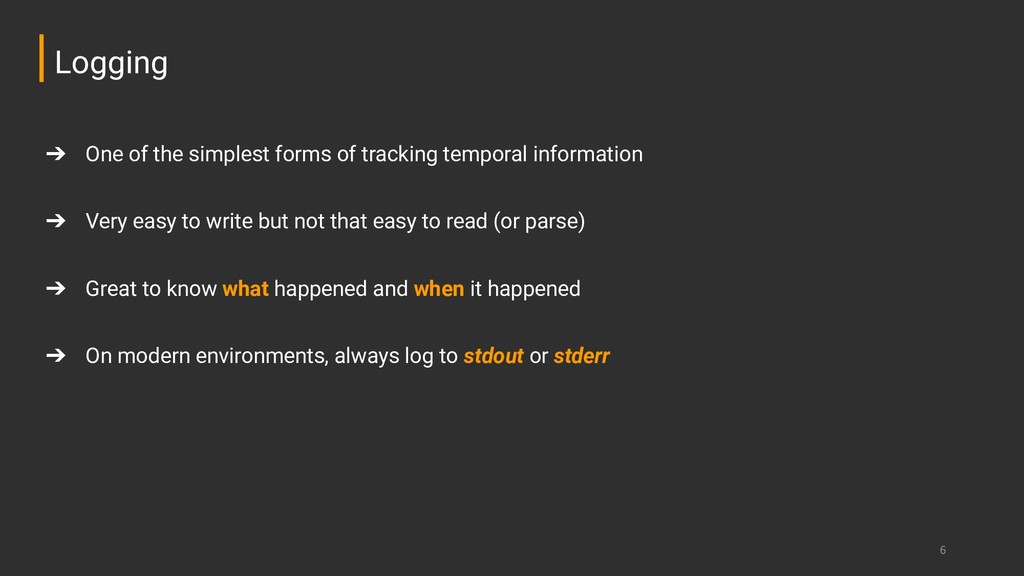
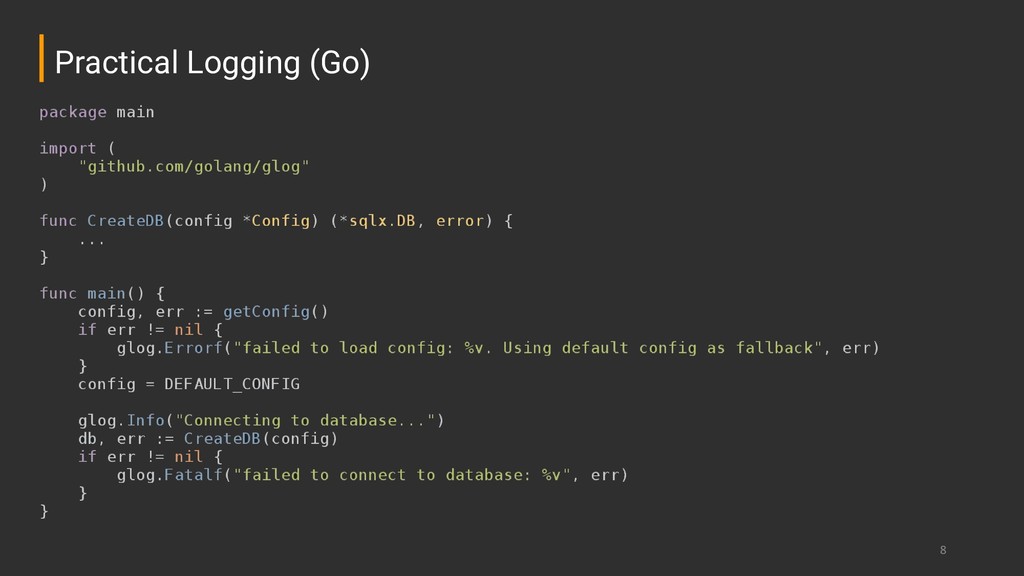
information ➔ Very easy to write but not that easy to read (or parse) ➔ Great to know what happened and when it happened ➔ On modern environments, always log to stdout or stderr Logging
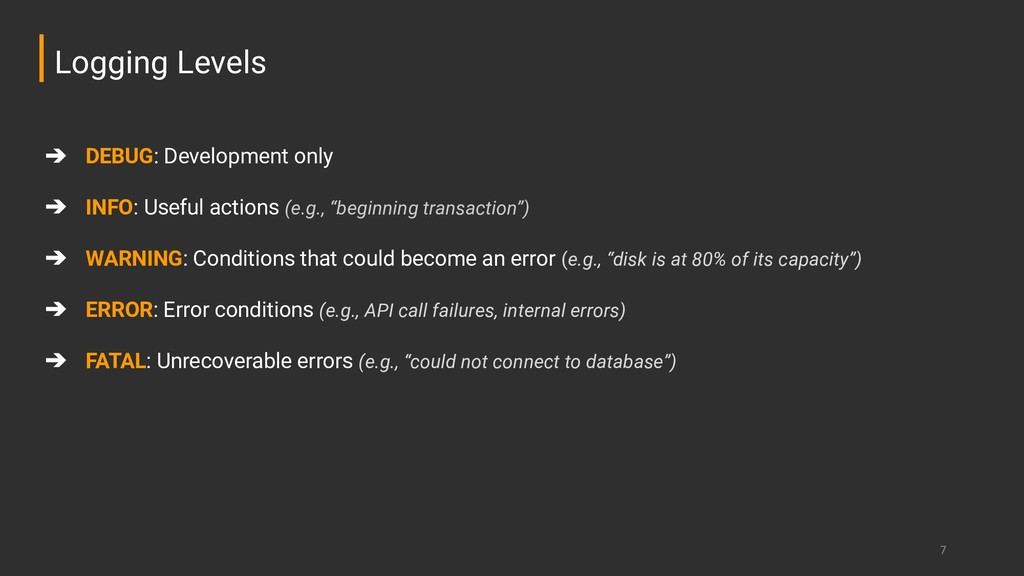
“beginning transaction”) ➔ WARNING: Conditions that could become an error (e.g., “disk is at 80% of its capacity”) ➔ ERROR: Error conditions (e.g., API call failures, internal errors) ➔ FATAL: Unrecoverable errors (e.g., “could not connect to database”) Logging Levels
automated sensors reporting the status of every component of this valuable asset. And yet, we often don’t take the same care with software - we found that creating application and infrastructure telemetry to be one of the highest return over investment we’ve made. (...)“ Scott Prugh, Chief Architect at CSG Telemetry
counter whose value can only increase or be reset to zero on restart. ➔ Gauge: A metric that represents a single numerical value that can arbitrarily go up and down. ➔ Histogram: Sampled observations counted in configurable buckets. It also provides a sum of all observed values. ➔ Summary: Sampled observations. It provides a total count of observations and a sum of all observed values and calculates configurable quantiles over a sliding time window. Prometheus - Metric Types
decrease. (e.g., total errors, requests received, events consumed…) ➔ Gauge: Use gauges when the value will possibly decrease. (e.g., current temperature, currently running processes...) Prometheus - Counter vs Gauge
proteus_http_request_duration_seconds, http_requests_total) ➔ Never mix units (seconds and milliseconds are not the same thing!) ➔ Use labels to differentiate characteristics of measurements ◆ Beware of label values with high cardinality!!!! Prometheus - Best Practices
is useful when you need to take action?) ➔ Have few graphs per dashboard ➔ Focus on what shows the user impact ➔ Beware of unmeaningful and unuseful aggregations ➔ Graphs are for humans, focus on ease of visualization Graphing - Best Practices
prevent failures ➔ Be careful on alerting based on standard deviation ◆ (You cannot assume your time series has a Gaussian distribution) ➔ Beware of false alerts ➔ Only alert if someone must take action, if not, the alert becomes spam Alerting
![Obrigado! 30 [email protected]](https://files.speakerdeck.com/presentations/058f2b5792fa43f494da9384cb66ac25/slide_29.jpg)