Here is the complete slidedeck of the complete workshop on Software Analytics.
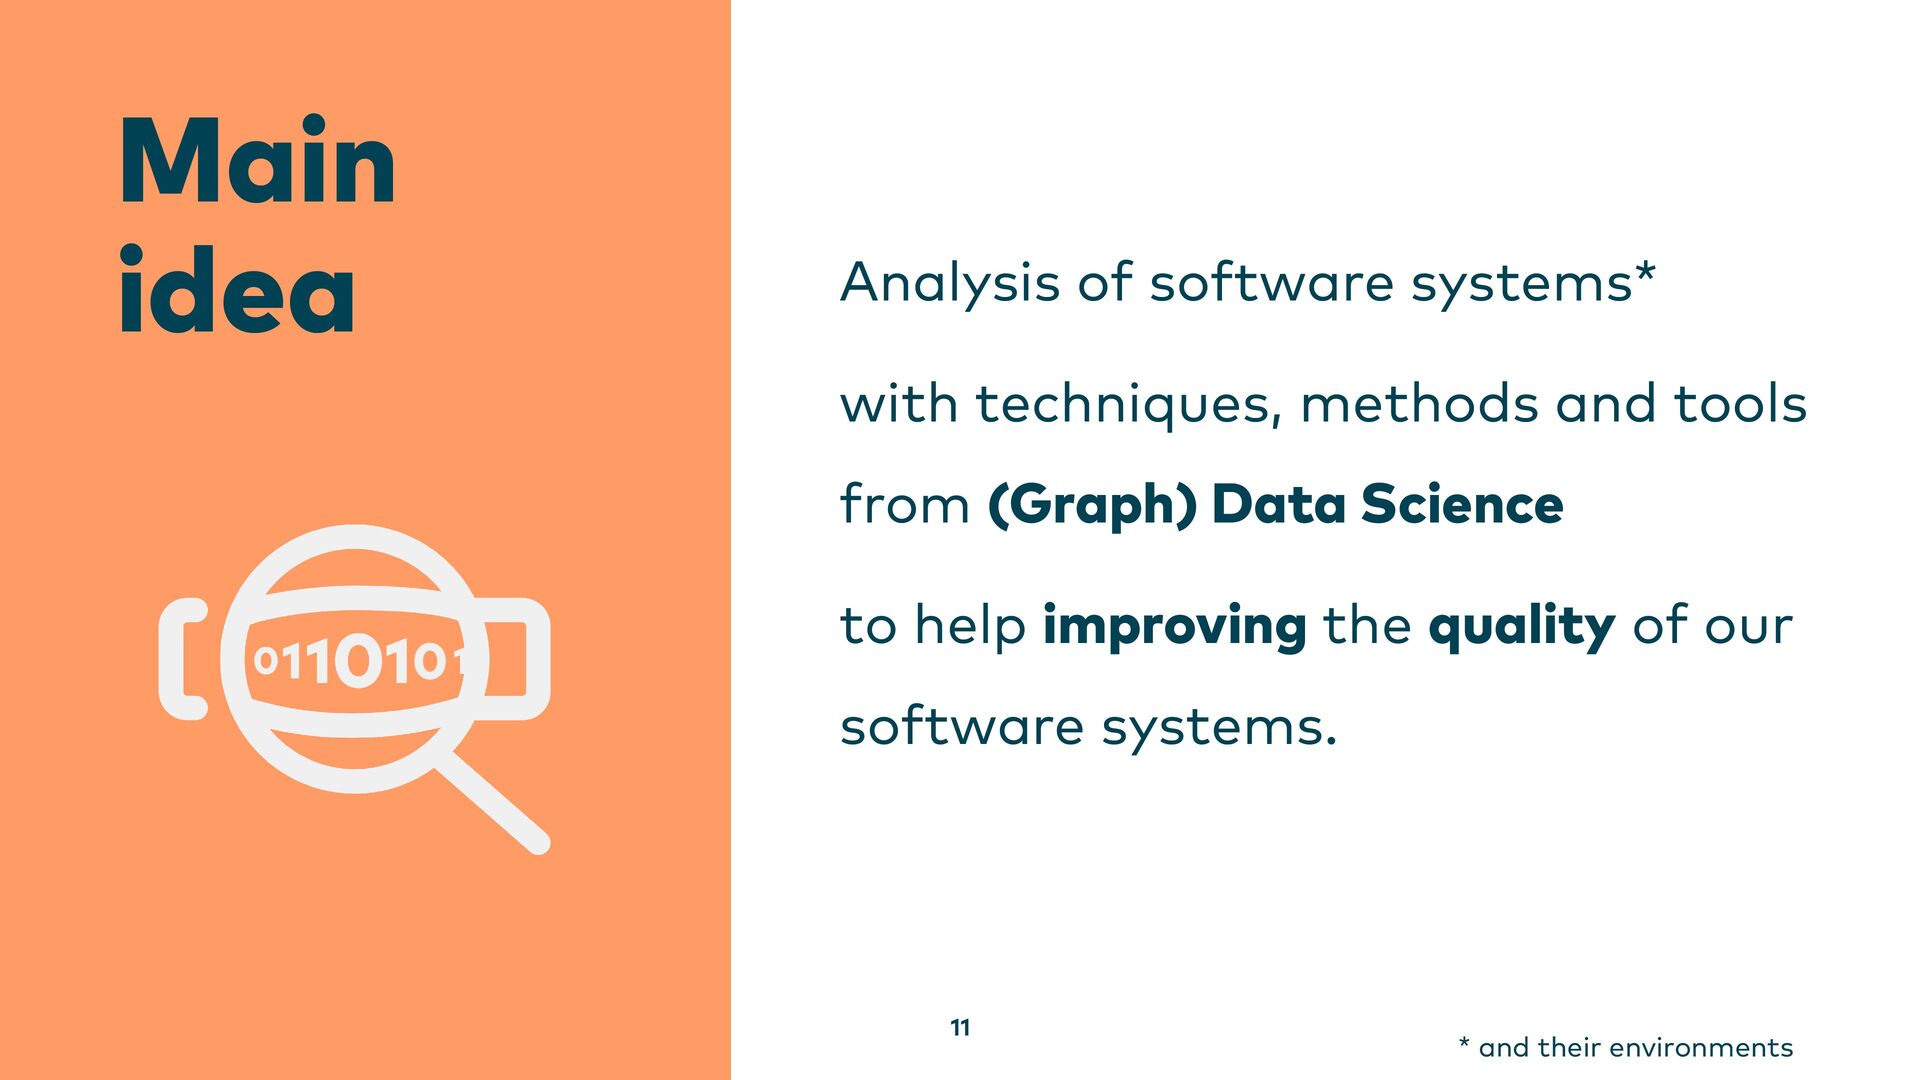
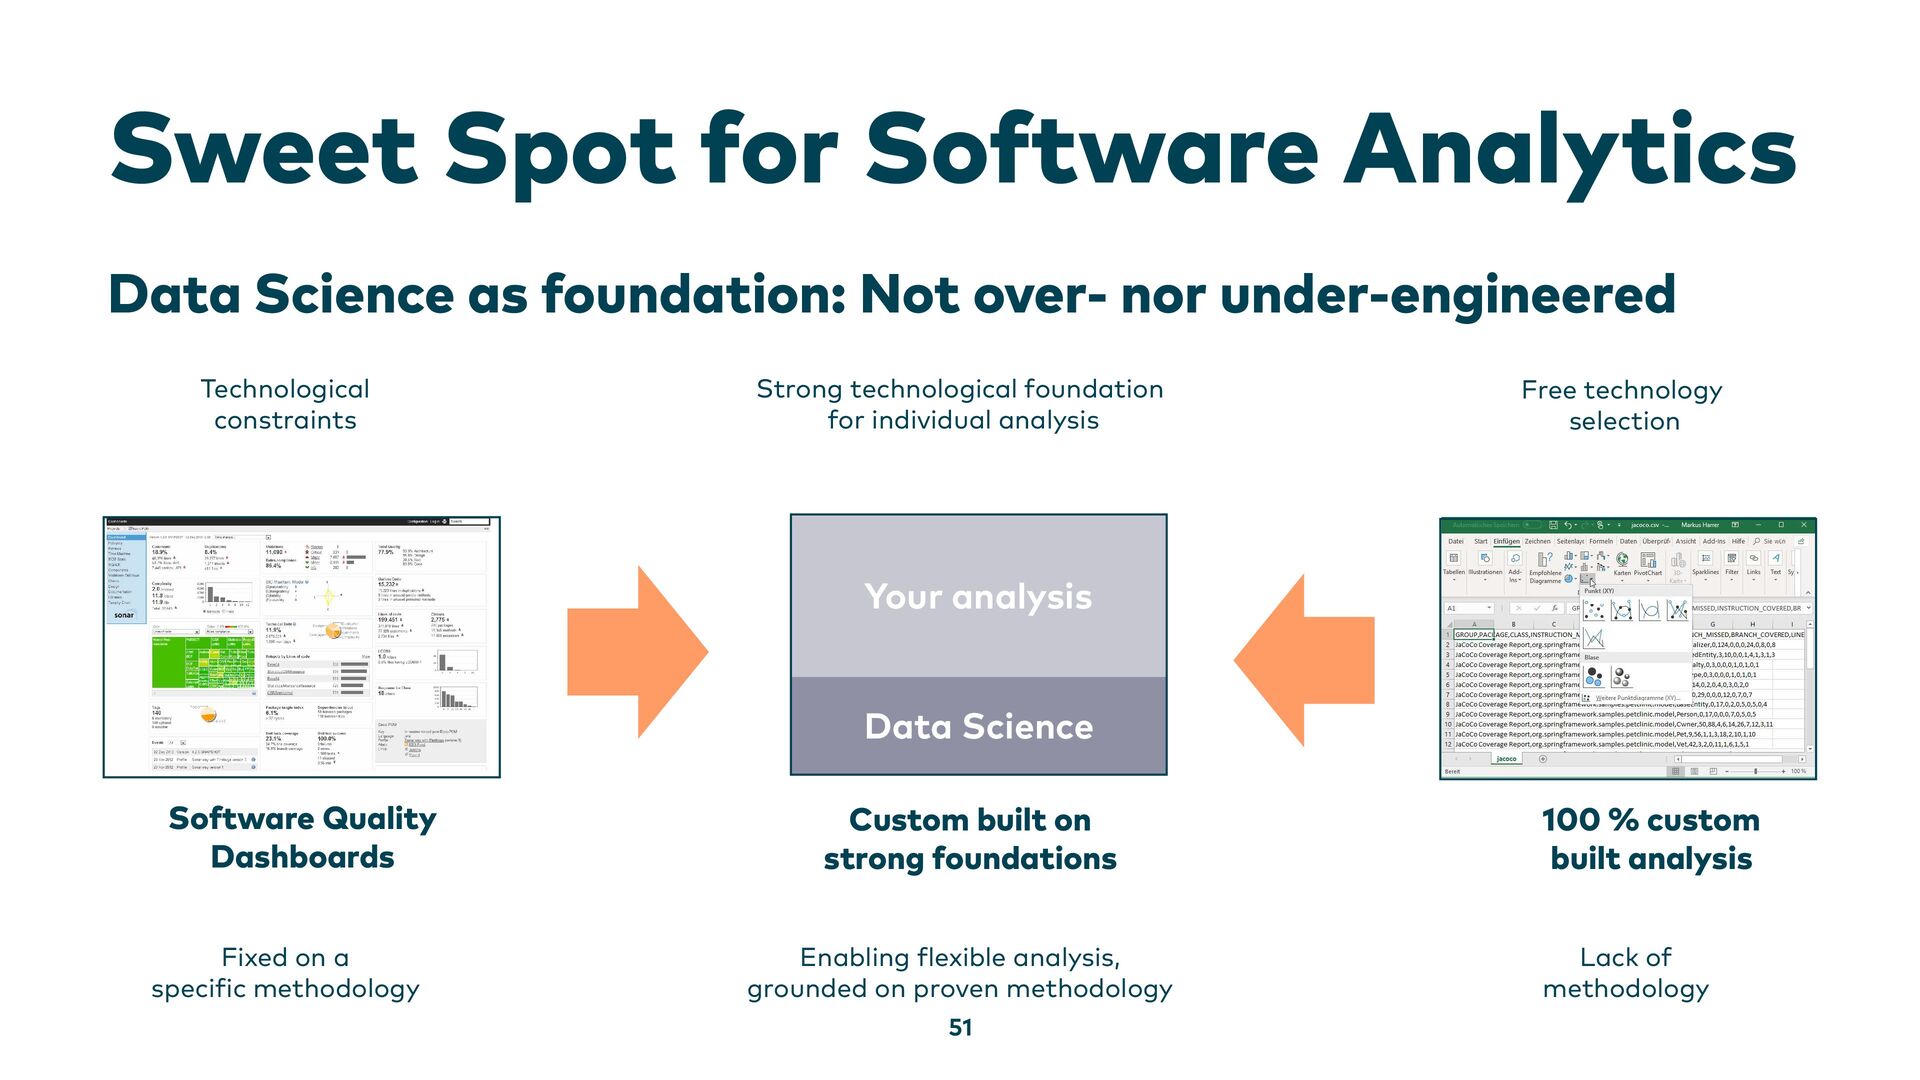
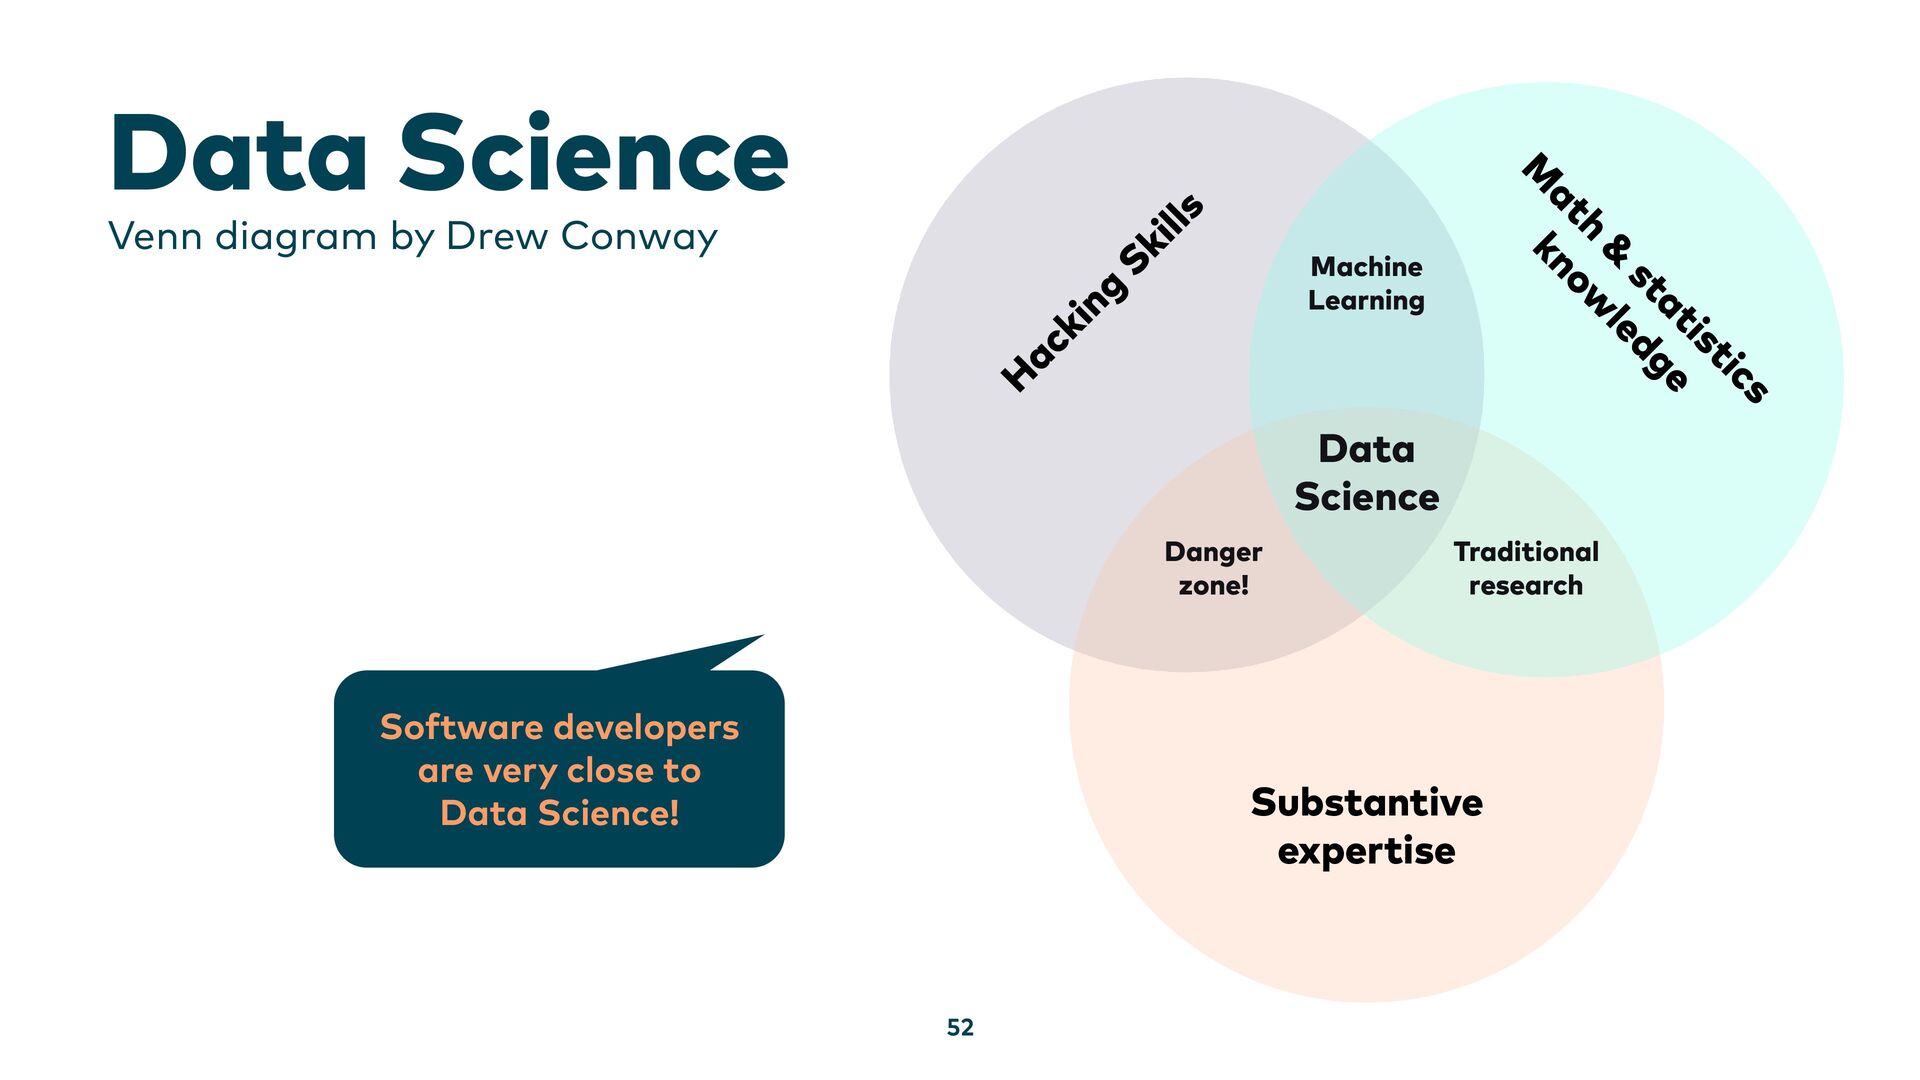
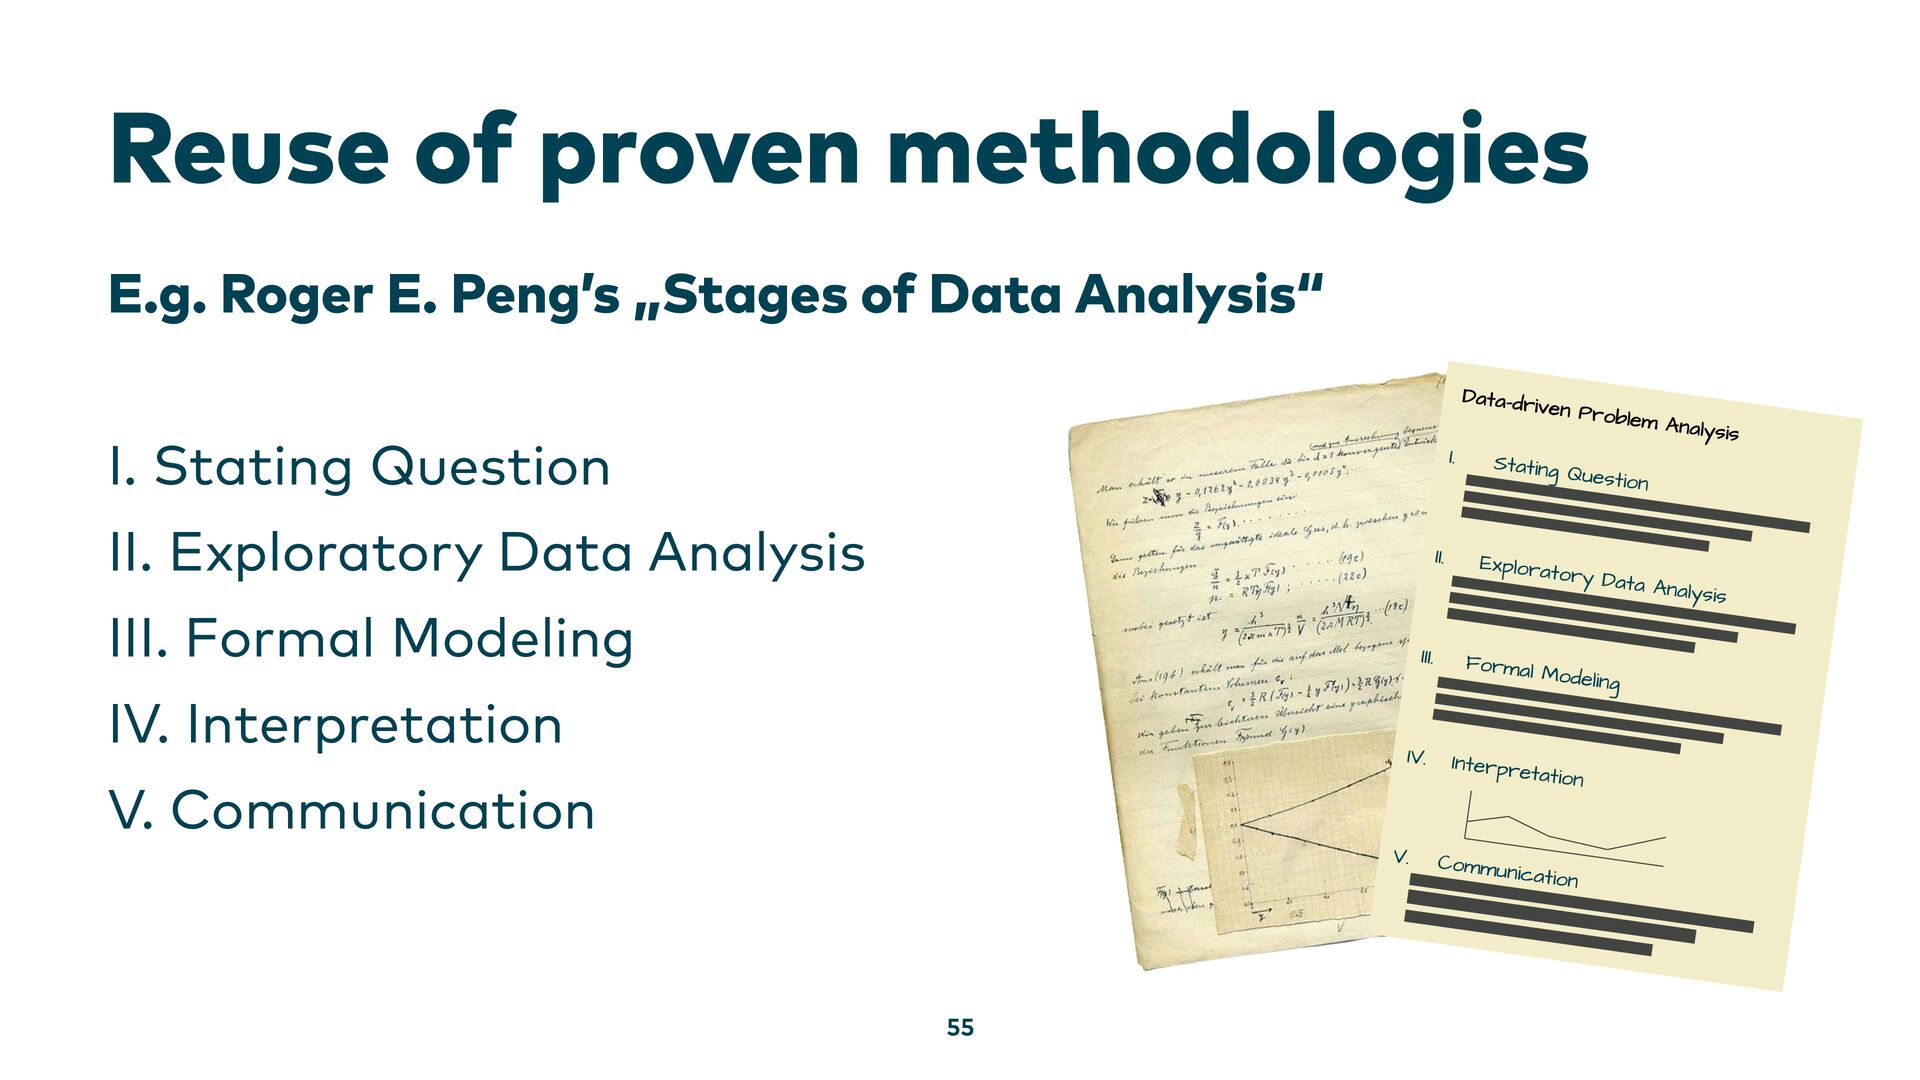
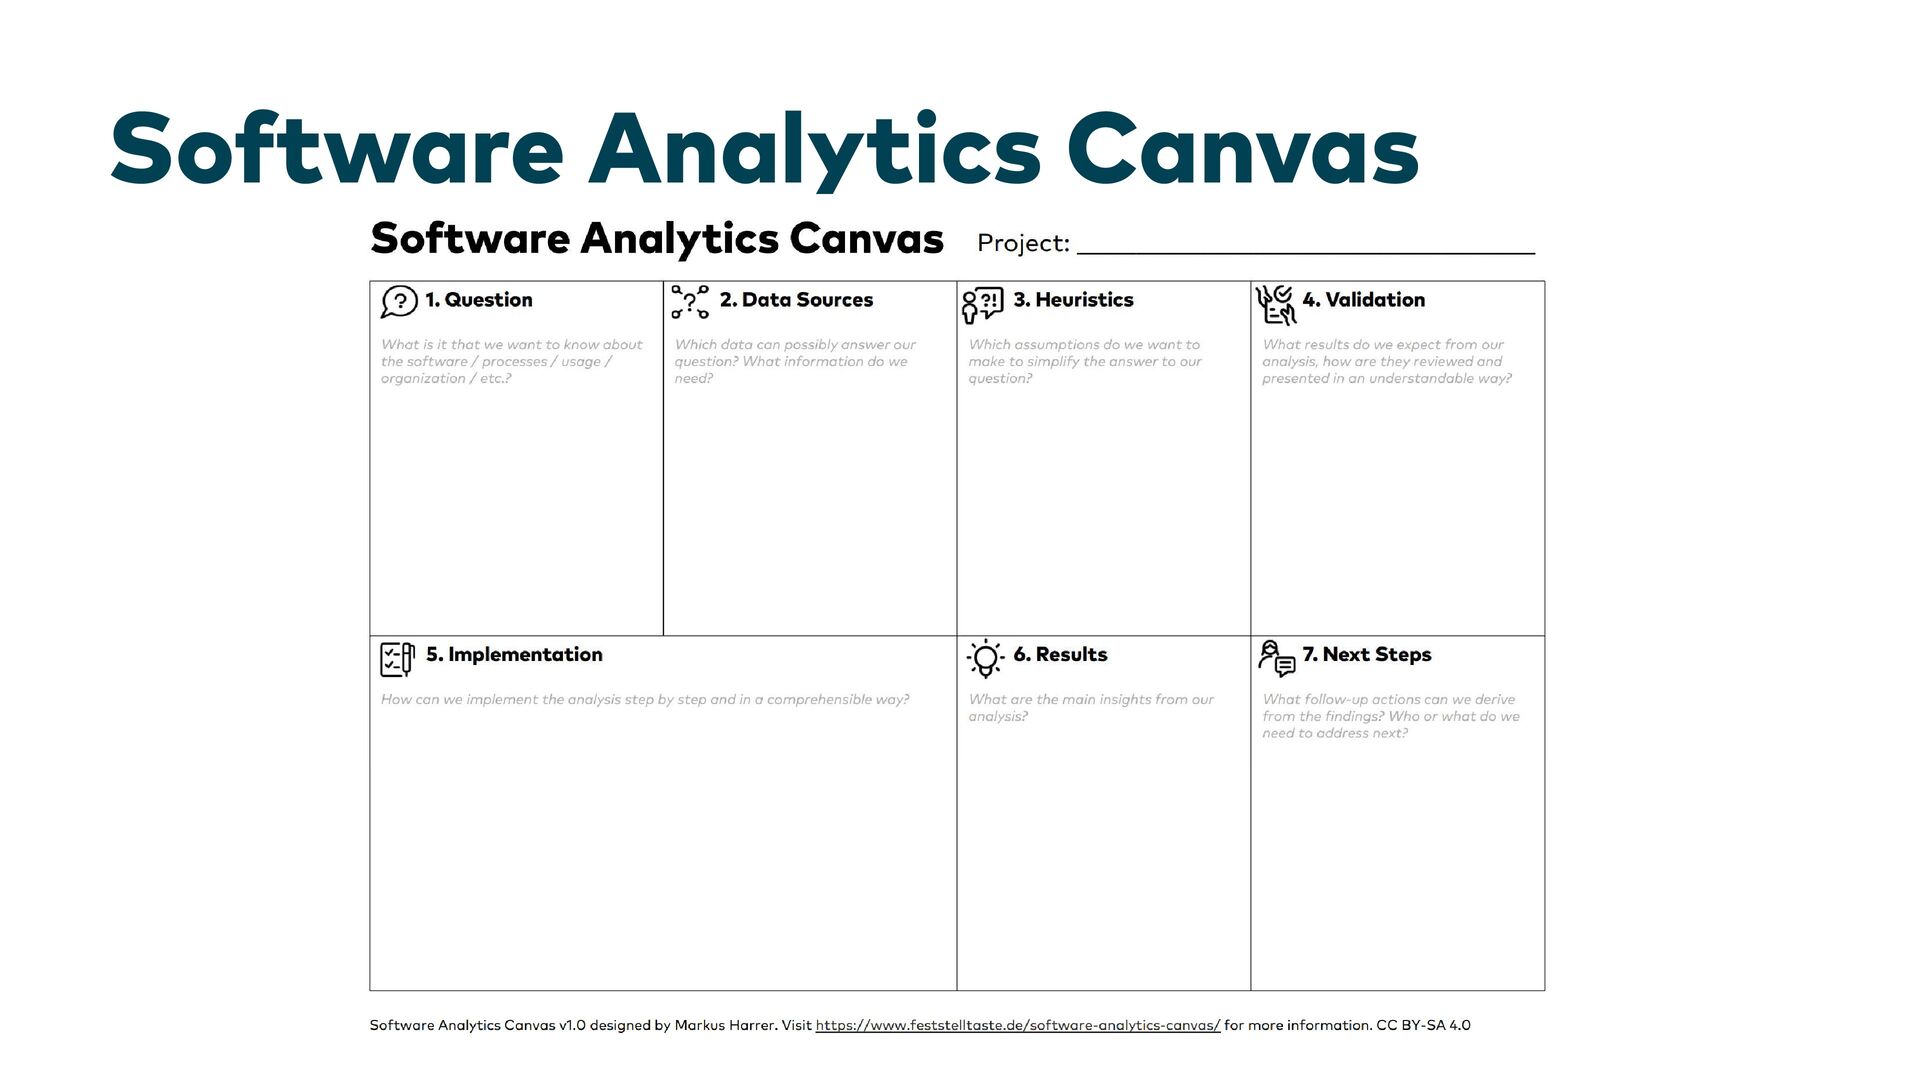
In this workshop we analyze data-driven software systems as well as the surrounding processes and organization in order to uncover weak points in the development and operation. As our foundation we use best practices and methodologies from the field of data science.
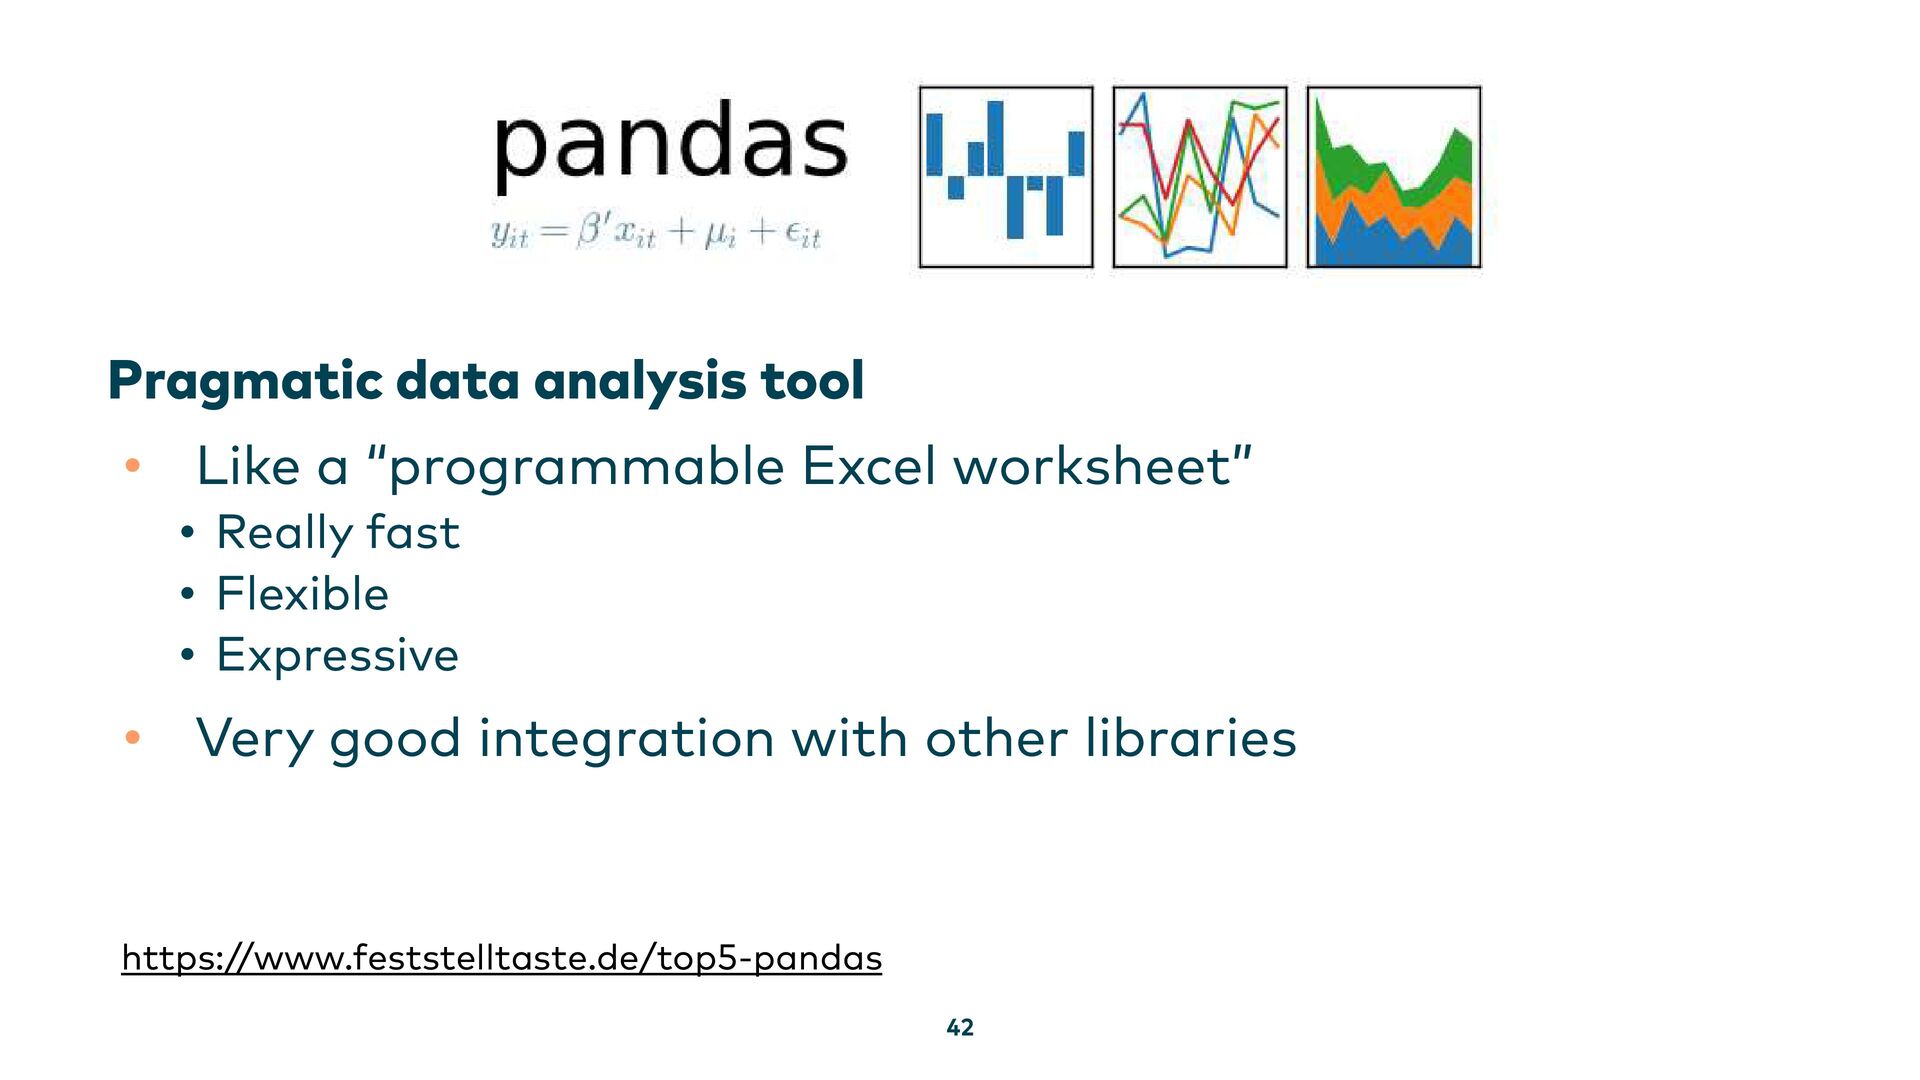
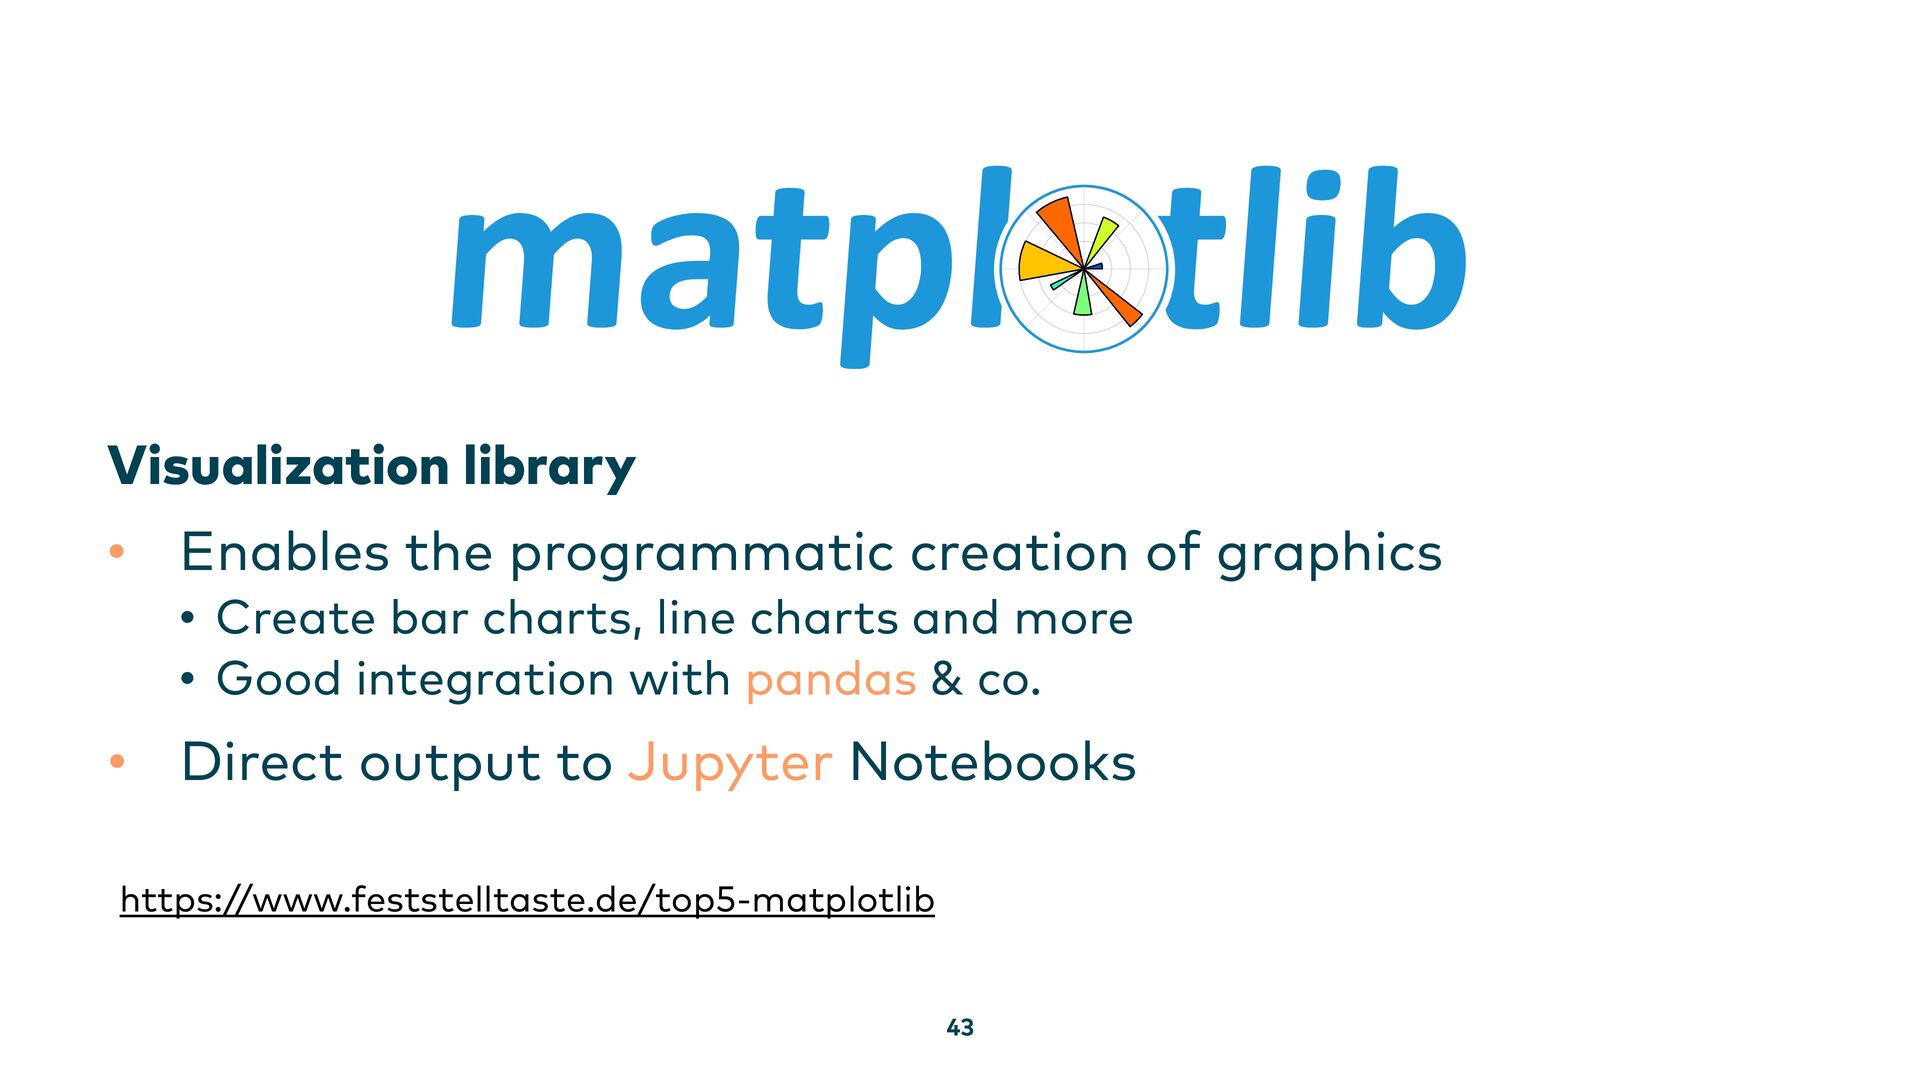
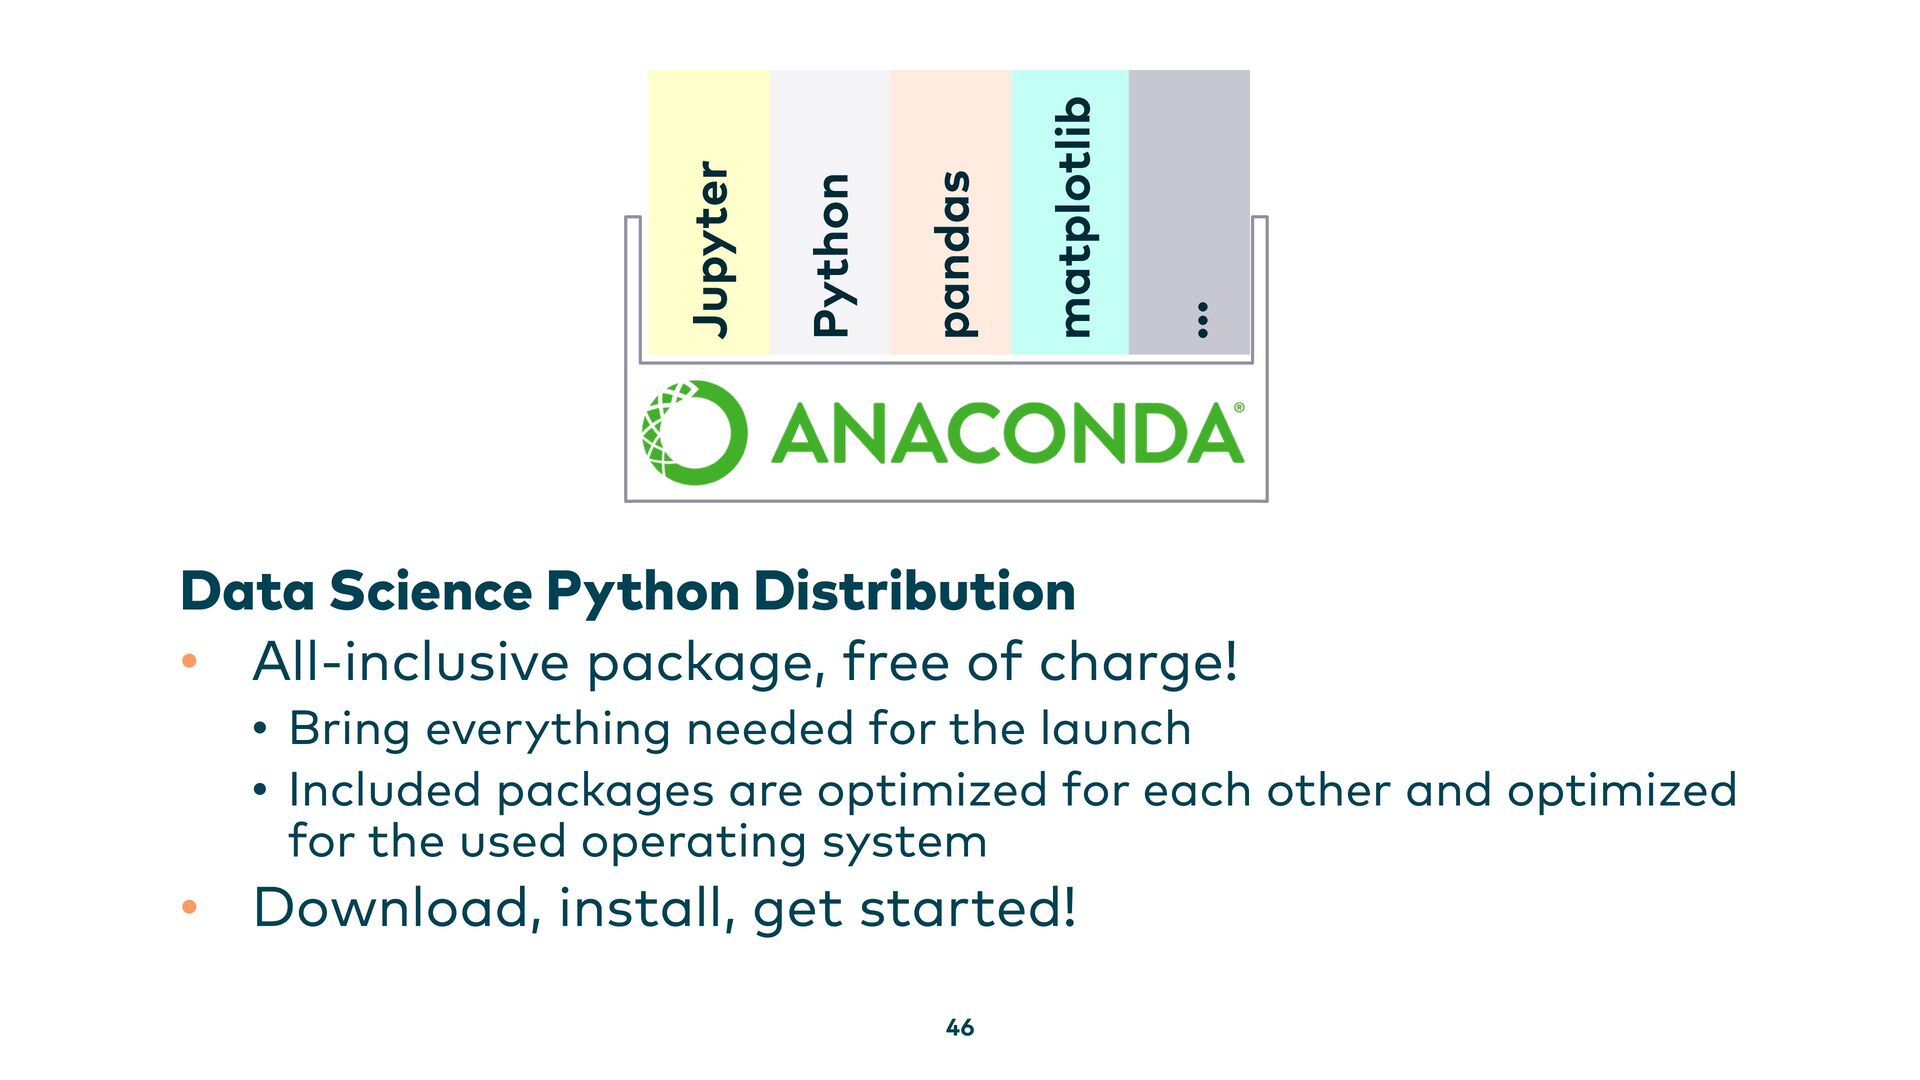
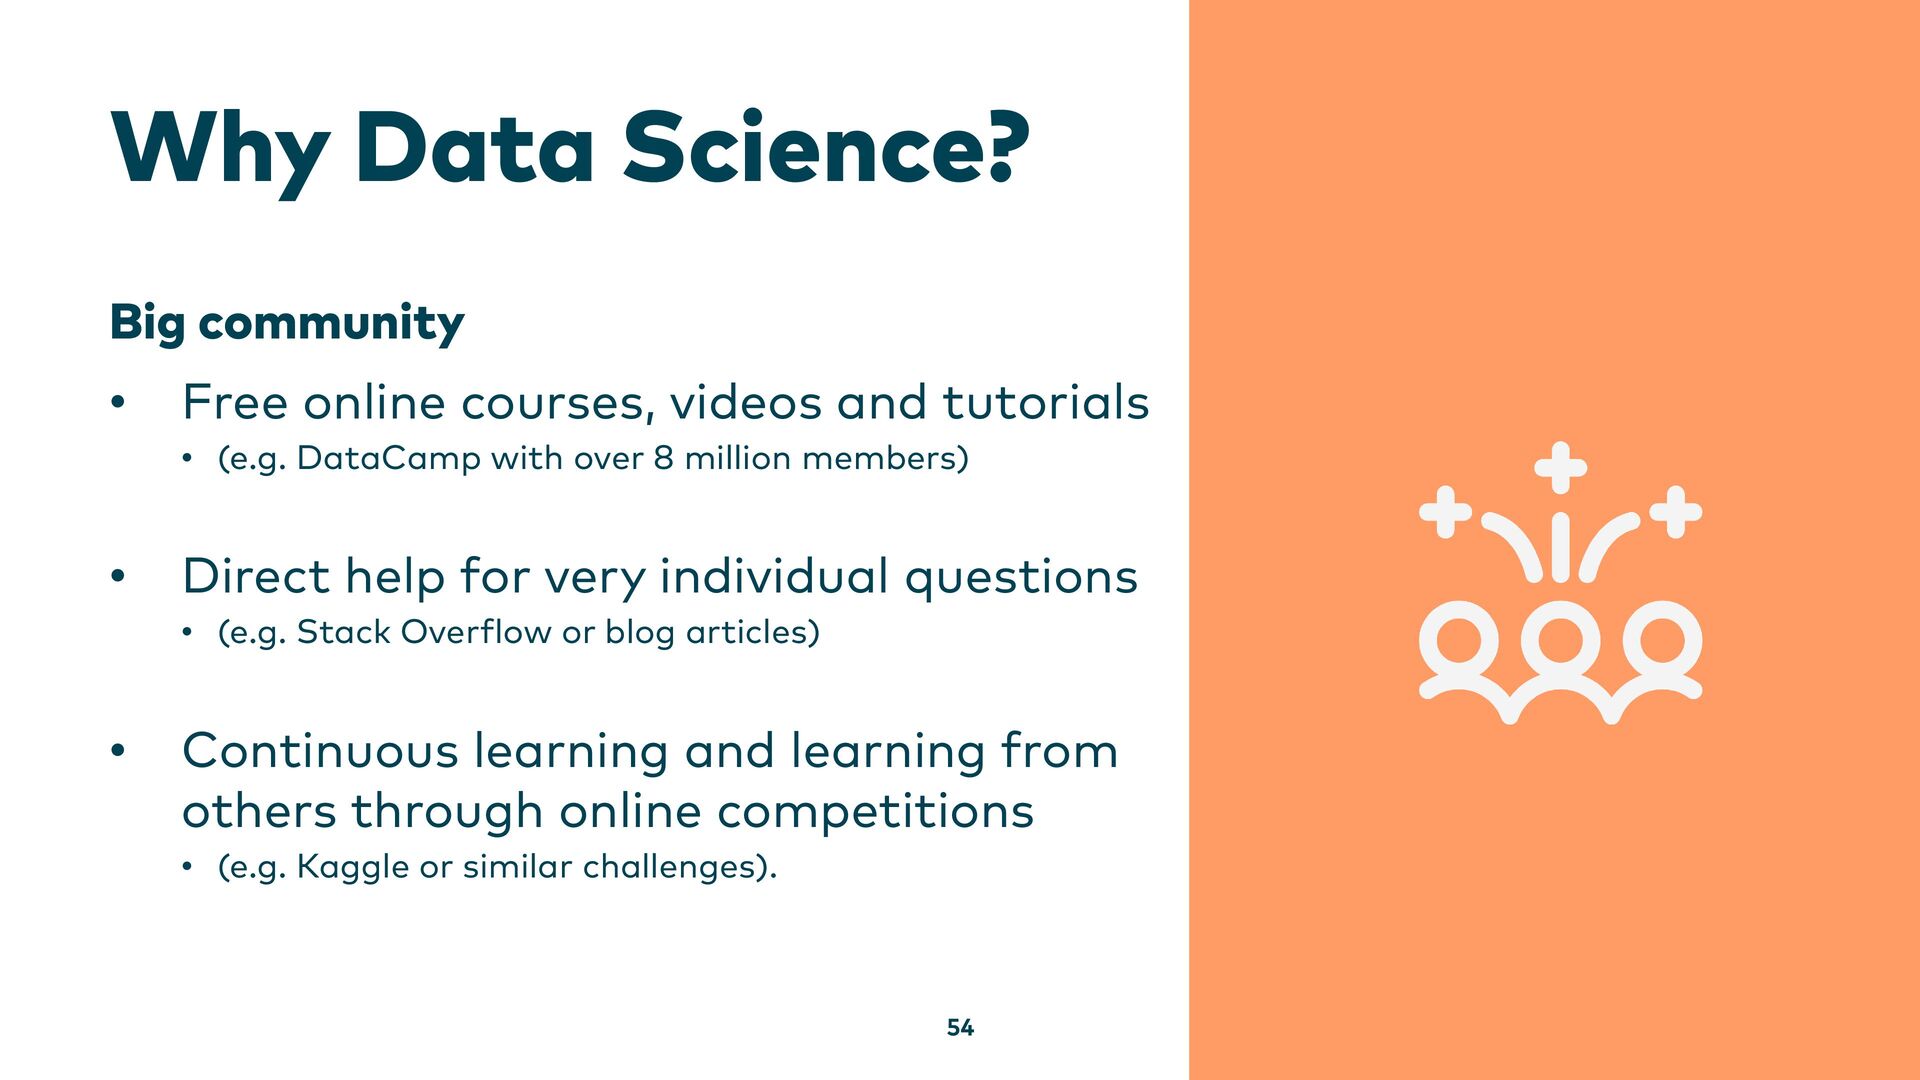
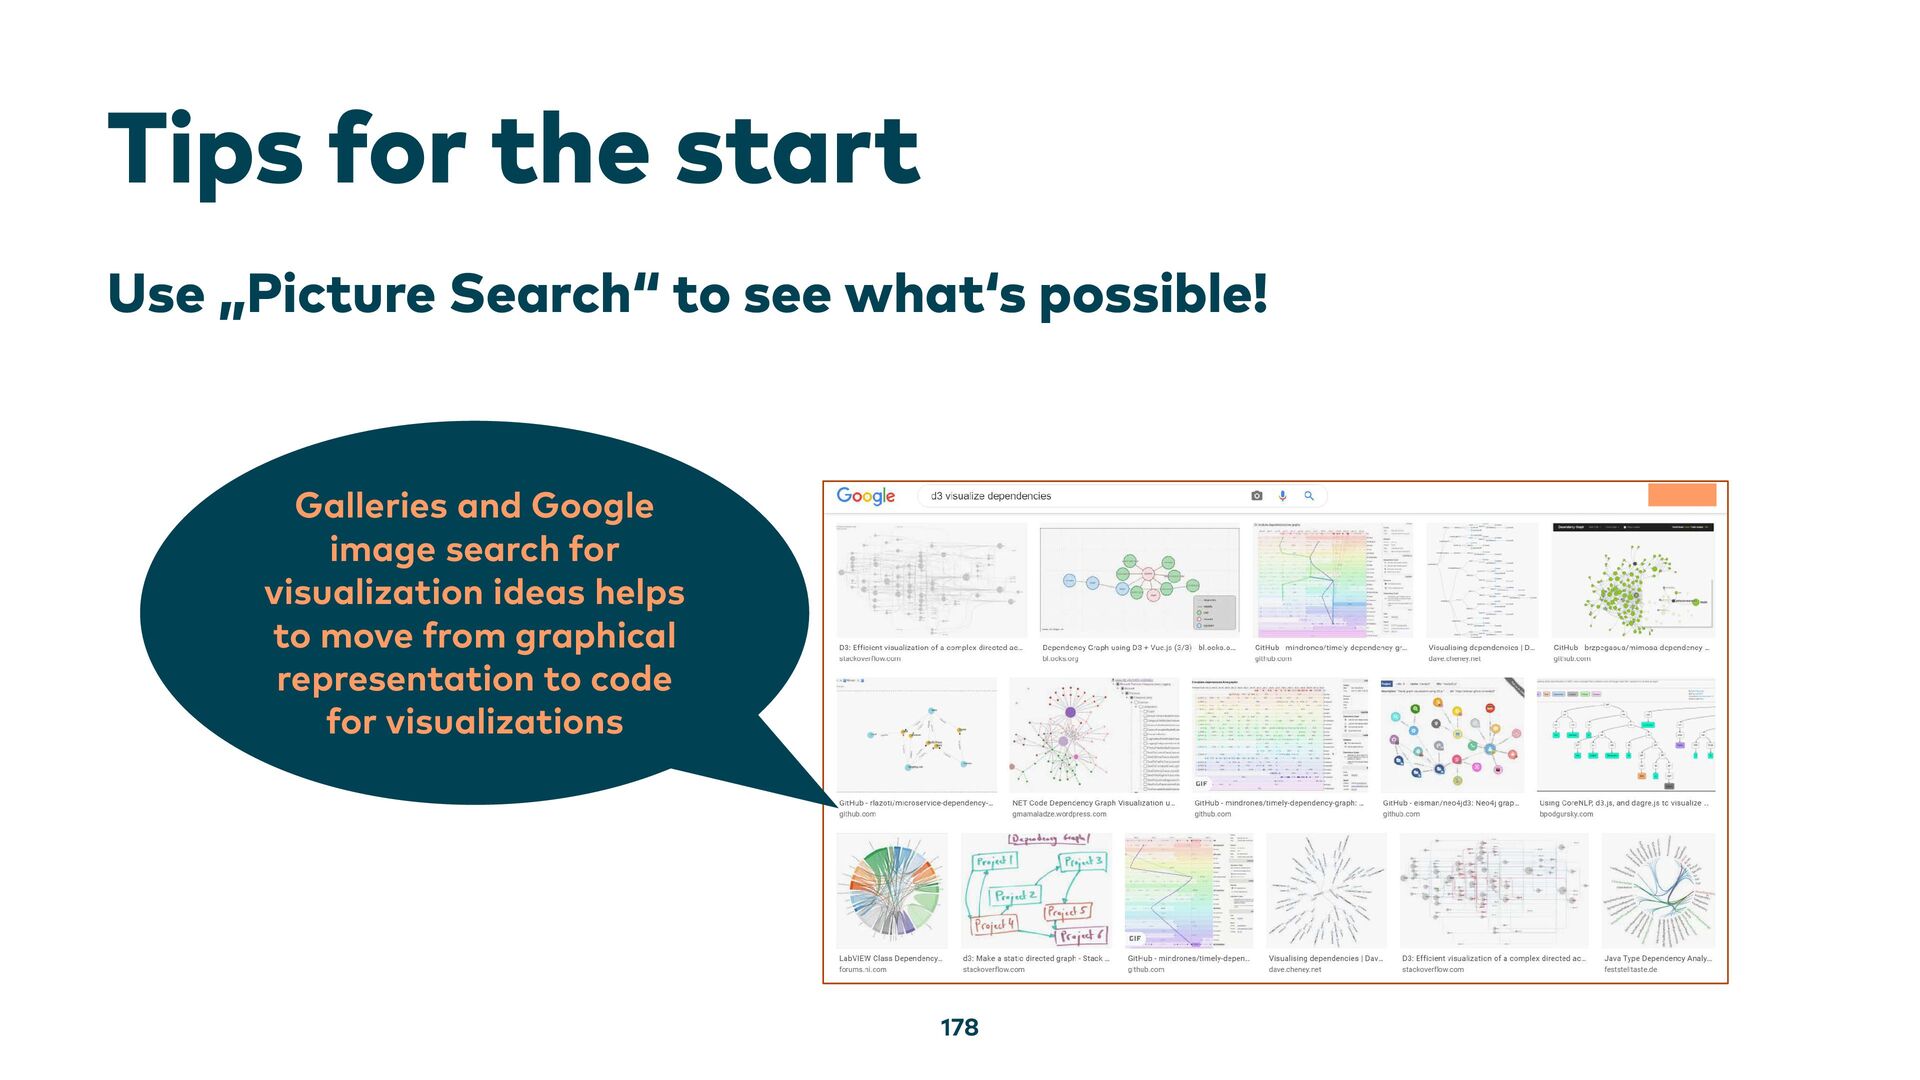
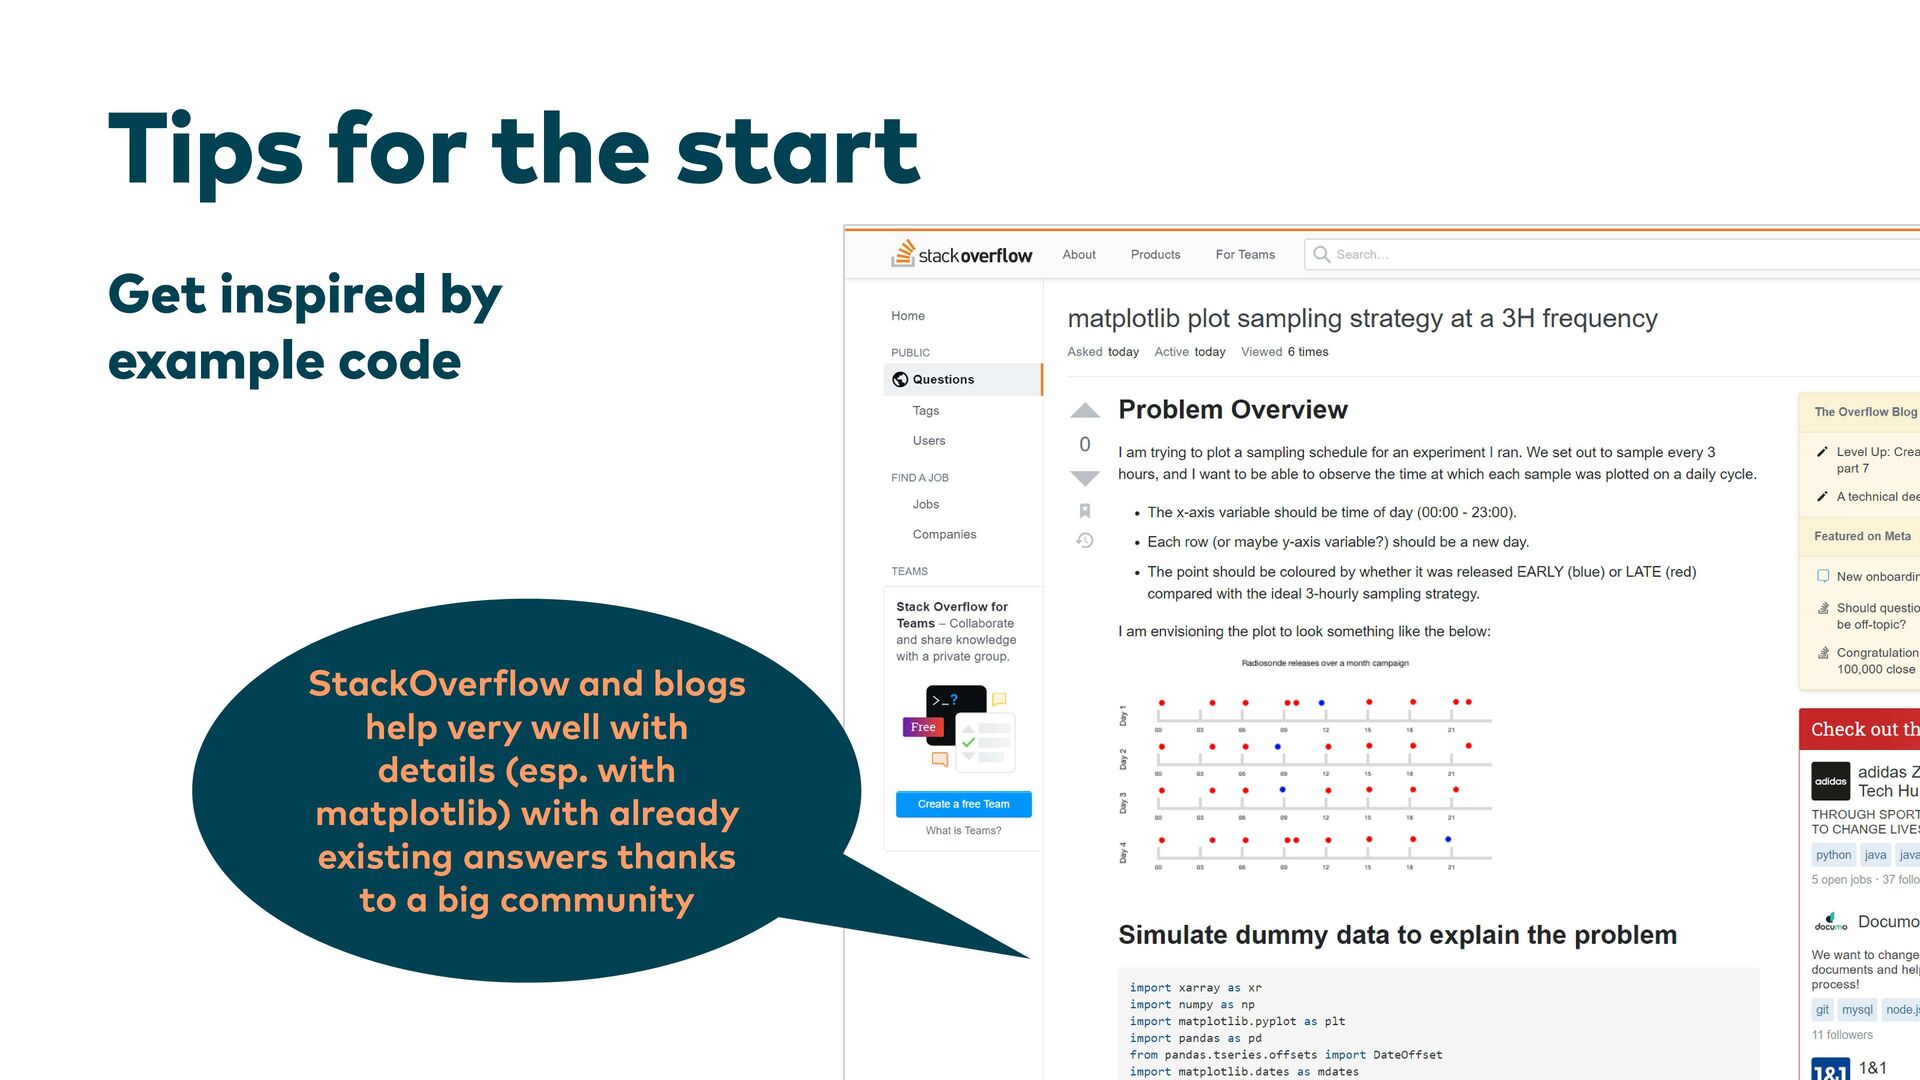
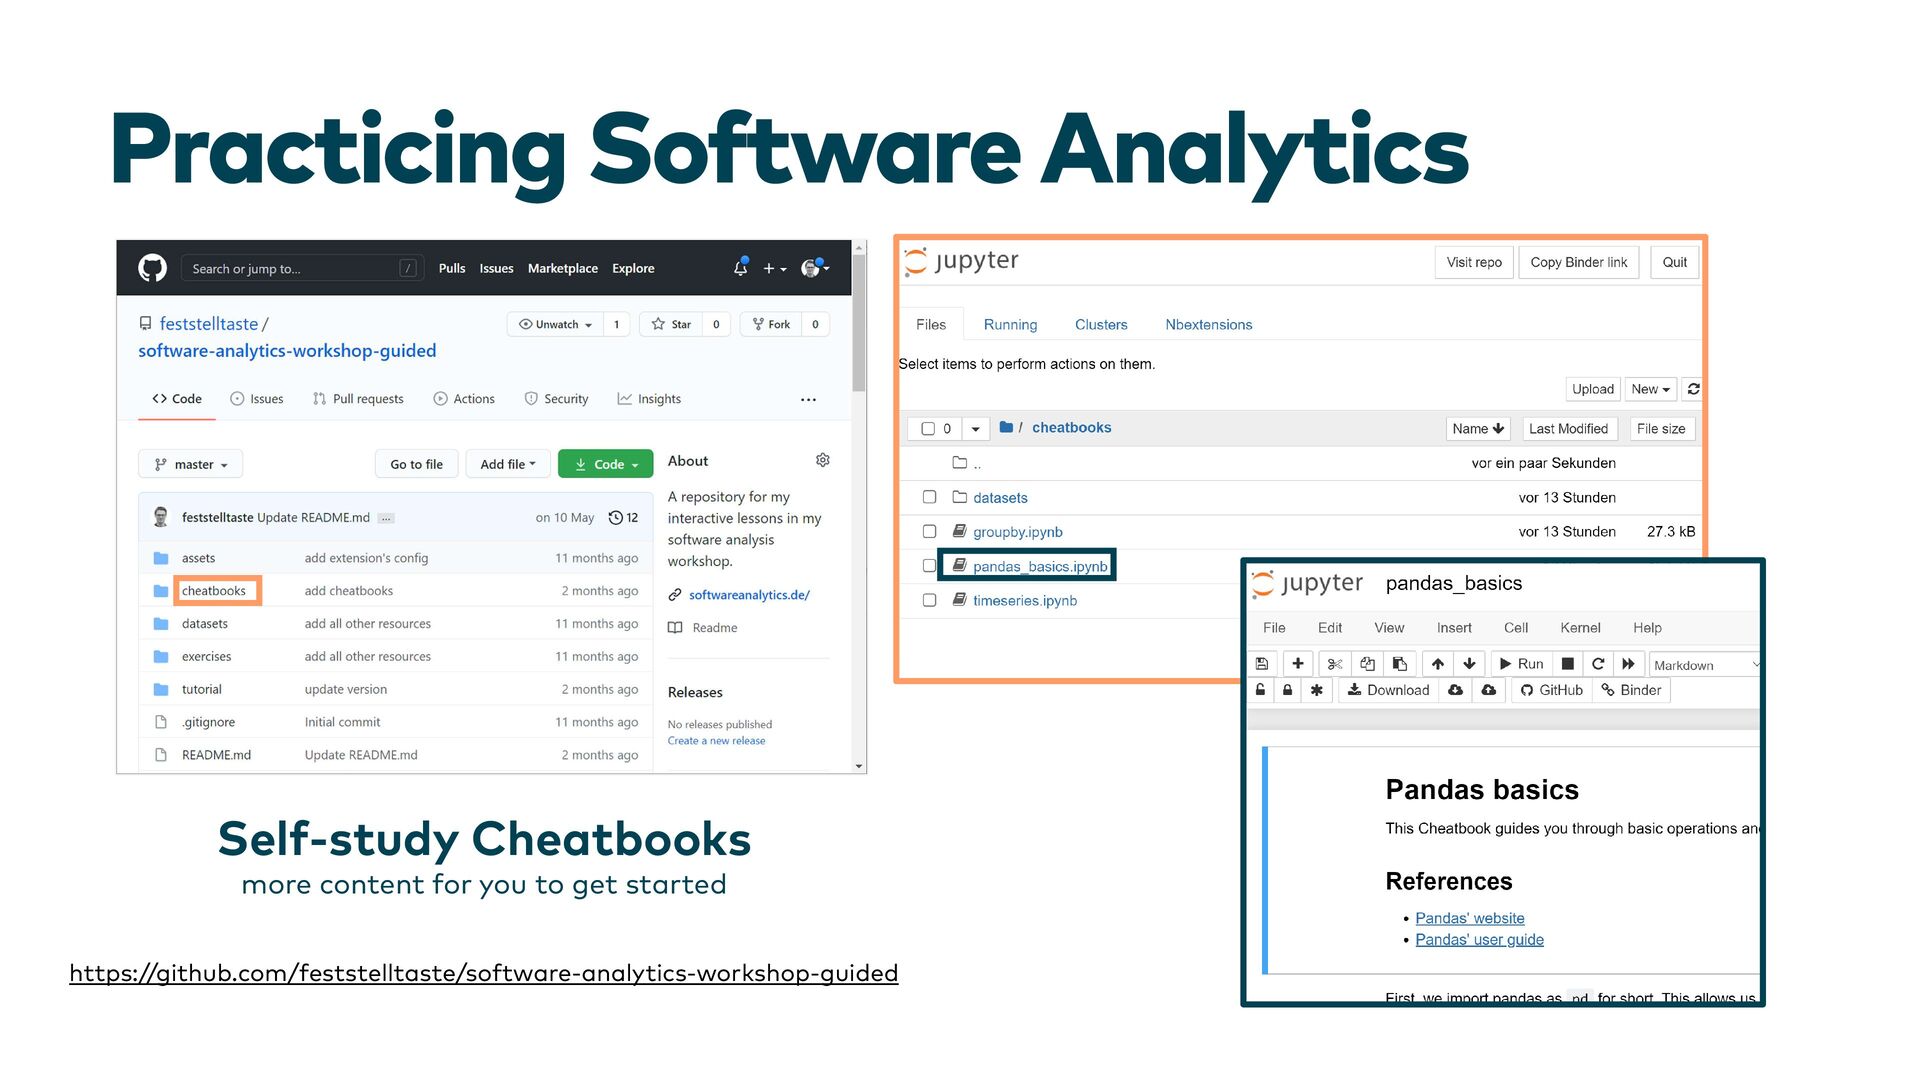
For the undertaking of our analysis we use open-source analysis tools. You can use these yourself after the workshop without charge. Thanks to the large community behind these tools, an abundance of tips and further knowledge will be at hand.
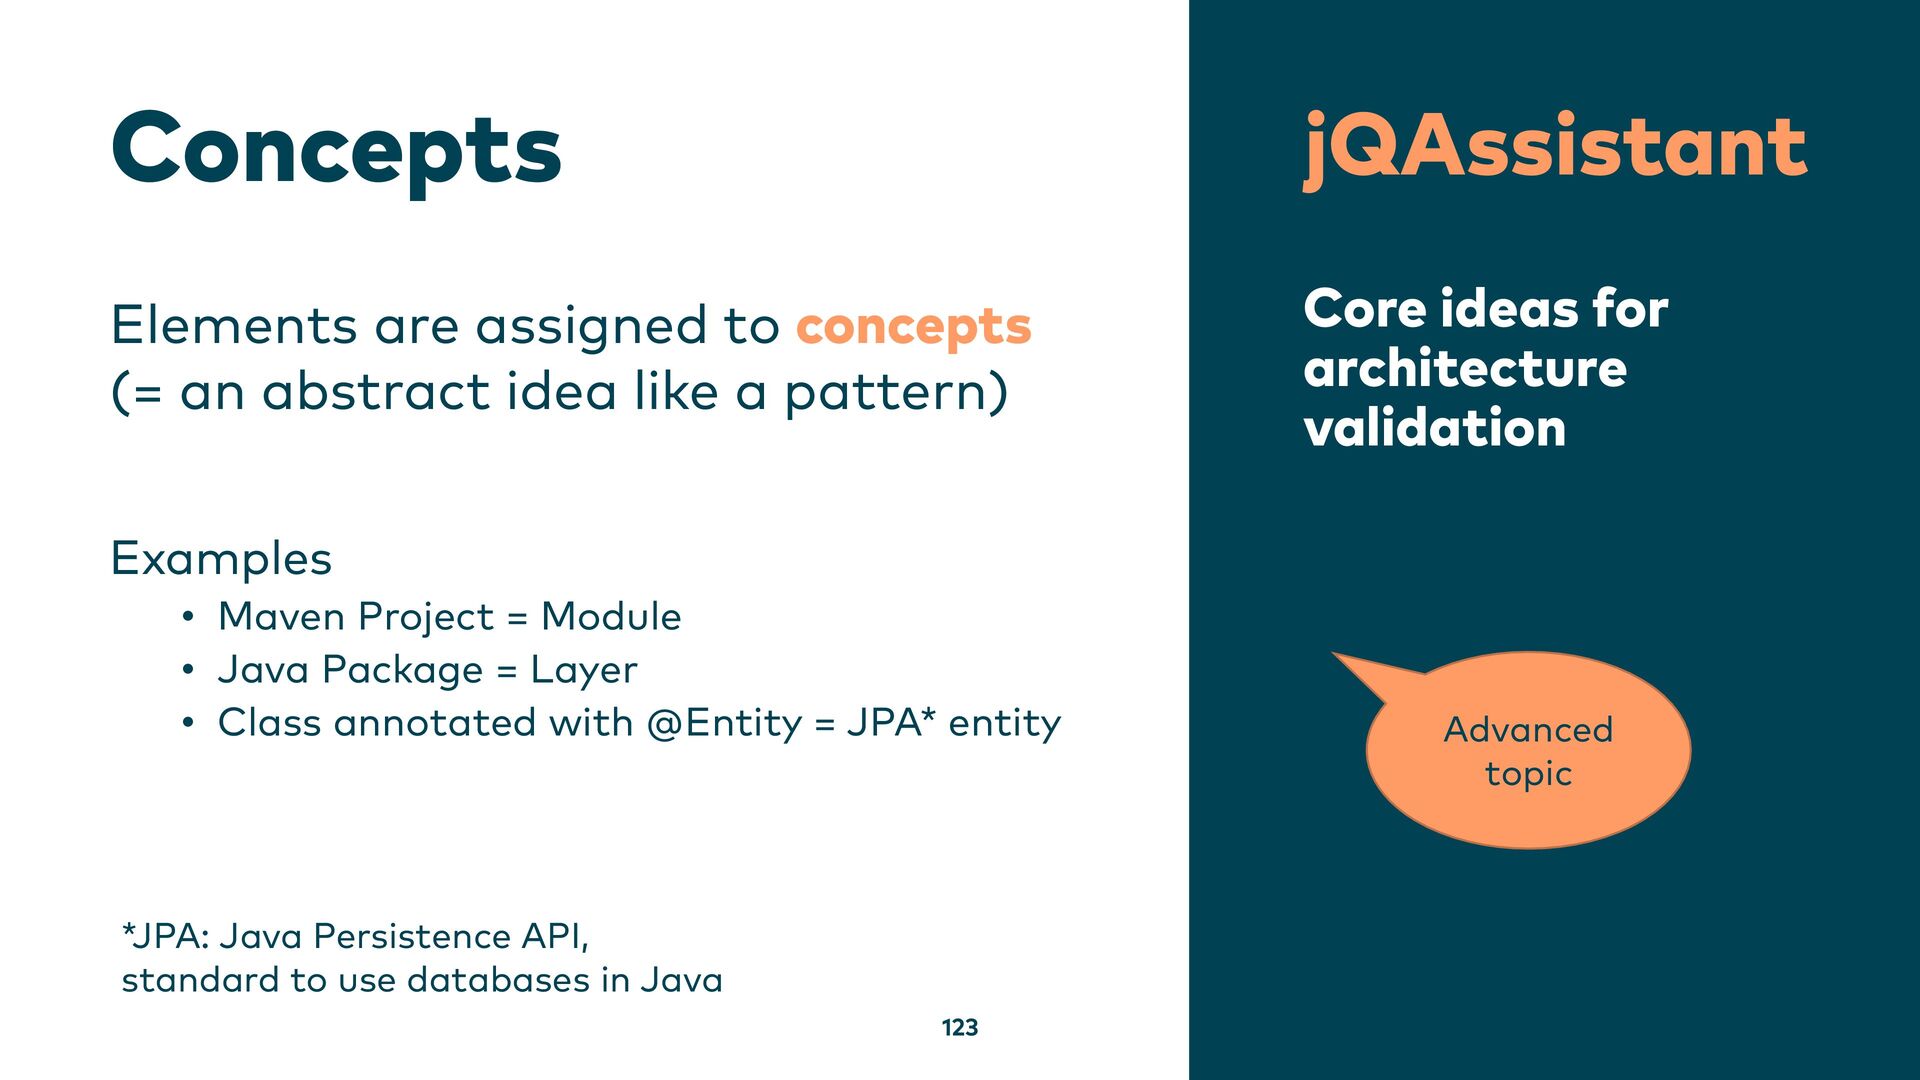
![Definition of a Concept 124 == JPA Entities [[jpa2:Entity]] Any](https://files.speakerdeck.com/presentations/a93205d9bdec439d9ce08925bd0ed849/slide_123.jpg)
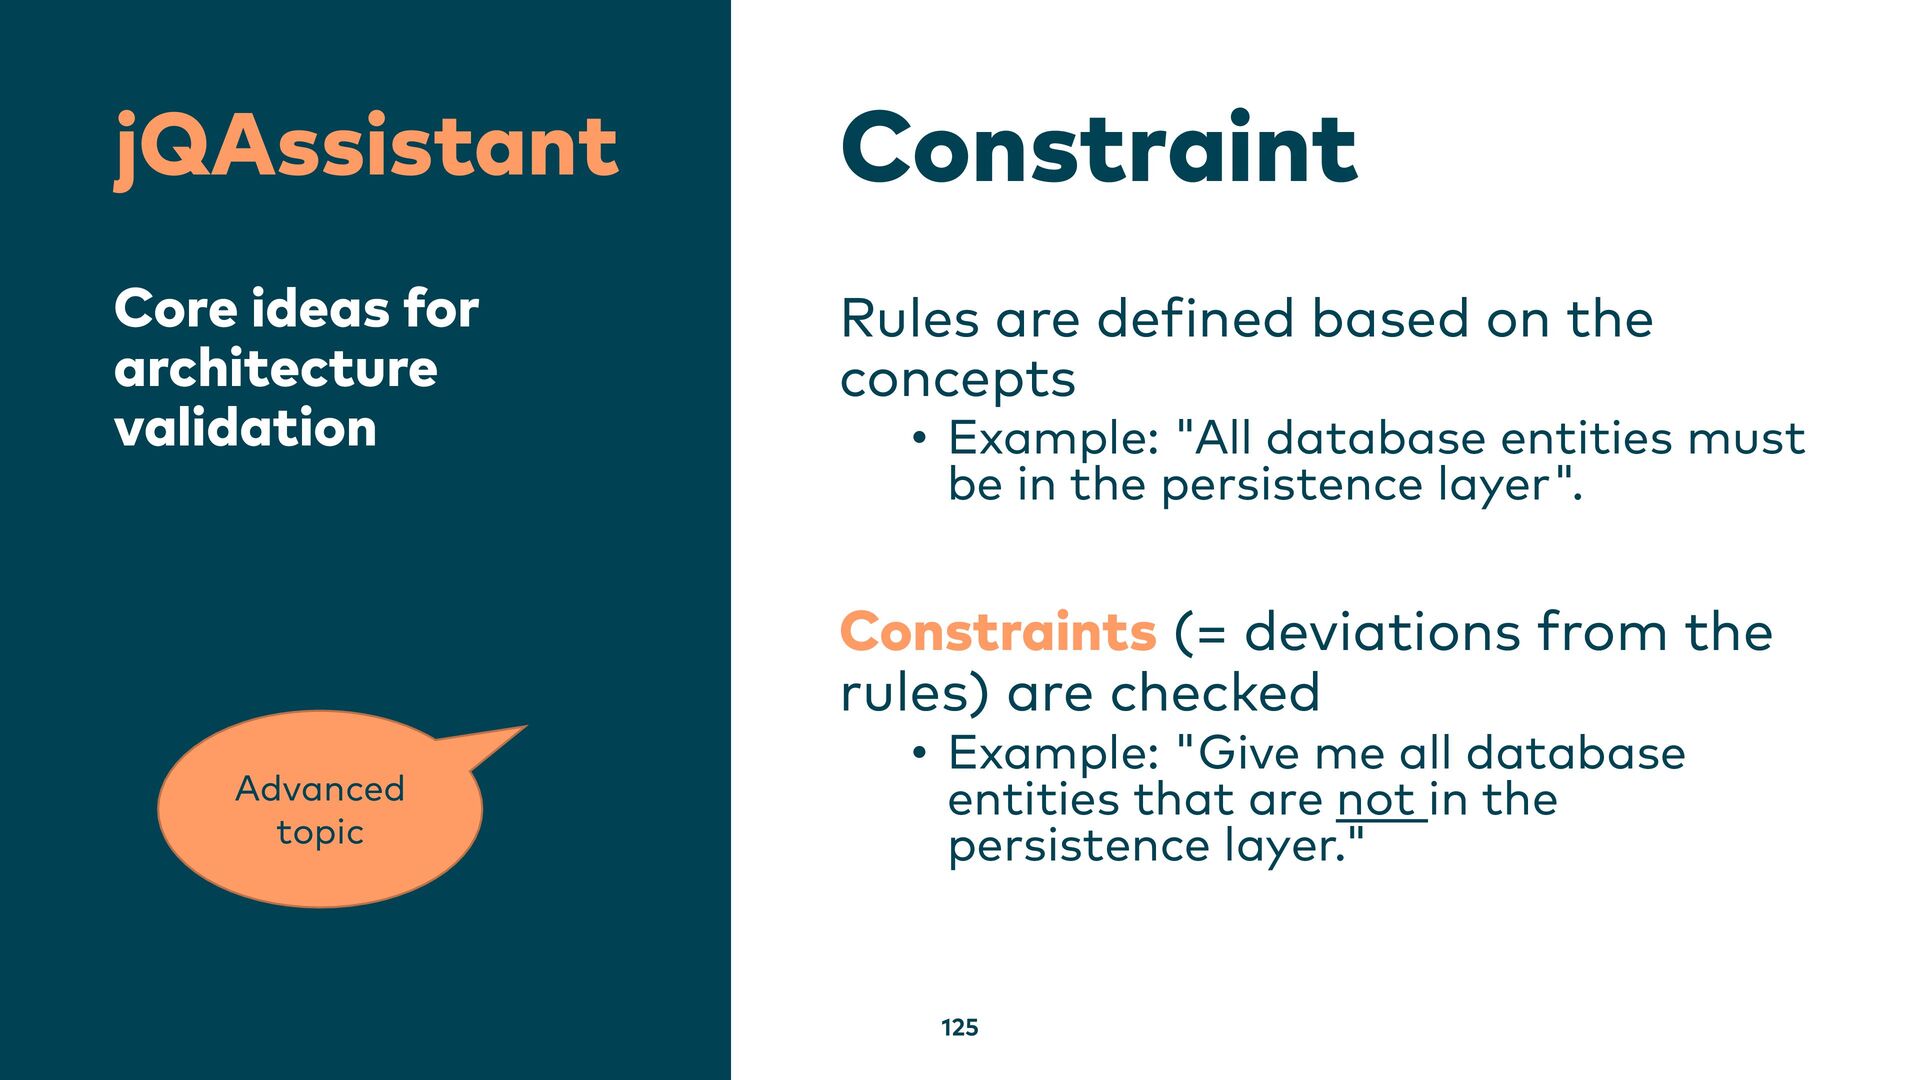
![Definition of a Constraint 126 [[model:JpaEntityInModelPackage]] All JPA entities must](https://files.speakerdeck.com/presentations/a93205d9bdec439d9ce08925bd0ed849/slide_125.jpg)
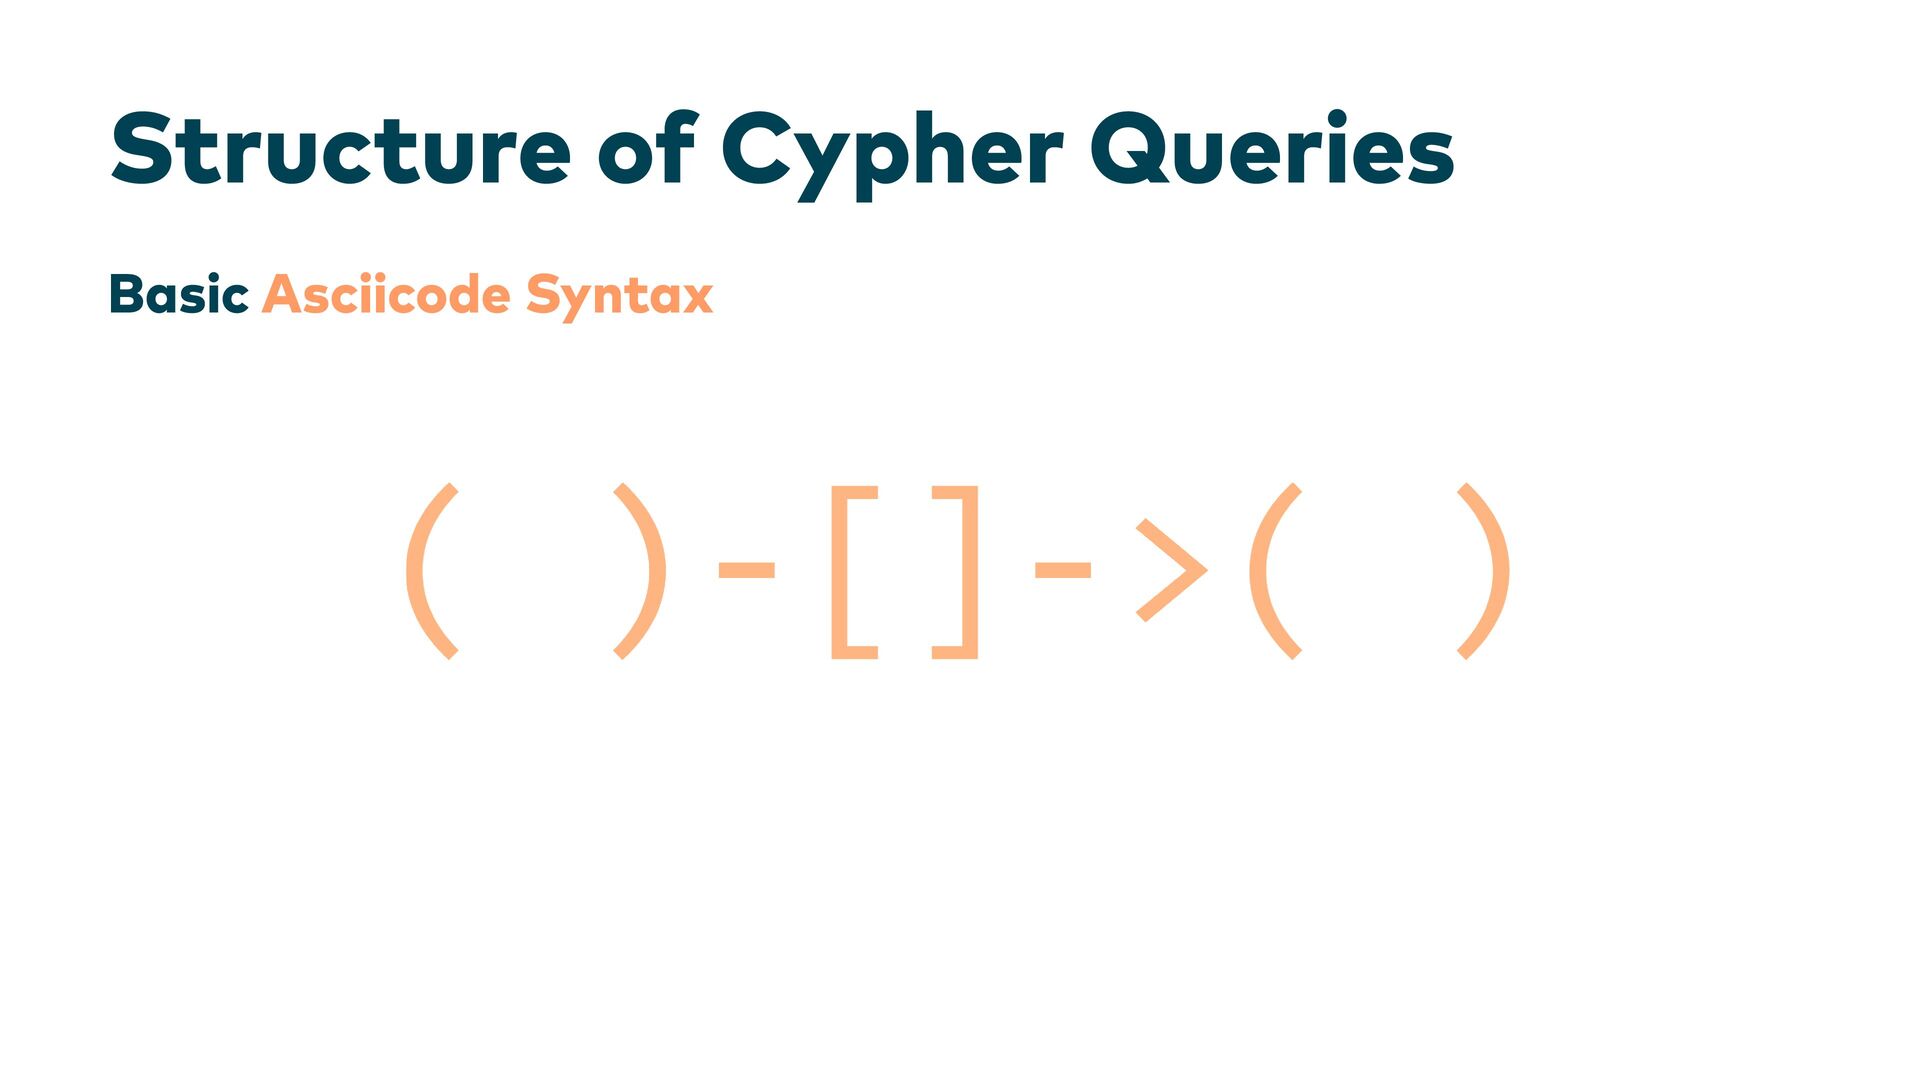
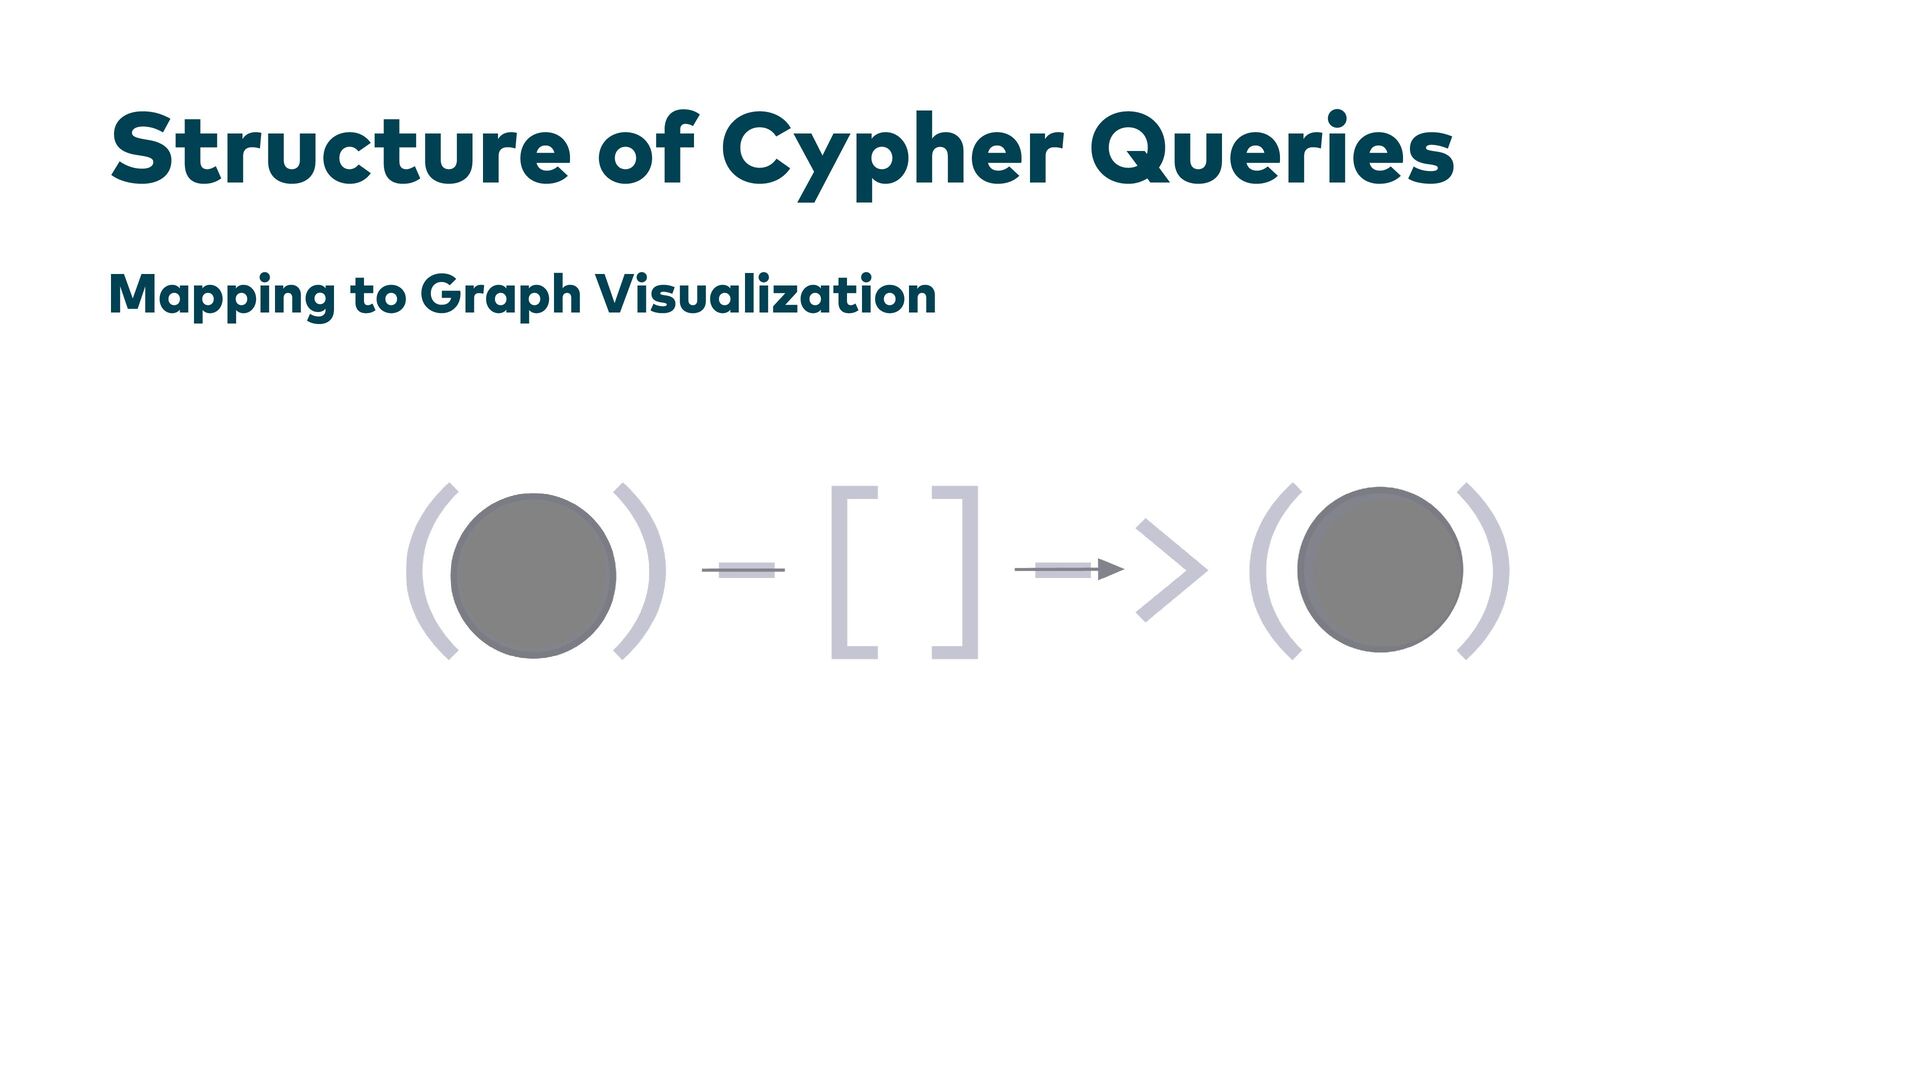
![Structure of Cypher Queries Nodes and Edges ()-[]->()](https://files.speakerdeck.com/presentations/a93205d9bdec439d9ce08925bd0ed849/slide_148.jpg)
![Structure of Cypher Queries Variables (p)-[]->(e)](https://files.speakerdeck.com/presentations/a93205d9bdec439d9ce08925bd0ed849/slide_149.jpg)
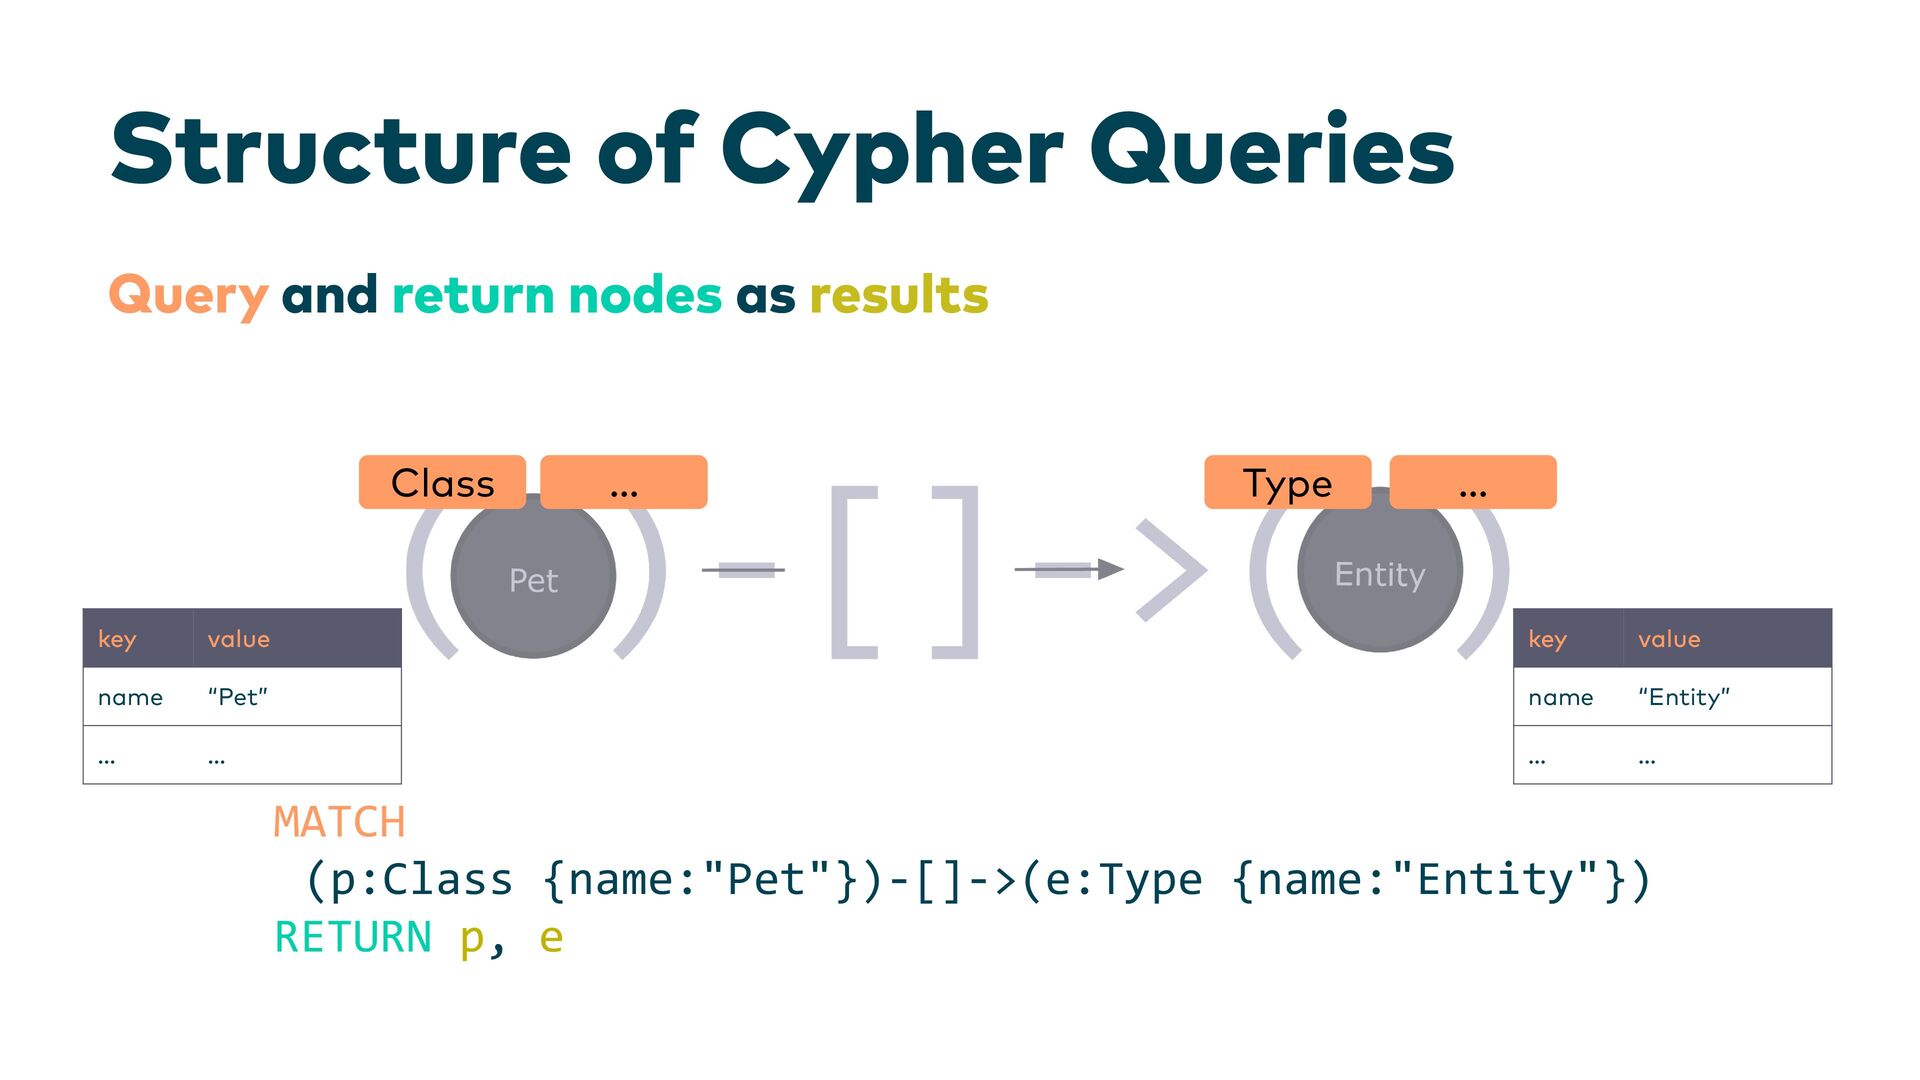
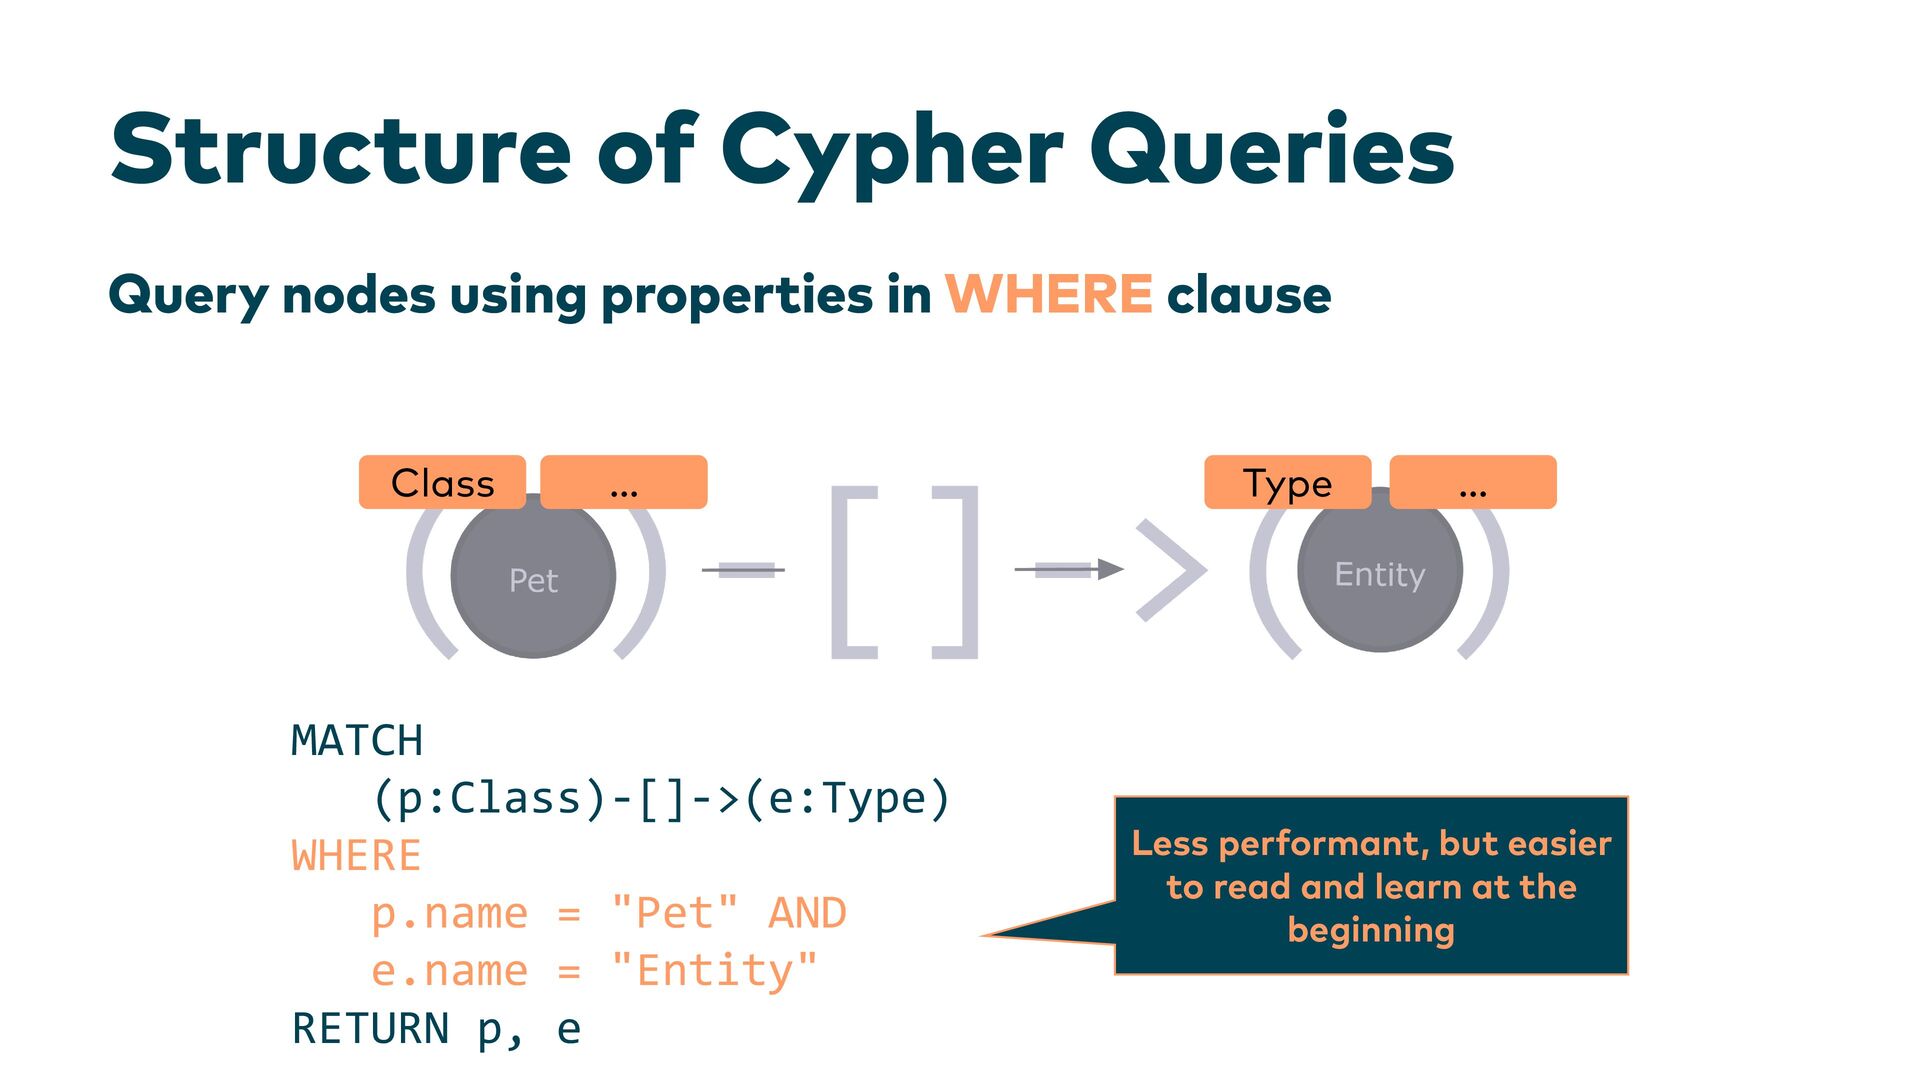
![Structure of Cypher Queries Labels (p:Class)-[]->(e:Type) Type Type Class Class](https://files.speakerdeck.com/presentations/a93205d9bdec439d9ce08925bd0ed849/slide_150.jpg)
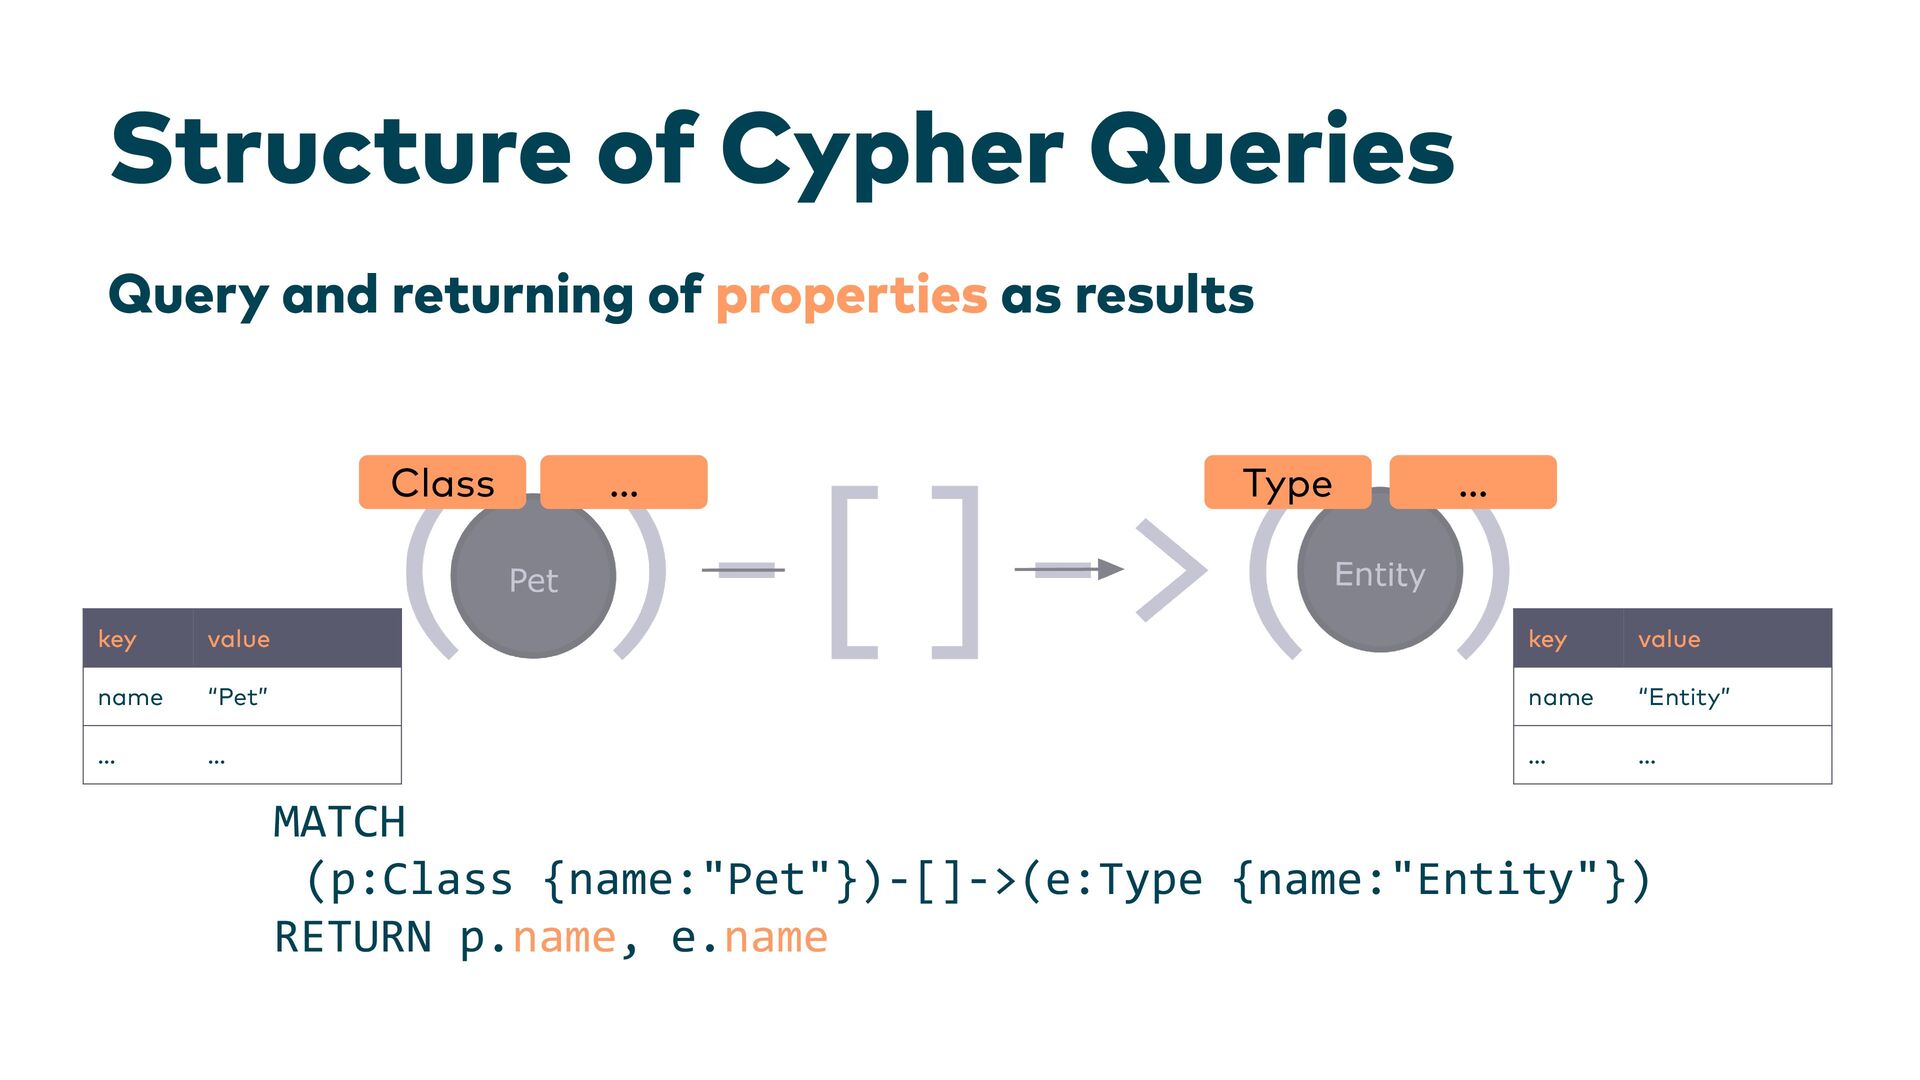
![Structure of Cypher Queries Properties and Values (p:Class {name:"Pet"})-[]->(e:Type {name:"Entity"})](https://files.speakerdeck.com/presentations/a93205d9bdec439d9ce08925bd0ed849/slide_151.jpg)