Share
Embed
カイ二乗検定は何をやっているのか/What_Does_the_Chi-Square_Test_Do
florets1
December 01, 2024
Transcript
31 slides
-
2 私がカイ二乗検定に納得するまで 1. 頻度論を離れてベイズ統計の視点で考えてみた。 2. その後、頻度論に戻って考え直した。 My Journey to Understanding
the Chi-Square Test Considered it from a Bayesian statistical perspective, leaving frequentist reasoning behind. Returned to frequentist reasoning to reevaluate it. -
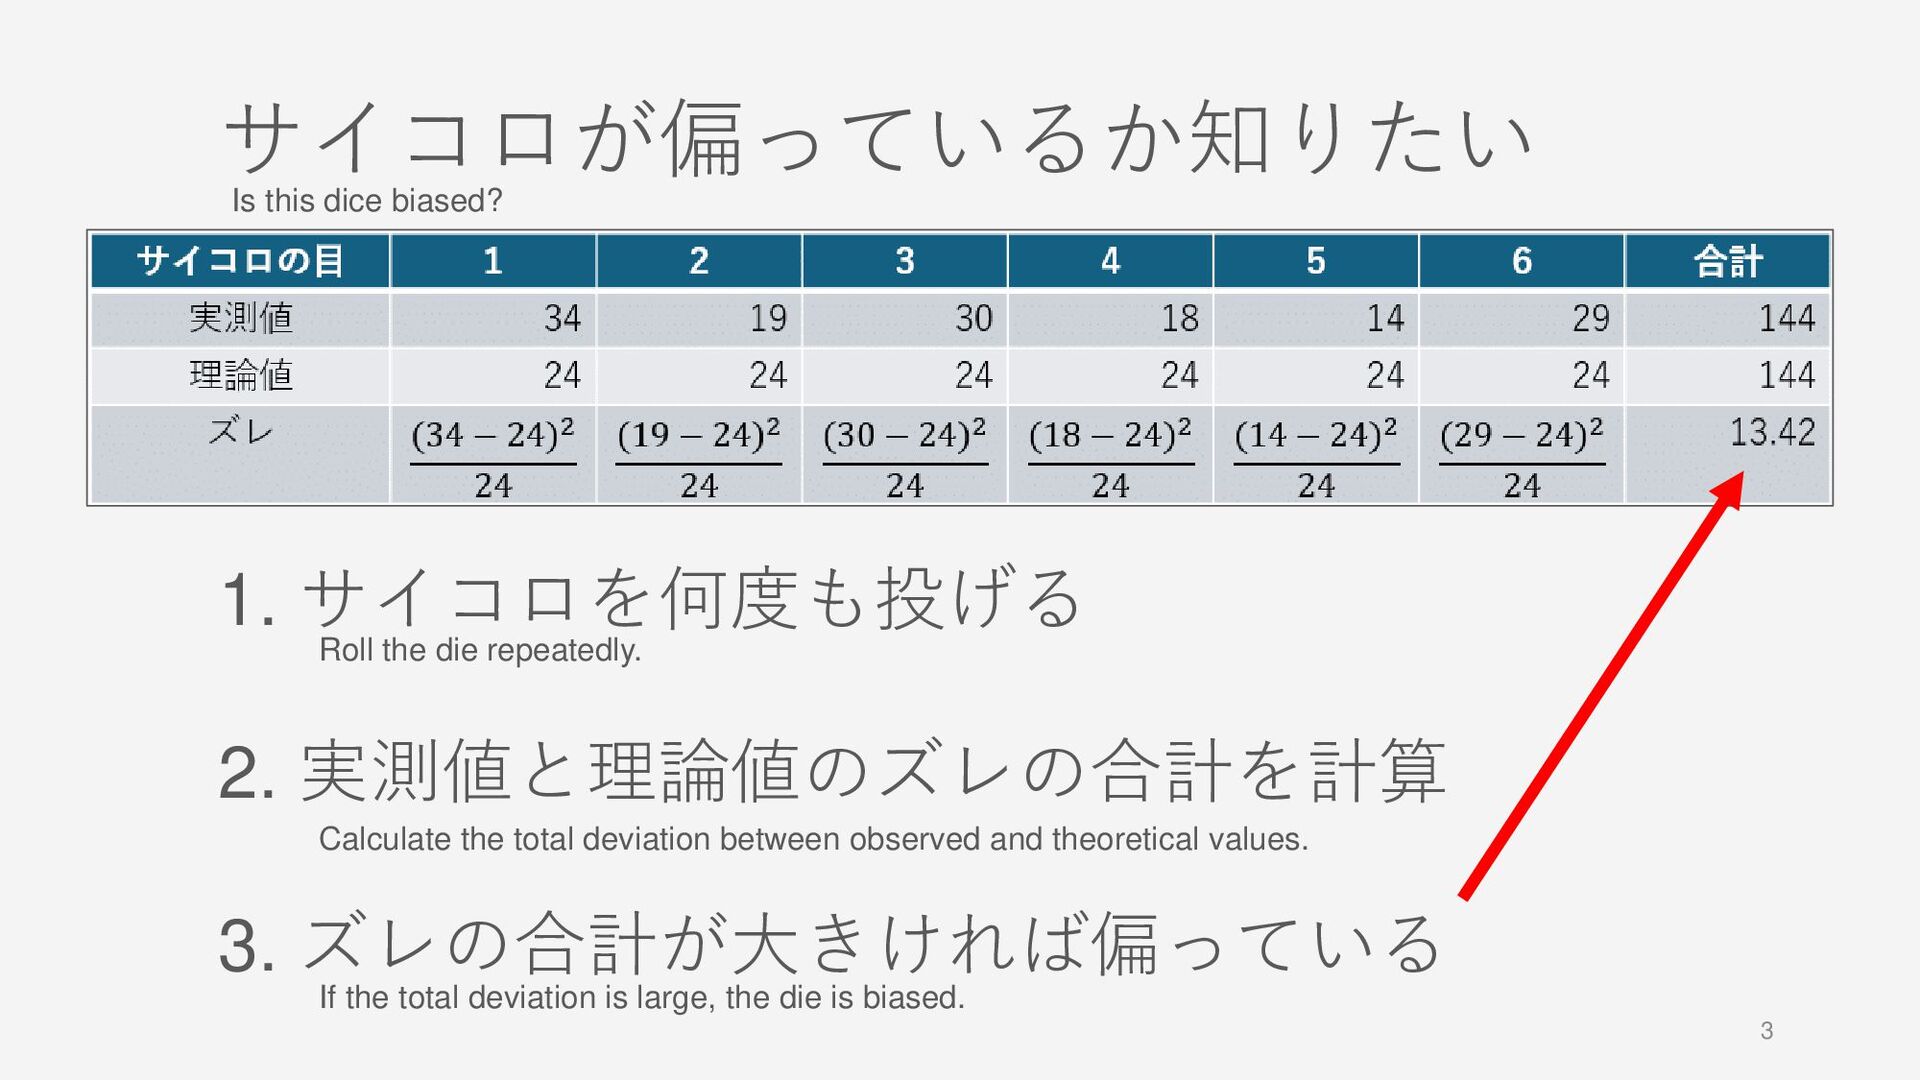
3 サイコロが偏っているか知りたい 1. サイコロを何度も投げる 2. 実測値と理論値のズレの合計を計算 3. ズレの合計が大きければ偏っている Is this
dice biased? Roll the die repeatedly. Calculate the total deviation between observed and theoretical values. If the total deviation is large, the die is biased. -
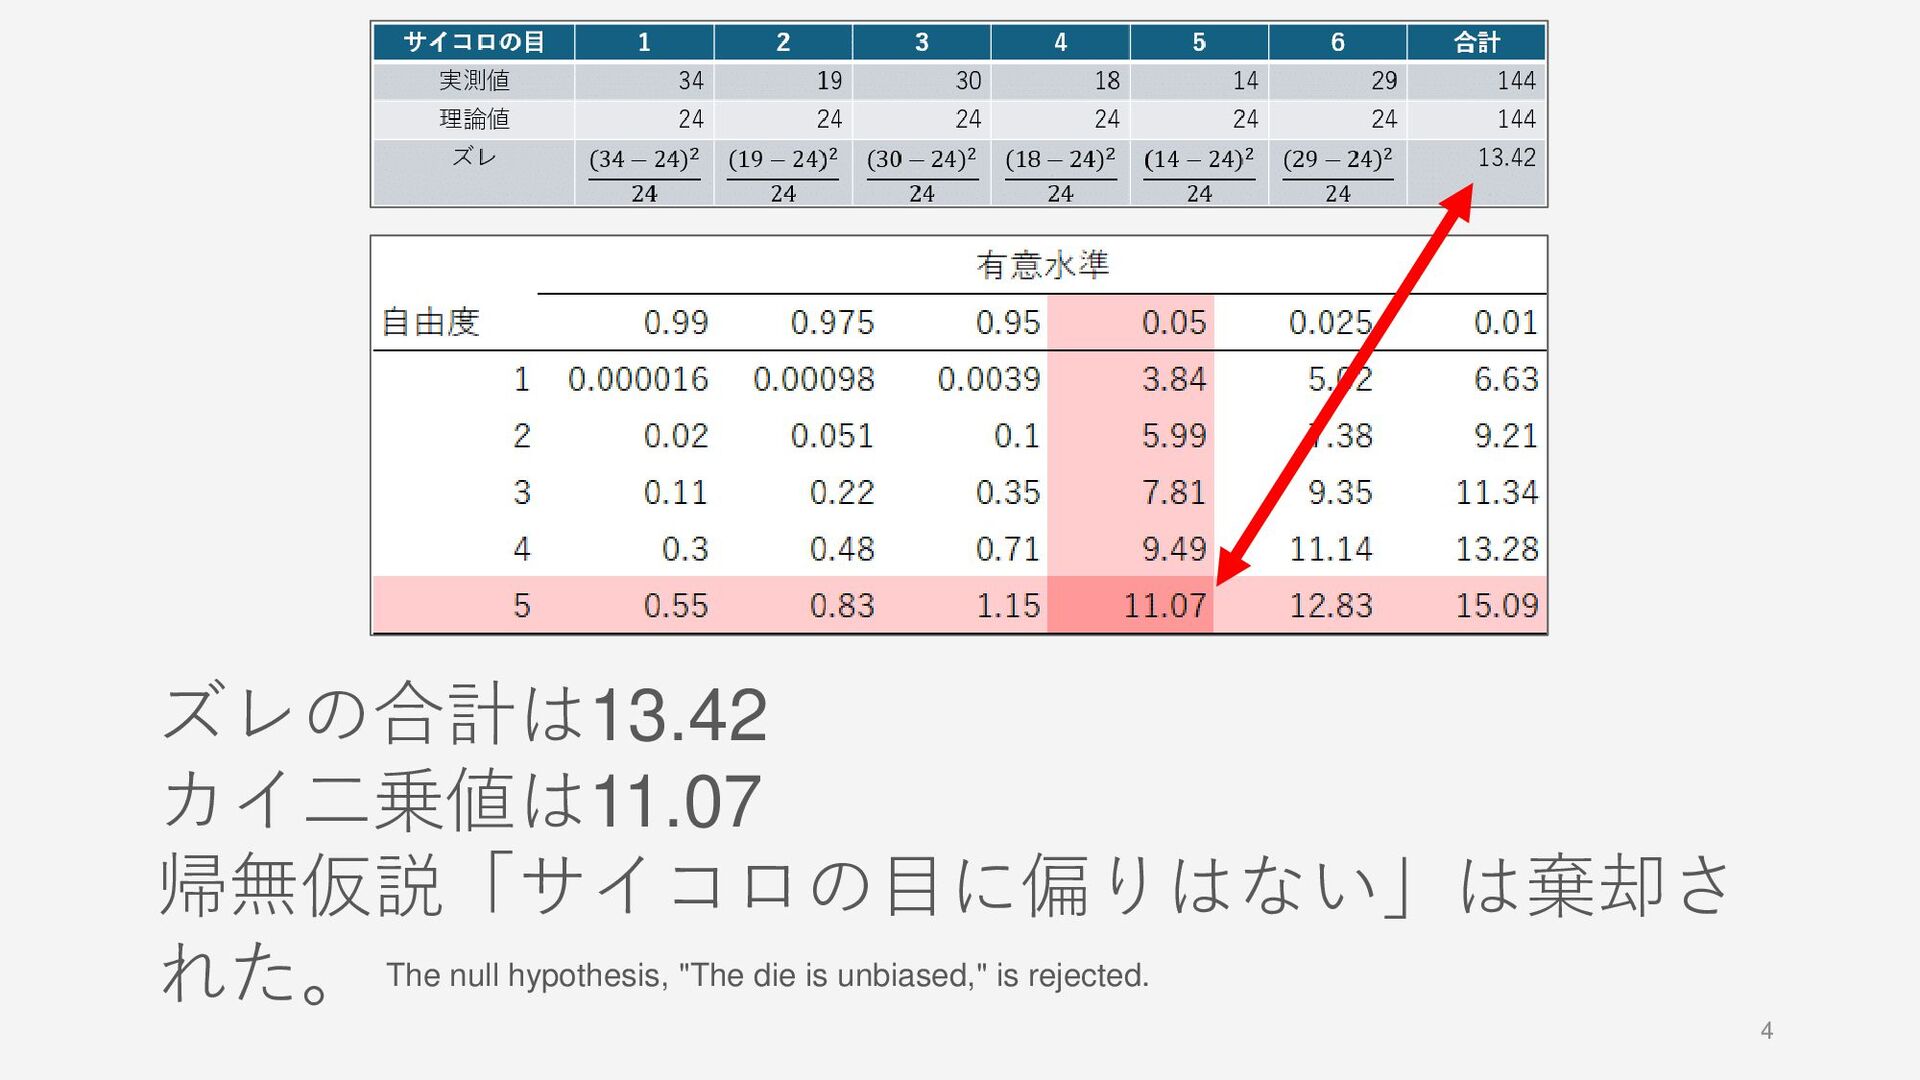
4 ズレの合計は13.42 カイ二乗値は11.07 帰無仮説「サイコロの目に偏りはない」は棄却さ れた。 The null hypothesis, "The die
is unbiased," is rejected. -
5 カイ二乗検定を使ってサイコロの偏りを検出できました が、みなさんはこの手続きを当たり前だ、自然な発想だ と感じますか?私は最初、とても複雑だと感じました。 そしてなぜこれほど回りくどく、大げさな方法を使うの かと疑問に思ったのです。 以降では頻度論を離れてベイズ統計の視点から、単純に 考える方法を示します。その後、再び頻度論に戻り、ベ イズ統計のように単純にはいかないこと、そしてカイ二 乗検定が問題を回避しつつ有効であることを説明します。
Although the chi-square test successfully detected the bias in the die, does this procedure seem obvious and intuitive to you? I will present a simpler approach by considering the problem from a Bayesian perspective. -
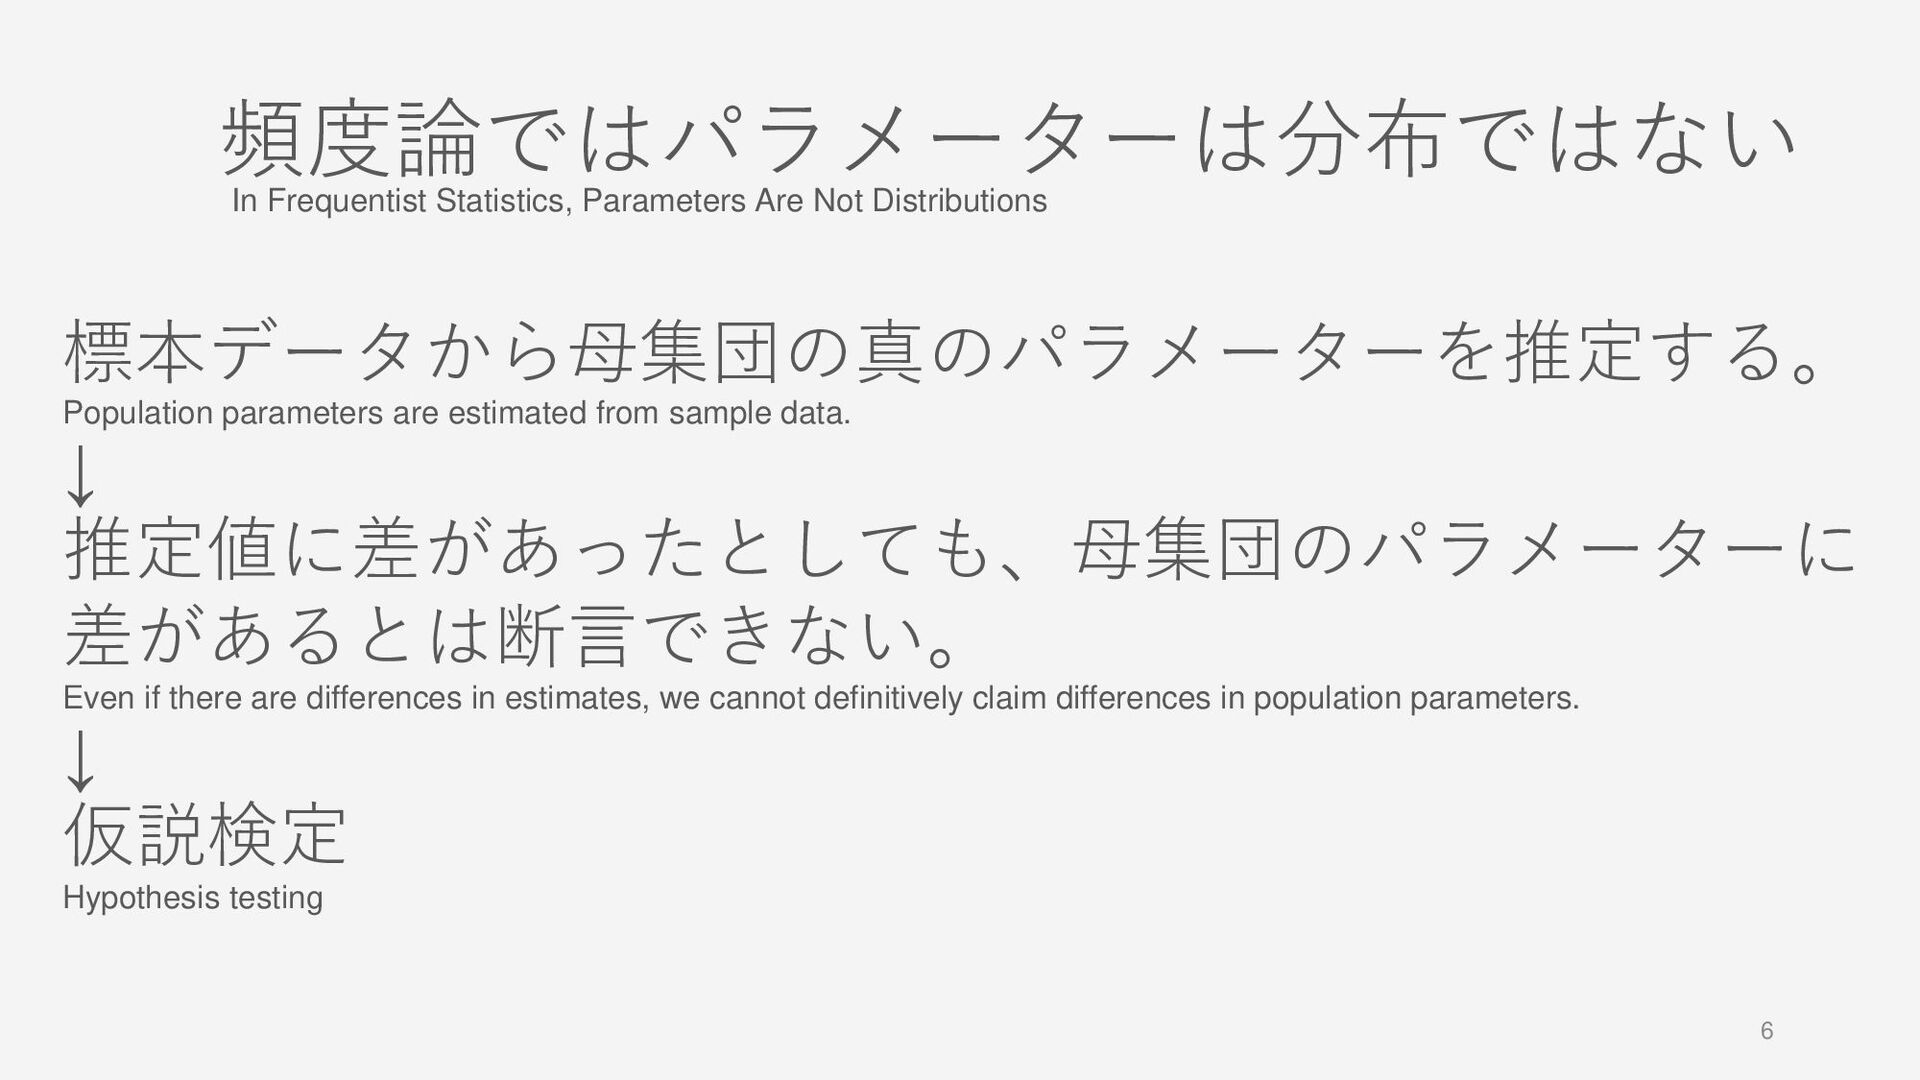
6 頻度論ではパラメーターは分布ではない 標本データから母集団の真のパラメーターを推定する。 ↓ 推定値に差があったとしても、母集団のパラメーターに 差があるとは断言できない。 ↓ 仮説検定 In Frequentist
Statistics, Parameters Are Not Distributions Population parameters are estimated from sample data. Even if there are differences in estimates, we cannot definitively claim differences in population parameters. Hypothesis testing -
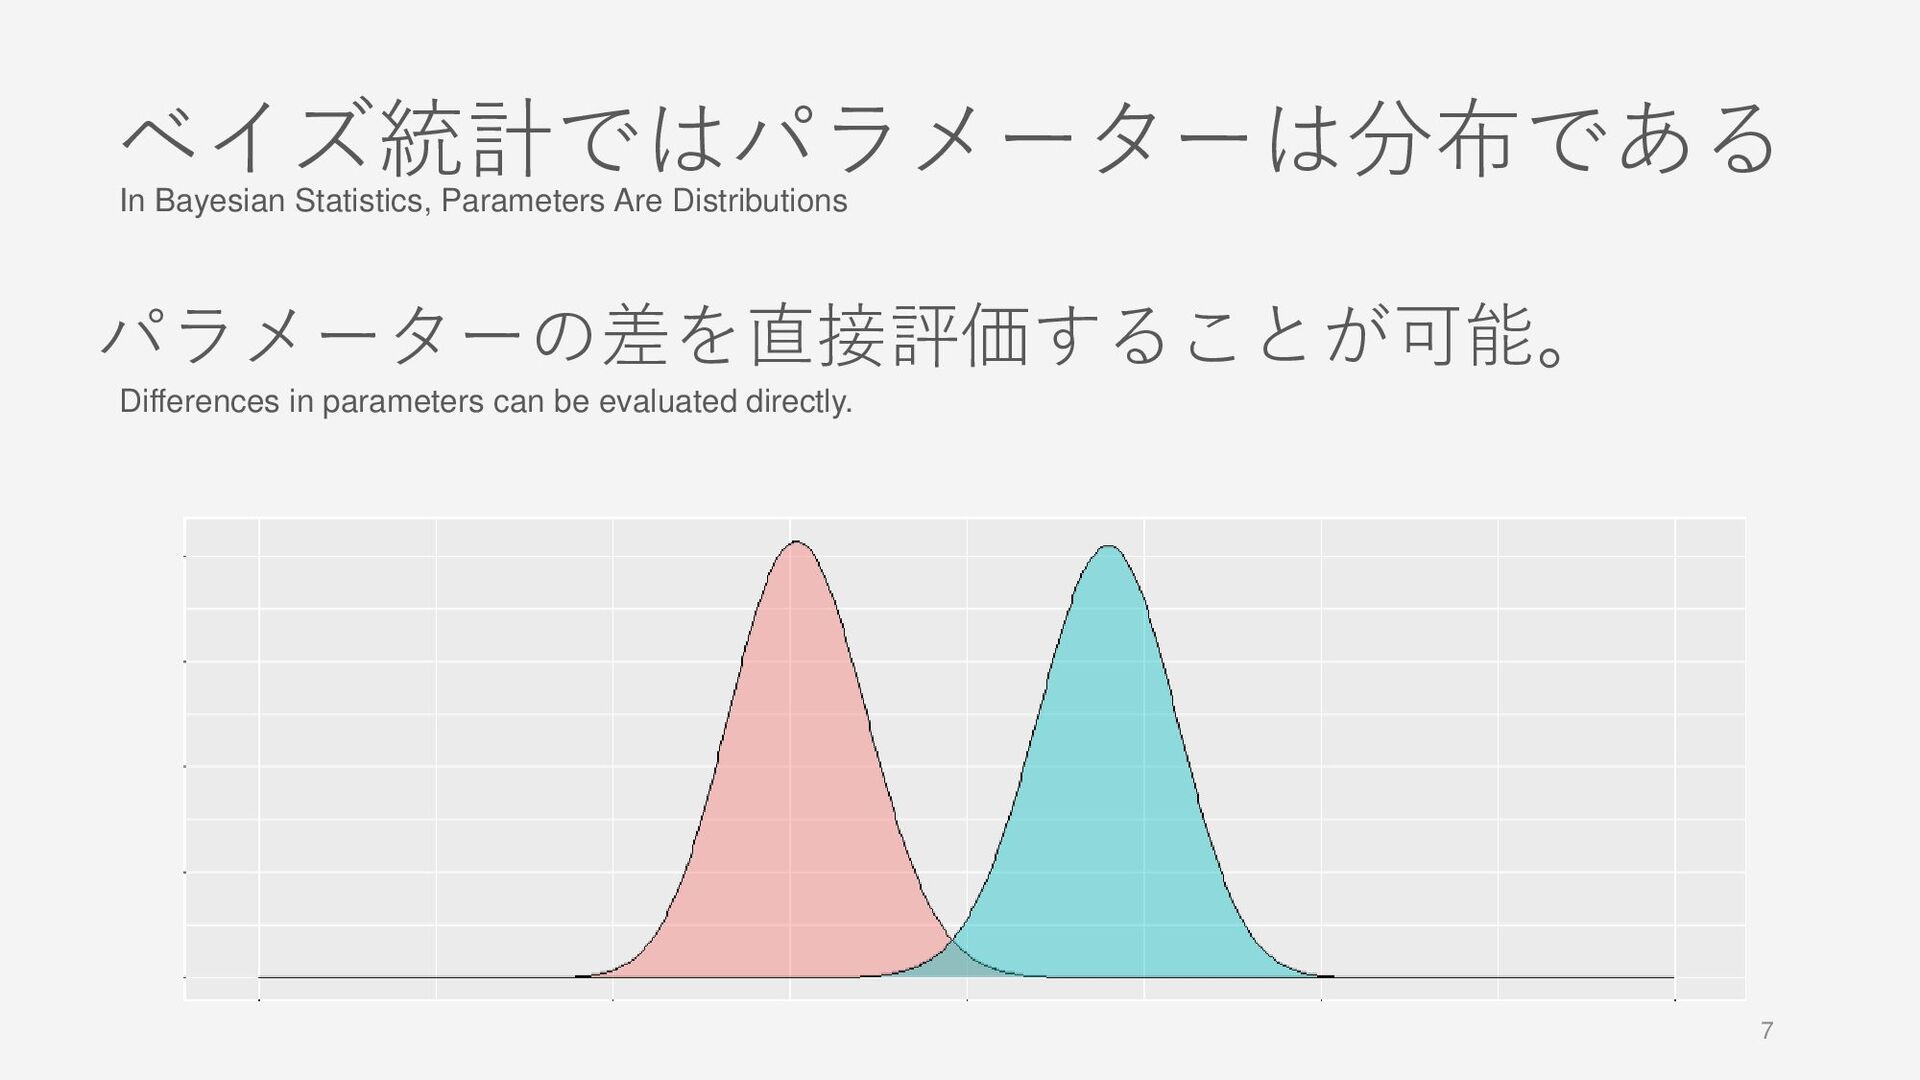
7 ベイズ統計ではパラメーターは分布である パラメーターの差を直接評価することが可能。 In Bayesian Statistics, Parameters Are Distributions Differences
in parameters can be evaluated directly. -
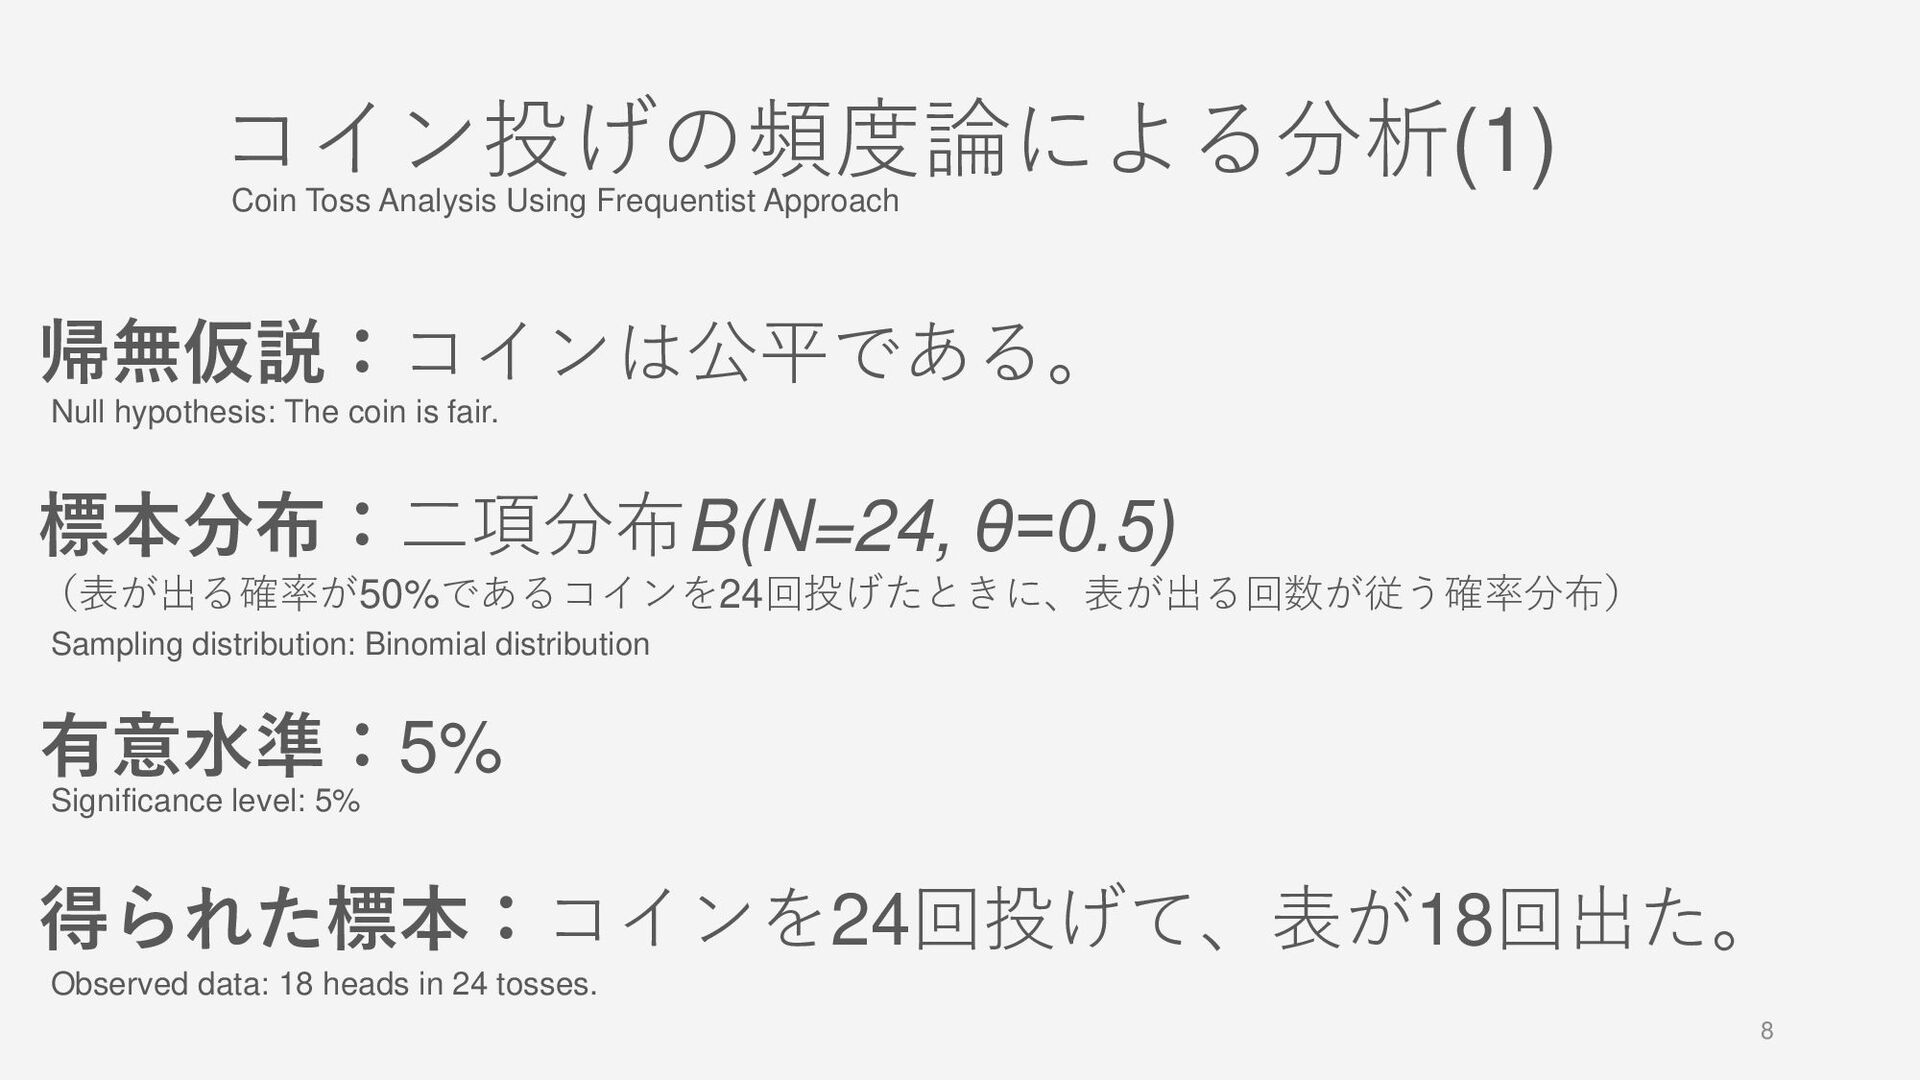
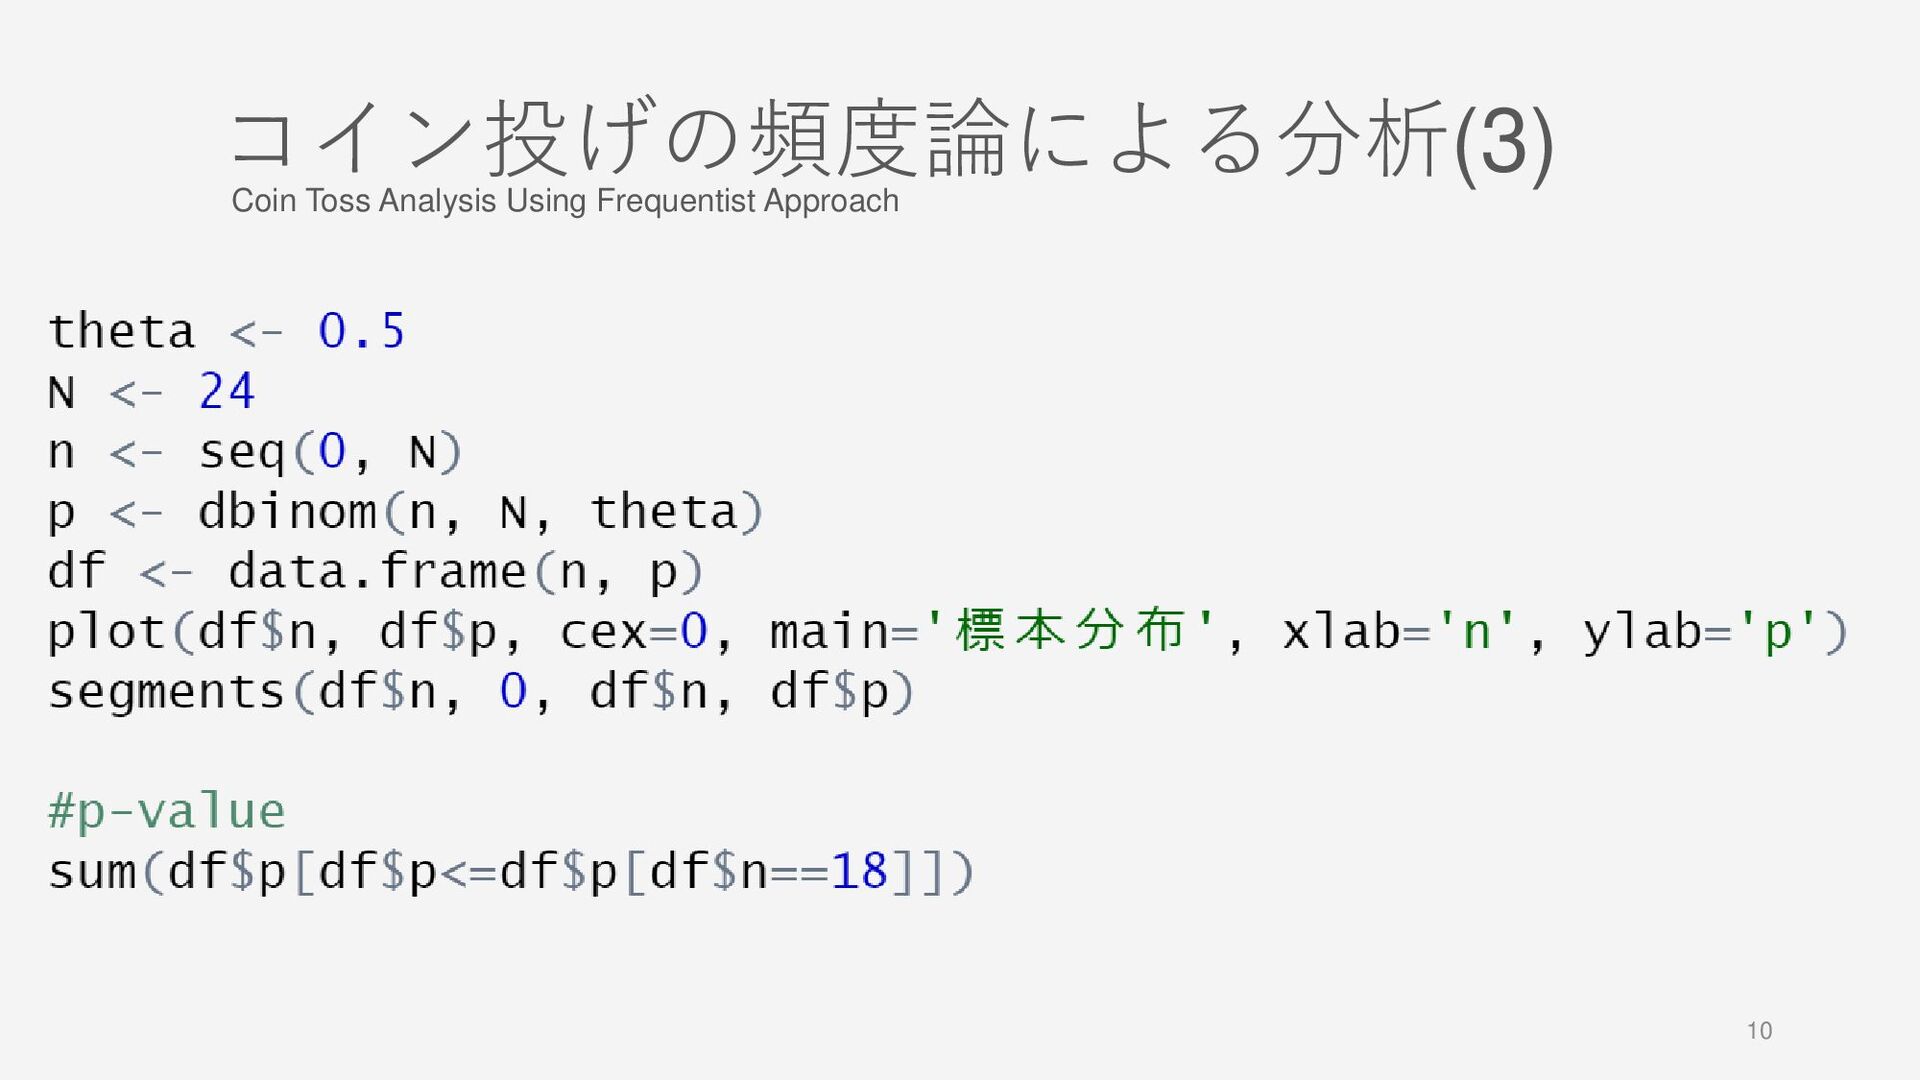
8 コイン投げの頻度論による分析(1) 帰無仮説:コインは公平である。 標本分布:二項分布B(N=24, θ=0.5) (表が出る確率が50%であるコインを24回投げたときに、表が出る回数が従う確率分布) 有意水準:5% 得られた標本:コインを24回投げて、表が18回出た。 Coin Toss
Analysis Using Frequentist Approach Null hypothesis: The coin is fair. Sampling distribution: Binomial distribution Significance level: 5% Observed data: 18 heads in 24 tosses. -
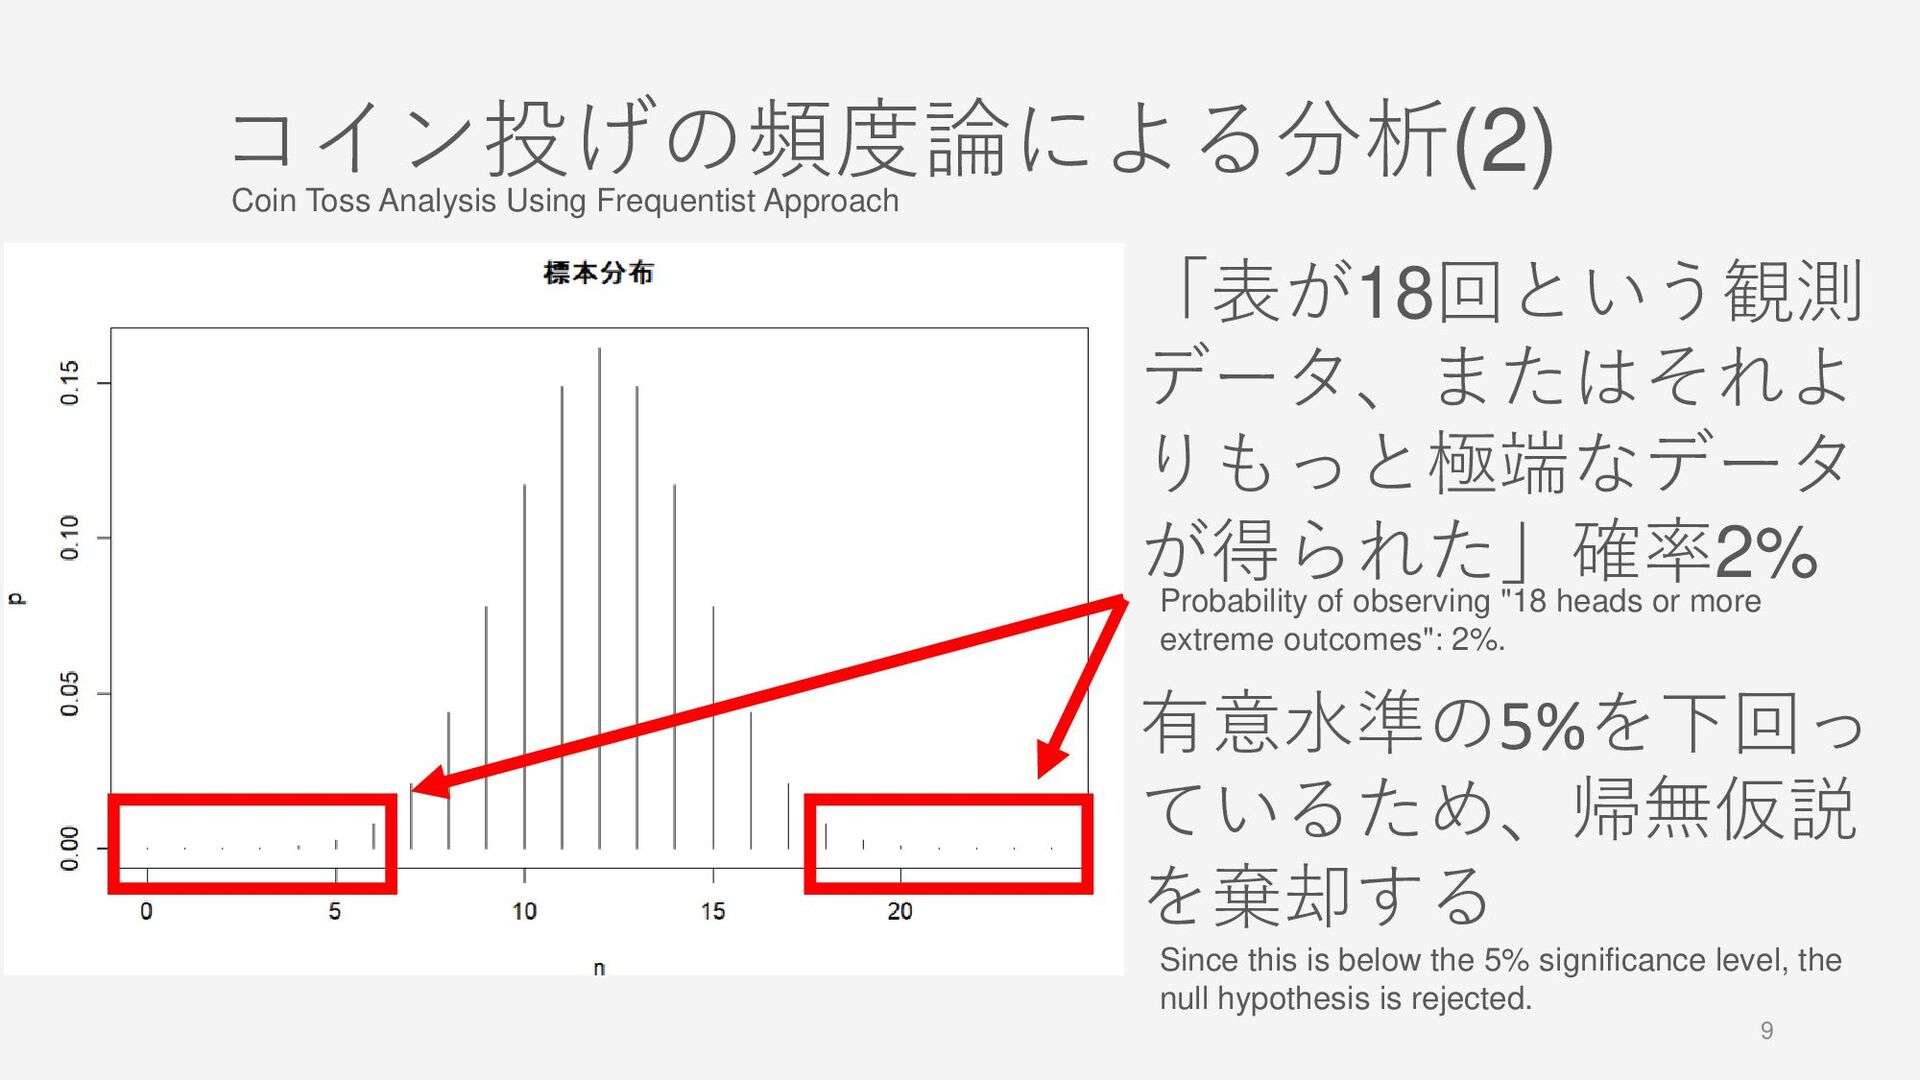
9 コイン投げの頻度論による分析(2) 「表が18回という観測 データ、またはそれよ りもっと極端なデータ が得られた」確率2% 有意水準の5%を下回っ ているため、帰無仮説 を棄却する Coin
Toss Analysis Using Frequentist Approach Probability of observing "18 heads or more extreme outcomes": 2%. Since this is below the 5% significance level, the null hypothesis is rejected. -
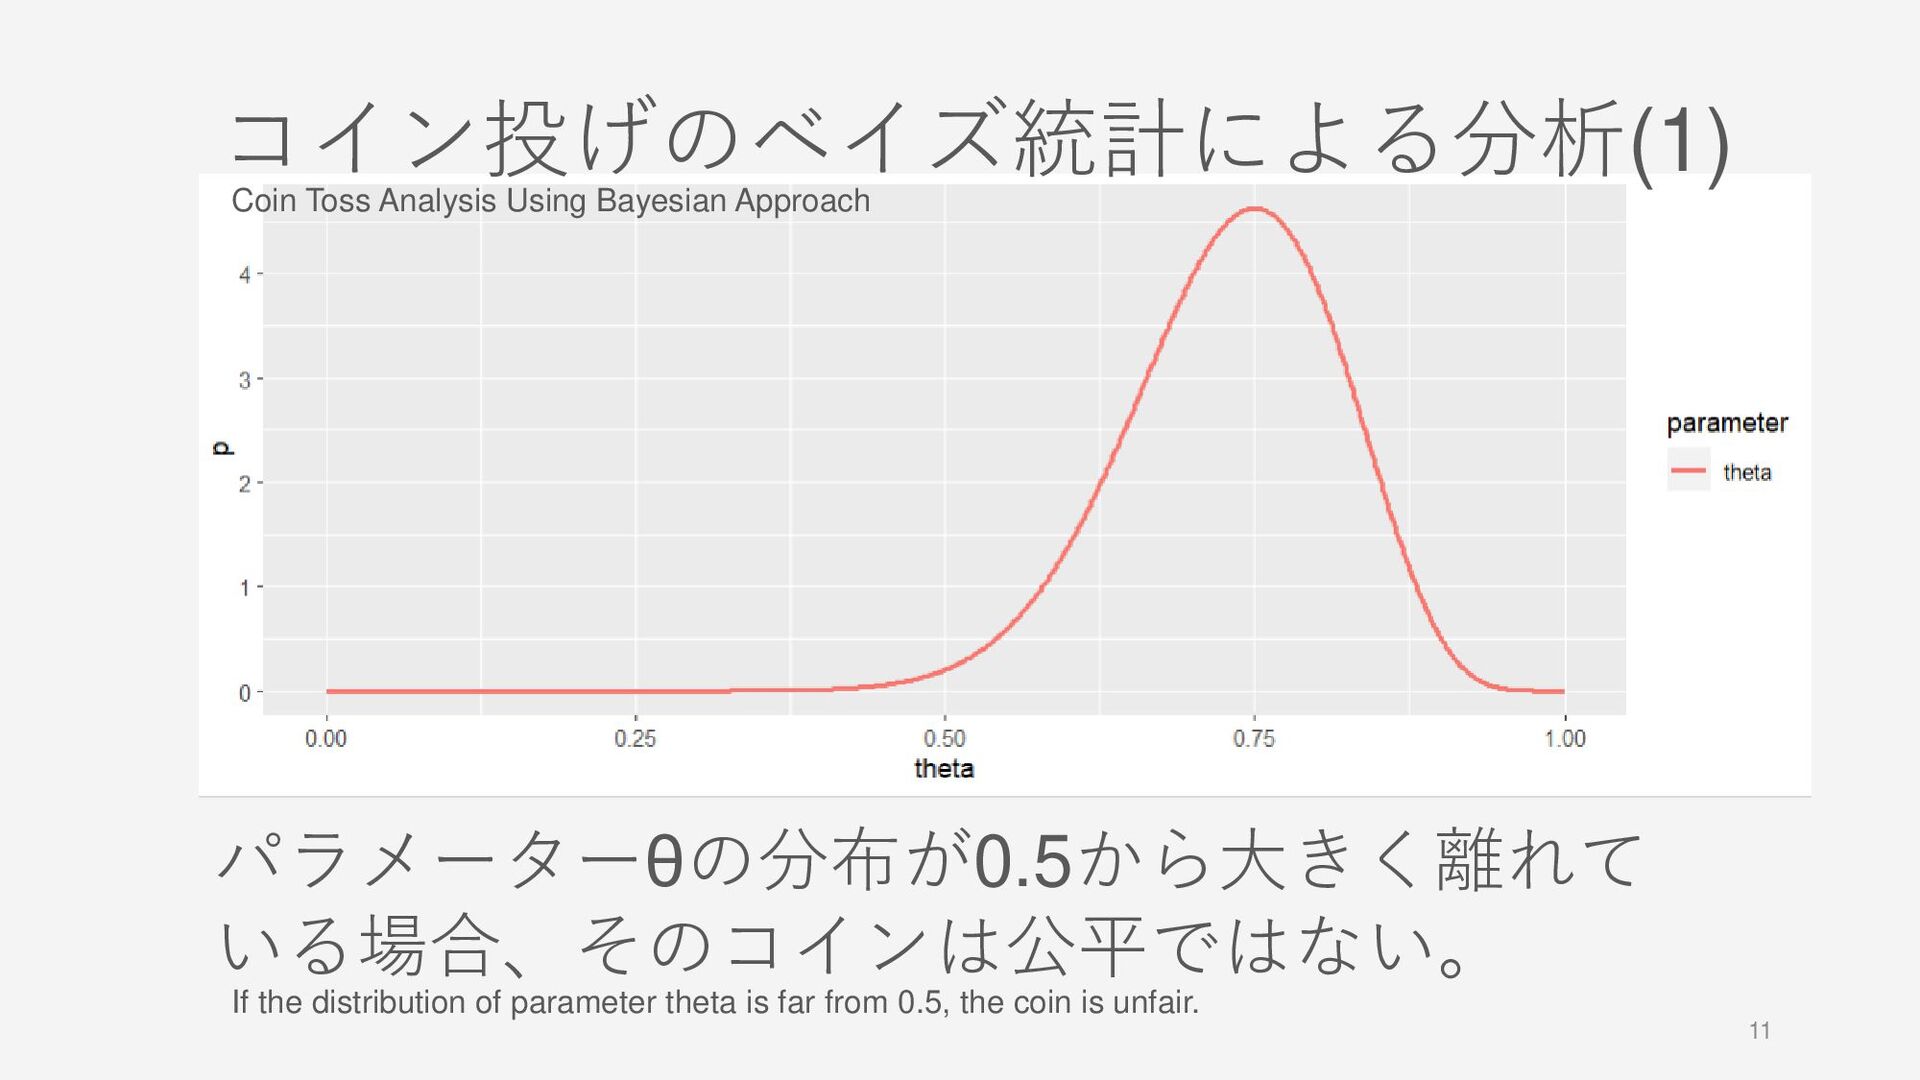
11 コイン投げのベイズ統計による分析(1) パラメーターθの分布が0.5から大きく離れて いる場合、そのコインは公平ではない。 Coin Toss Analysis Using Bayesian Approach
If the distribution of parameter theta is far from 0.5, the coin is unfair. -
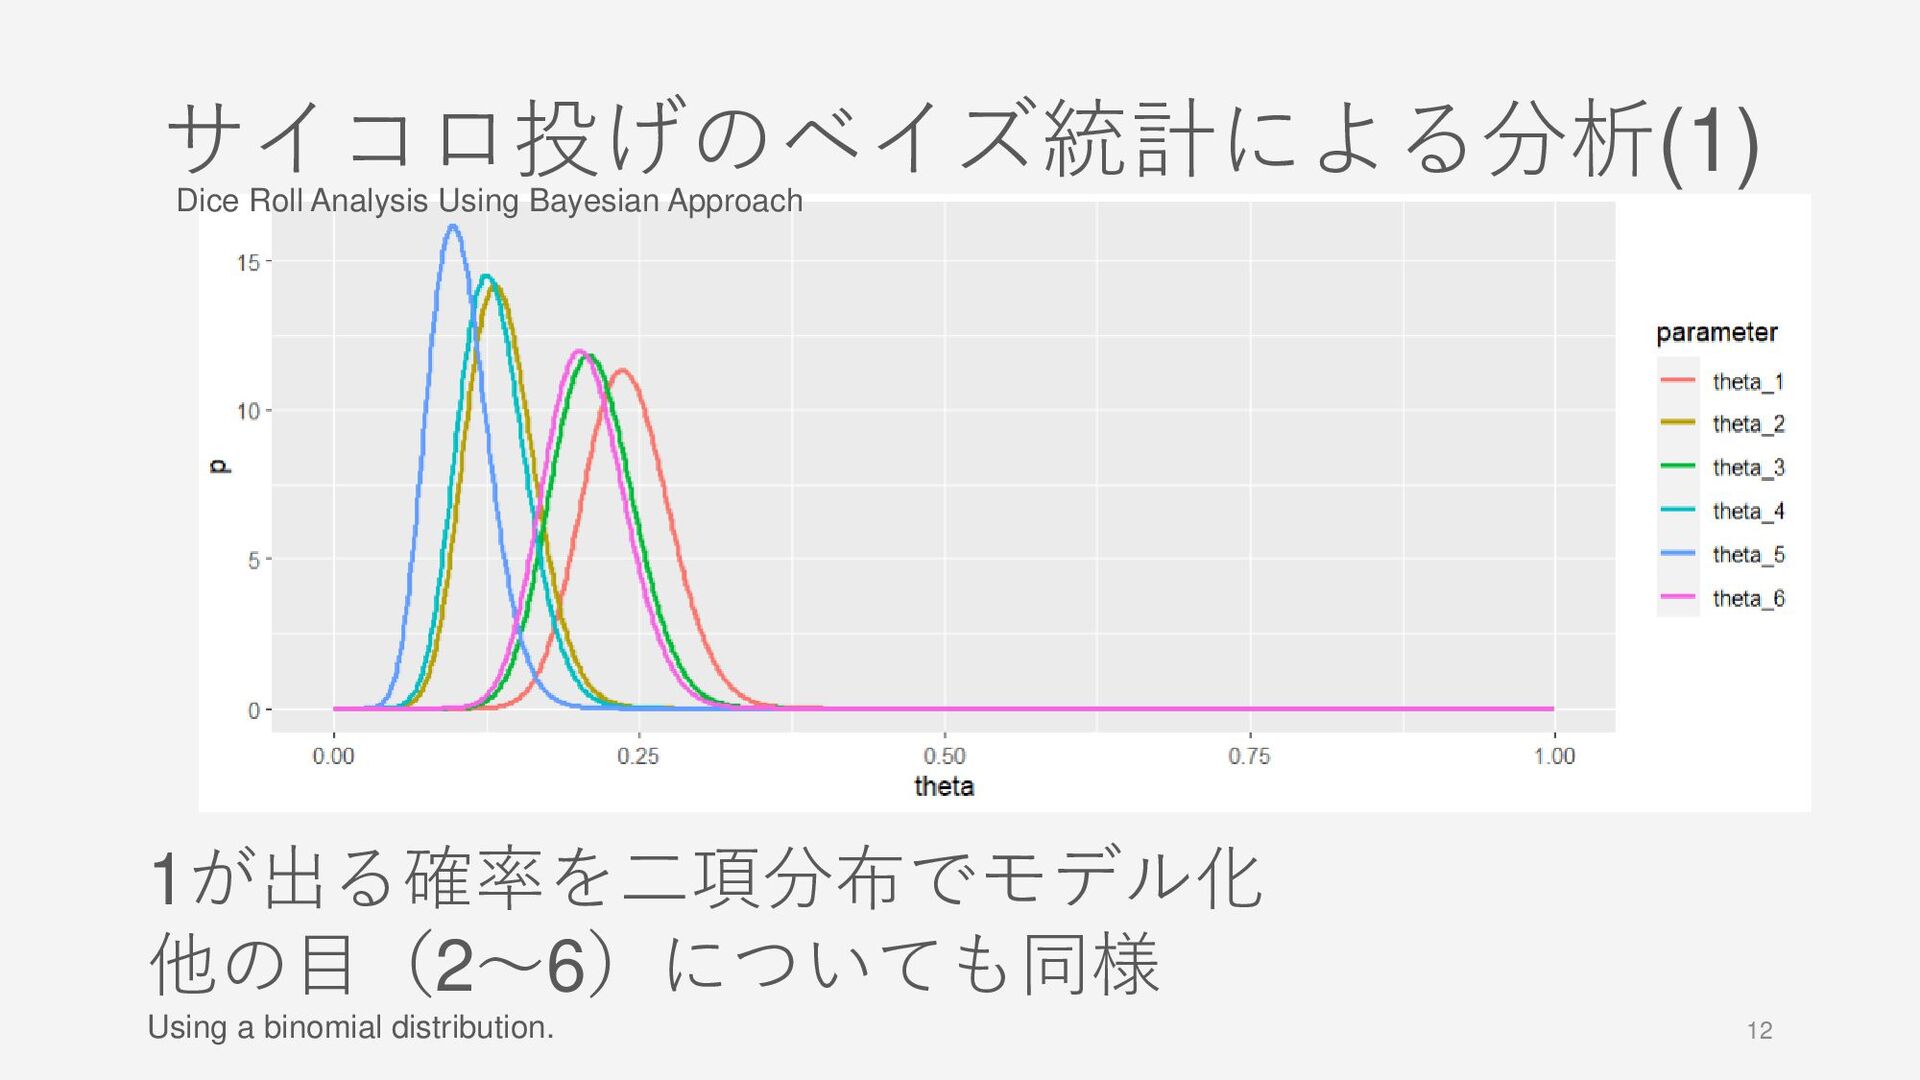
12 サイコロ投げのベイズ統計による分析(1) 1が出る確率を二項分布でモデル化 他の目(2~6)についても同様 Dice Roll Analysis Using Bayesian Approach
Using a binomial distribution. -
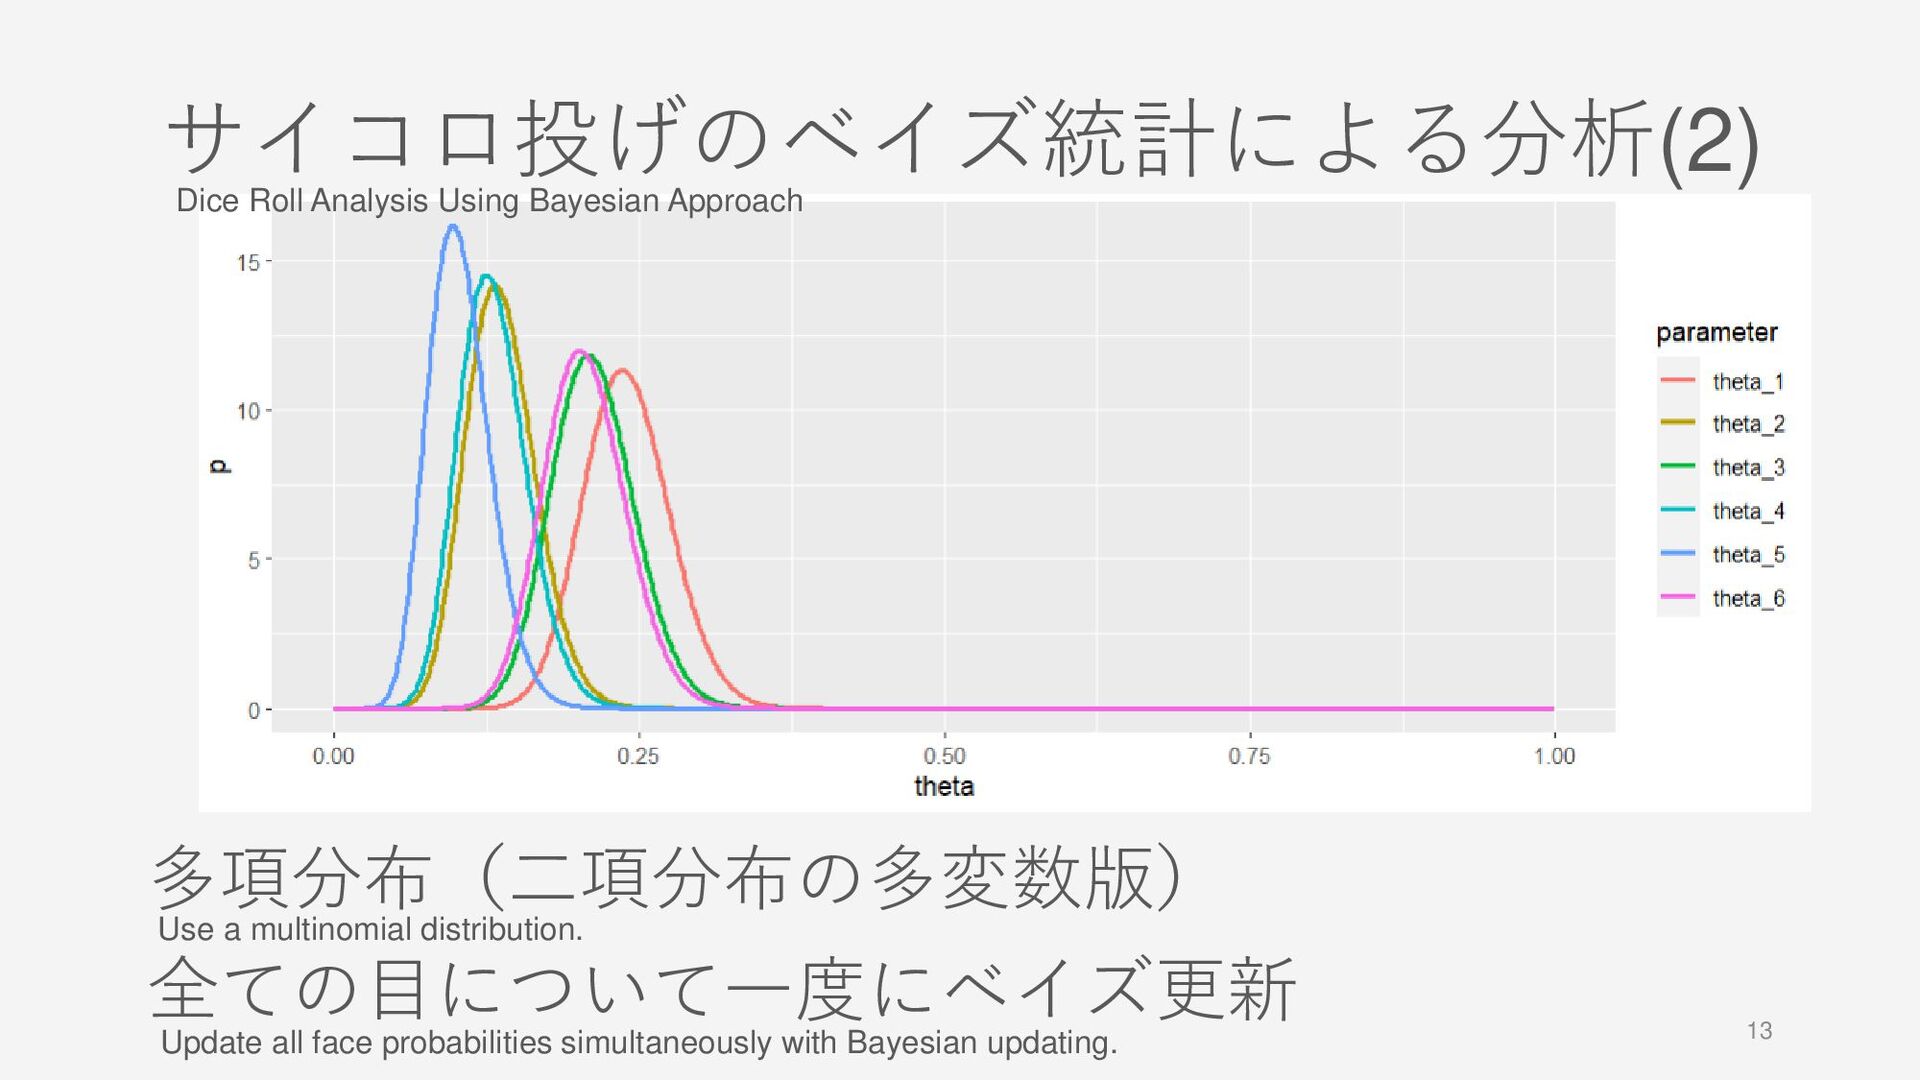
サイコロ投げのベイズ統計による分析(2) 13 多項分布(二項分布の多変数版) 全ての目について一度にベイズ更新 Dice Roll Analysis Using Bayesian Approach
Use a multinomial distribution. Update all face probabilities simultaneously with Bayesian updating. -
サイコロ投げのベイズ統計による分析(3) 14 ベイズ統計 • 二項分布によるベイズ更新を6回 • 多項分布なら1回 サイコロ投げはコイン投げの自然な拡張 Dice Roll
Analysis Using Bayesian Approach Bayesian statistics: Six Bayesian updates using binomial distributions. One update using a multinomial distribution. Dice rolling is a natural extension of coin tossing. -
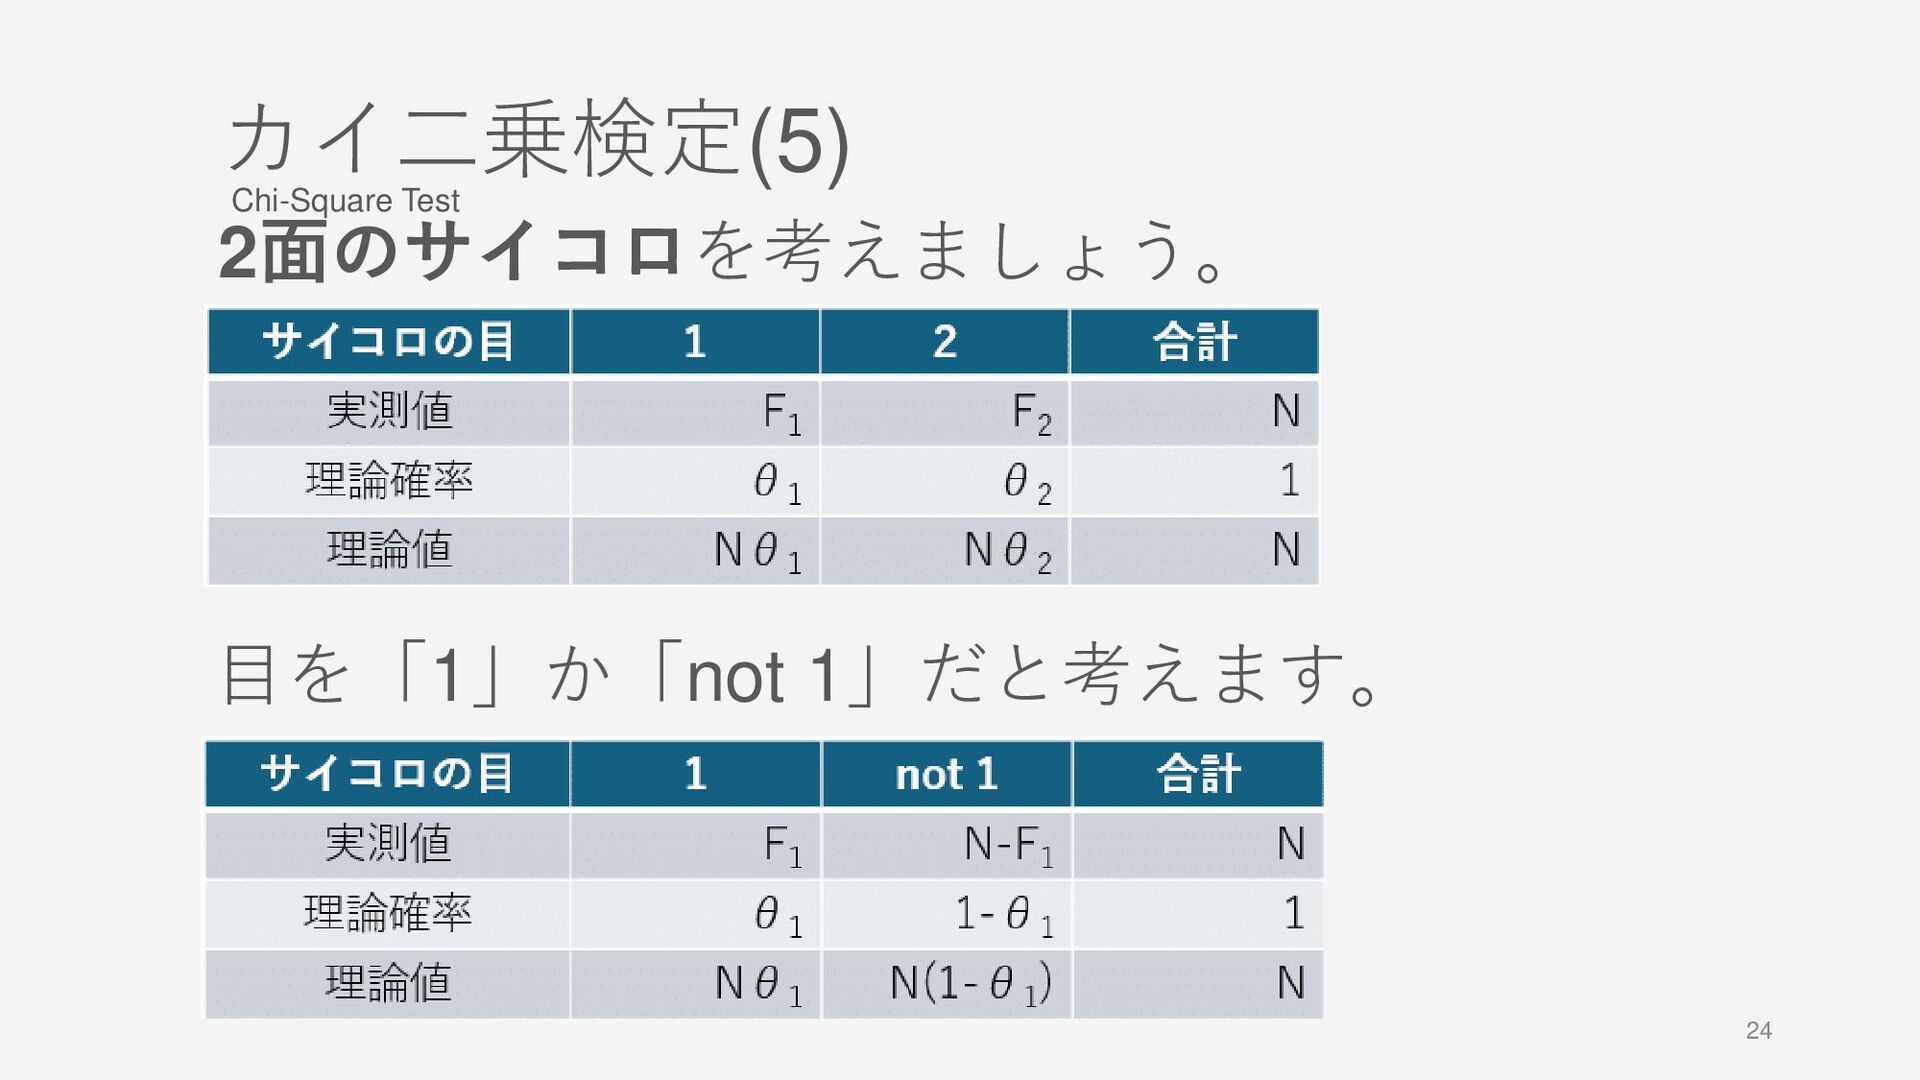
15 サイコロ投げの頻度論による分析(1) 二項検定を6回行う 帰無仮説1:1の出やすさは1/6と等しい 帰無仮説2:2の出やすさは1/6と等しい … 帰無仮説6:6の出やすさは1/6と等しい →検定を何度も繰り返したくない。 Dice Roll
Analysis Using Frequentist Approach Perform six binomial tests: Repeating tests is undesirable. -
16 サイコロ投げの頻度論による分析(2) 多項分布による検定 1回の検定ですみそう。 →なぜか実際にはあまり使われていない。 理論的にはよさそうなアイデアなのに。 標本分布の計算量が大きいためか。 Dice Roll Analysis
Using Frequentist Approach Test using a multinomial distribution. This could be done in a single test. However, it is rarely used in practice. Despite being theoretically promising, its computational demands might make it impractical. -
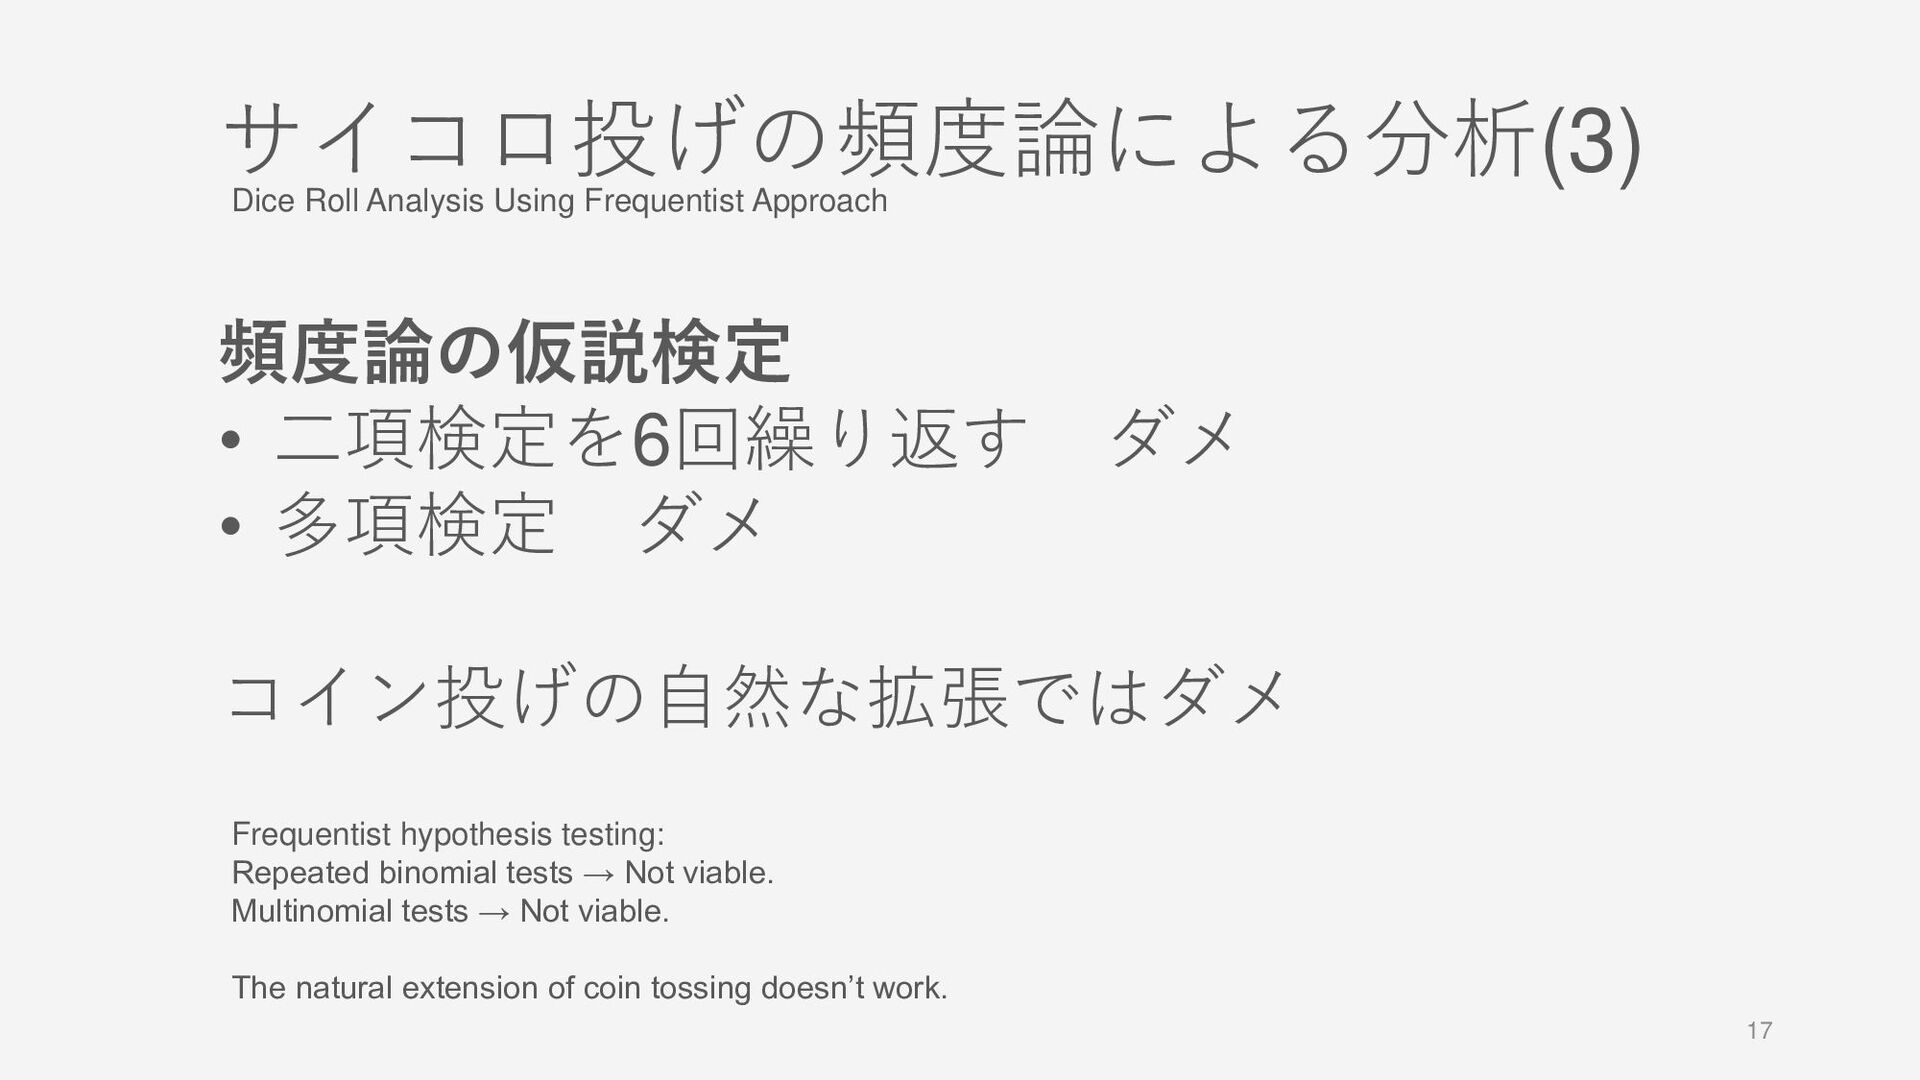
17 サイコロ投げの頻度論による分析(3) 頻度論の仮説検定 • 二項検定を6回繰り返す ダメ • 多項検定 ダメ コイン投げの自然な拡張ではダメ
Dice Roll Analysis Using Frequentist Approach Frequentist hypothesis testing: Repeated binomial tests → Not viable. Multinomial tests → Not viable. The natural extension of coin tossing doesn’t work. -
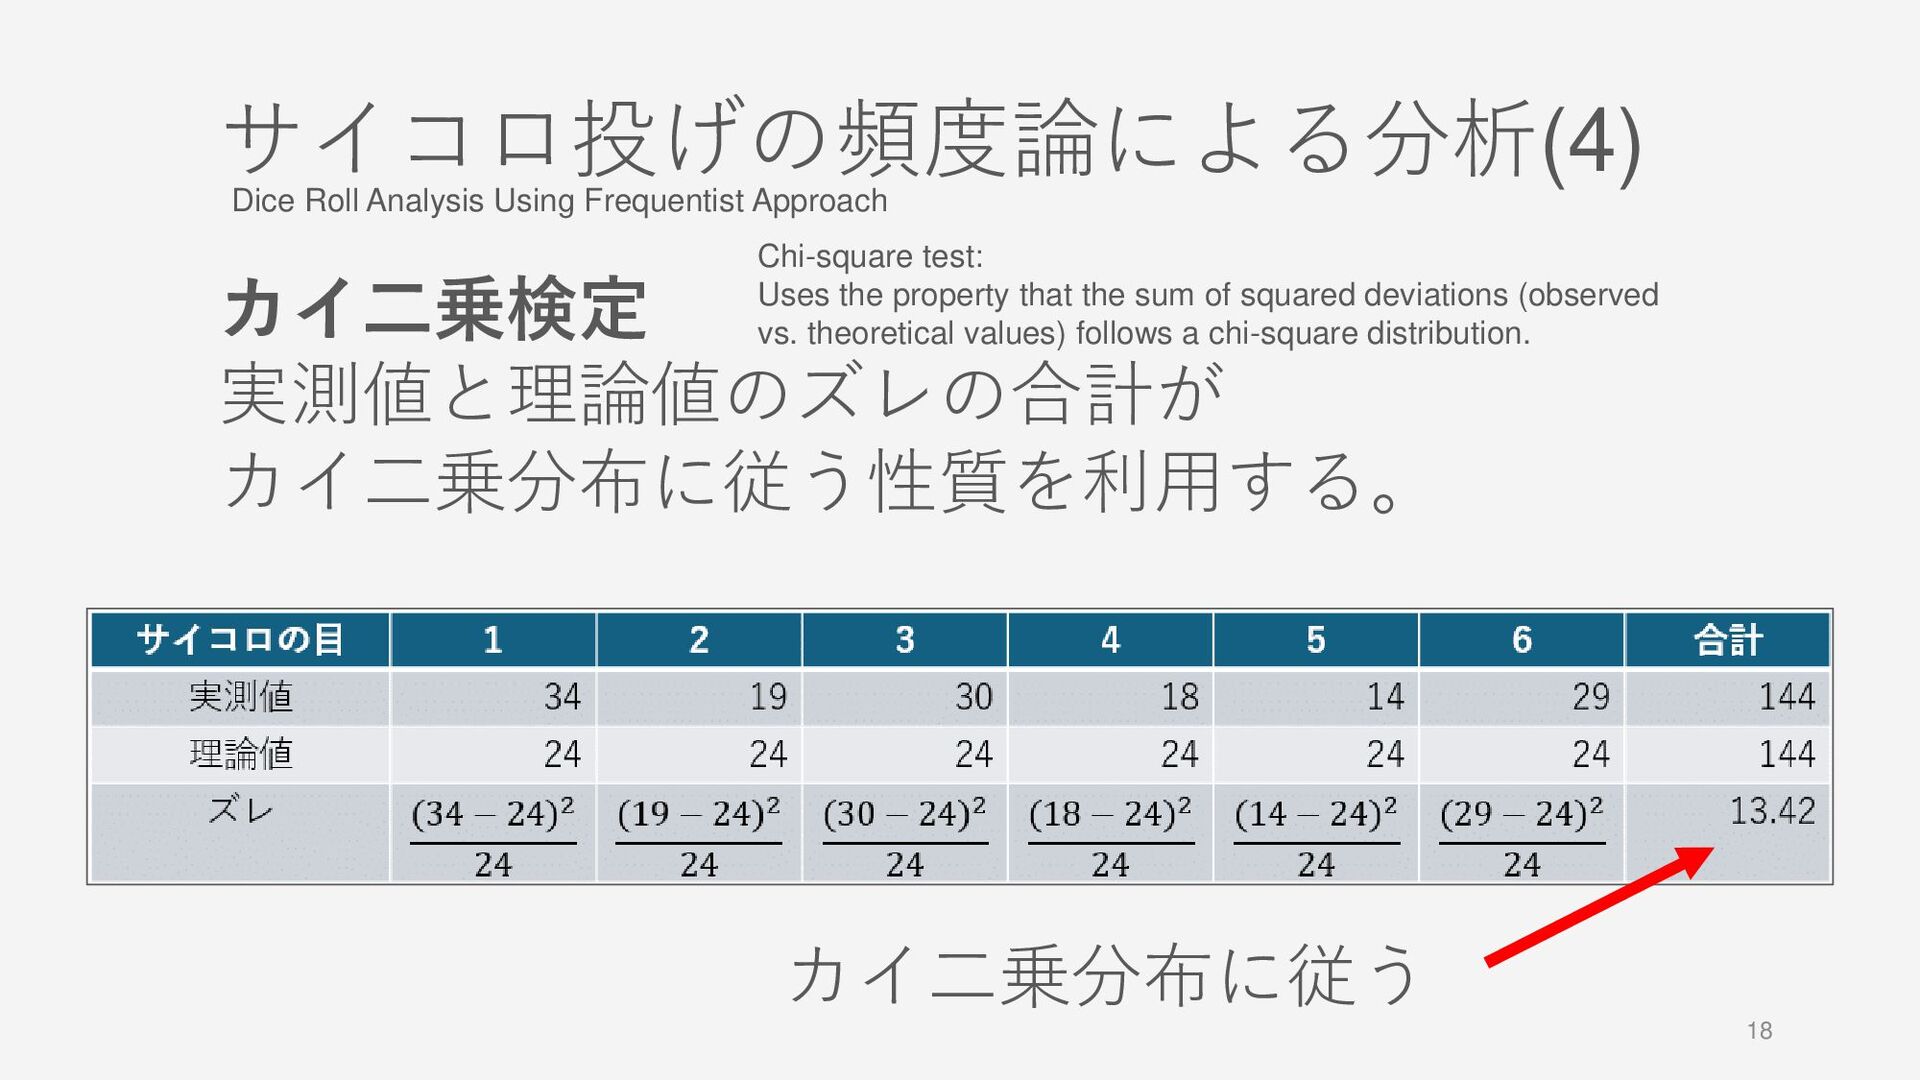
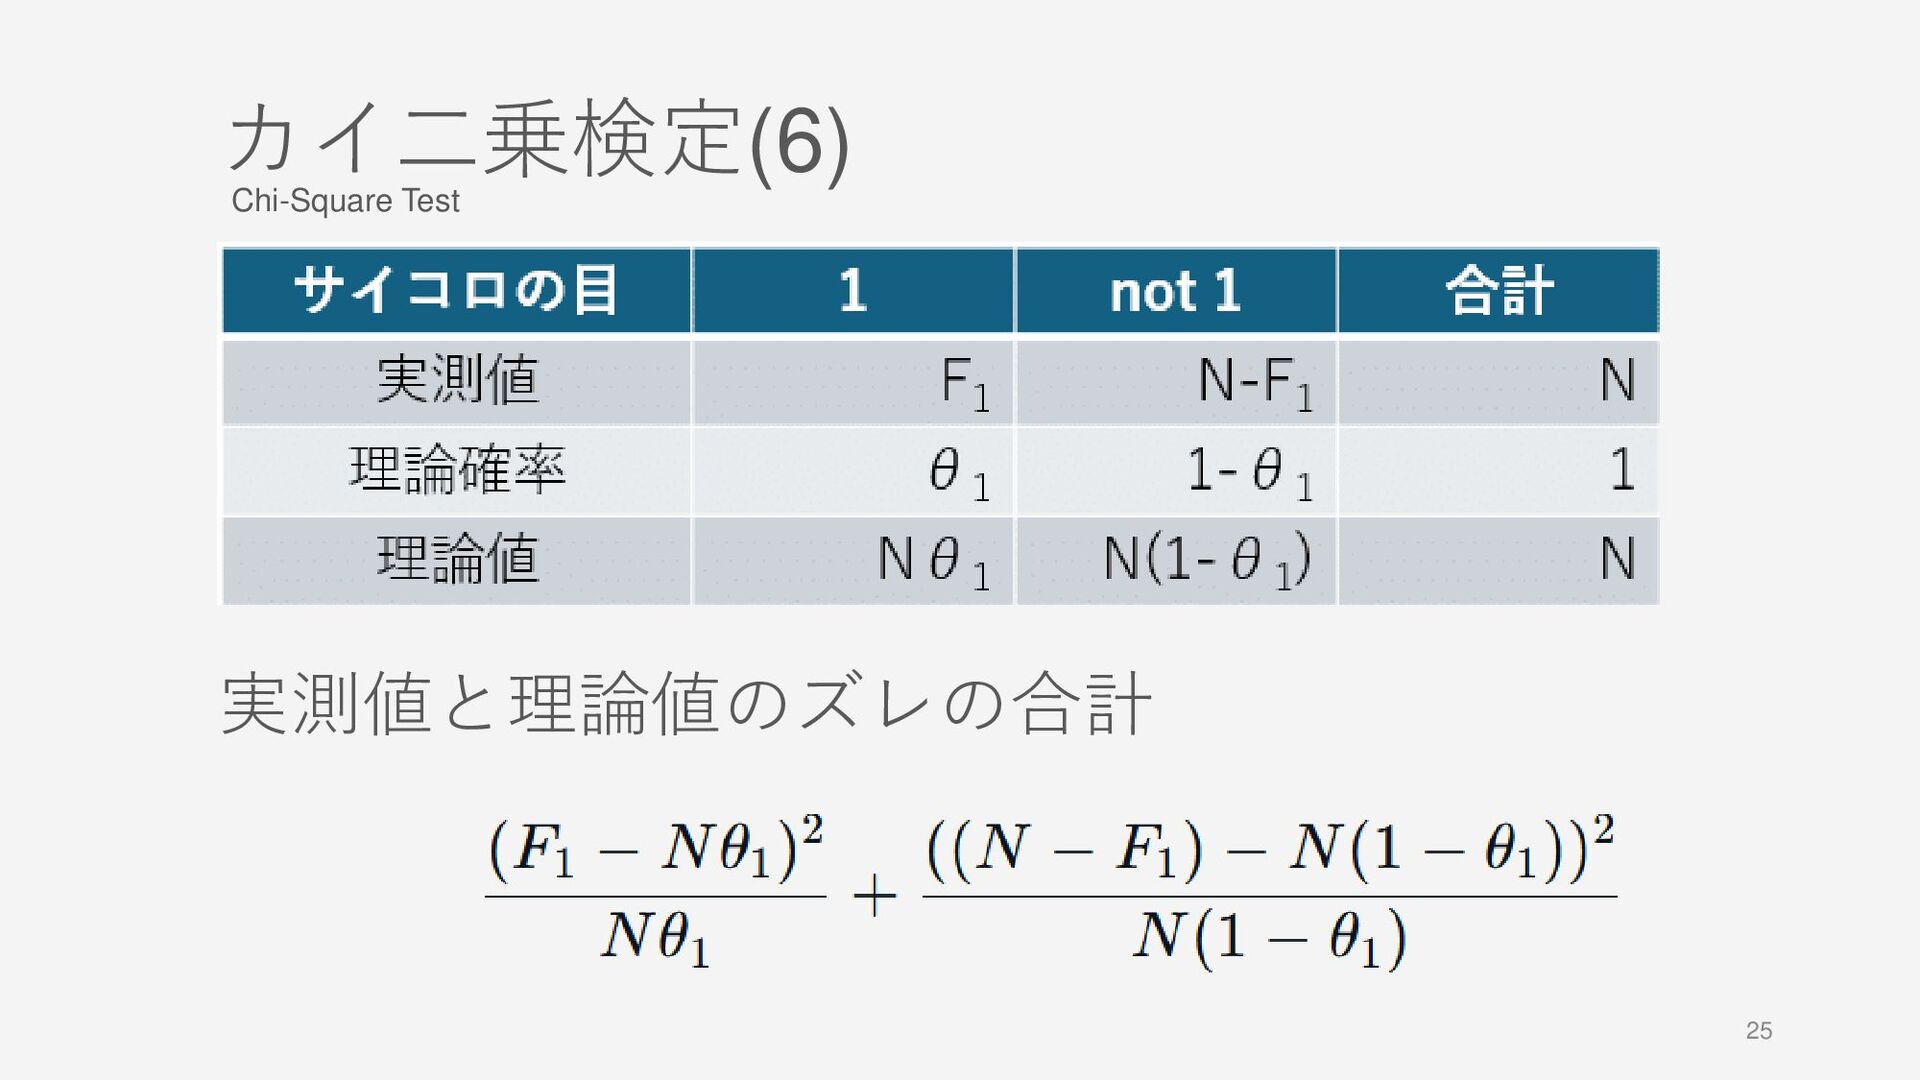
18 サイコロ投げの頻度論による分析(4) カイ二乗検定 実測値と理論値のズレの合計が カイ二乗分布に従う性質を利用する。 カイ二乗分布に従う Dice Roll Analysis Using
Frequentist Approach Chi-square test: Uses the property that the sum of squared deviations (observed vs. theoretical values) follows a chi-square distribution. -
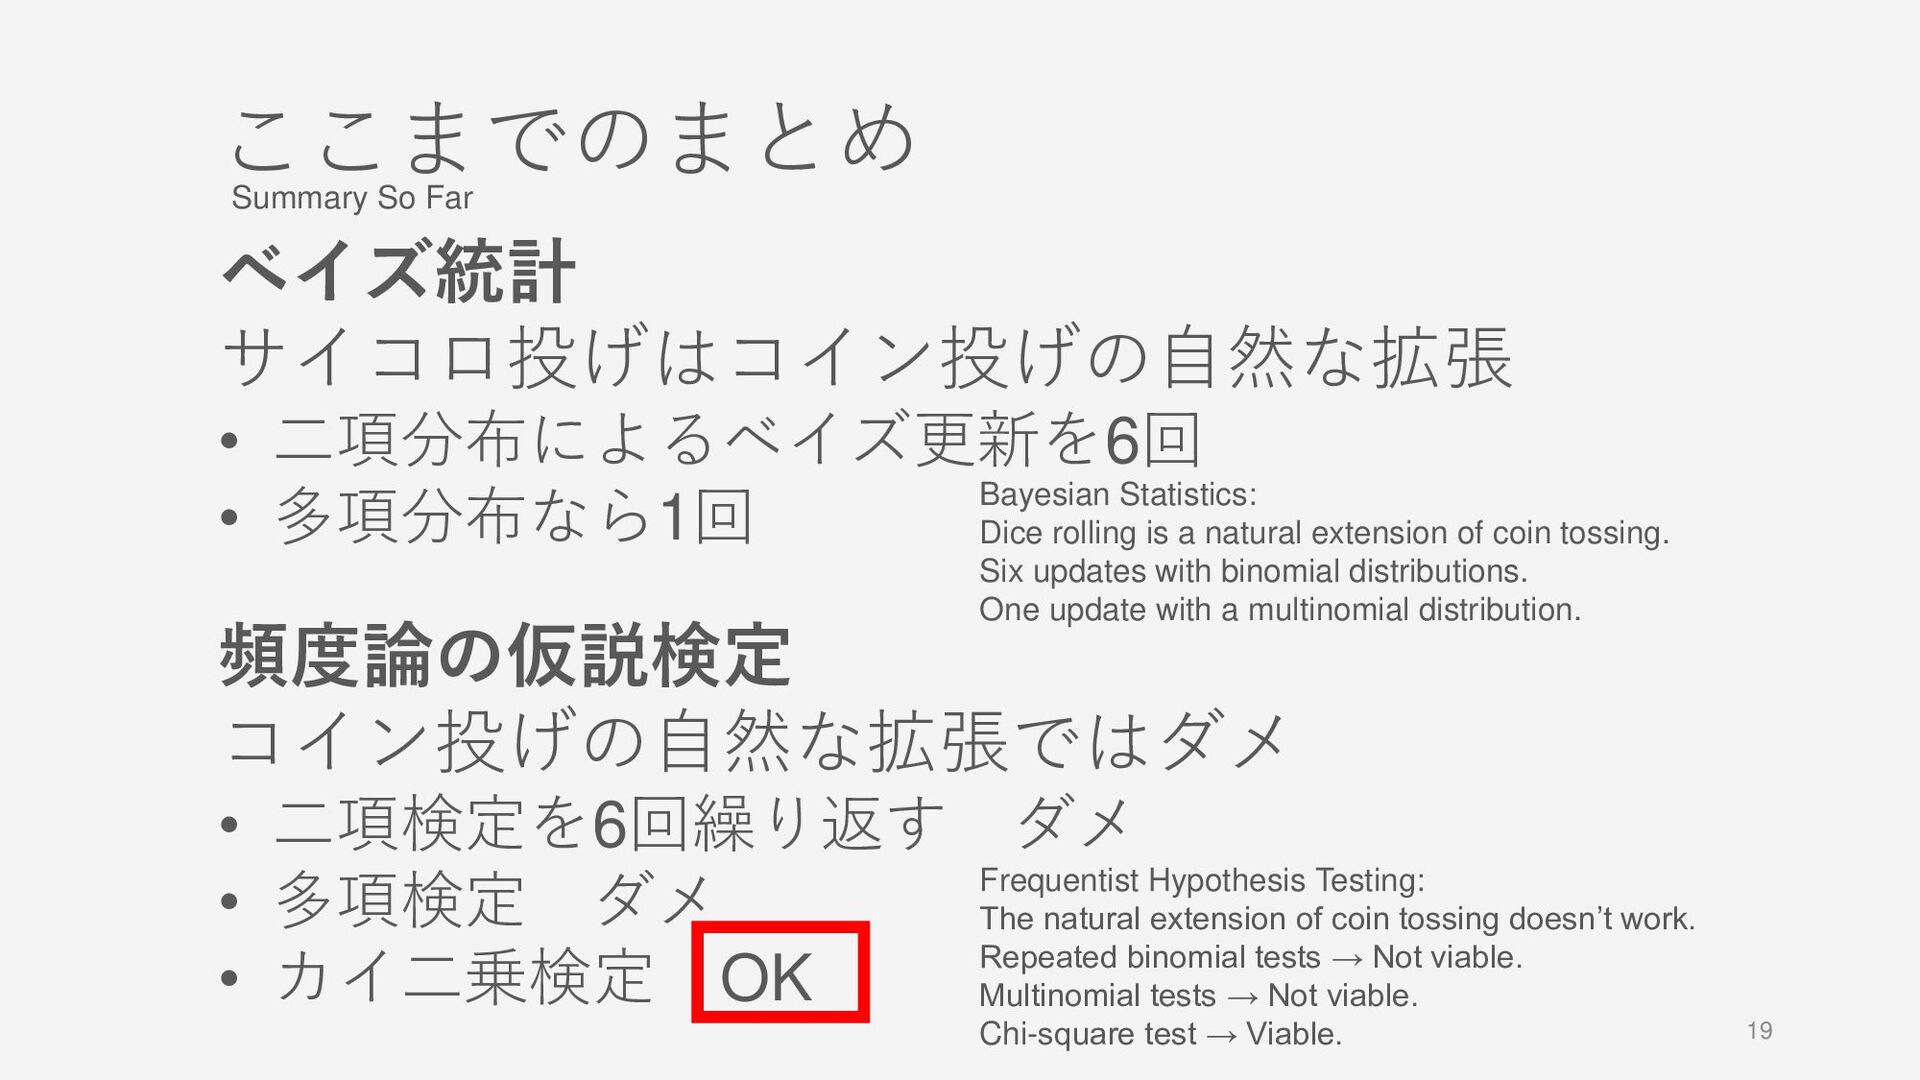
19 ここまでのまとめ ベイズ統計 サイコロ投げはコイン投げの自然な拡張 • 二項分布によるベイズ更新を6回 • 多項分布なら1回 頻度論の仮説検定 コイン投げの自然な拡張ではダメ
• 二項検定を6回繰り返す ダメ • 多項検定 ダメ • カイ二乗検定 OK Summary So Far Bayesian Statistics: Dice rolling is a natural extension of coin tossing. Six updates with binomial distributions. One update with a multinomial distribution. Frequentist Hypothesis Testing: The natural extension of coin tossing doesn’t work. Repeated binomial tests → Not viable. Multinomial tests → Not viable. Chi-square test → Viable. -
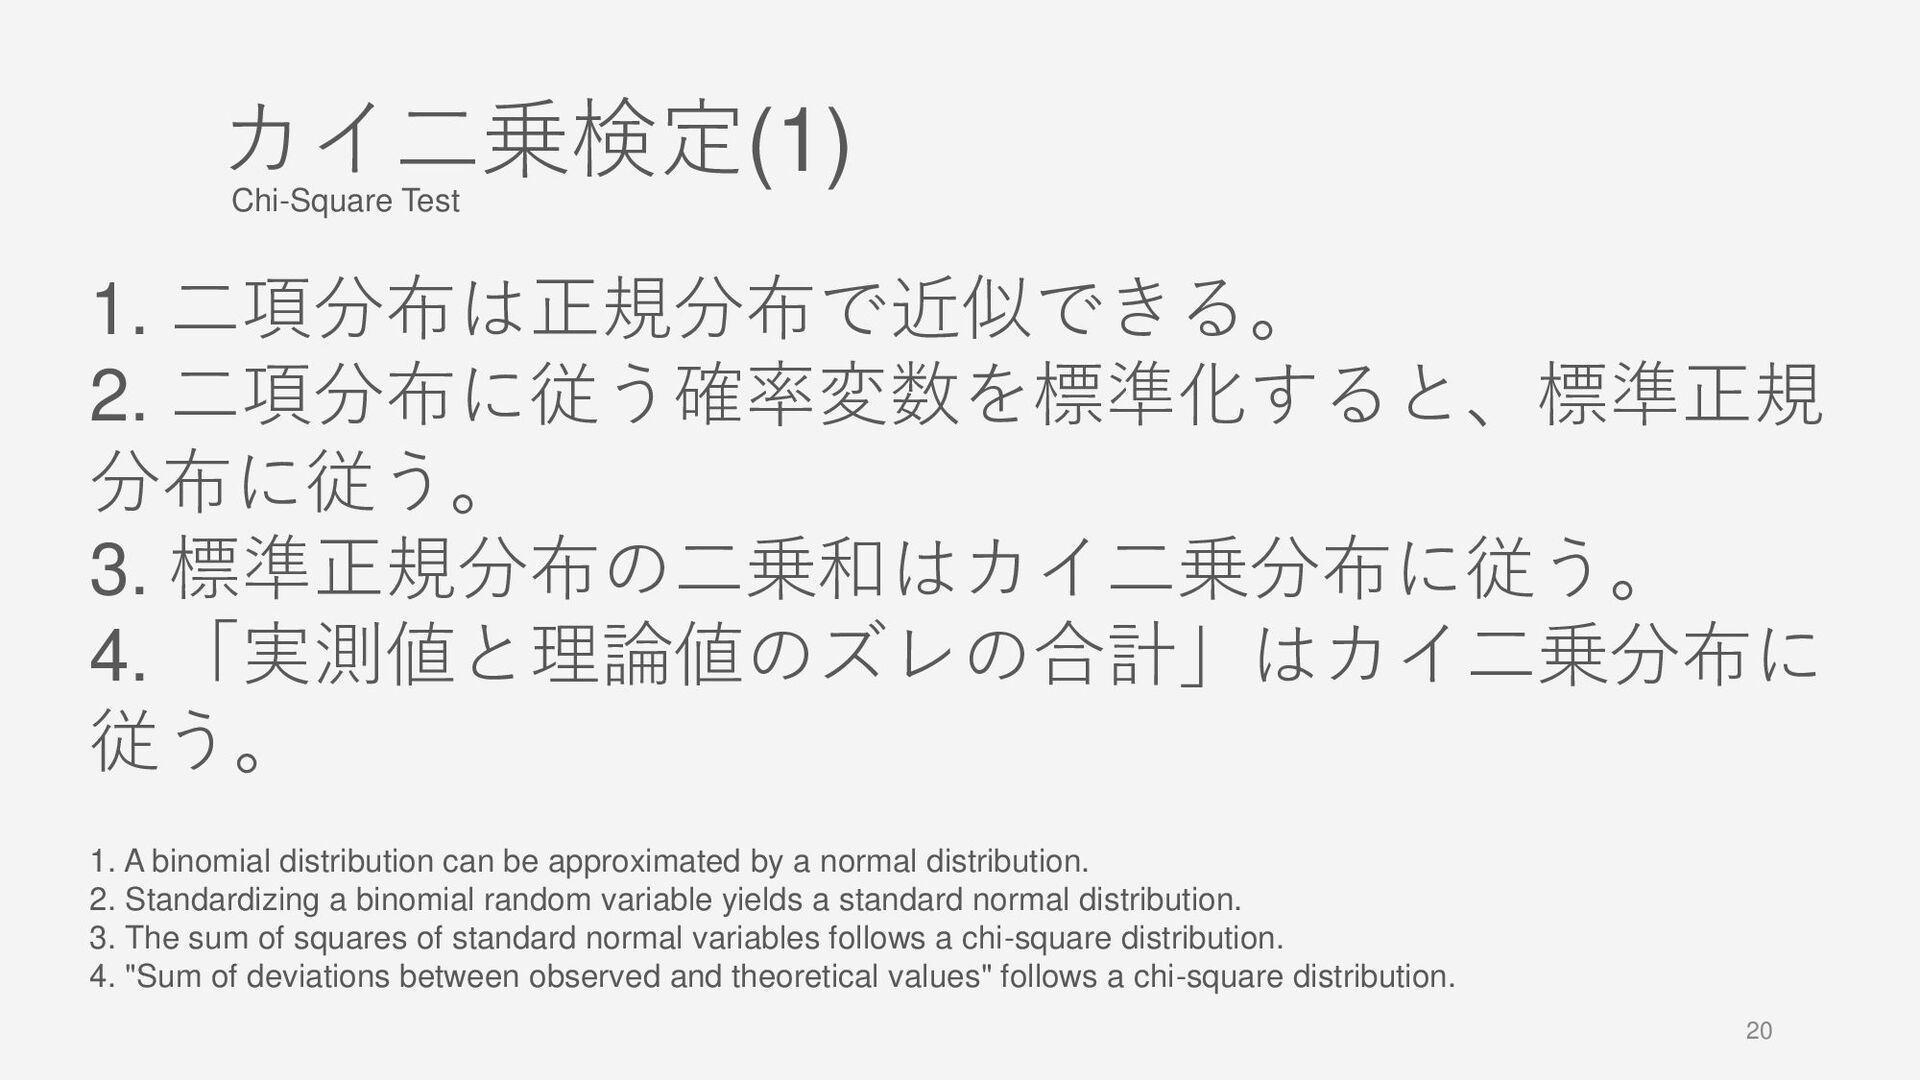
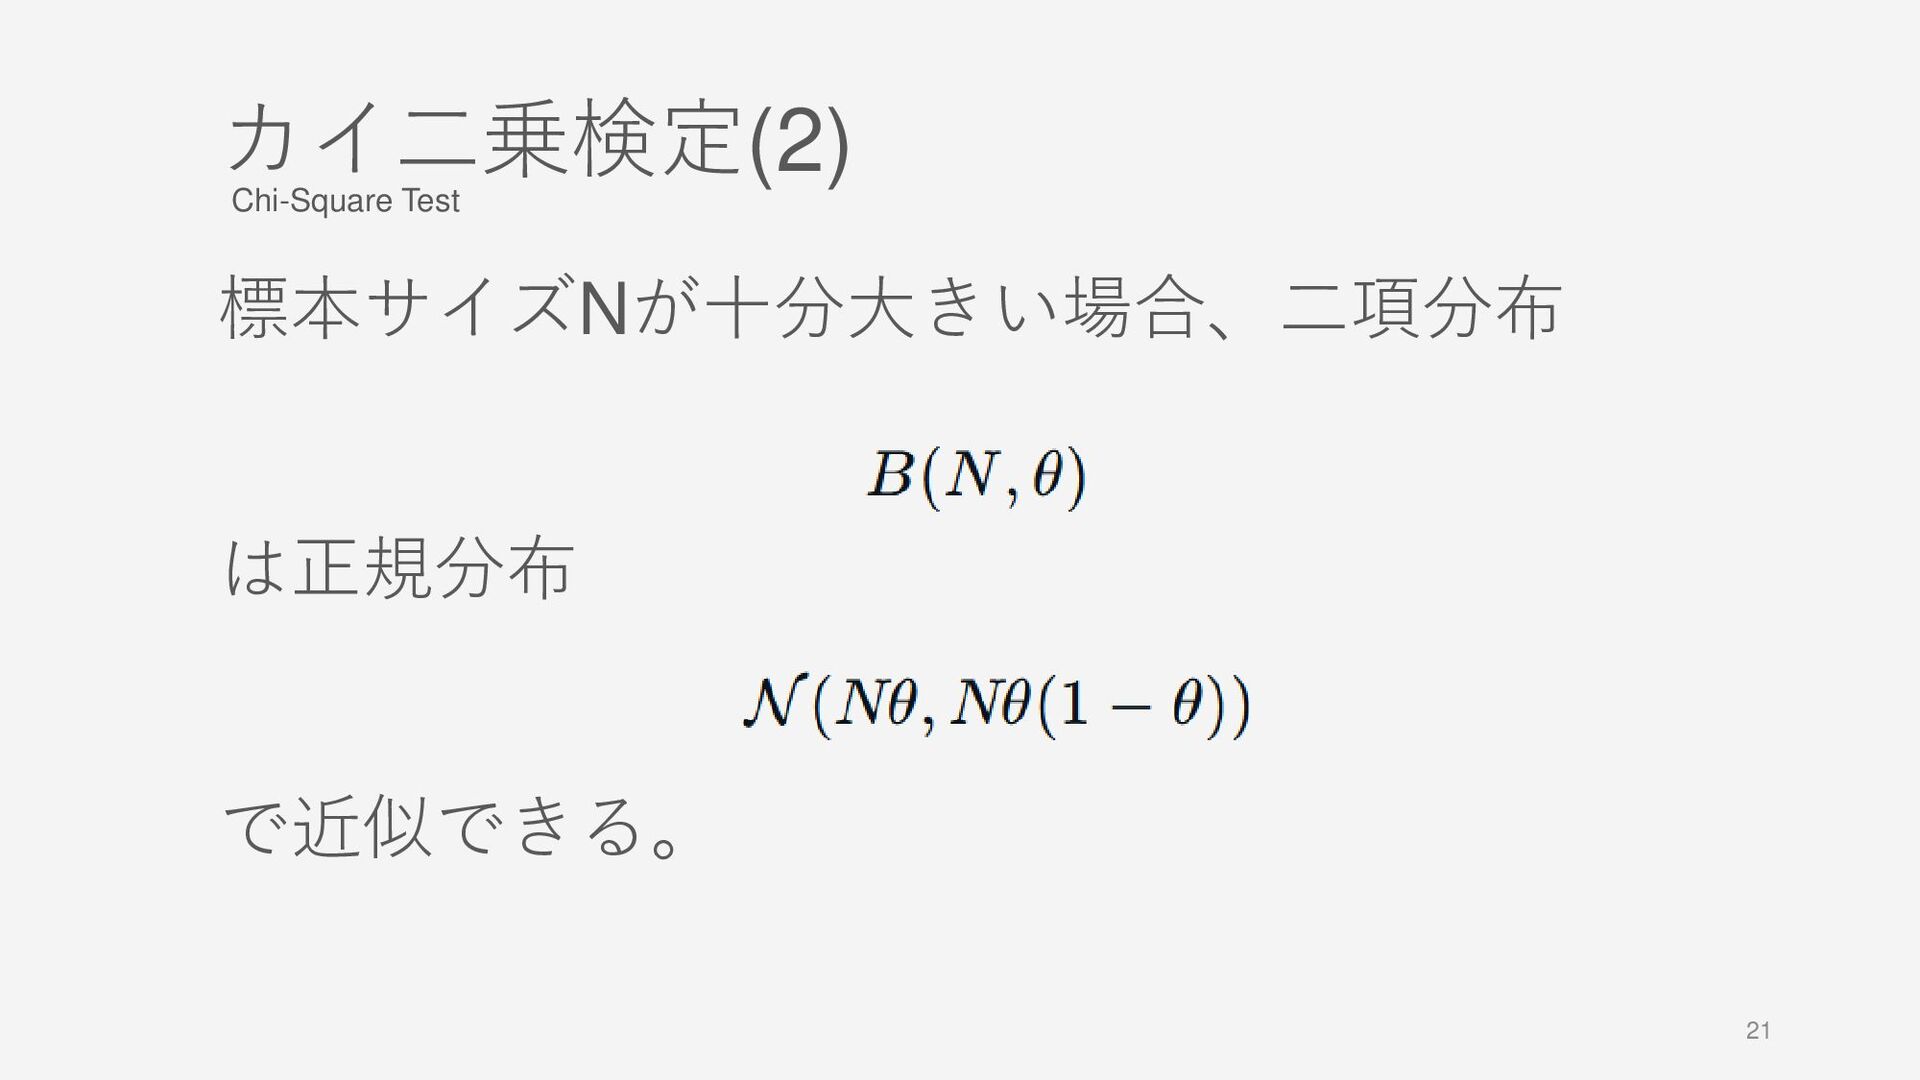
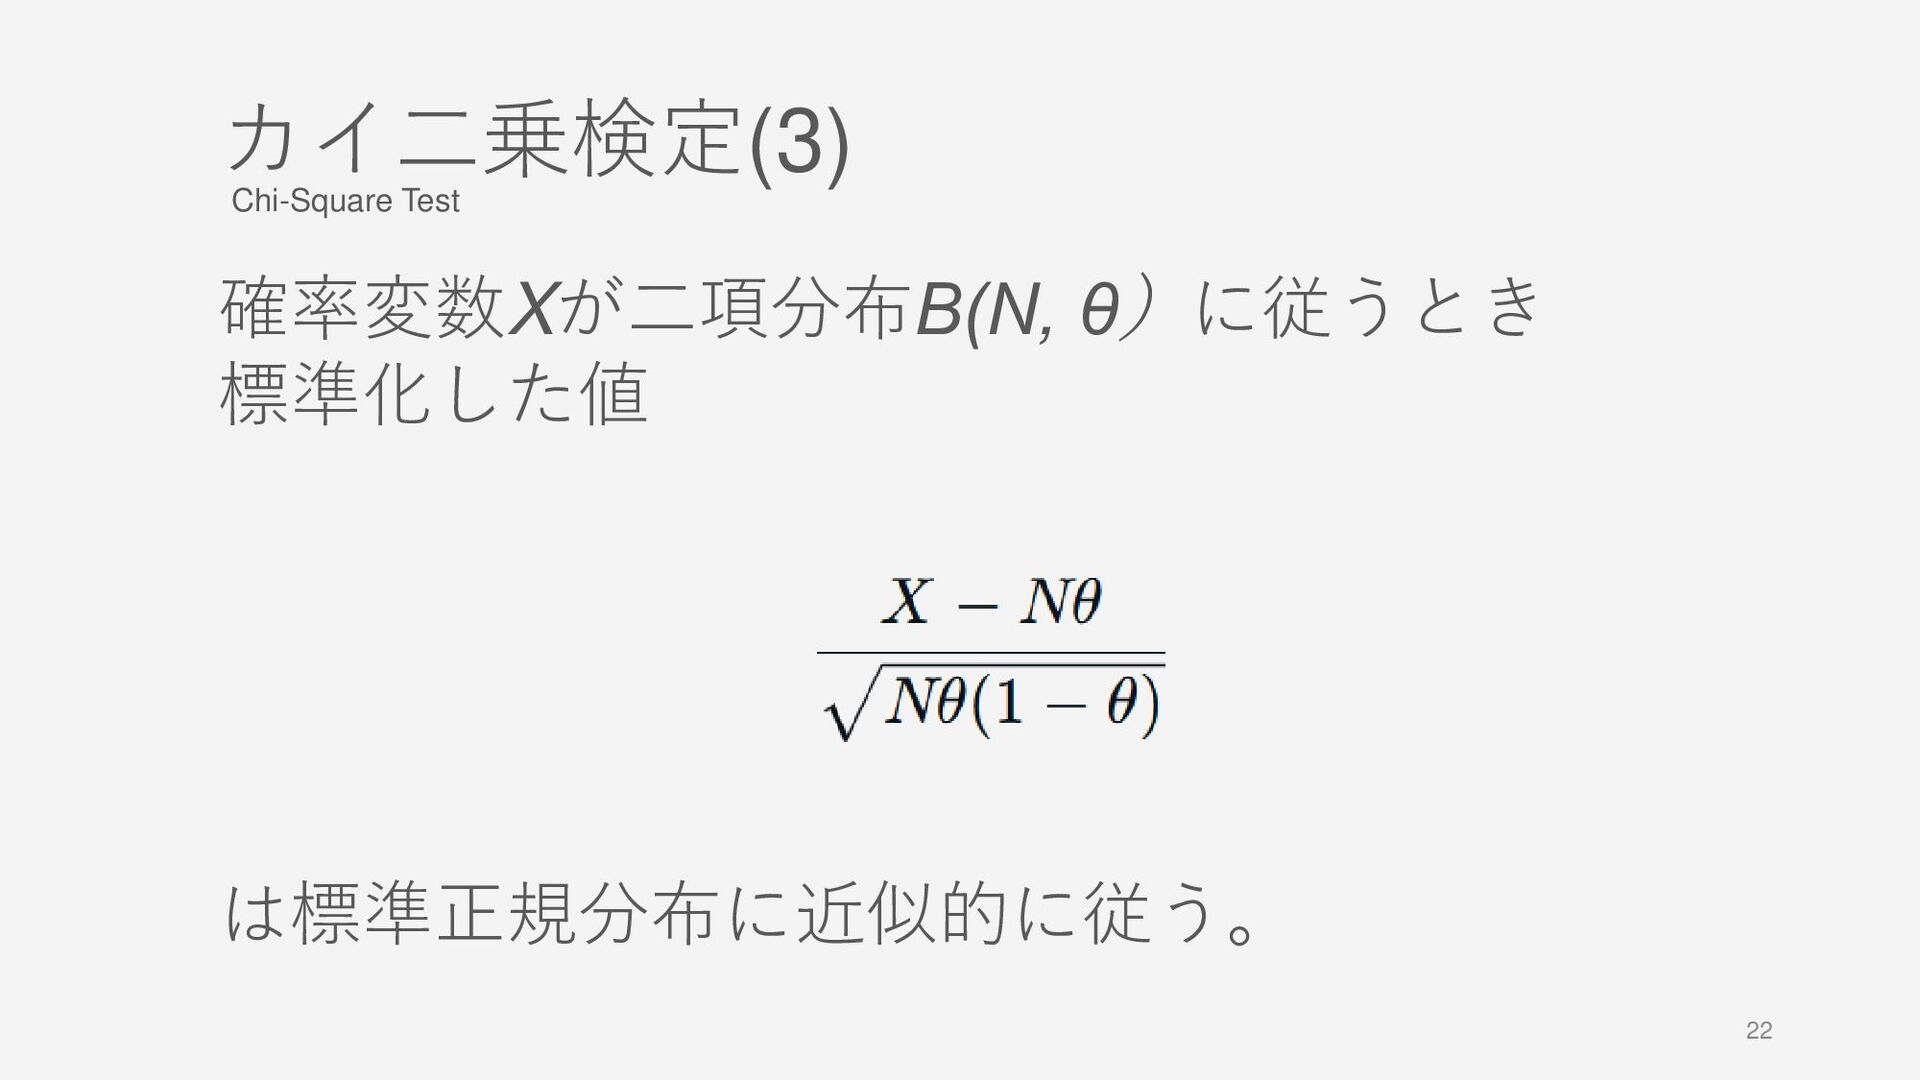
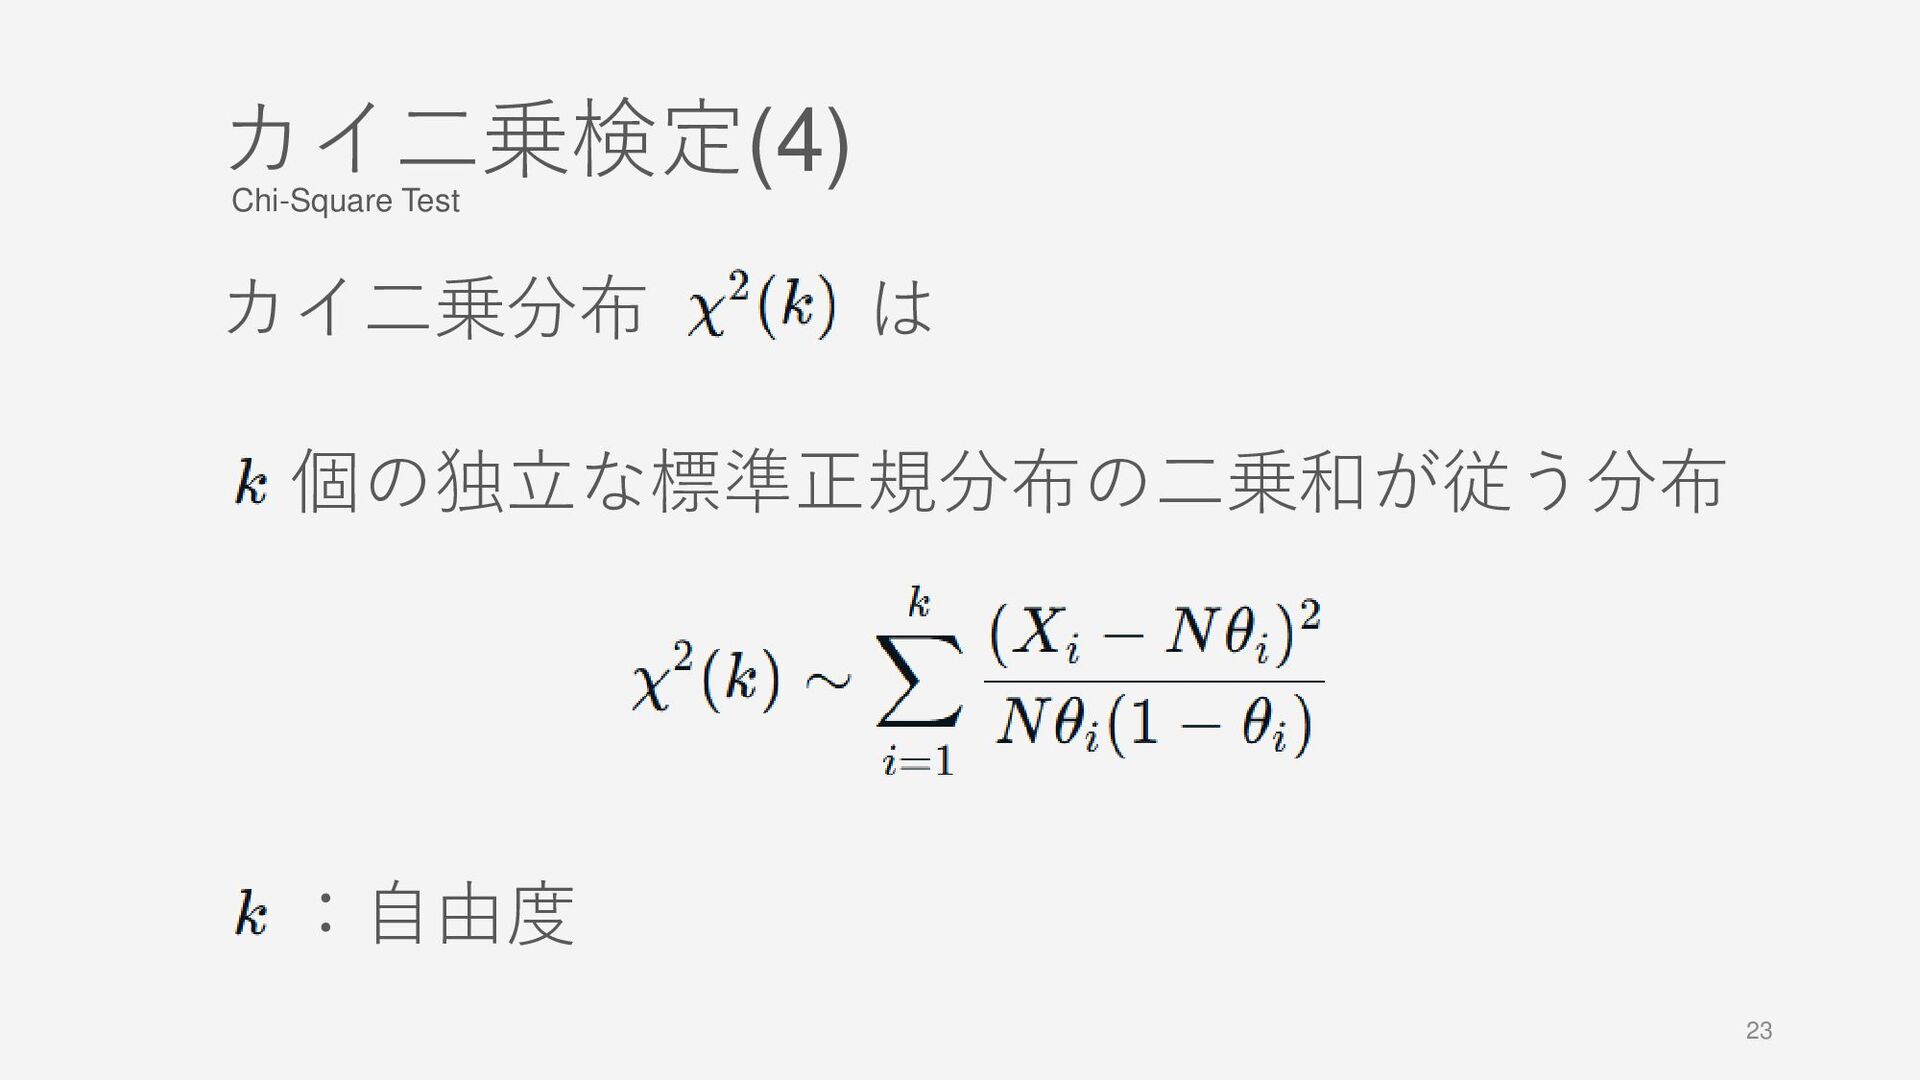
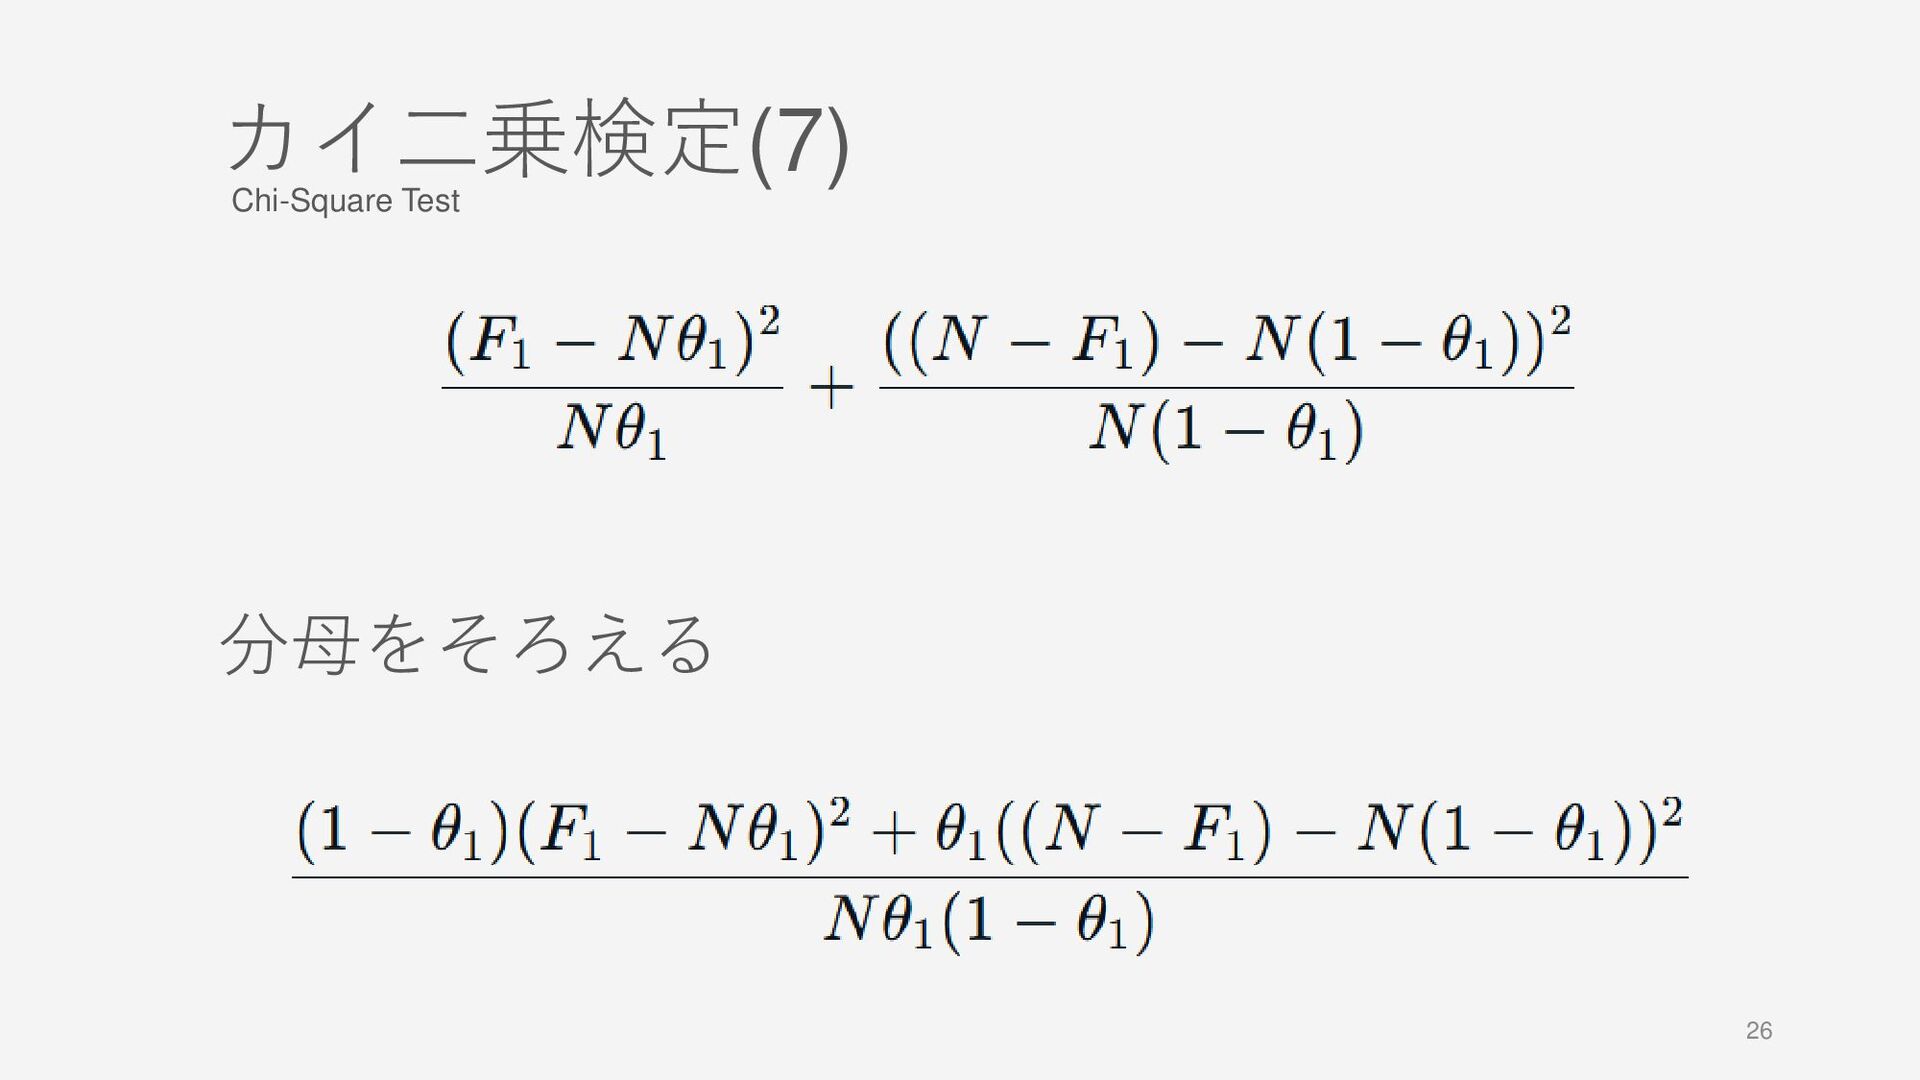
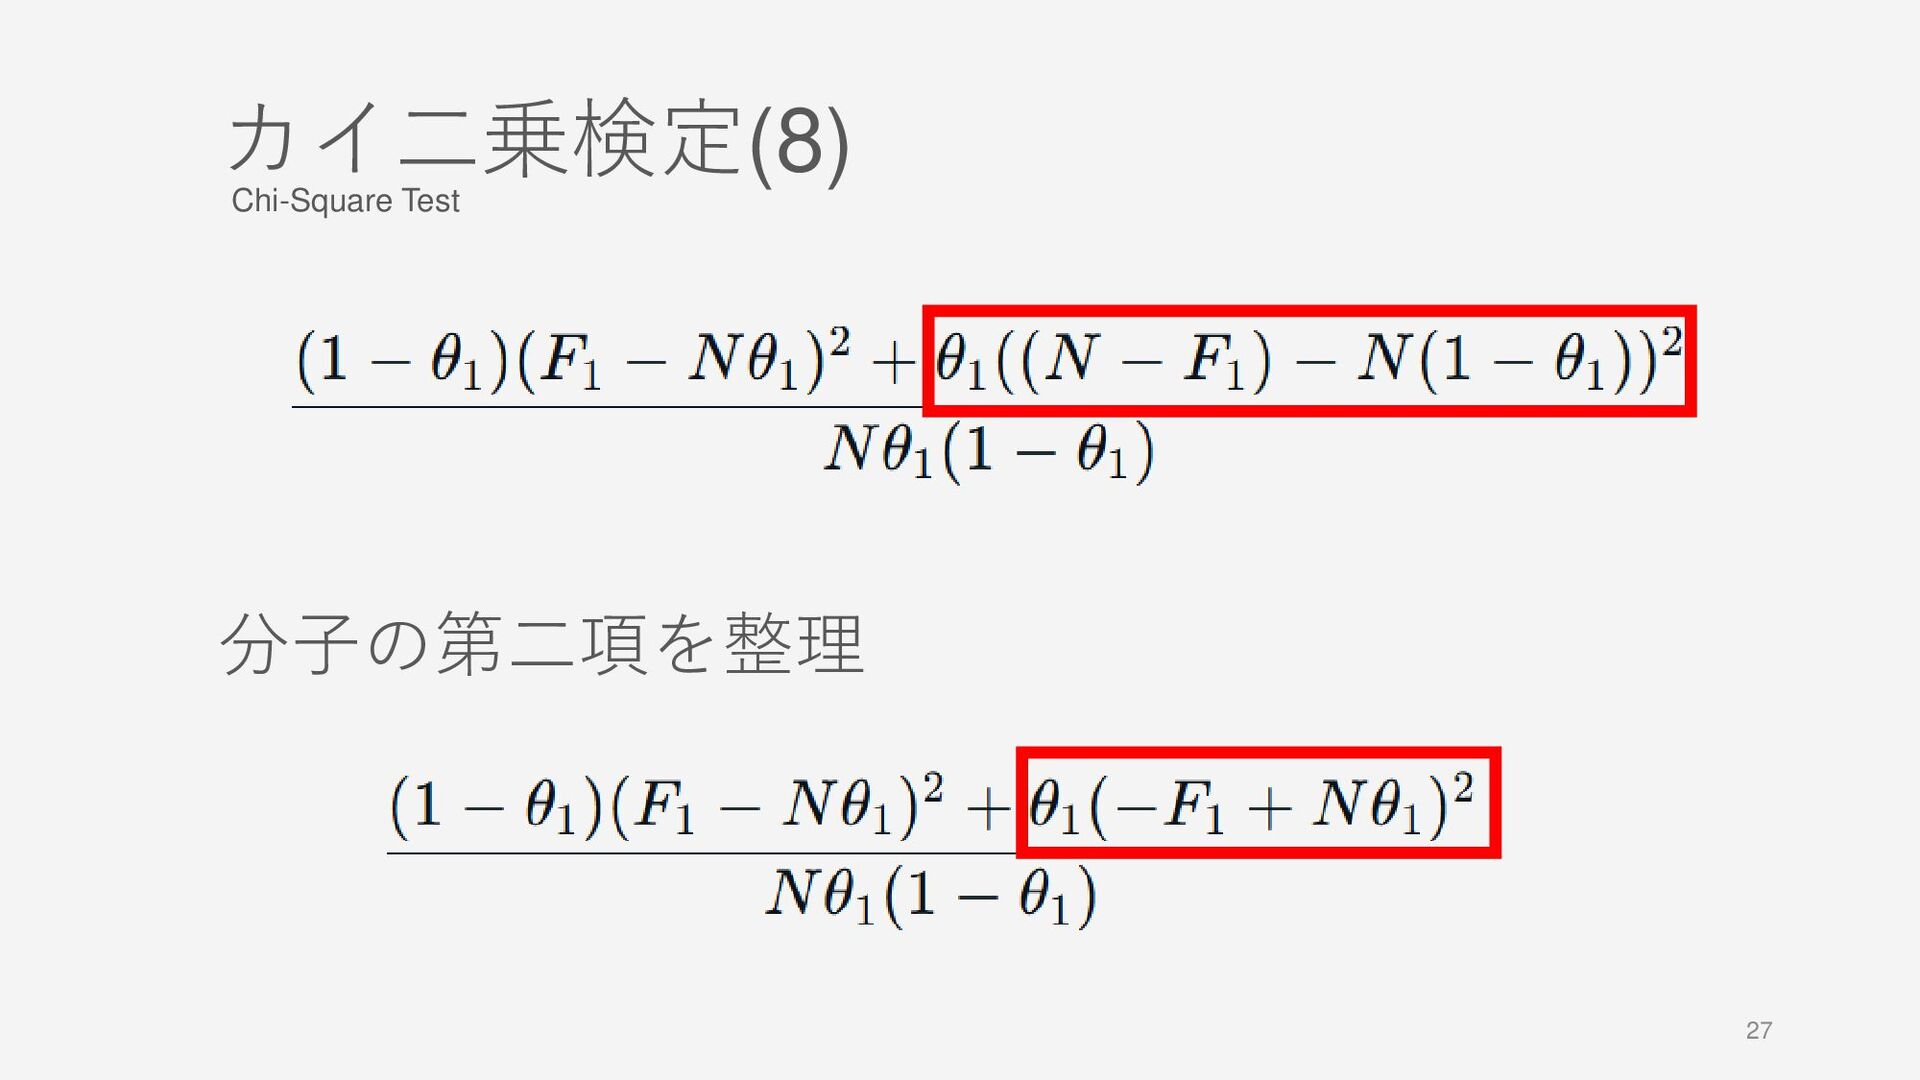
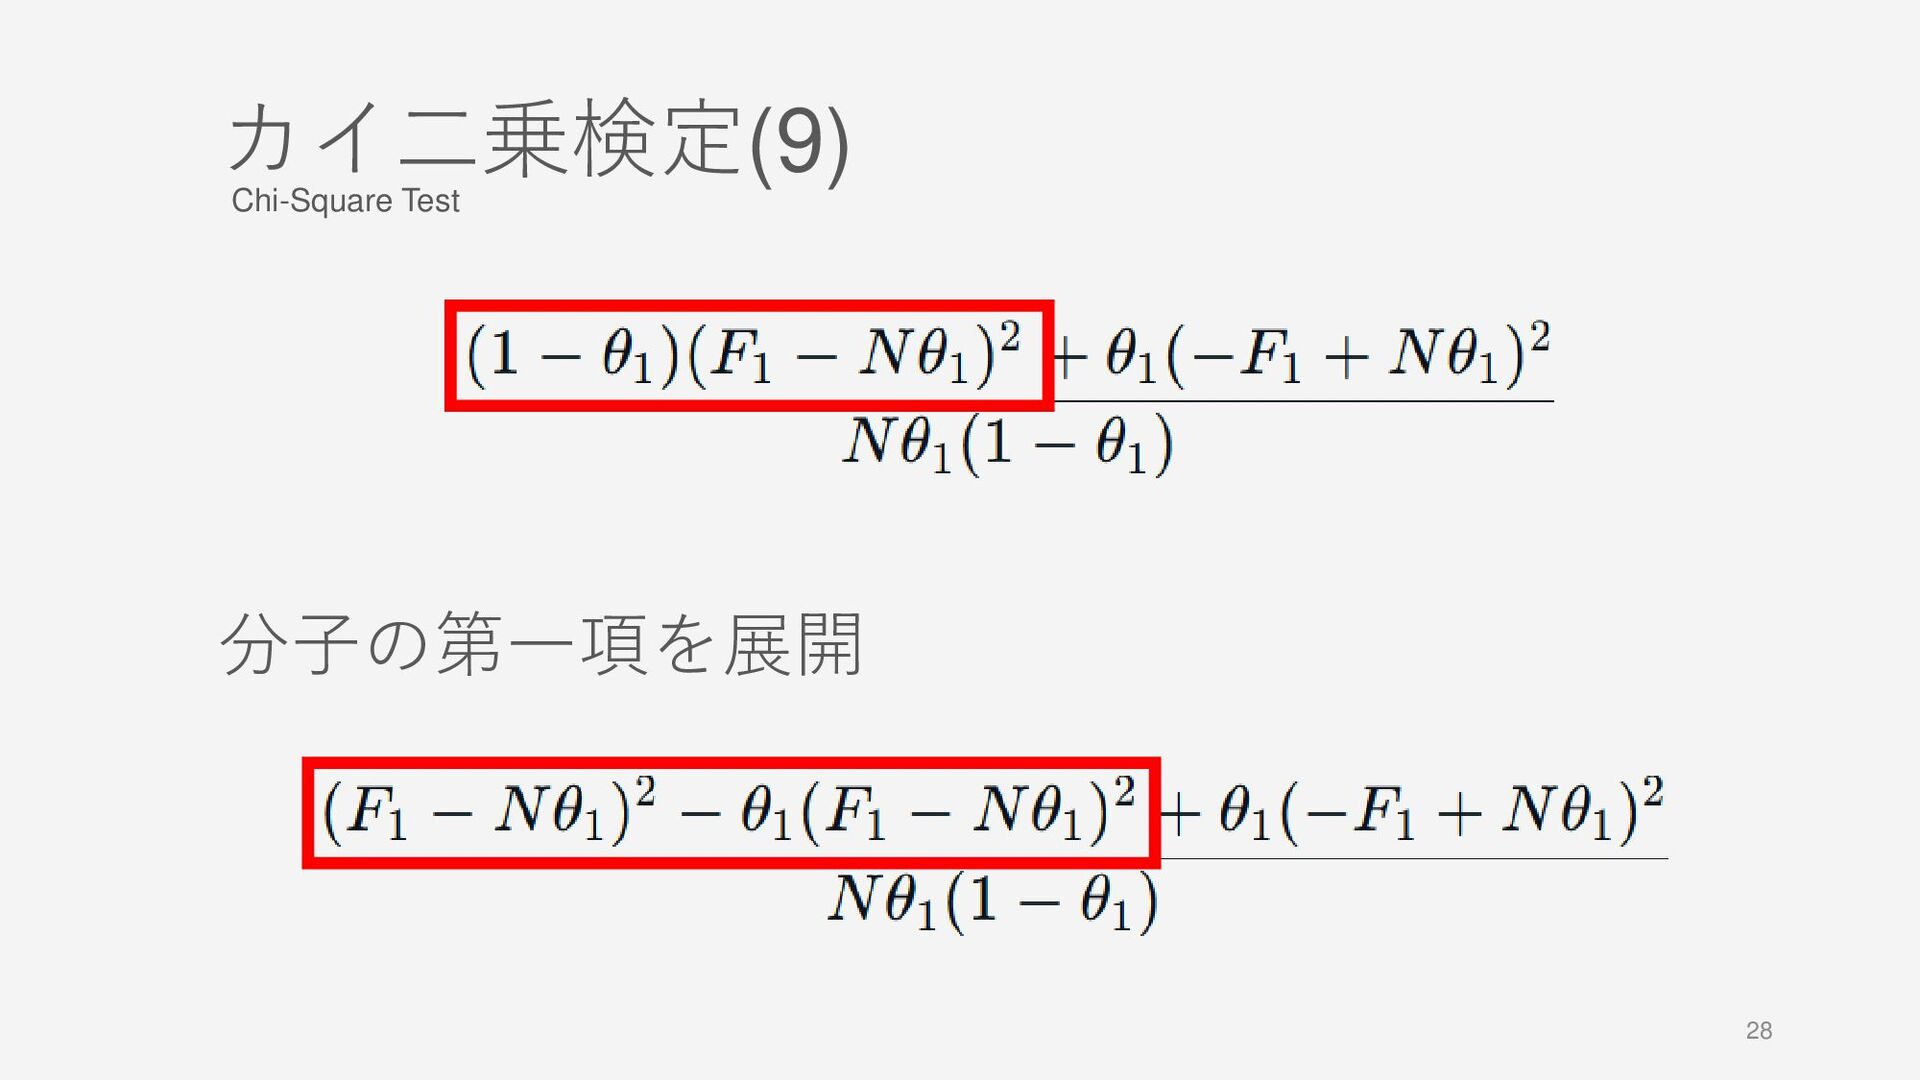
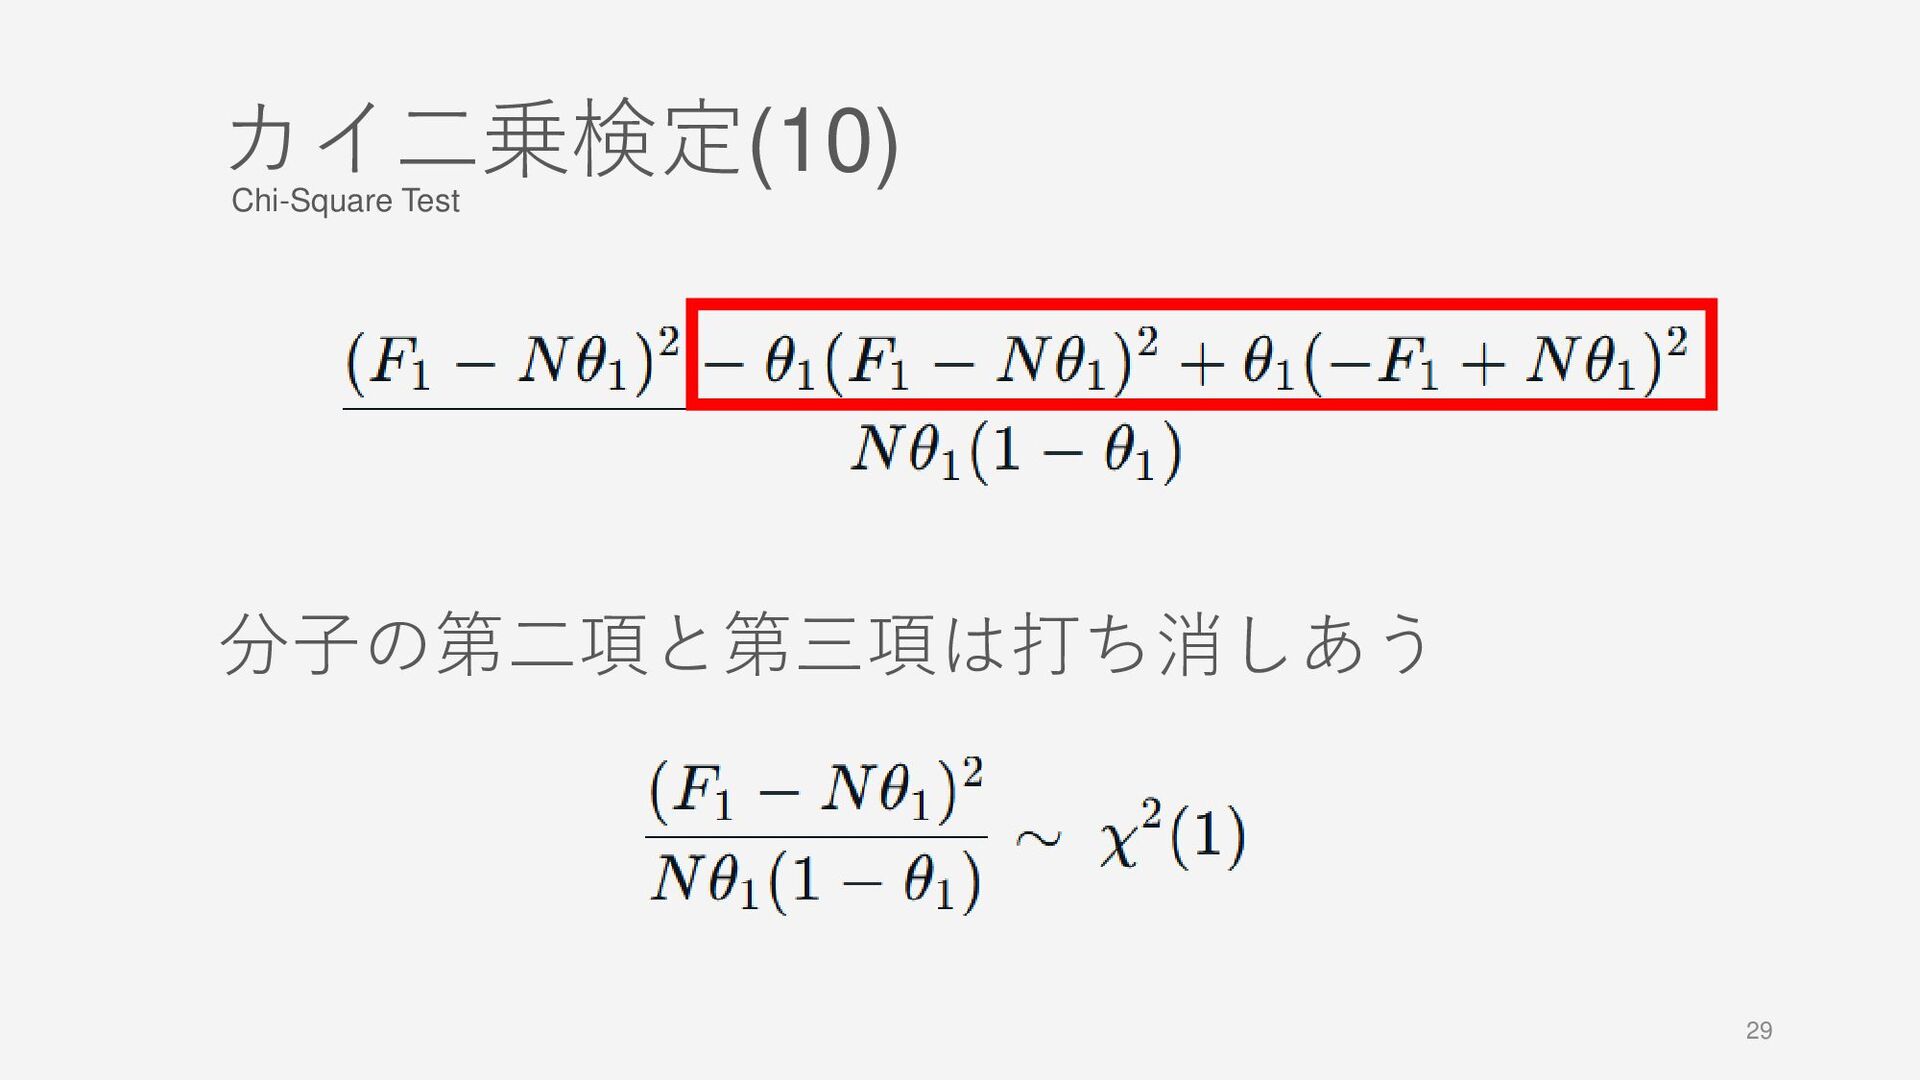
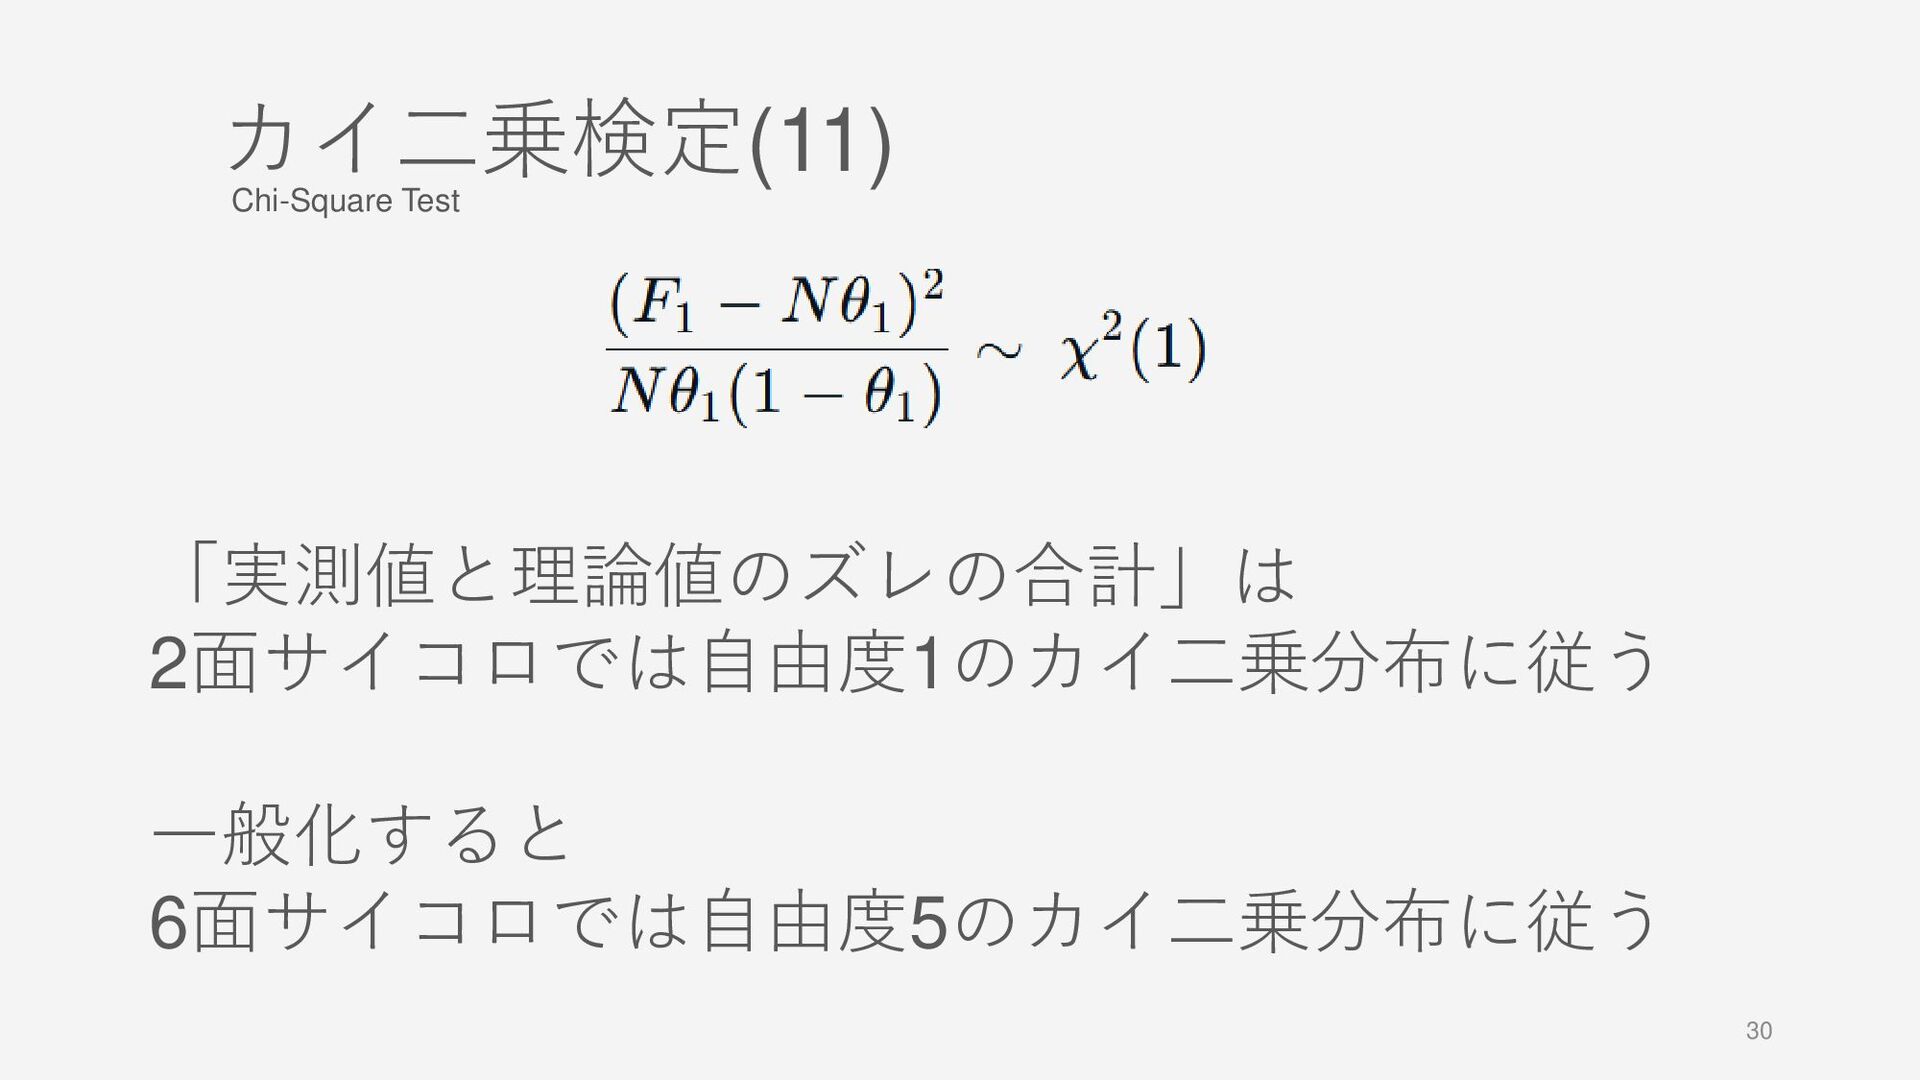
20 カイ二乗検定(1) 1. 二項分布は正規分布で近似できる。 2. 二項分布に従う確率変数を標準化すると、標準正規 分布に従う。 3. 標準正規分布の二乗和はカイ二乗分布に従う。 4.
「実測値と理論値のズレの合計」はカイ二乗分布に 従う。 Chi-Square Test 1. A binomial distribution can be approximated by a normal distribution. 2. Standardizing a binomial random variable yields a standard normal distribution. 3. The sum of squares of standard normal variables follows a chi-square distribution. 4. "Sum of deviations between observed and theoretical values" follows a chi-square distribution. -
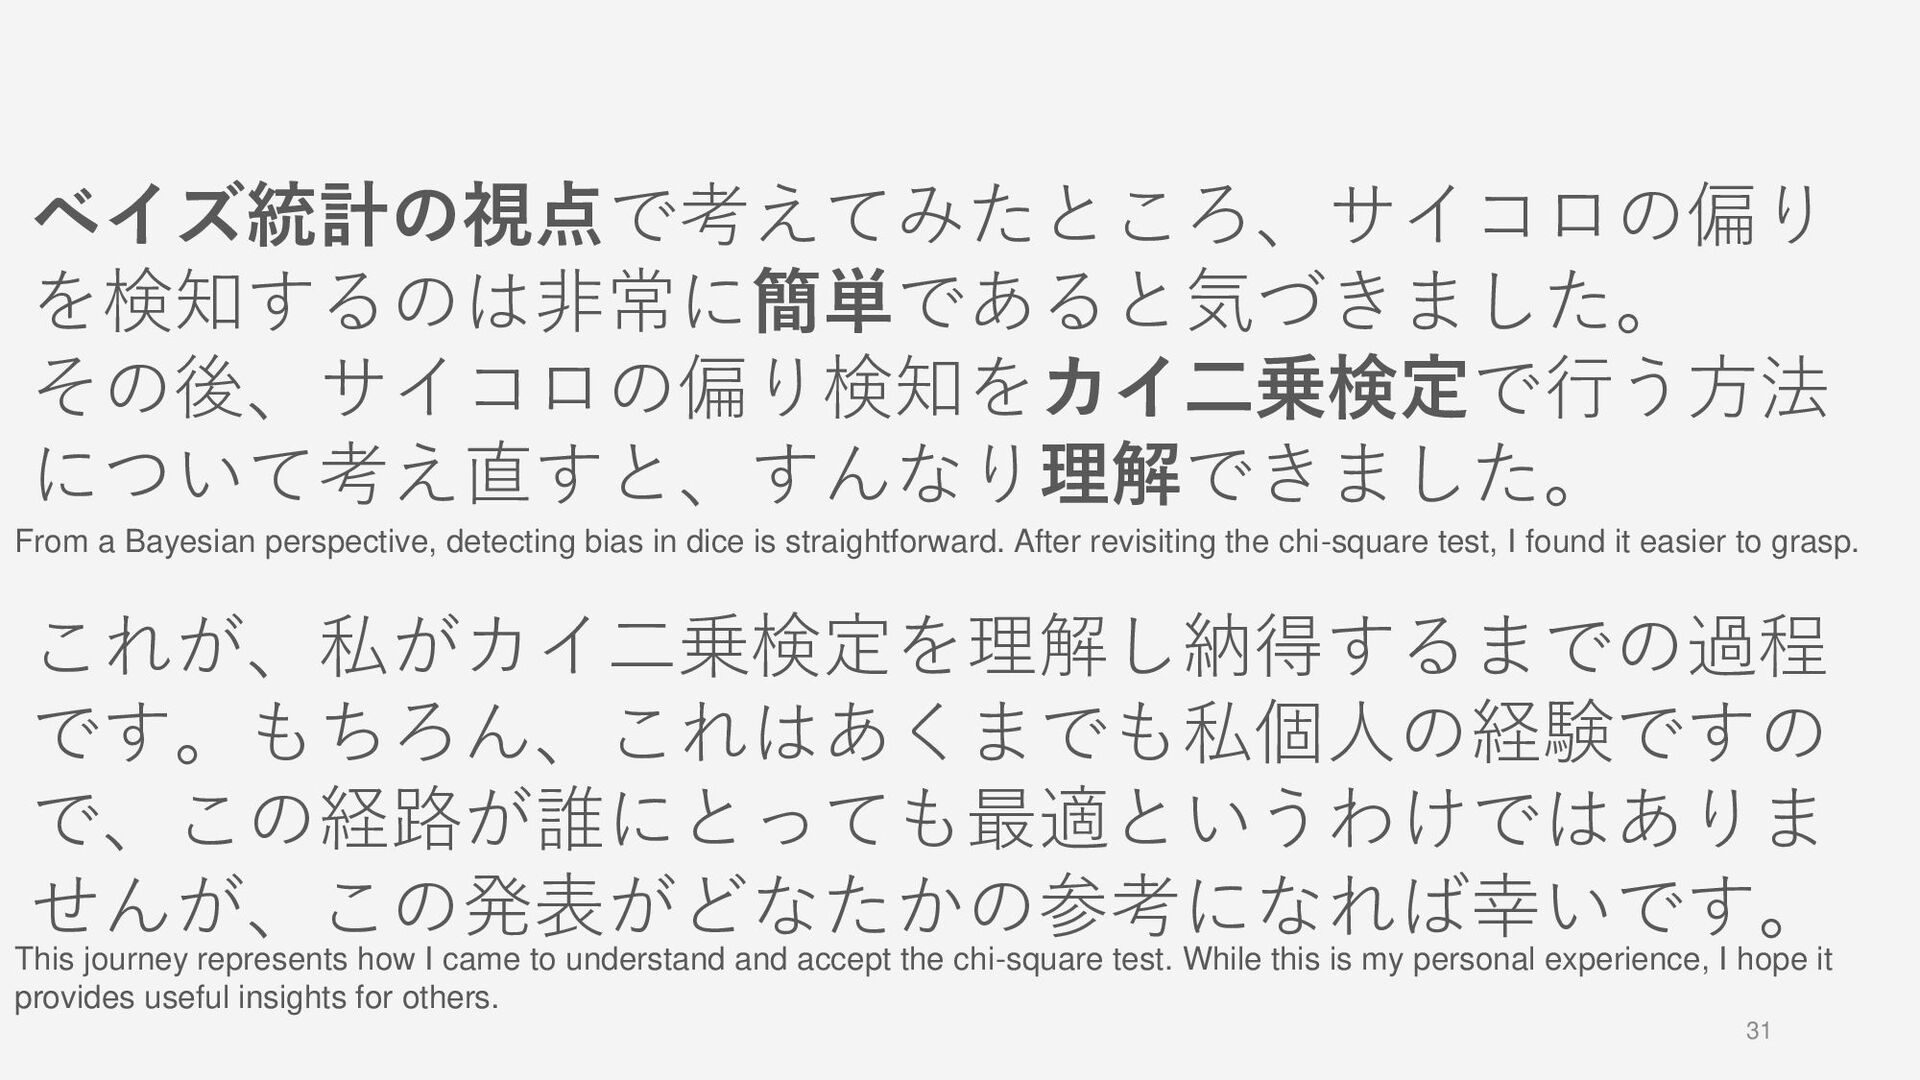
31 ベイズ統計の視点で考えてみたところ、サイコロの偏り を検知するのは非常に簡単であると気づきました。 その後、サイコロの偏り検知をカイ二乗検定で行う方法 について考え直すと、すんなり理解できました。 これが、私がカイ二乗検定を理解し納得するまでの過程 です。もちろん、これはあくまでも私個人の経験ですの で、この経路が誰にとっても最適というわけではありま せんが、この発表がどなたかの参考になれば幸いです。 From
a Bayesian perspective, detecting bias in dice is straightforward. After revisiting the chi-square test, I found it easier to grasp. This journey represents how I came to understand and accept the chi-square test. While this is my personal experience, I hope it provides useful insights for others.