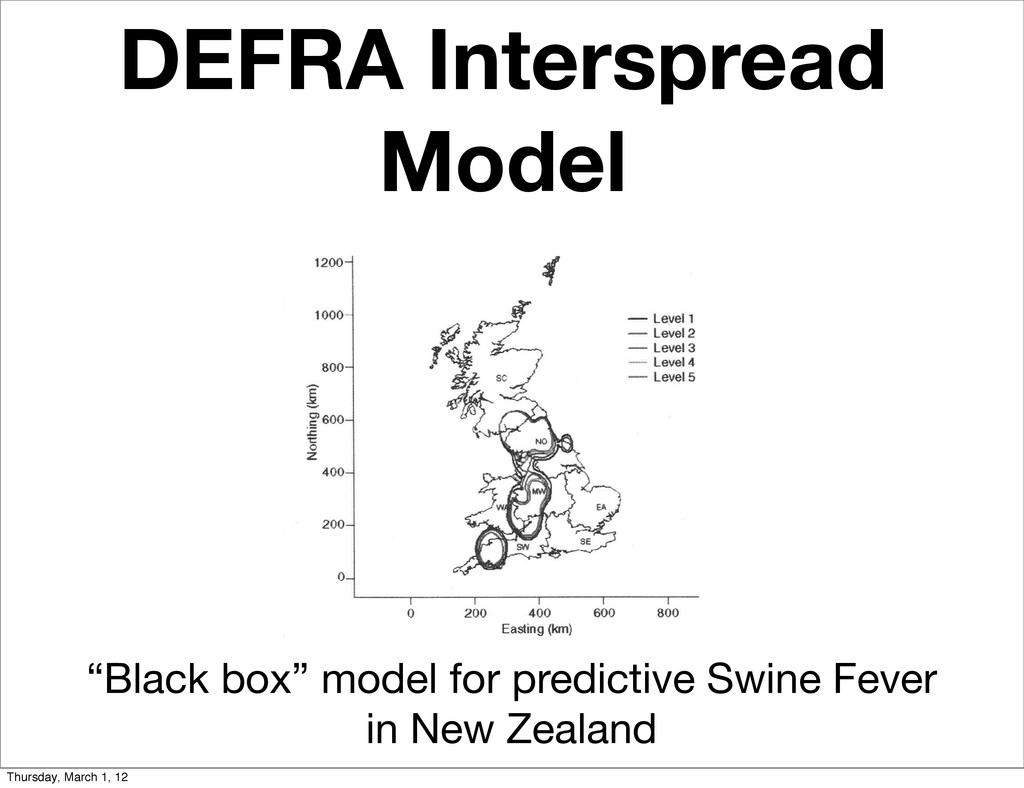
Disease Christopher Fonnesbeck Vanderbilt University Matthew Ferrari Penn State University Katriona Shea Penn State University Michael Tildesley University of Edinburgh Michael Runge USGS Patuxent Petra Klepac Princeton University Dylan George US Department of Defense Scott Isard Penn State University Andrew Flack Defense Threat Reduction Agency Thursday, March 1, 12
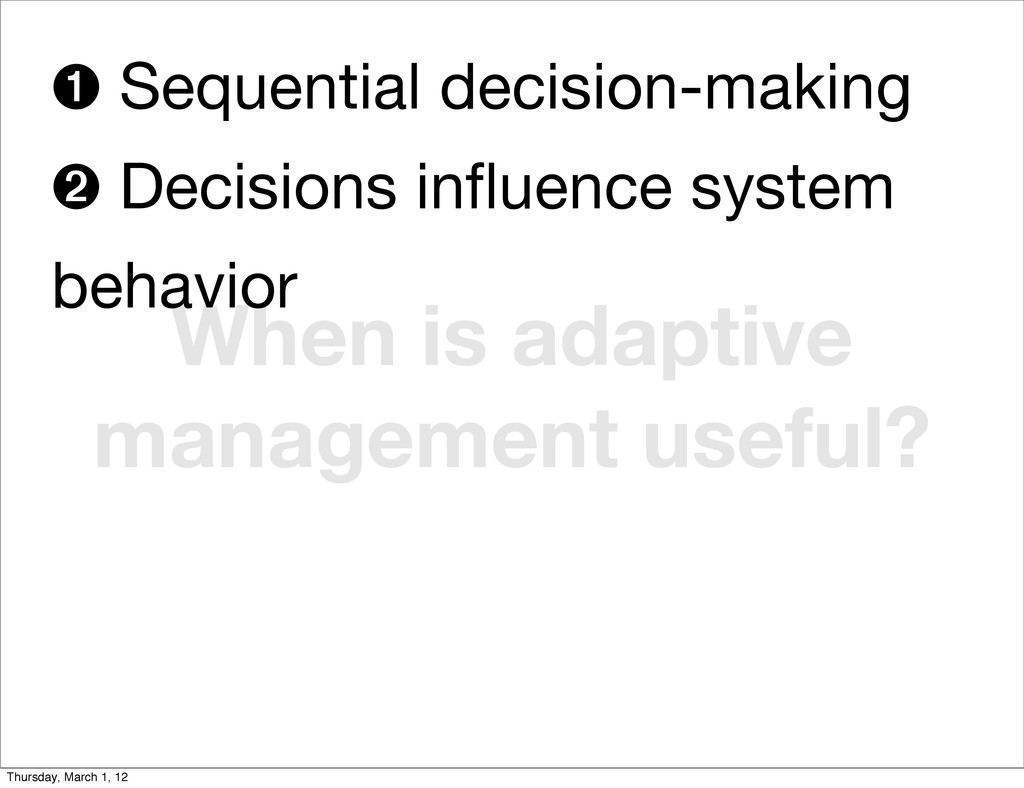
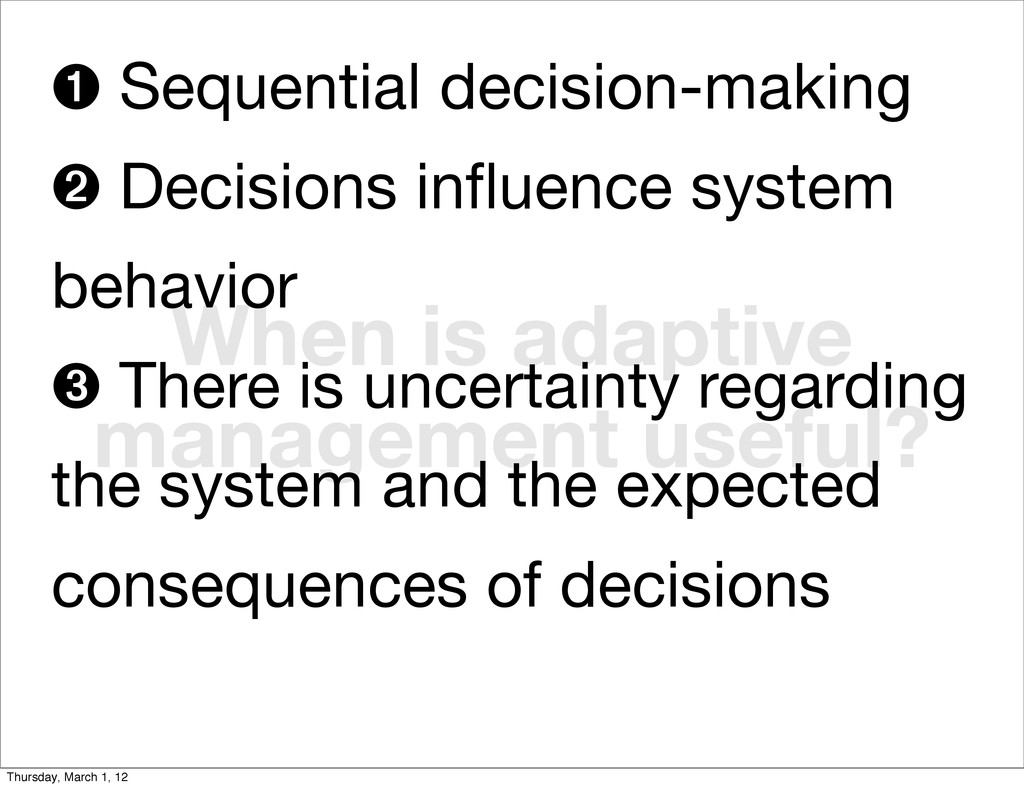
we know we know. We also know there are known unknowns; that is to say we know there are some things we do not know. But there are also unknown unknowns - the ones we don't know we don't know..." - D. Rumsfeld Thursday, March 1, 12
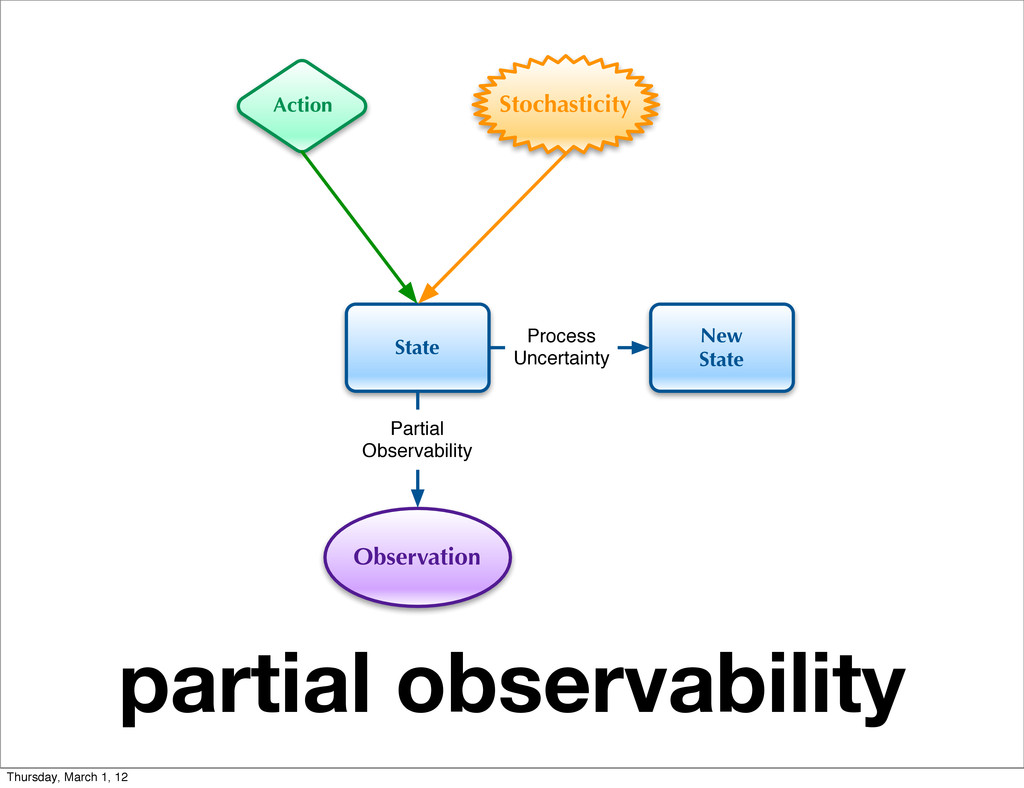
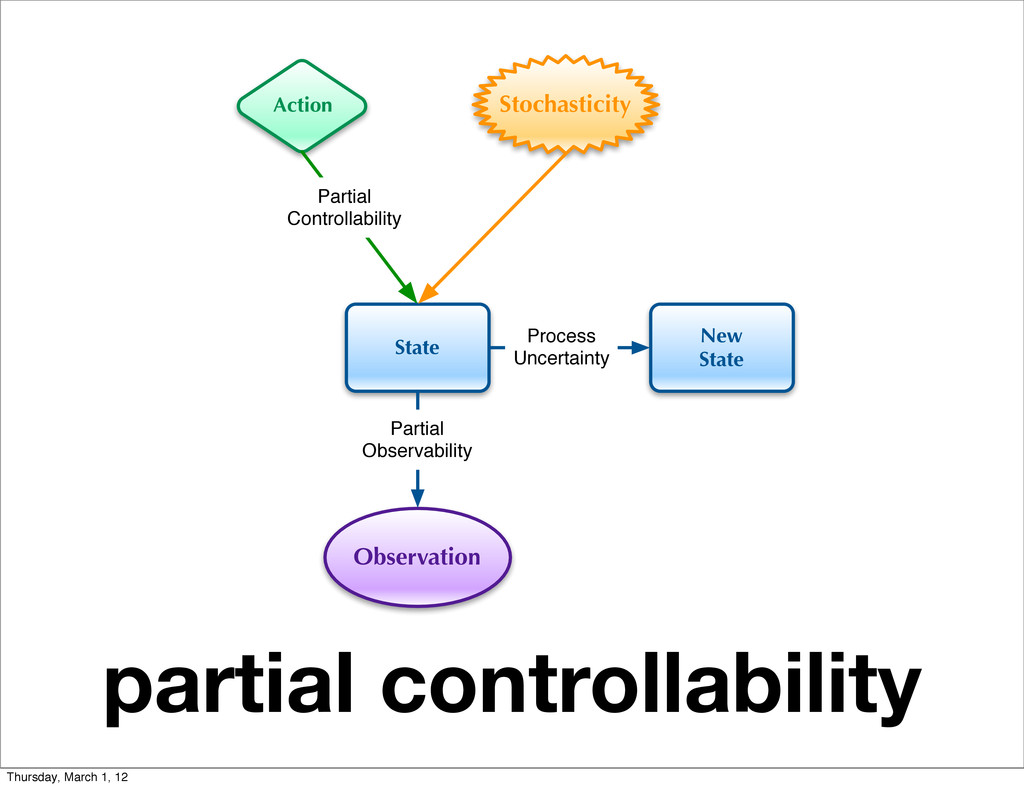
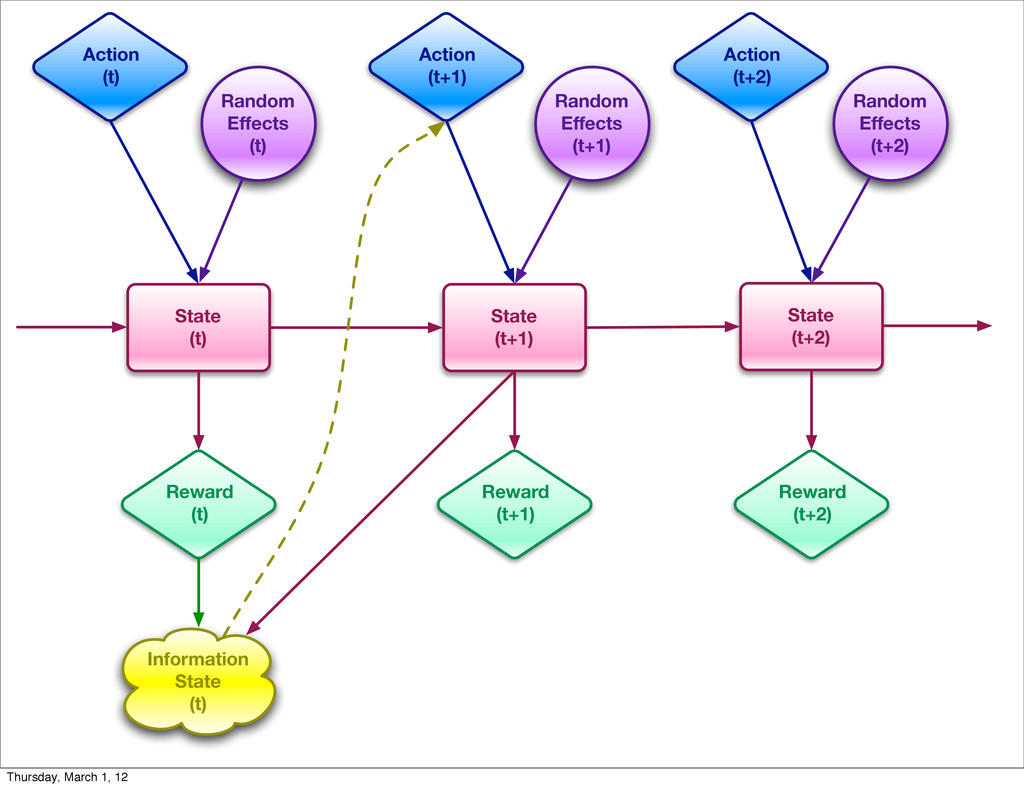
d), d 2 A t State (t) State (t+1) State (t+2) Reward (t) Reward (t+1) Reward (t+2) Random Effects (t) Random Effects (t+1) Random Effects (t+2) Action (t) Action (t+1) Action (t+2) Thursday, March 1, 12
Reward (t+2) Random Effects (t) Random Effects (t+1) Random Effects (t+2) Action (t) Action (t+1) Action (t+2) Information State (t) Thursday, March 1, 12
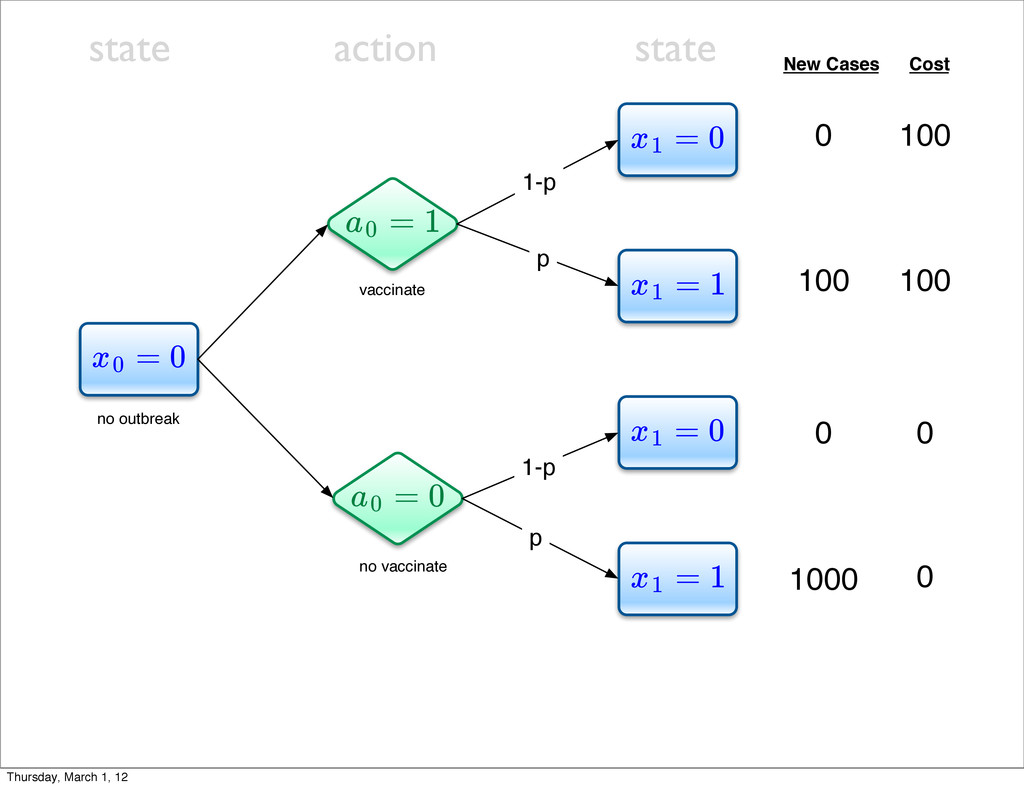
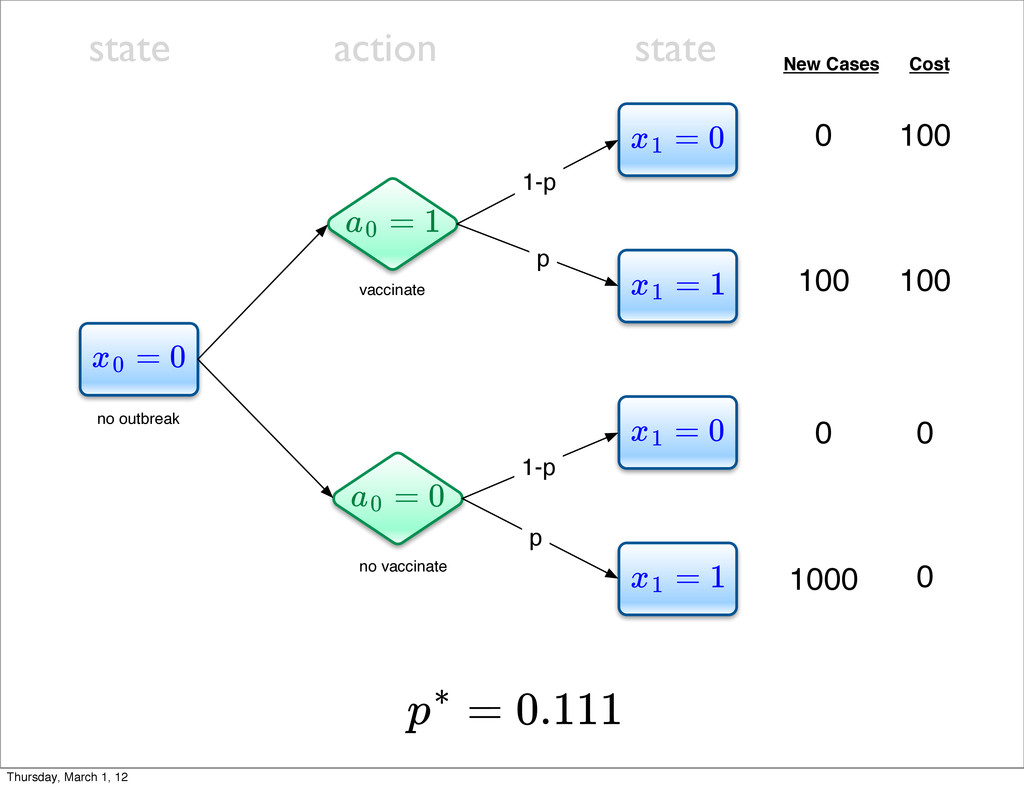
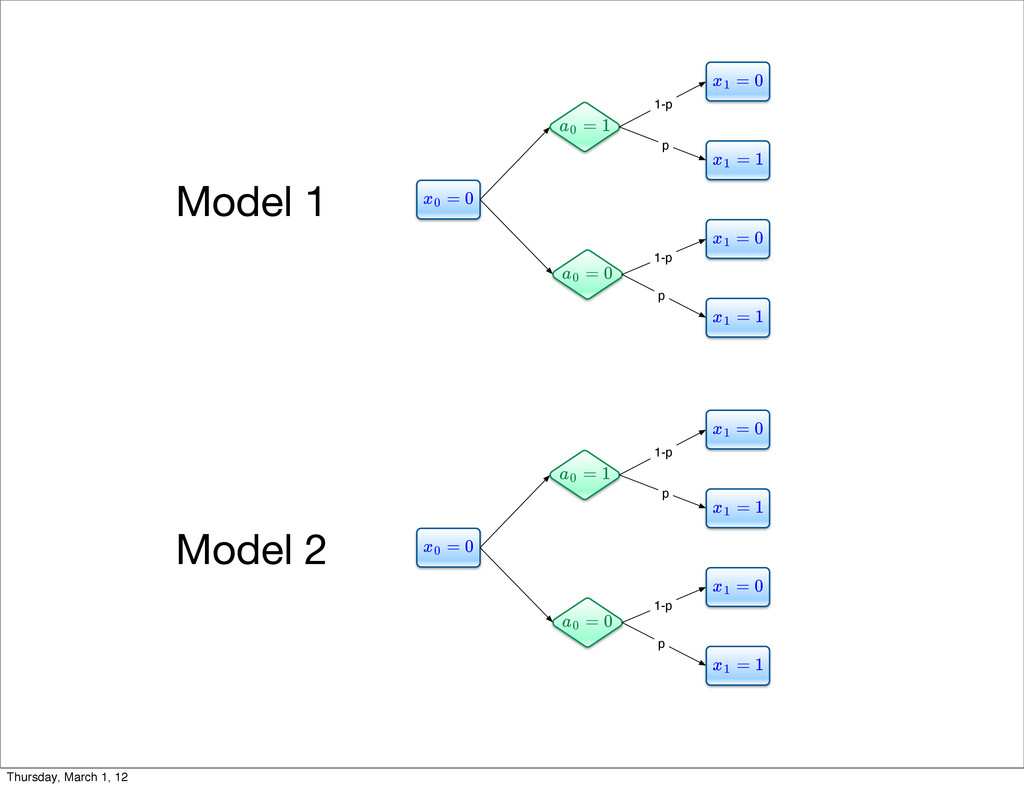
1 x1 = 0 x1 = 1 a0 = 0 a0 vaccinate no vaccinate no outbreak New Cases Cost 0 0 100 100 0 0 100 1000 1-p p 1-p p state action state Thursday, March 1, 12
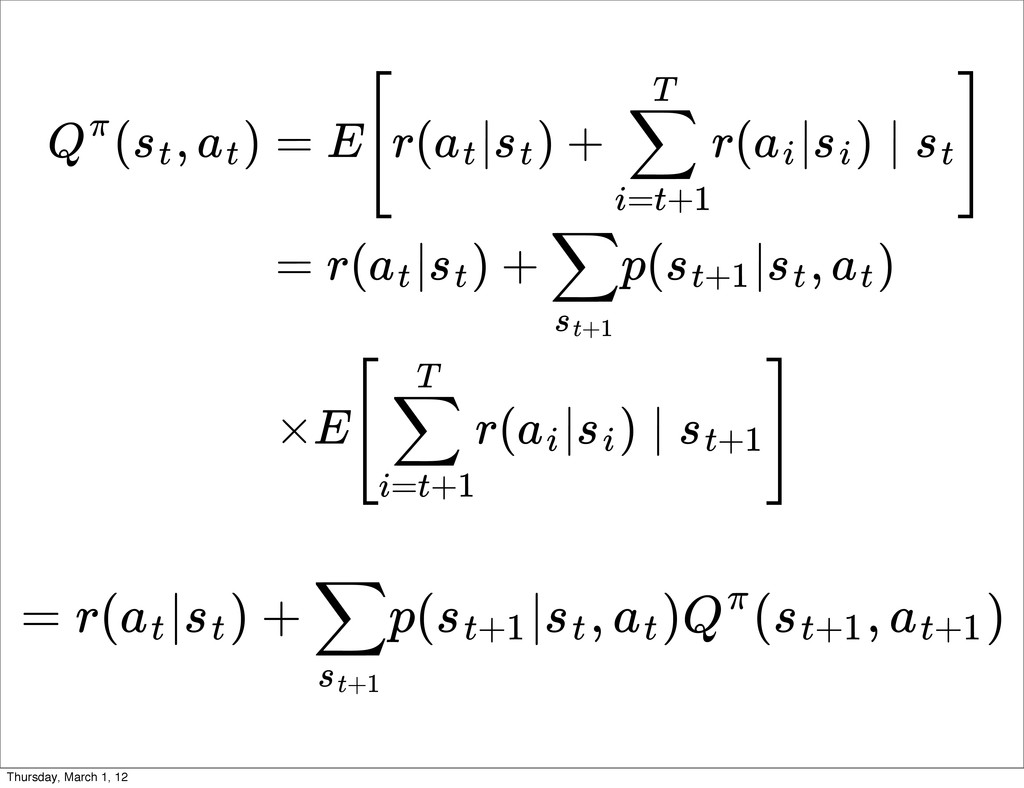
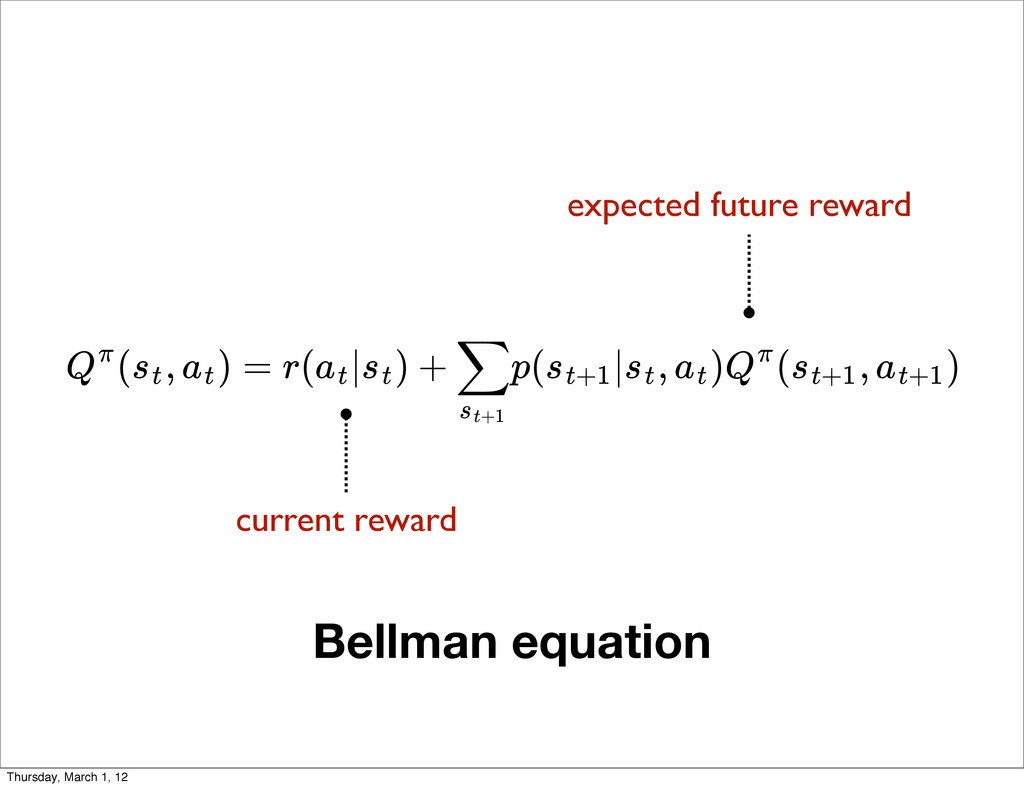
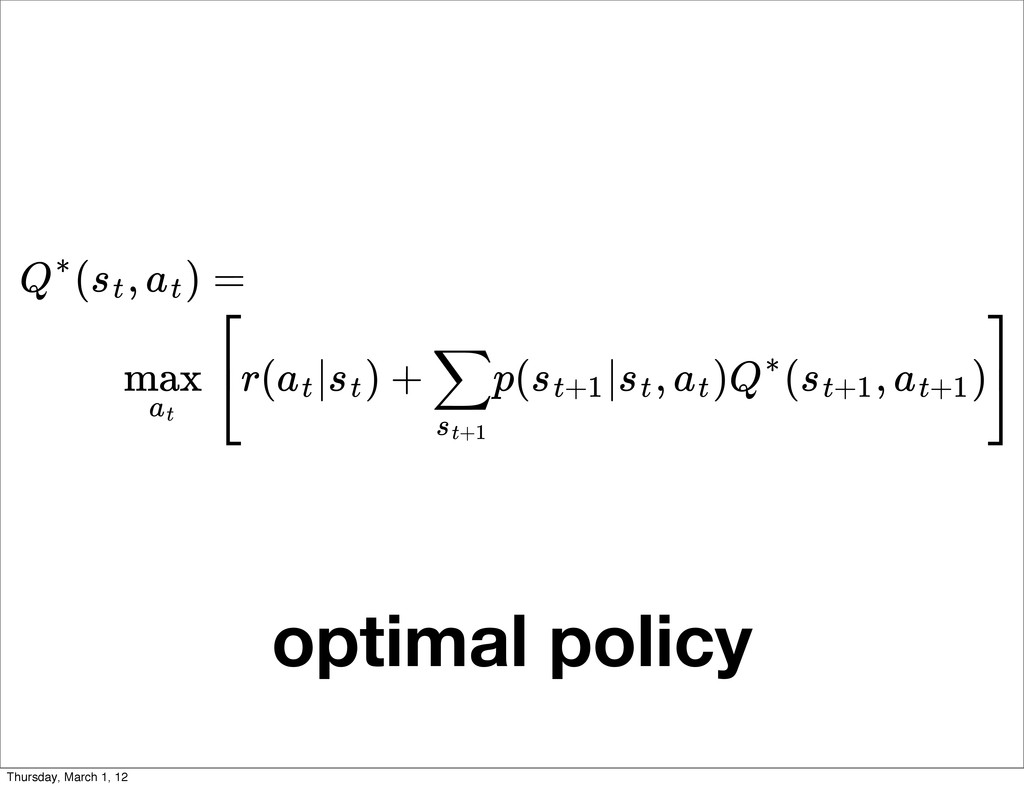
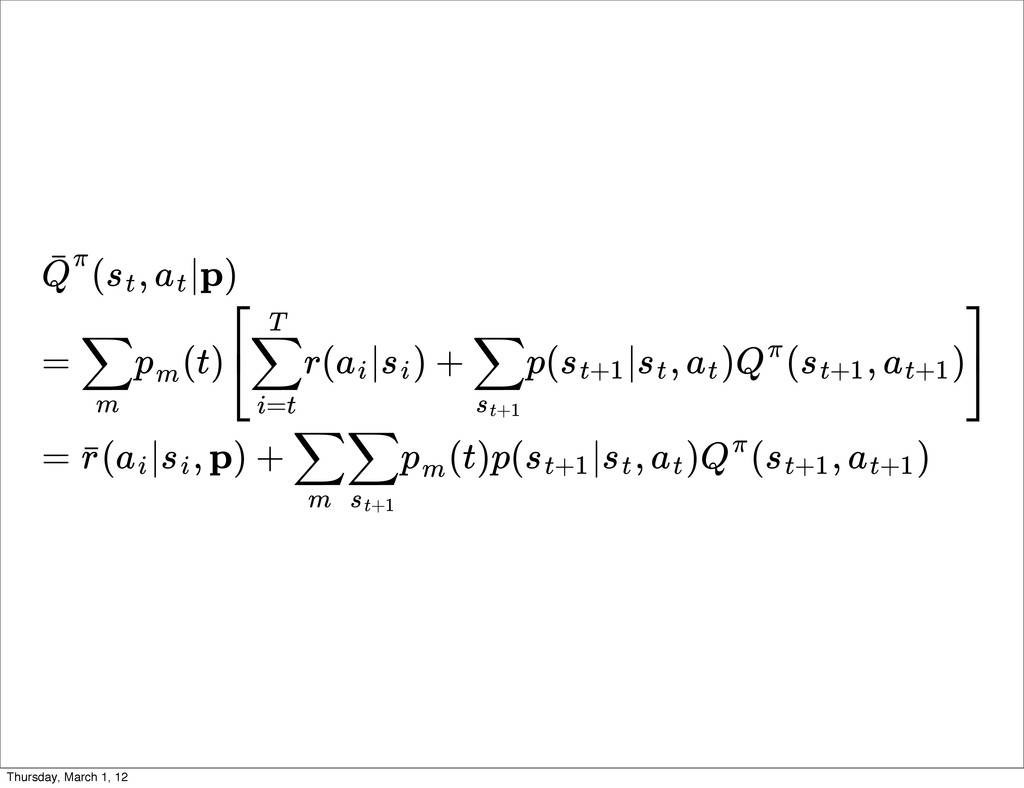
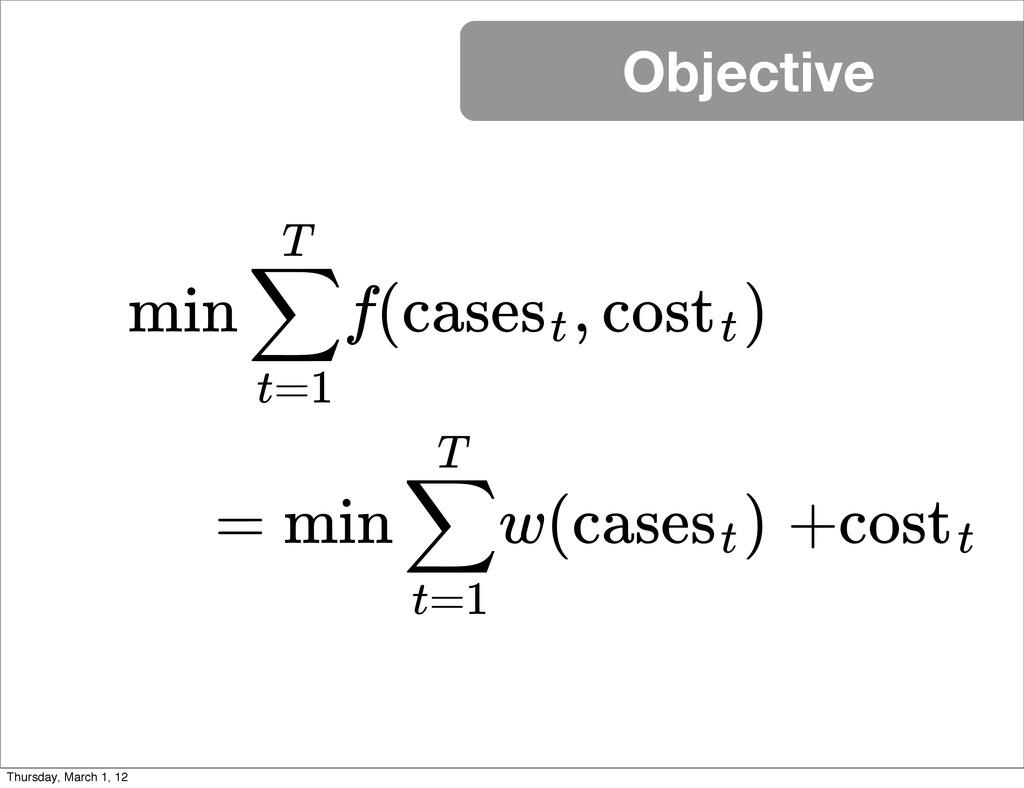
+ r( | ) ∣ ] at st ∑ i=t+1 T ai si st = r( | ) + p( | , ) at st ∑ st+1 st+1 st at ×E[ r( | ) ∣ ] ∑ i=t+1 T ai si st+1 = r( | ) + p( | , ) ( , ) at st ∑ st+1 st+1 st at Qπ st+1 at+1 Thursday, March 1, 12
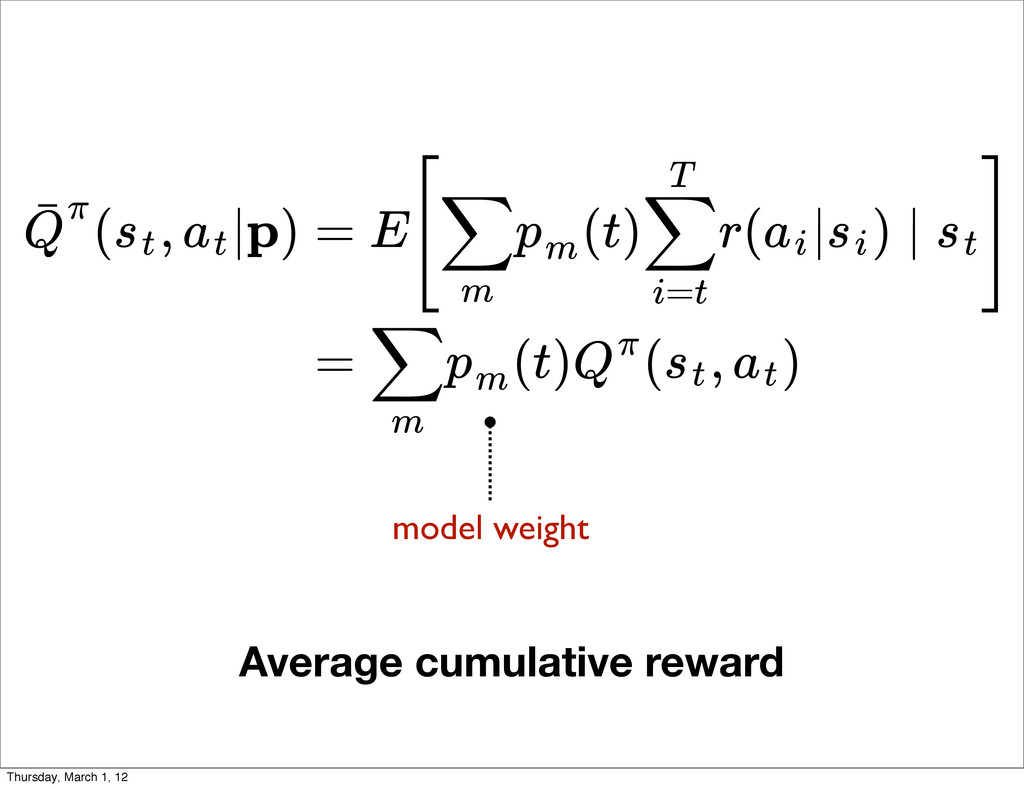
| ) + p( | , ) ( , ) ∑ m pm ⎡ ⎣ ∑ i=t T ai si ∑ st+1 st+1 st at Qπ st+1 at+1 ⎤ ⎦ = ( | , p) + (t)p( | , ) ( , ) r ˉ ai si ∑ m ∑ st+1 pm st+1 st at Qπ st+1 at+1 Thursday, March 1, 12
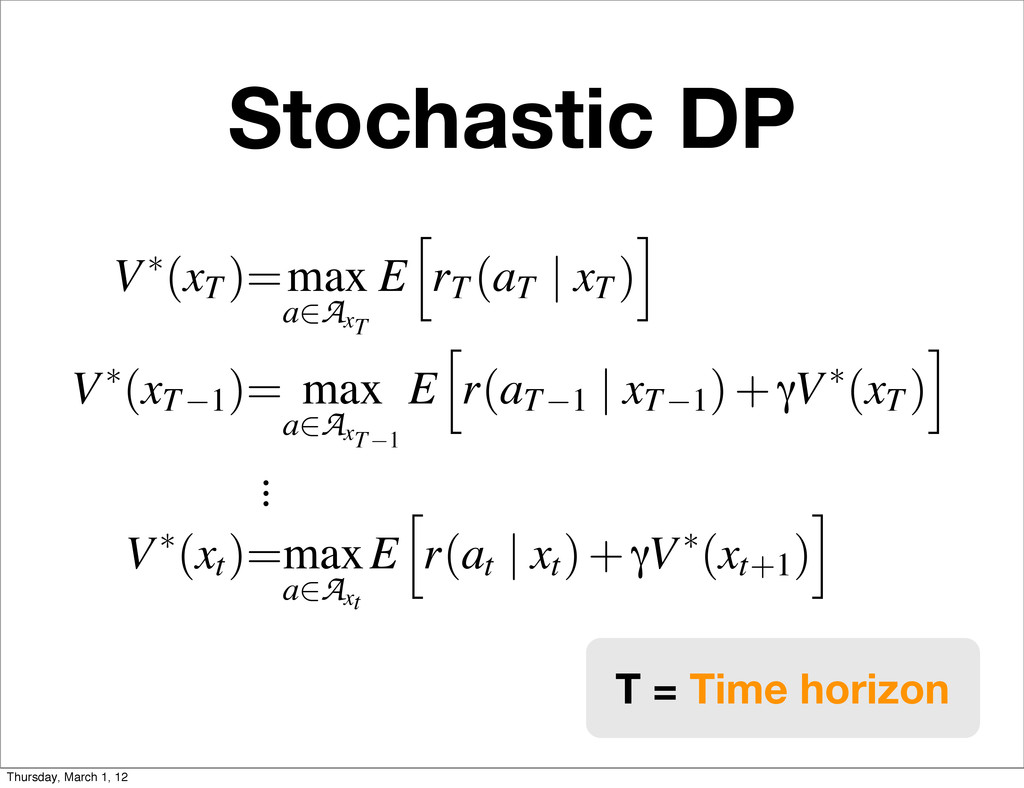
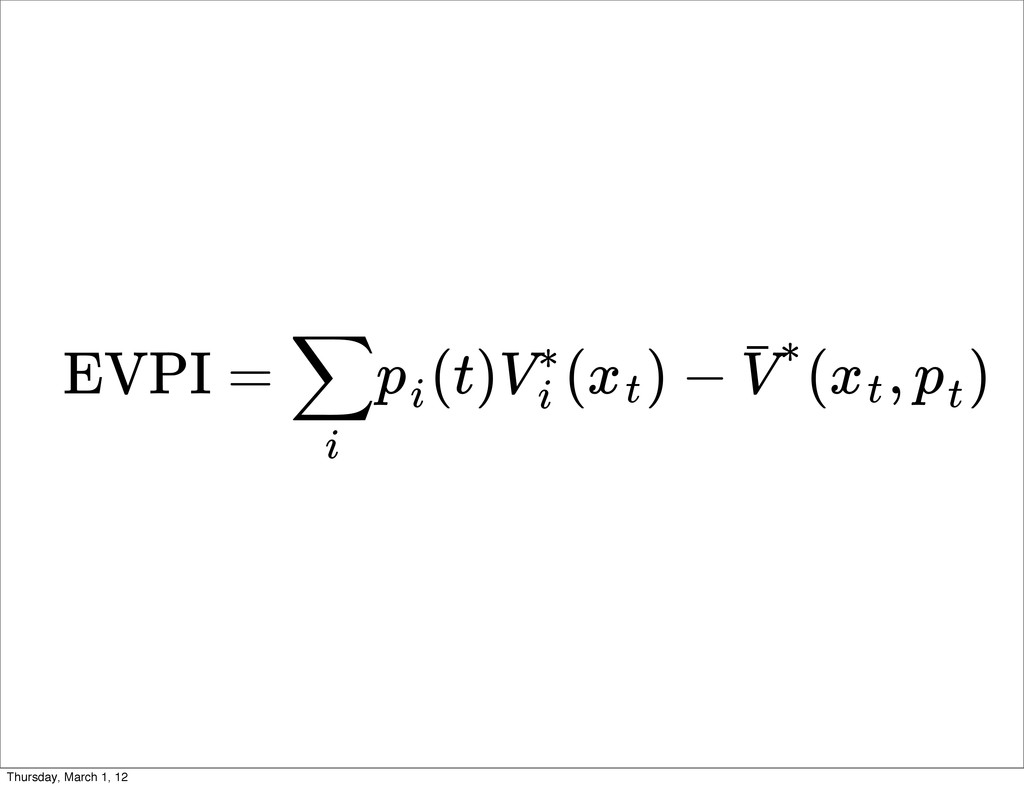
| xT ) i V⇤(xT 1 )= max a2A xT 1 E h r(aT 1 | xT 1 )+γV⇤(xT ) i . . . V⇤(xt )=max a2A xt E h r(at | xt )+γV⇤(xt+1 ) i T = Time horizon Thursday, March 1, 12
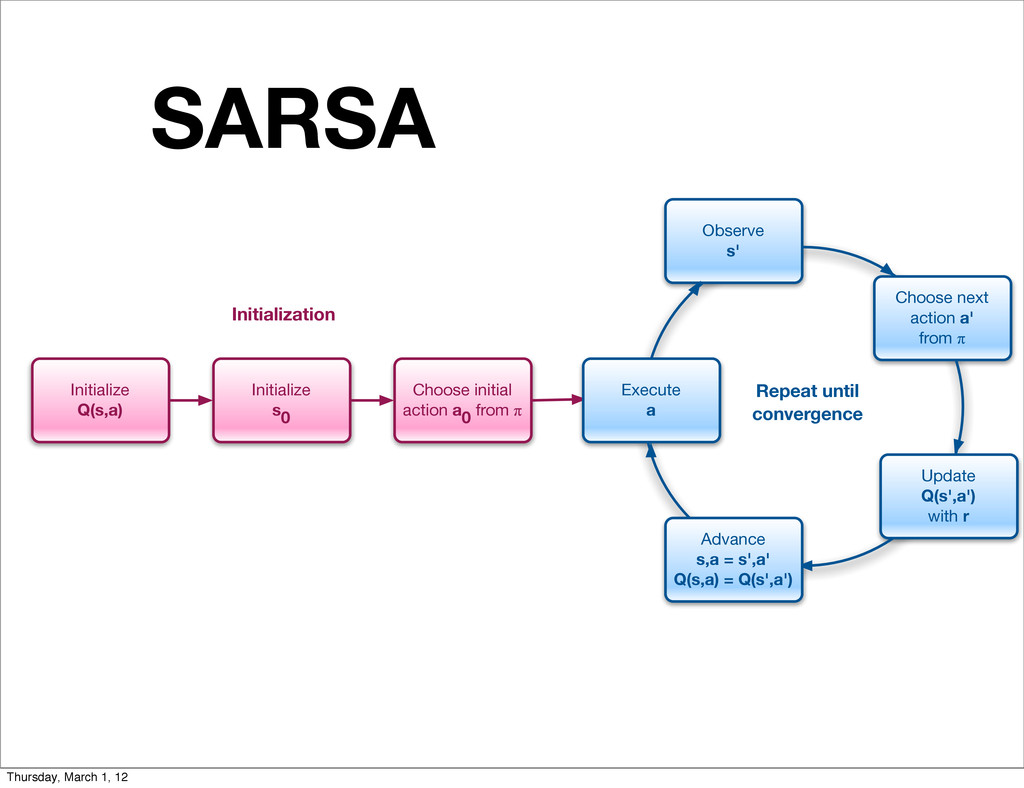
Execute a Observe s' Choose next action a' from π Update Q(s',a') with r Advance s,a = s',a' Q(s,a) = Q(s',a') SARSA Repeat until convergence Initialization Thursday, March 1, 12
Execute a Observe s' Choose next action a' from π Update Q(s',a') with r Advance s,a = s',a' Q(s,a) = Q(s',a') SARSA Repeat until convergence Initialization Q (s, a) = Q(s, a) + [r + ⇥Q(s , a ) Q(s, a)] Thursday, March 1, 12
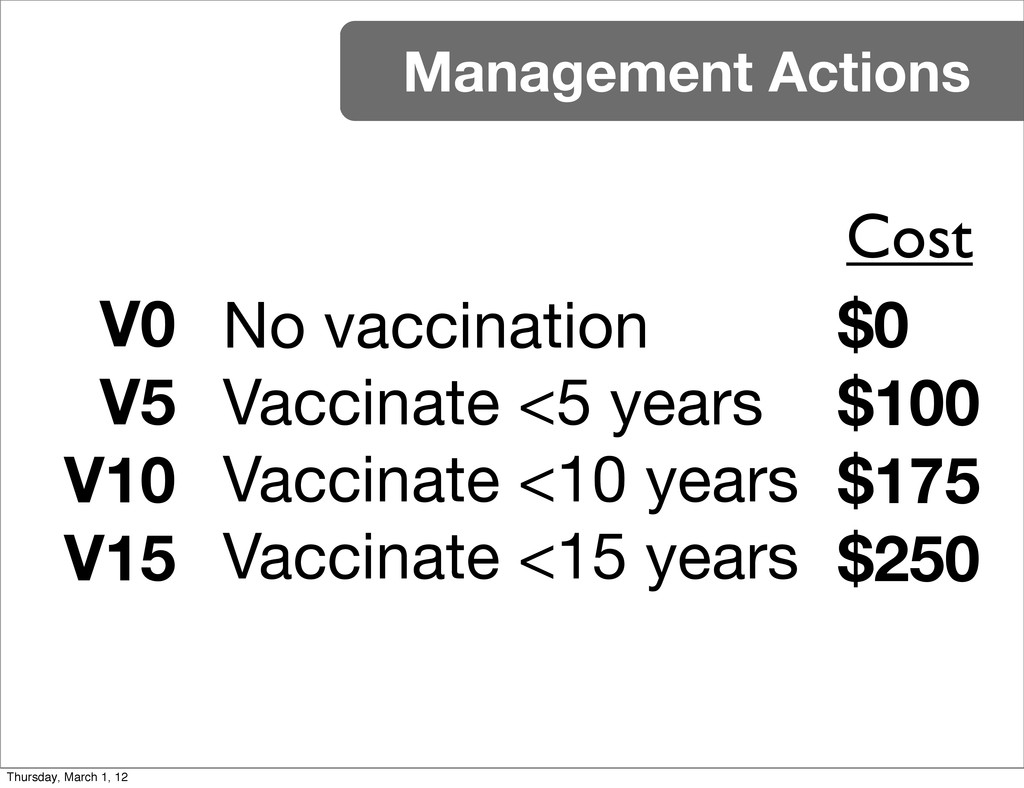
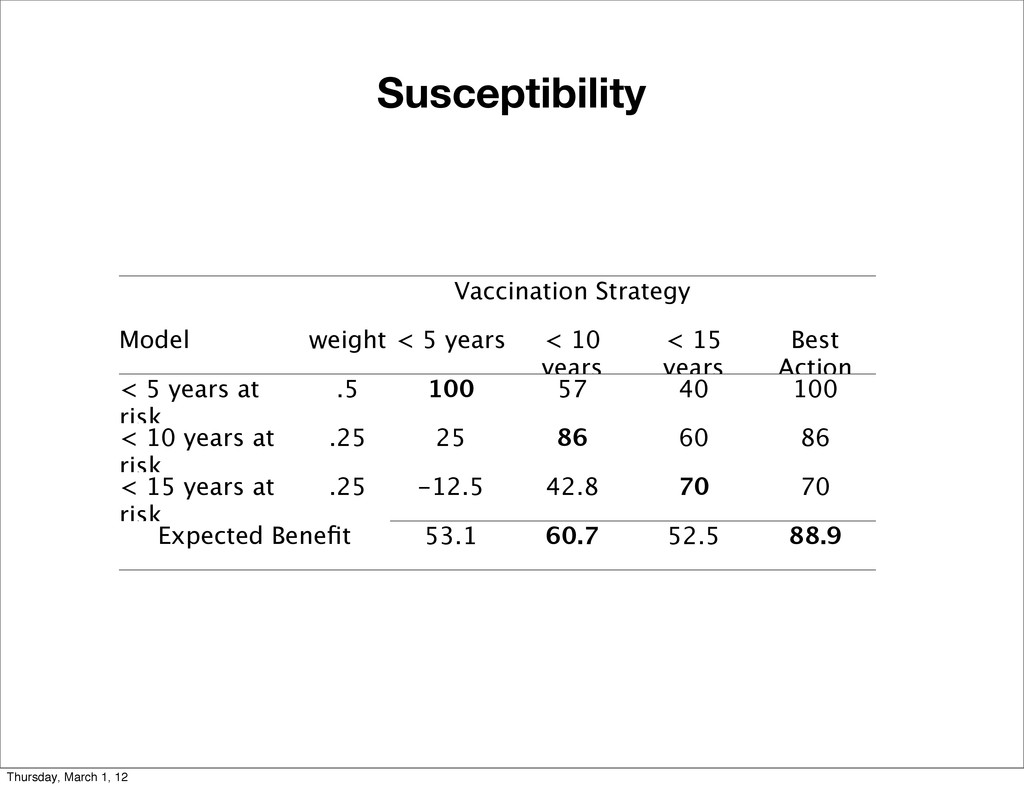
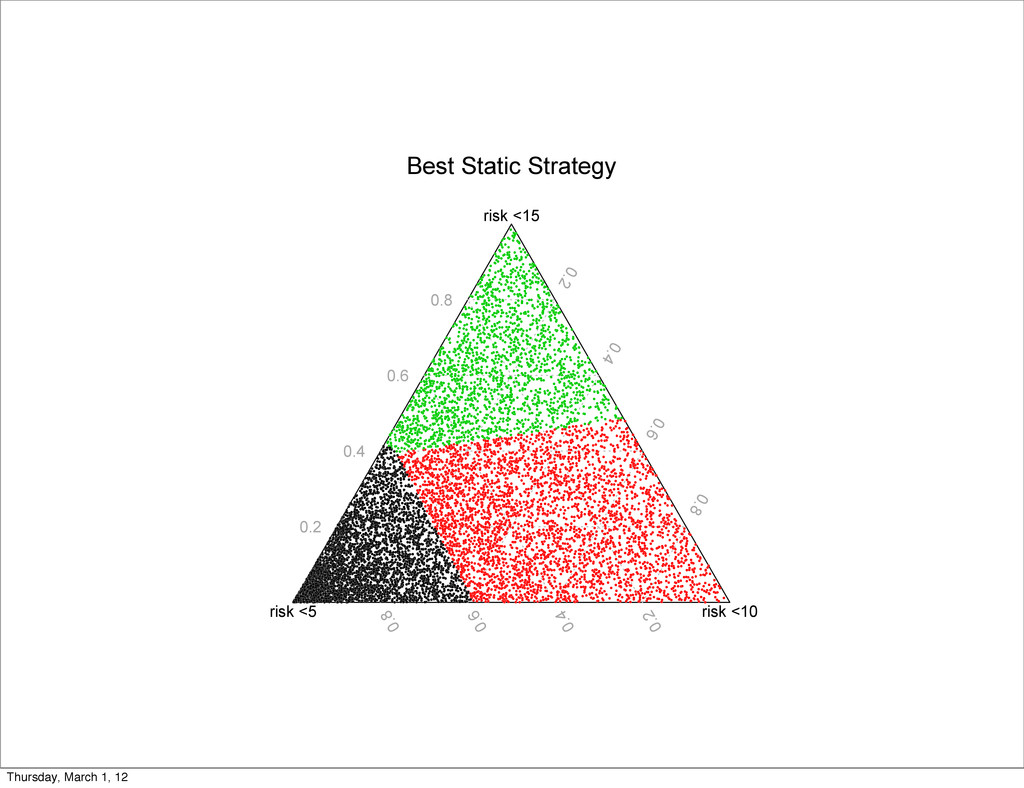
5 years < 10 years < 15 years Best Action < 5 years at risk .5 100 57 40 100 < 10 years at risk .25 25 86 60 86 < 15 years at risk .25 -12.5 42.8 70 70 Expected Benefit Expected Benefit 53.1 60.7 52.5 88.9 Thursday, March 1, 12
![( , ) = E[ r( | ) ∣ ]](https://files.speakerdeck.com/presentations/4f4f982e2e3f7c0022014b9a/slide_54.jpg)
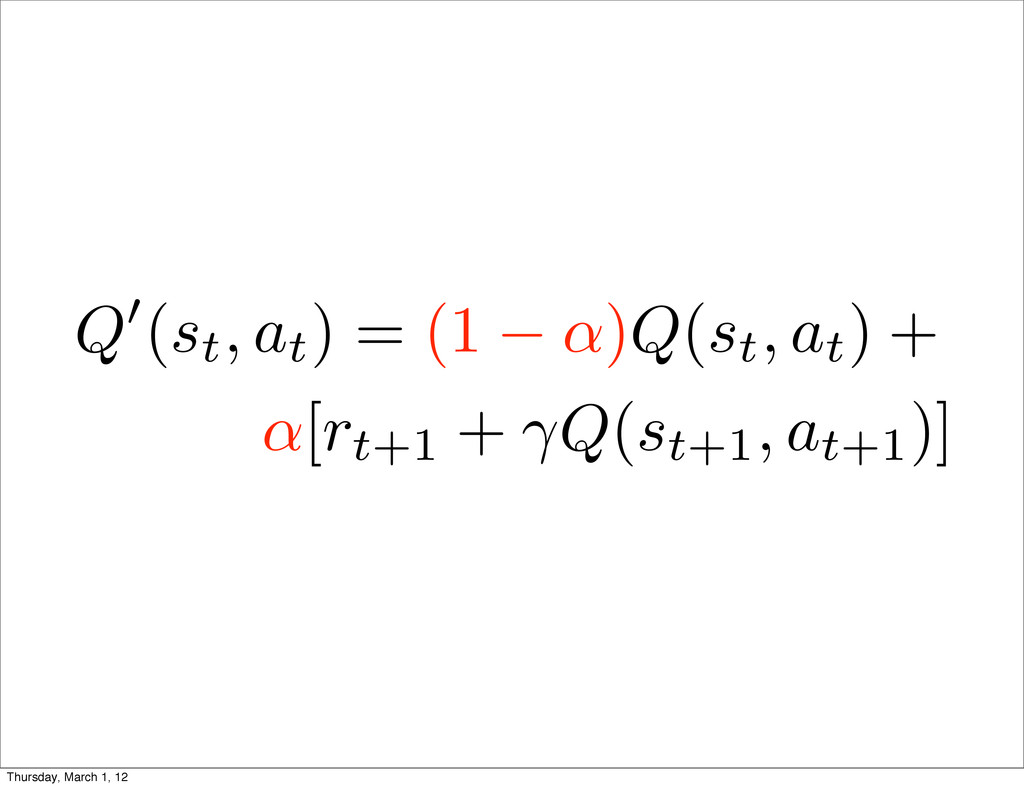
![Q0(st,at ) = Q(st,at )+α[rt+1 +γQ(st+1,at+1 ) Q(st,at )] learning](https://files.speakerdeck.com/presentations/4f4f982e2e3f7c0022014b9a/slide_77.jpg)