Upgrade to Pro — share decks privately, control downloads, hide ads and more …

On predicting mutation status from transcriptome sequencing data

On predicting mutation status from transcriptome sequencing data

Yuichi Shiraishi

April 26, 2019
Tweet

More Decks by Yuichi Shiraishi

Other Decks in Science

Transcript

  1. Sta*s*cal methods for cancer genomics �������� � � . CC-BY-NC-ND

    4.0 International license It is made available under a (which was not peer-reviewed) is the author/funder, who has granted bioRxiv a license to display the preprint in perpetuity. The copyright holder for this preprint . http://dx.doi.org/10.1101/162560 doi: bioRxiv preprint first posted online Jul. 13, 2017; Robustness experiments using cancer genomes from urothelial carcinoma of the upper urinary tract Here we compare our new “independent model” for mutation signatures, which assumes inde- pendence among mutation features, with the “full model”, which corresponds to existing approaches. We compare mutation signatures obtained by the two approaches and investigate the robustness of each approach by down-sampling experiments. The data consist of 14,717 somatic substitutions collected from a study of 26 urothelial car- cinomas of the upper urinary tract (UCUT) [18]. The original study identified a novel muta- tion signature in these data: T > A substitutions at CpTpG sites with a strong transcription Fig 2. An overview of the generative model of somatic mutations proposed in this paper. Suppose there are three types of mutation sources (mutation signatures) such as ultraviolet, tobacco smoking chemicals and transcription coupled repairs. Each cancer genome has ratios showing which types of mutation sources are contributing to its mutations (membership parameters). The generative model of the pattern of each mutation is: first, one of the mutation signatures is chosen according to the membership parameter. Second, each mutation feature such as substitution patterns and flanking bases is generated by the corresponding multinomial distributions for the selected mutation signature. doi:10.1371/journal.pgen.1005657.g002 A Simple Model-Based Approach to Cancer Mutation Signatures Shiraishi et al., PLoS Gene*cs, 2015 Shiraishi et al.,Genome Research, 2018
  2. Genomon: Cancer genome analysis pipeline A RT I C L

    E S Indeed, when expressed in HEK 293T cells, wild-type Elongin C effectively coprecipitated with VHL and CUL2, whereas the interaction VHL, Elongin B, Elongin C and a catalytic RING subunit (RBX1), which binds ubiquitin-conjugated E2 component, are organized on a cullin Figure 3 Significantly mutated genes and pathways for 106 ccRCC specimens. The number of somatic mutations in each case (top) and the number of cases that had alterations in significantly mutated genes (bottom right) are shown in a bar plot. Number of mutations Missense Nonsense, indel, splice site or stop-codon readthrough Promoter hypermethylation Number of samples 160 140 80 60 40 20 0 VHL TCEB1 PBRM1 BAP1 SETD2 FPGT MUDENG KEAP1 TET2 MUC4 MLLT10 MSGN1 KRT32 M6PR RPL14 GRB7 TP53 CSMD3 DNHD1 PIK3CA NLRP12 VMO1 OR4C13 KCNMA1 LMAN2L MTOR ZNF536 YIPF3 0 20 40 80 100 reported genes. Among these, recurrently mutated genes in multiple cases are candidate targets of particular interest, for which high muta- tion rates are expected in general populations. In fact, 8 of the 12 recurrently mutated genes were among the well-described gene targets in myelodysplasia (Supplementary Table 3). However, what immedi- ately drew our attention were the recurrent mutations involving U2AF35 (also known as U2AF1), ZRSR2 and SRSF2 (SC35), because they belongtothecommonpathwayknownasRNAsplicing.Including an additional three genes mutated in single cases (SF3A1, SF3B1 and PRPF40B), six components of the splicing machinery were mutated in 16 out of the 29 cases (55.2%) in a mutually exclusive manner (Fig. 1, Supplementary Fig. 6 and Supplementary Table 2). Frequent mutations in splicing machinery RNAsplicingisaccomplishedbyawell-orderedrecruitment,rearrange- ment and/or disengagement of a set of small nuclear ribonucleoprotein (snRNP) complexes (U1, U2, and either U4/5/6 or U11/12), as well as many other protein components onto the pre-mRNAs. Notably, the mutated components of the spliceosome were all engaged in the initial steps of RNA splicing, except for PRPF40B, whose functions in RNA splicing are poorlydefined. Making physicalinteractions with SF1 anda serine/arginine-rich (SR) protein, such as SRSF1 or SRSF2, the U2 auxiliary factor (U2AF) that consists of the U2AF65 (U2AF2)– U2AF35 heterodimer, is involved in the recognition of the 39 splice site (39SS) and its nearby polypyrimidine tract, which is thought to be required for the subsequent recruitment of the U2 snRNP, containing SF3A1 as well as SF3B1, to establish the splicing A complex (Fig. 1)19. ZRSR2 (or Urp), is another essential component of the splicing machinery. Showing a close structural similarity to U2AF35, ZRSR2 physically interacts with U2AF65, as well as SRSF1 and SRSF2, with a distinct function from its homologue, U2AF35 (ref. 20). To confirm and extend the initial findings in the whole-exome sequencing, we studied mutations of the above six genes together with in the pooled DNA screen (Supplementary Tables 4 and 5). The muta- tions among four genes, U2AF35 (N5 37), SRSF2 (N5 56), ZRSR2 (N 5 23) and SF3B1 (N5 79), explained most of the mutations with much lower mutational rates for SF3A1 (N 5 8), PRPF40B (N5 7), U2AF65 (N 54) and SF1 (N 5 5) (Fig. 2). Mutations of the splicing machinery were highly specific to diseases showing myelodysplastic fea- tures, including MDS either with (84.9%) or without (43.9%) increased ring sideroblasts, chronic myelomonocytic leukaemia (CMML) (54.5%), and therapy-related AML or AML with myelodysplasia-related changes (25.8%), but were rare in de novo AML (6.6%) and myeloproliferative neoplasms (MPN) (9.4%) (Fig. 3a). The mutually exclusive pattern of the mutations in these splicing pathway genes was confirmed in this large case series, suggesting a common impact of these mutations on RNA splicing and the pathogenesis of myelodysplasia (Fig. 3b). The frequencies of mutations showed significant differences across disease types. Surprisingly, SF3B1 mutations were found in the majority of the cases with MDS characterized by increased ring sideroblasts, that is, refractory anaemia withring sideroblasts(RARS)(19/23 or 82.6%)and refractory cytopenia with multilineage dysplasia with $ 15% ring side- roblasts (RCMD-RS) (38/50 or 76%) with much lower mutation fre- quencies in other myeloid neoplasms. RARS and RCMD-RS account U1snRNP SF3B1 3′ SRSF2 F2 ESE 5′SS 3′SS YNCURAY 5′ Pre-mRNA W W W W W W W W W W W YRYYRY Zn2+ Zn2+ W Zn2+ ZRSR2 SF1 U2AF35 UHM domain RS domain Zn2+ Zinc finger domain S ESE U2AF65 SF3B U2snRNP SF3A1 U1snRNP Figure 1 | Components of the splicing E/A complex mutated in myelodysplasia. RNA splicing is initiated by the recruitment of U1 snRNP to the 59SS. SF1 and the larger subunit of the U2 auxiliary factor(U2AF), U2AF65, bind the branch point sequence (BPS) and its downstream polypyrimidine tract, respectively. The smaller subunit of U2AF (U2AF35) binds to the AG dinucleotide of the 39SS, interacting with both U2AF65 and a SR protein, such as SRSF2, through its UHM and RS domain, comprising the earliest splicing complex (E complex). ZRSR2 also interacts with U2AF and SR proteins to perform essential functions in RNA splicing. After the recognition of the 39SS, U2 snRNP, together with SF3A1 and SF3B1, is recruited to the 39SS to generate the splicing complex A. The mutated components in myelodysplasia are indicated by arrows. U2AF35 (21q22.3) Zn UHM RS 240 aa Zn S34F(20) S34Y(5) Q157R(7) Q157P(4) ZRSR2 (Xp22.1) Zn UHM RS Zn N382K* C302R H330R N261Y I202N 483 aa I53T* N327fs G323fs W291X L237fs S40X A96fs R126X E118fs R68sp K257sp F239V E362X E148X E133G C326R PRPF40B (12q13.12) 871 aa SF3A1 Surf UbqL Surf (22q12.2) A57S I141M* Y772C 793 aa E373D T374P K166T M117I M667V RRM RS P95H(31)/L(14)/R(11) SRSF2 (17q25.1) 221 aa Y347X A26V P383L FF FF P15H* P540S D442N M58I* P212L* PR WW WW SF3B1 (2q33.1) 1,304 aa K700E(44) HD K666N(6)/T(3)/E(2)/R(2) H662Q(8)/D(2) E622D(4) Y623C R625L(2)/C(1) N626D K182E G347V D781G U2AF65 (19q13.42) UHM RS M144I R18W 475 aa L187V UHM UHM SF1 KH PR (11q13.1) 639 aa Zn T474A A508G G372V Y476C T454M HD HD HD HD HD HD HD HD HD HD Figure 2 | Mutations of multiple components of the splicing machinery. Each mutation in the eight spliceosome components is shown with an arrowhead. Confirmed somatic mutations are discriminated by red arrows. Known domain structures are shown in coloured boxes as indicated. Mutations predicted as SNPs by MutationTaster (http://www.mutationtaster.org/) are indicated by asterisks. The number of each mutation is indicated in parenthesis. ZRSR2 mutations in females are shown in blue. 6 O C T O B E R 2 0 1 1 | V O L 4 7 8 | N A T U R E | 6 5 Macmillan Publishers Limited. All rights reserved ©2011 Kataoka et al., Nature, 2016 Yoshida et al., Nature, 2011 Sato et al., Nature Gene*cs, 2013 Genomon
  3. Genomic Big Data TCGA (The Cancer Genome Atlas) •  11,000

    tumors data from 33 cancer types •  Genome, transcriptome, methyla*on and so on. •  >27 papers (PanCan Atlas, 2018) Collado-Torres et al., Nature Biotechnology, 2017 recount2 •  Already processed >70,000 transcriptome sequencing data. •  Gene expression, splicing junc*on and so on.
  4. Predic*ng “func*onal” muta*on status of from RNA-seq •  Genomic muta*on

    can alter global transcriptome landscape. •  From transcriptome landscape, we may be able to infer the genomic changes in a specific pathway using machine learning approach. •  Classical challenges… But the amount and variety of data is now exploding!! •  Several challenges in PanCan atlas papers. –  Ras pathway (Way et al., Cell Reports, 2018) –  DNA damage repair pathway (Knijnenburg et al., Cell Reports, 2018) Genomic Muta*on Global transcriptome landscape Machine learning
  5. Predic*ng “func*onal” muta*on status of from RNA-seq 1.  Rescue soma*c

    muta*ons that are not iden*fied by genome sequencing. –  Soma*c muta*on detec*on is harder because of the impurity of tumor cells. –  Important in precision medicine seangs. 2.  Measuring the func*on of the soma*c muta*ons (variant of unknown significance). –  Only the func*ons of a small por*on of muta*ons iden*fied have been inves*gated.. 3.  Some*mes, only RNA-seq is available (e.g., single cell RNA-seq). 4.  Understanding the biology.
  6. Predic*ng “func*onal” muta*on status of from RNA-seq 1.  Rescue soma*c

    muta*ons that are not iden*fied by genome sequencing. –  Soma*c muta*on detec*on is harder because of the impurity of tumor cells. –  Important in precision medicine seangs. 2.  Measuring the func*on of the soma*c muta*ons (variant of unknown significance). –  Only the func*ons of a small por*on of muta*ons iden*fied have been inves*gated.. 3.  Some*mes, only RNA-seq is available (e.g., single cell RNA-seq). 4.  Understanding the biology. In pure (100%) tumor cells tumor Half of the short reads in tumor samples are expected to include variant alleles!! (for non-sex chromosomes). tumor In 50% tumor cells Discrimina*ng from sequencing errors becomes more difficult!!
  7. Predic*ng “func*onal” muta*on status of from RNA-seq 1.  Rescue soma*c

    muta*ons that are not iden*fied by genome sequencing. –  Soma*c muta*on detec*on is harder because of the impurity of tumor cells. –  Important in precision medicine seangs. 2.  Measuring the func*on of the soma*c muta*ons (variant of unknown significance, VUSs). –  Only the func*ons of a small por*on of muta*ons iden*fied have been inves*gated.. 3.  Some*mes, only RNA-seq is available (e.g., single cell RNA-seq). 4.  Understanding the biology. Obtained from COSMIC EGFR soma*c muta*on posi*onal distribu*on
  8. Predic*ng “func*onal” muta*on status of from RNA-seq 1.  Rescue soma*c

    muta*ons that are not iden*fied by genome sequencing. –  Soma*c muta*on detec*on is harder because of the impurity of tumor cells. –  Important in precision medicine seangs. 2.  Measuring the func*on of the soma*c muta*ons (variant of unknown significance). –  Only the func*ons of a small por*on of muta*ons iden*fied have been inves*gated.. 3.  Some*mes, only RNA-seq is available (e.g., single cell RNA-seq). 4.  Understanding the biology.
  9. Splicing Pathway gene muta*on Yoshida, Sanada, Shiraishi et al. Nature,

    2011 U2AF35 heterodimer, is involved in the recognition of the 39 splice site (39SS) and its nearby polypyrimidine tract, which is thought to be required for the subsequent recruitment of the U2 snRNP, containing SF3A1 as well as SF3B1, to establish the splicing A complex (Fig. 1)19. ZRSR2 (or Urp), is another essential component of the splicing machinery. Showing a close structural similarity to U2AF35, ZRSR2 physically interacts with U2AF65, as well as SRSF1 and SRSF2, with a distinct function from its homologue, U2AF35 (ref. 20). To confirm and extend the initial findings in the whole-exome sequencing, we studied mutations of the above six genes together with U1snRNP SF3B1 3′ SRSF2 F2 ESE 5′SS 3′SS YNCURAY 5′ Pre-mRNA W W W W W W W W W W W YRYYRY Zn2+ Zn2+ W Zn2+ ZRSR2 SF1 U2AF35 UHM domain RS domain Zn2+ Zinc finger domain S ESE U2AF65 SF3B U2snRNP SF3A1 U1snRNP Figure 1 | Components of the splicing E/A complex mutated in myelodysplasia. RNA splicing is initiated by the recruitment of U1 snRNP to the 59SS. SF1 and the larger subunit of the U2 auxiliary factor(U2AF), U2AF65, bind the branch point sequence (BPS) and its downstream polypyrimidine tract, respectively. The smaller subunit of U2AF (U2AF35) binds to the AG dinucleotide of the 39SS, interacting with both U2AF65 and a SR protein, such as SRSF2, through its UHM and RS domain, comprising the earliest splicing complex (E complex). ZRSR2 also interacts with U2AF and SR proteins to perform essential functions in RNA splicing. After the recognition of the 39SS, U2 snRNP, together with SF3A1 and SF3B1, is recruited to the 39SS to generate the splicing complex A. The mutated components in myelodysplasia are indicated by arrows. U2AF35 (21q22.3) Zn UHM RS 240 aa Zn ZRSR2 (Xp22.1) Zn UHM RS Zn N382K* C302R H330R N261Y I202N 483 I53T* N327fs G323fs W291X L237fs S40X A96fs R126X E118fs R68sp K257sp F239V E362X E148X E133G C326R PRPF40B (12q13.12) 8 SF3A1 Surf UbqL Surf (22q12.2) A57S I141M* 793 E373D T374P K166T M117I M667V RRM RS SRSF2 (17q25.1) Y347X A26V P383L FF FF P15H* P540S D442N M58I* P212L* PR WW WW SF3B1 (2q33.1) 1 K700E(44) HD K666N(6)/T(3)/E(2)/R(2) H662Q(8)/D(2) E622D(4) Y623C R625L(2)/C(1) N626D K182E G347V D781G U2AF65 (19q13.42) UHM RS M144I R18W 475 aa L187V UHM UHM SF1 KH PR (11q13.1) 639 aa Zn T474A A508G G372V Y476C T454M HD HD HD HD HD HD HD HD HD HD Figure 2 | Mutations of multiple components of the splicing machine Each mutation in the eight spliceosome components is shown with an arrowhead. Confirmed somatic mutations are discriminated by red arro Known domain structures are shown in coloured boxes as indicated. Mut predicted as SNPs by MutationTaster (http://www.mutationtaster.org/) indicated by asterisks. The number of each mutation is indicated in paren ZRSR2 mutations in females are shown in blue. 6 O C T O B E R 2 0 1 1 | V O L 4 7 8 | N A T U R E •  Many genes playes an important roles in splicing processes. •  Frequent soma*c muta*on in splicing pathway genes. •  U2AF1, SRSF2, SF3B1 •  breast, lung, skin and blood cancers
  10. Distribu*on of SF3B1 soma*c muta*ons. •  Hotspot are located at

    C-terminal HEAT domain. •  There are many prominent hotspot. •  Those hotspots are known to induce global splicing altera*ons. •  Some of the muta*ons is unclear (variant of unknown significance). B A D H1 H2 H3 H4 H5 H6 H7 H8 H9 H10 H11 H12 K700E G742D G740E/V K741E/N/Q D781E L833F E860K E902G/K R957Q E862K E622D/Q K666E/N/T N626D/H/Y R625C/H alt 3’ ss alt 5’ ss exon inclusion exon skipping intron retention intron splicing Counts 6 7 8 ontrol alternative 3’ss alternative 5’ss exon inclusion exon skipping intron retention intron splicing 0 10 20 30 40 SF3B1 HEAT repeats (HDs) 4 5 6 7 8 9 10 11 12 620 622 625 626 633 662 663 665 666 668 669 693 697 699 700 708 711 722 727 736 740 741 742 746 763 765 775 781 787 790 802 805 812 814 815 831 833 835 843 847 860 862 873 876 894 897 898 899 902 903 906 907 916 917 919 921 922 923 930 935 936 946 957 959 965 BLCA BRCA LAML LUAD PAAD SKCM UCEC UVM other B A C D E pre-mRNA H1 H2 H3 H4 H5 H6 H7 H8 H9 H10 H11 H12 K700E G742D G740E/V K741E/N/Q D781E L833F E860K E902G/K R957Q E862K E622D/Q K666E/N/T N626D/H/Y R625C/H alt 3’ ss alt 5’ ss exon inclusion exon skipping intron retention intron splicing Counts 0 1 2 3 4 5 6 7 8 Log ratio vs control Mutations in HDs 4-8 Mutations in HDs 9-12 alternative 3’ss alternative 5’ss exon inclusion exon skipping intron retention intron splicing 0 10 20 30 40 SF3B1 HEAT repeats (HDs) 4 5 6 7 8 9 10 11 12 620 622 625 626 633 662 663 665 666 668 669 693 697 699 700 708 711 722 727 736 740 741 742 746 763 765 775 781 787 790 802 805 812 814 815 831 833 835 843 847 860 862 873 876 894 897 898 899 902 903 906 907 916 917 919 921 922 923 930 935 936 946 957 959 965 BLCA BRCA LAML LUAD PAAD SKCM UCEC UVM other Seiler et al., Cell Reports, 2018
  11. Global aberrant splicing by SF3B1MUT 1.  Mostly alterna*ve 3’SS (splice

    site). 2.  The new acceptor sites of SF3B1MUT-associated alterna*ve 3’SS events are typically located within 18 to 50bp upstream from the authen*c acceptor sites. � � * We can quan*fy the amount of aberra*ons of alterna*ve 3’SS by RNA sequencing data!! Aberrant: 3, Normal: 5
  12. Cons*tu*ng classifier for SF3B1 func*onal muta*on status. 1.  Select SF3B1MUT-associated

    alterna*ve 3’SS loci. 2.  Quan*fy the amount of altera*ve 3’SS at each loci for each sample. 3.  Develop the classifier for SF3B1 func*onal muta*on status (SF3B1ness score). –  Probabilis*c modeling for alterna*ve 3’SSs using zero-inflated beta-binomial (ZIBB) distribu*on. –  Naïve Bayes classifier. –  Evalua*on of effec*veness using cross-valida*on.
  13. Selec*ng SF3B1MUT-associated alterna*ve 3’SS •  We have compiled abnormal splicing

    junc*ons specific to SF3B1MUT from two previous studies. –  Alsafadi et al. Nature communica*ons, 2016. •  Comparing 35 SF3B1MUT and 50 SF3B1WT samples from chronic lymphocy*c leukemia, breast cancer, skin melanoma and uveal melanoma. •  895 splicing junc*ons. –  Darman et al., Cell Reports, 2015. •  Comparing 16 SF3B1MUT and 56 SF3B1WT samples from uveal melanoma. •  1,124 spicing junc*ons •  Gathered two sets and filtered followings –  Splicing junc*ons other than alterna*ve 3’SS (e.g., exon skipping). –  Novel acceptor sites are out-side the 50bp of authen*c splice sites. •  710 SF3B1MUT-associated alterna*ve 3’SS are obtained in the end!
  14. Quan*fying alterna*ve 3’SS for each sample and loci •  Download

    the splicing junc*ons dataset from recount2 (Collado-Torres et al., Nature Biotechnology, 2017). –  Splicing junc*on dataset is much smaller compared to raw sequencing data!! •  Extract the 710 SF3B1MUT-associated alterna*ve 3’SSs and their corresponding normal splicing. � Loci Alterna,ve 3’SS Normal Splicing chr1:100477090 -100480840 1 9 chr1;116936346;116 937712 4 20 chr1;12008125;1200 9813 0 18 . . . 710
  15. Modeling the read counts of alterna*ve 3’SS by ZIBB distribu*on

    donor site and the other is located within 50bp upstream of canonical splicing accepto sites. Then, the remaining the coordinates of splicing junctions are converted to GRCh38 based positions. A generative model of splicing junction counts via zero-inflated beta-binomial distribution Let xi,j , yi,j denote the counts of j -th SF3B1MUT associated alternative 3’SS and the corresponding normal splicing for the i -th sample ( i = 1 , 2 , · · · , I, j = 1 , 2 , · · · , J ). Setting ni,j = xi,j + yi,j , then the probability function of xi,j is f ( xi,j | ni,j, ↵j, j, ⇡j ) = (1 ⇡j ) g ( xi,j | ni,j, ↵j, j ) , ( xi,j > 0) , f ( xi,j | ni,j, ↵j, j, ⇡j ) = ⇡j + (1 ⇡j ) g ( xi,j = 0| ni,j, ↵j, j ) , ( xi,j = 0) where g is the beta-binomial density function, g ( xi,j | ni,j, ↵j, j ) xi,j : read counts for alterna*ve 3’SS of the i-th sample and the j-th loci. yi,j : read counts for corresponding normal splicing of the i-th sample and the j-th loci. ni,j = xi,j + yi,j * g is the probability func*on of beta-binomial distribu*on * αj , βj , πj : parameters for ZIBB distribu*on for the j-th loci. � � Figure 1. Overview of the study. A, The process of evaluating SF3B1ness classifier and screening functional SF3B1 mutations. B, Illustration of SF3B1MUT associated alternative 3’SS and its corresponding normal splicing identified by split-aligned short reads. C, An example of supporting read counts of alternative 3’SS (chr1:100477090-100480840) and its corresponding normal splicing (chr1:100477090-100480857). Each point shows the counts of an individual. D, The generative model of assumed in this paper. The counts of SF3B1MUT associated alternative 3’SS supporting reads are conditionally independent given the SF3B1 mutation status. Using RNA sequencing together with genome sequencing often help complementing somatic mutation discovery and measuring the effect of a genomic mutation on transcriptomes such as expression and splicing changes. Here, we would tackle the problem of classifying ”functional” mutation status based on transcriptome using statistical machine learning approaches. In this paper, we would like to focus on SF3B1 gene, which encodes a core component of the RNA splicing machinery. SF3B1 is recurrently mutated in blood cancers [29] and other solid tumors [7,17]. The somatic mutations periodically cluster to Example of the read counts at one specific locus (chr1:100477090-100480840). Each point shows TCGA sample. Excessive zeros!!
  16. Cons*tu*ng machine learning classifiers i=1 A classification model for SF3B1

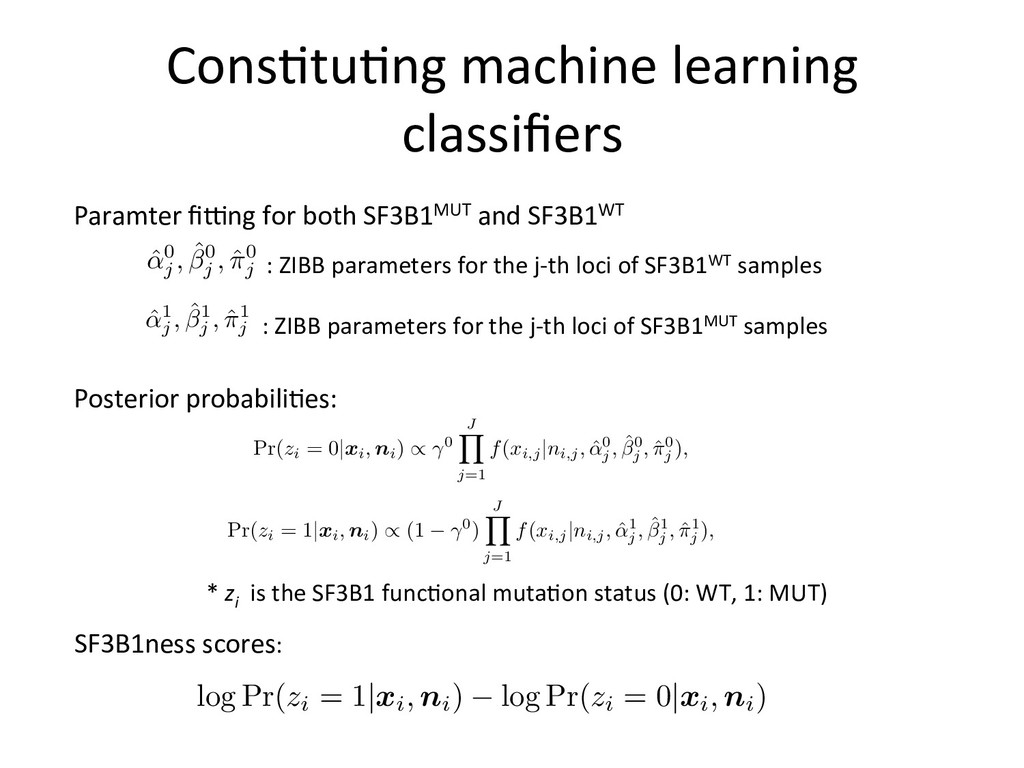
    mutation status using naive Bayes model Suppose zi 2 {0 , 1} is the SF3B1 mutation status for the i -th sample (0: SF3B1WT, 1: SF3B1MUT). First, for each SF3B1MUT associated alternative 3’SS, we estimate the parameters of zero-inflated beta-binomial distribution for SF3B1WT and SF3B1MUT groups. Let ˆ ↵ 0 = (ˆ ↵ 0 j )j=1,··· ,J , ˆ0 = (ˆ0 j )j=1,··· ,J , ˆ ⇡ 0 = (ˆ ⇡ 0 j )j=1,··· ,J denote the parameters estimated for SF3B1WT groups and ˆ ↵ 1 = (ˆ ↵ 1 j )j=1,··· ,J , ˆ ↵ 1 = (ˆ ↵ 1 j )j=1,··· ,J , ˆ ⇡ 1 = (ˆ ⇡ 1 j )j=1,··· ,J the parameters for SF3B1MUT groups, respectively. Then, by applying Bayes’ theorem, the conditional probabilities are Pr( zi | xi, ni ) / Pr( zi ) J Y j=1 Pr( xi,j | zi, ni,j ) . Therefore, Pr( zi = 0| xi, ni ) / 0 J Y j=1 f ( xi,j | ni,j, ˆ ↵ 0 j , ˆ0 j , ˆ ⇡ 0 j ) , Pr( zi = 1| xi, ni ) / (1 0) J Y j=1 f ( xi,j | ni,j, ˆ ↵ 1 j , ˆ1 j , ˆ ⇡ 1 j ) , where 0 is the parameter corresponding to Pr( zi = 0) (in this paper, we adopt non-informative value 0 = 1 / 2). Finally, for each new sample, we evaluate the logarithm of the ratio of conditional probabilities (SF3B1ness score) log Pr( zi = 1| xi, ni ) log Pr( zi = 0| xi, ni ) . eters estimated for SF3B1 groups and ˆ ↵ = (ˆ ↵j )j=1,··· ,J , ˆ ↵ = (ˆ ↵j )j=1,··· , ˆ ⇡ 1 j )j=1,··· ,J the parameters for SF3B1MUT groups, respectively. en, by applying Bayes’ theorem, the conditional probabilities are Pr( zi | xi, ni ) / Pr( zi ) J Y j=1 Pr( xi,j | zi, ni,j ) . ore, Pr( zi = 0| xi, ni ) / 0 J Y j=1 f ( xi,j | ni,j, ˆ ↵ 0 j , ˆ0 j , ˆ ⇡ 0 j ) , Pr( zi = 1| xi, ni ) / (1 0) J Y j=1 f ( xi,j | ni,j, ˆ ↵ 1 j , ˆ1 j , ˆ ⇡ 1 j ) , 0 is the parameter corresponding to Pr( zi = 0) (in this paper, we adopt ormative value 0 = 1 / 2). Finally, for each new sample, we evaluate the hm of the ratio of conditional probabilities (SF3B1ness score) log Pr( zi = 1| xi, ni ) log Pr( zi = 0| xi, ni ) . Paramter fiang for both SF3B1MUT and SF3B1WT 1 groups, respectively. conditional probabilities are ) J Y j=1 Pr( xi,j | zi, ni,j ) . Y =1 f ( xi,j | ni,j, ˆ ↵ 0 j , ˆ0 j , ˆ ⇡ 0 j ) , ) J Y j=1 f ( xi,j | ni,j, ˆ ↵ 1 j , ˆ1 j , ˆ ⇡ 1 j ) , Pr( zi = 0) (in this paper, we adopt r each new sample, we evaluate the ilities (SF3B1ness score) log Pr( zi = 0| xi, ni ) . 9/12 nditional probabilities are J Y =1 Pr( xi,j | zi, ni,j ) . f ( xi,j | ni,j, ˆ ↵ 0 j , ˆ0 j , ˆ ⇡ 0 j ) , J Y =1 f ( xi,j | ni,j, ˆ ↵ 1 j , ˆ1 j , ˆ ⇡ 1 j ) , r( zi = 0) (in this paper, we adopt each new sample, we evaluate the ties (SF3B1ness score) og Pr( zi = 0| xi, ni ) . 9/12 : ZIBB parameters for the j-th loci of SF3B1MUT samples : ZIBB parameters for the j-th loci of SF3B1WT samples Posterior probabili*es: SF3B1ness scores: * zi is the SF3B1 func*onal muta*on status (0: WT, 1: MUT)
  17. Cons*tu*ng machine learning classifiers. •  TCGA dataset: –  8,992 primary

    cancer samples. –  31 cancer types. •  Soma*c muta*on calling –  Used in-house soma*c muta*on calling methods in the previous paper (Shiraishi et al., Genome Research, 2018). •  Posi*ve cases (SF3B1MUT): –  Samples with well-known hotspot SF3B1 muta*ons. –  E622, R625, N626, H662, K666, K700, G740, K741, G742 –  63 posi*ve cases. –  Breast cancer (14 / 826), skin cutaneous melanoma (SKCM, 8 / 469), and uveal melanoma (UVM, 17 / 80). –  Other cancer types with less frequent SF3B1 hotspot soma*c muta*ons. •  Nega*ve Cases (SF3B1WT): –  Samples with no SF3B1 muta*ons. –  Samples with non hotspot SF3B1 muta*ons are removed in the training phases. •  Cancer type informa*on is not used in training and tes*ng –  No need to care about cancer types!!
  18. Sensi*vity of SF3B1ness score A B •  Evalua*on by 2-fold

    cross valida*on. •  Among 63 samples with known SF3B1 hotspot muta*ons 60 samples had posi*ve cross-validated SF3B1ness score. •  the sensi*vity of SF3B1ness score is more than 95%.
  19. Samples without SF3B1 hotspot muta*ons with high SF3B1ness score Table

    1. List of samples with high SF3B1ness score and without hotspot SF3B1 mutations. Sample name Cancer type Score Remark TCGA-55-7576 LUAD 3193.496 No SF3B1 mutation is identified after manual investigations. (low variant allele frequency). TCGA-E2-A10F BRCA 1495.878 D781E mutation is identified by usual exome data analysis. TCGA-V4-A9EC UVM 972.768 T663P mutation is identified by usual exome data analysis. TCGA-3H-AB3K MESO 935.228 No SF3B1 mutation is identified after manual investigations. TCGA-XM-A8RI THYM 866.908 K700E mutation is identified after manual investigations. (low variant allele frequency). TCGA-05-4432 LUAD 586.704 No SF3B1 mutation is identified after manual investigations. TCGA-75-5125 LUAD 190.175 K700E mutation is identified after manual investigations. (low variant allele frequency). TCGA-ZP-A9CV LIHC 186.524 No SF3B1 mutation is identified after manual investigations. TCGA-NJ-A55O LUAD 153.664 R775L mutation is identified by usual exome data analysis. TCGA-NJ-A4YQ LUAD 136.287 No SF3B1 mutation is identified after manual investigations. TCGA-UY-A78N BLCA 130.962 Q699E mutation is identified by usual exome data analysis. TCGA-EY-A2OM UCEC 38.213 No SF3B1 mutation is identified after manual investigations. TCGA-WC-A87W UVM 21.388 R625H mutation is identified after manual investigations. (low variant allele frequency). The SF3B1 somatic mutations linked to high SF3B1ness scores are in the proximity of known hotspots (see Figure 2B). Although this is anticipated by the marked
  20. Samples without SF3B1 hotspot muta*ons with high SF3B1ness score • 

    13 samples had no SF3B1 hotspot muta*ons in spite of high SF3B1ness score •  3 categories 1.  Aver manual inves*ga*on of exome and RNA-seq, SF3B1 hotspot muta*ons were detected (3 cases). •  Successfully rescued the hotspot SF3B1 muta*ons! 2.  Non-hotspot SF3B1 muta*on were detected (T663P, Q699E, R775L, and D781E, 4 cases). •  These SF3B1 muta*on seems func*onal!! 3.  No SF3B1 muta*ons were detected even aver manual inves*ga*on (6 cases). •  Assuming that the first two category is “true posi*ves” –  Precision: 93.15%
  21. Example of suppor*ng reads. C he overview of SF3B1ness score

    evaluation on TCGA data. A, The relationships between SF3B1ness F3B1 mutation status. Each bar shows each individual from TCGA dataset, and the color shows SF3B1 tus (hotspot are defined in the above). B, The relationships between SF3B1ness scores and amino-acids amples with SF3B1 mutations. The color shows the cancer types. C, The counts of SF3B1MUT associated Obviously posi*ve case (SF3B1 hotspot) Obviously nega*ve case (no SF3B1 muta*on) Nega*ve case with very high SF3B1ness (but no SF3B1 muta*on) There may be a hidden factor that has the same effect with SF3B1 func*onal muta*ons!!
  22. The rela*onships between SF3B1ness scores and amino-acids posi*ons B C

    •  The SF3B1 soma*c muta*ons linked to high SF3B1ness scores are in the proximity of known hotspots. •  SF3B1ness score discerned the amino acid posi*ons into those with high (e.g., T663P, Q699E) from those with low (e.g., I665F, V668I, G693) scores even among the proximity of hotspots.
  23. Screening 51,577 RNA-seq!! 1.  First obtain splicing junc*on data from

    recount2 web-sites. 2.  Obtain the SF3B1ness score (with classifies trained by TCGA). 3.  For the samples with high SF3B1ness score, 1.  Download the FASTQ files. 2.  Alignment by STAR. 3.  Manually inves*gate the SF3B1 soma*c muta*ons. Collado-Torres et al., Nature Biotechnology, 2017
  24. Result of 51,577 screening A B C •  154 samples

    had high SF3B1ness scores (>= 50.0). •  140 samples had SF3B1 muta*ons* •  When narrowing down the 124 samples by higher SF3B1ness scores (>= 300.0). •  123 samples (123/124 = 0.992) had SF3B1 muta*ons* •  Some SF3B1 muta*ons had fewer counts in COSMIC. •  R625G, G664C, K741N, L747W, and R775G. •  High SF3B1ness scores imply that these are “func*onal”. * SF3B1 muta*on registered in the COSMIC database in C-terminal heat domain (604-801).
  25. SF3B1 muta*on in samples with no cancer. B C 3.

    Overview of SF3B1 functional screening using the recount2. A, The relationships between SF3B1ness nd SF3B1 mutation status. Each bar shows each individual from recount2 dataset, and the color shows SF3B1 n status (COSMIC release v87 is used for the registered number of SF3B1 mutations). B, C, The counts of UT associated alternative 3’SS and its corresponding normal splicing junction (B) and the alignment view around K700E for the sample having high SF3B1ness score (SRR1374647) in GTEx study (C). Many of the SF3B1 mutations found in high SF3B1ness score samples are hotspot mutations (a large number of records registered in COSMIC database). However, there are several substitutions (R625G, G664C, K741N, L747W, and R775G) with few records in COSMIC, suggesting the functional importance of these rare mutations and awaiting •  Most samples with high SF3B1ness scores are found in cancer types where SF3B1 muta*ons are known to be prevalent •  blood cancers, breast cancers, melanomas, and uveal melanomas. •  However, we could also find SF3B1 muta*ons from two normal samples; •  one is from a whole blood sample (GTEx). •  The other is from a bone sample from an old woman. •  SF3B1 muta*ons induce splicing altera*ons in even normal *ssues!! •  SF3B1ness score may be helpful for efficient detec*on of soma*c SF3B1 muta*on in normal samples.
  26. Applica*on to single cell RNA-seq? •  Can we iden*fy cells

    with SF3B1 muta*ons? – In which cell-types and development stages SF3B1 muta*ons are frequent? •  Challenges: – Can scRNA-seq can cover many SF3B1MUT- associated alterna*ve 3’SS loci? – Noise by such as drop-outs.
  27. Discussion •  SF3B1ness score: –  Sensi*ve & Accurate. –  Robust:

    No need to input cancer types. •  Other genes affec*ng global splicing changes: –  U2AF1, SRSF2, SETD –  Maybe challenging because the signal is mild. –  For SF3B1 muta*on, completely novel splicing junc*ons are generated, whereas just the ra*os of splicing junc*ons change by the muta*on in other genes.
  28. Discussion •  Preprint – Biorxiv: h|ps://www.biorxiv.org/content/ 10.1101/572834v1 •  R package – Github:

    h|ps://github.com/friend1ws/SF3B1ness – Acceptable format •  STAR (SJ.out.tab files) •  recount2