Upgrade to Pro — share decks privately, control downloads, hide ads and more …

Visualizing the Pulse of Data

Visualizing the Pulse of Data

Unveiling the Power of Real-Time Streaming Data Visualization
Saturday, 9 Mar 2024 8:15 am - 9:15 am (60 minutes)
in Central Standard Time (UTC-06:00)
That's 09 Mar 2024 8:15 am in your timezone (America/Chicago)
Room 411
Description
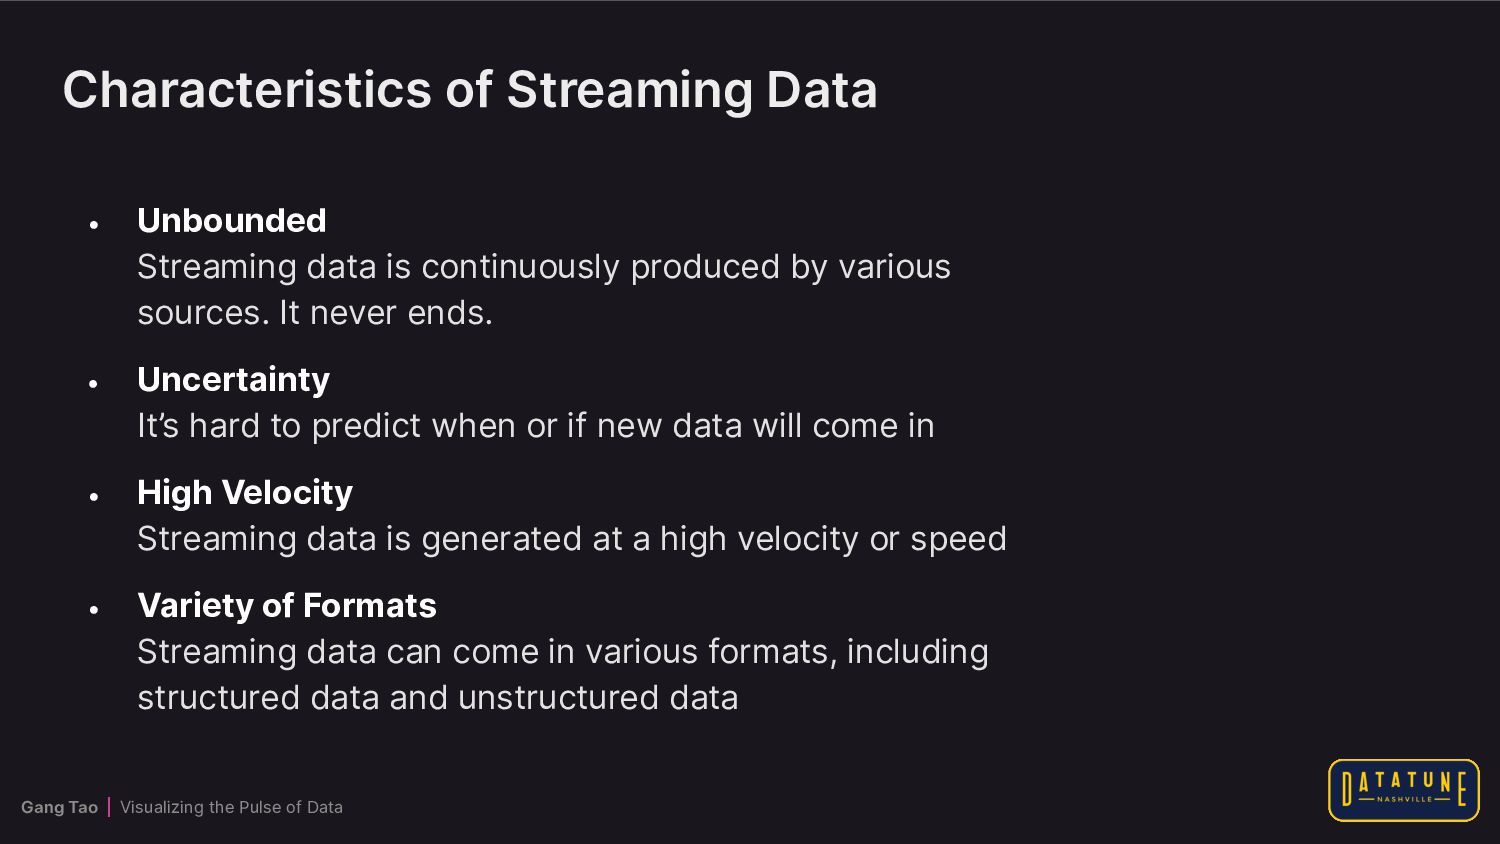
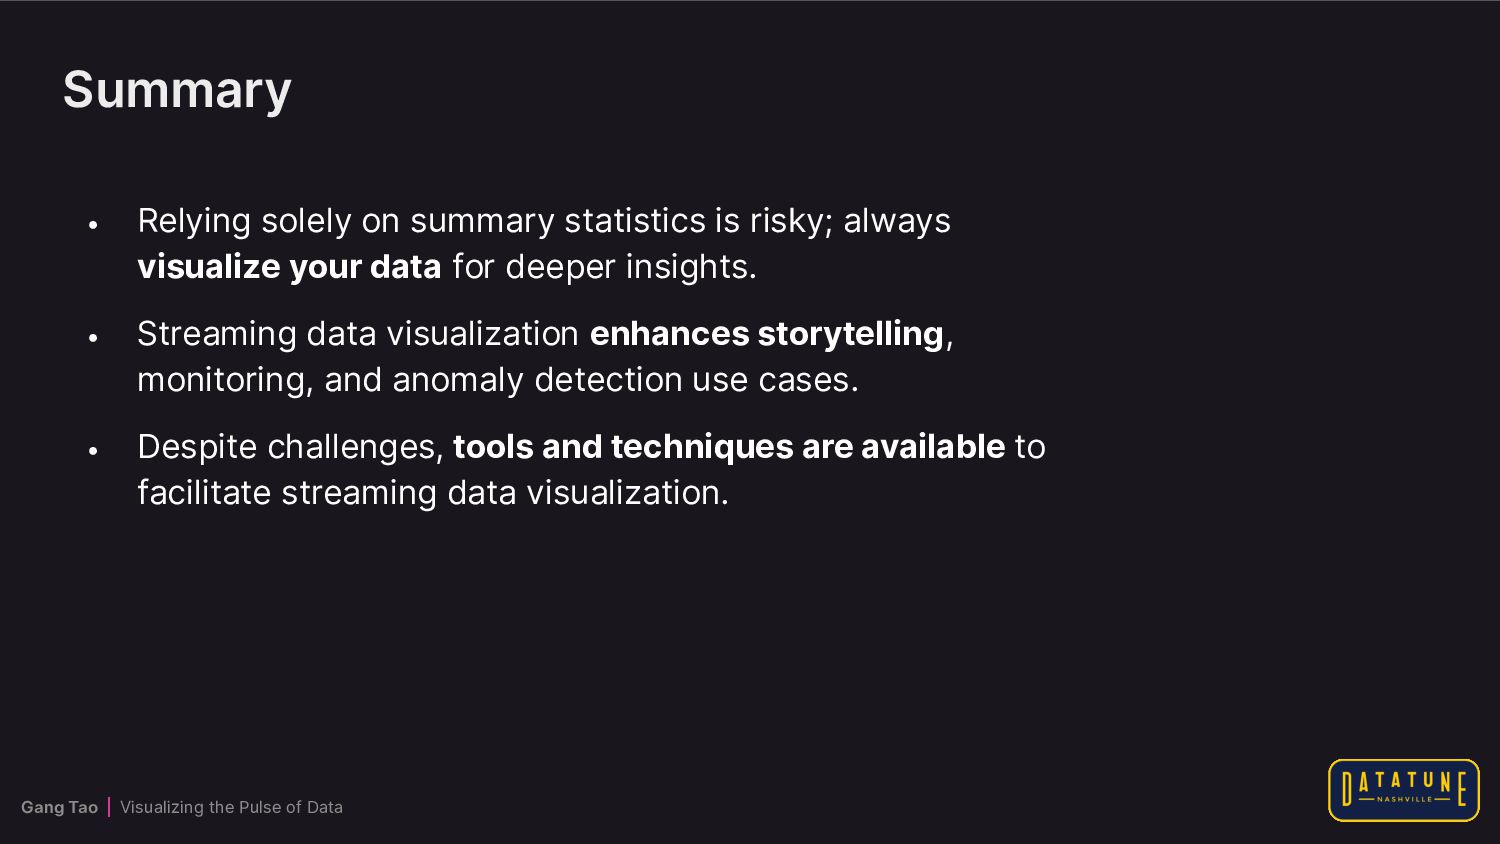
As the prevalence of streaming data continues to rise, its significance in contemporary data analytics cannot be overstated. This tech talk explores the critical role of visualizing streaming data, emphasizing its pivotal impact on instantaneous awareness, anomaly detection, and dynamic decision-making.

Key Points:

1. Instantaneous Awareness:
Streaming data visualizations offer immediate insights, empowering quick responses to emerging trends, issues, and opportunities.
2. Quick Detection of Anomalies:
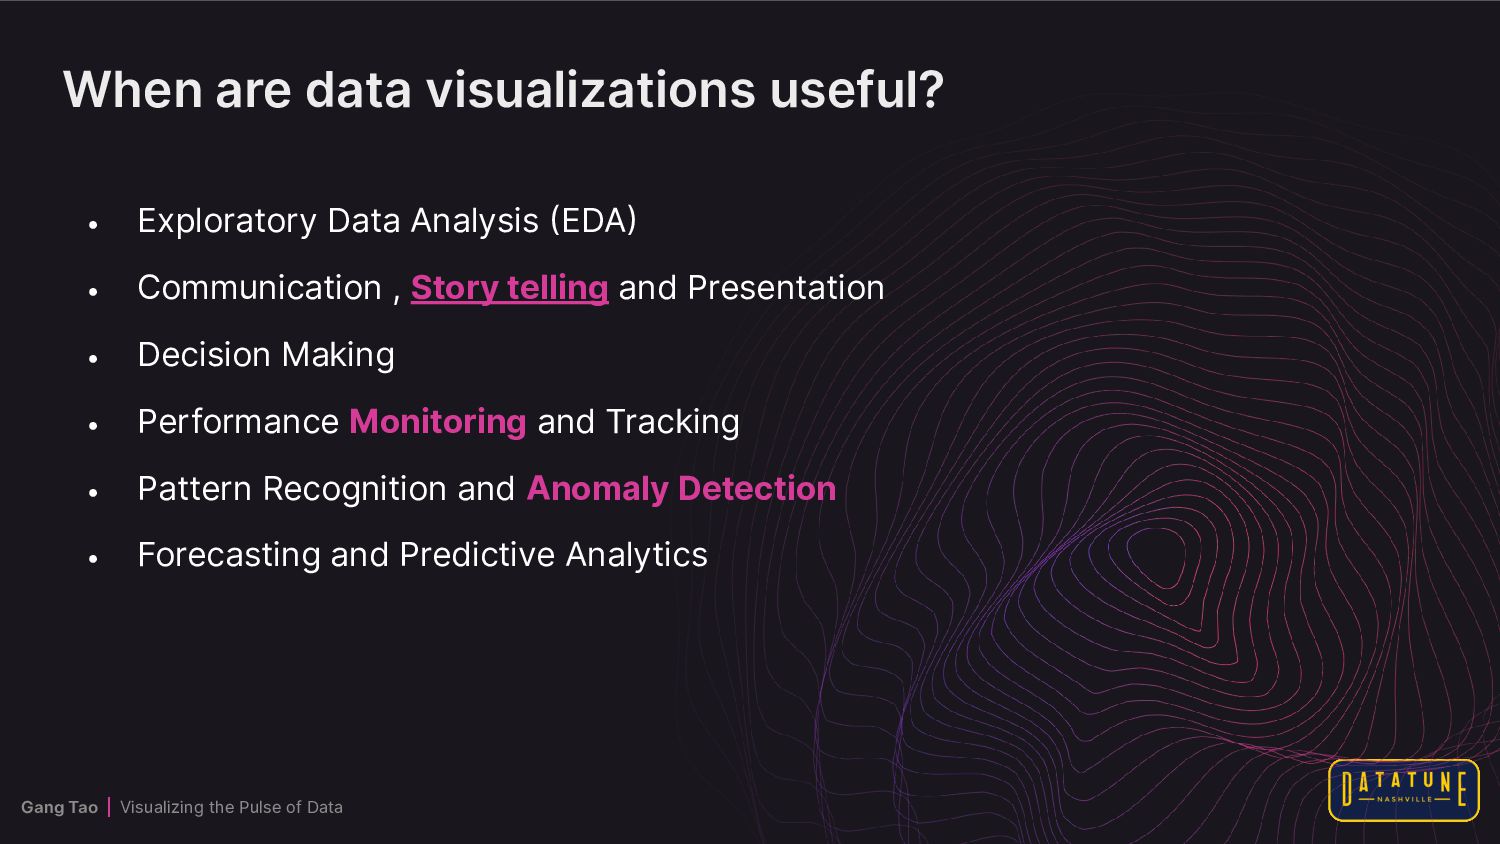
Visualizations provide a swift identification of irregular patterns in streaming data, enhancing users' ability to detect anomalies promptly and take timely actions.
3. Dynamic Decision-Making:
In scenarios requiring on-the-fly decisions, visualizations offer dynamic representations, facilitating quick and informed decision-making without exhaustive analysis of raw data streams.

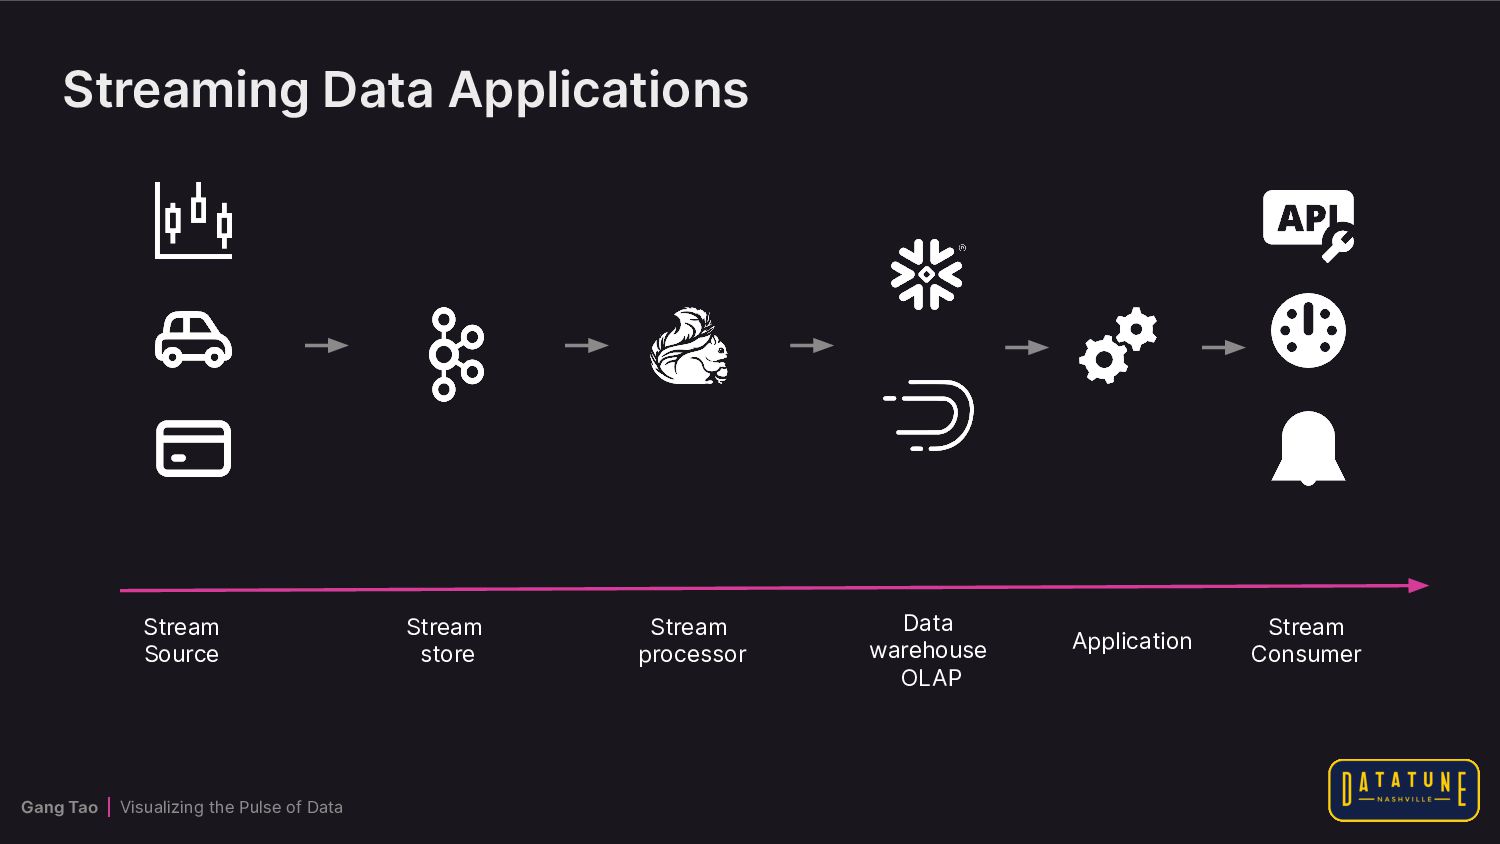
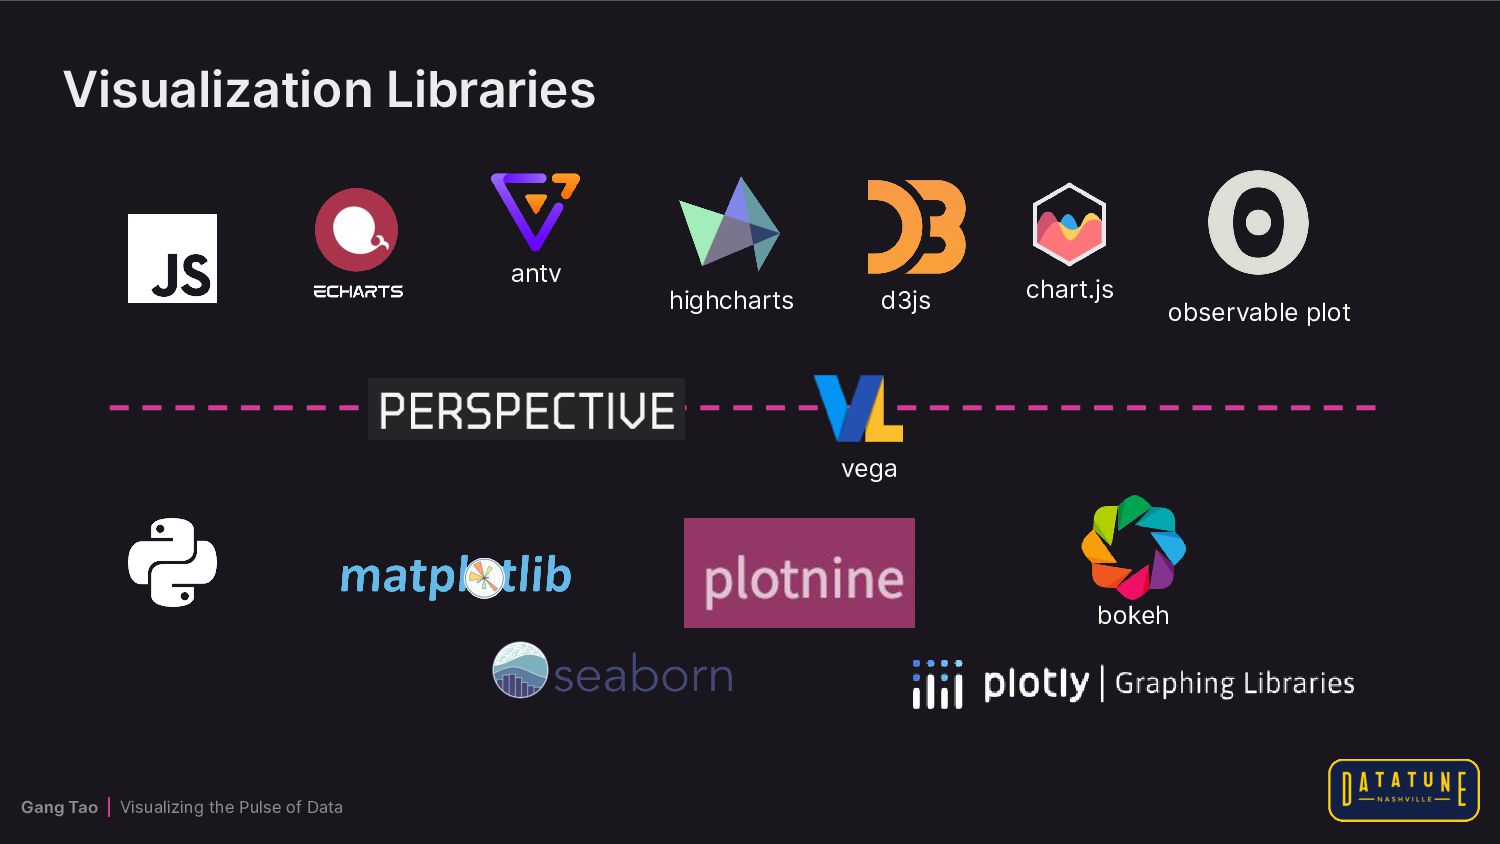
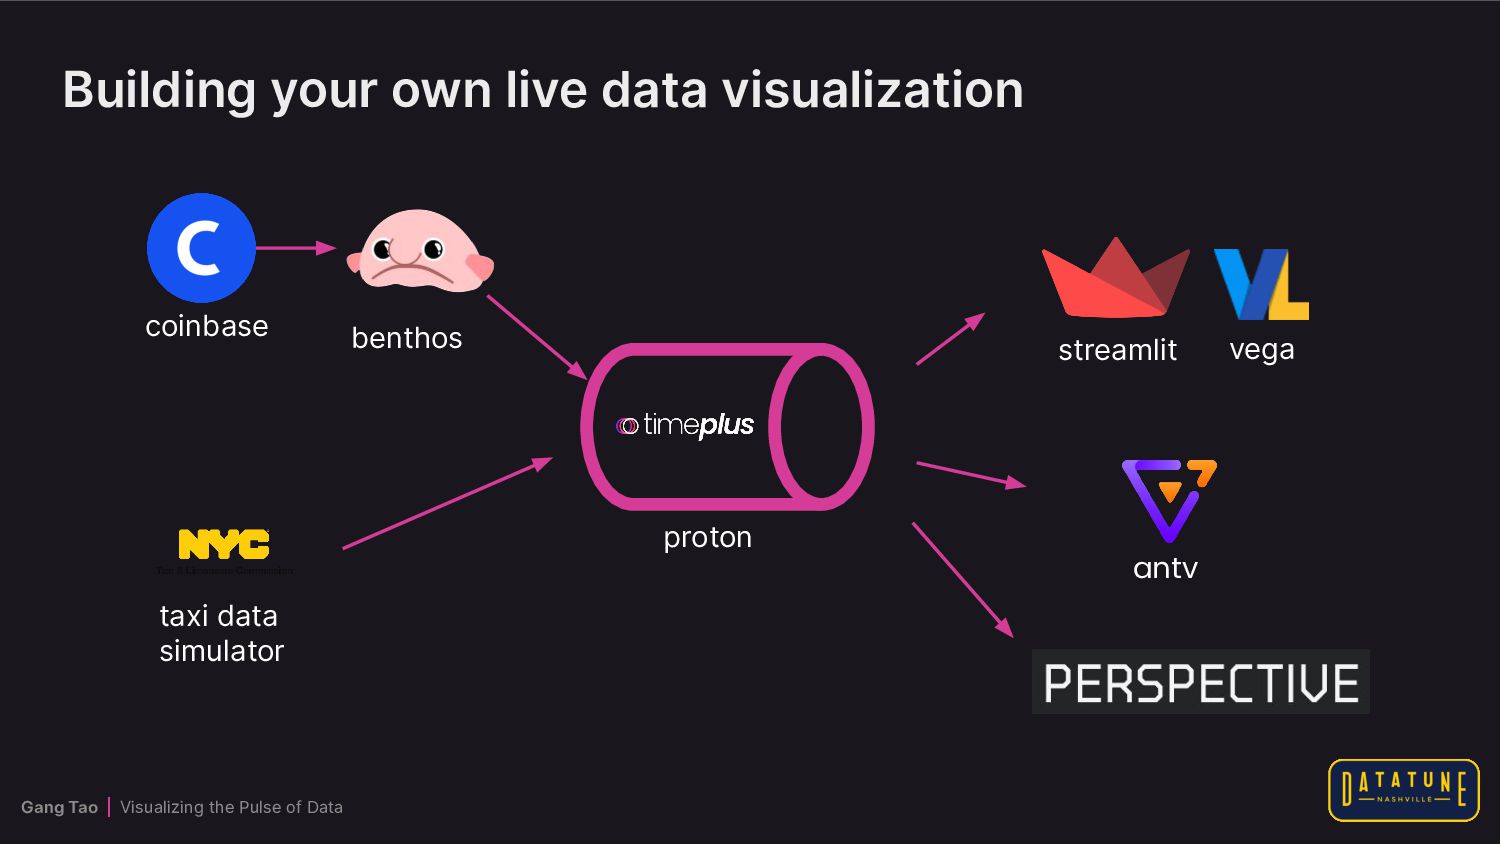
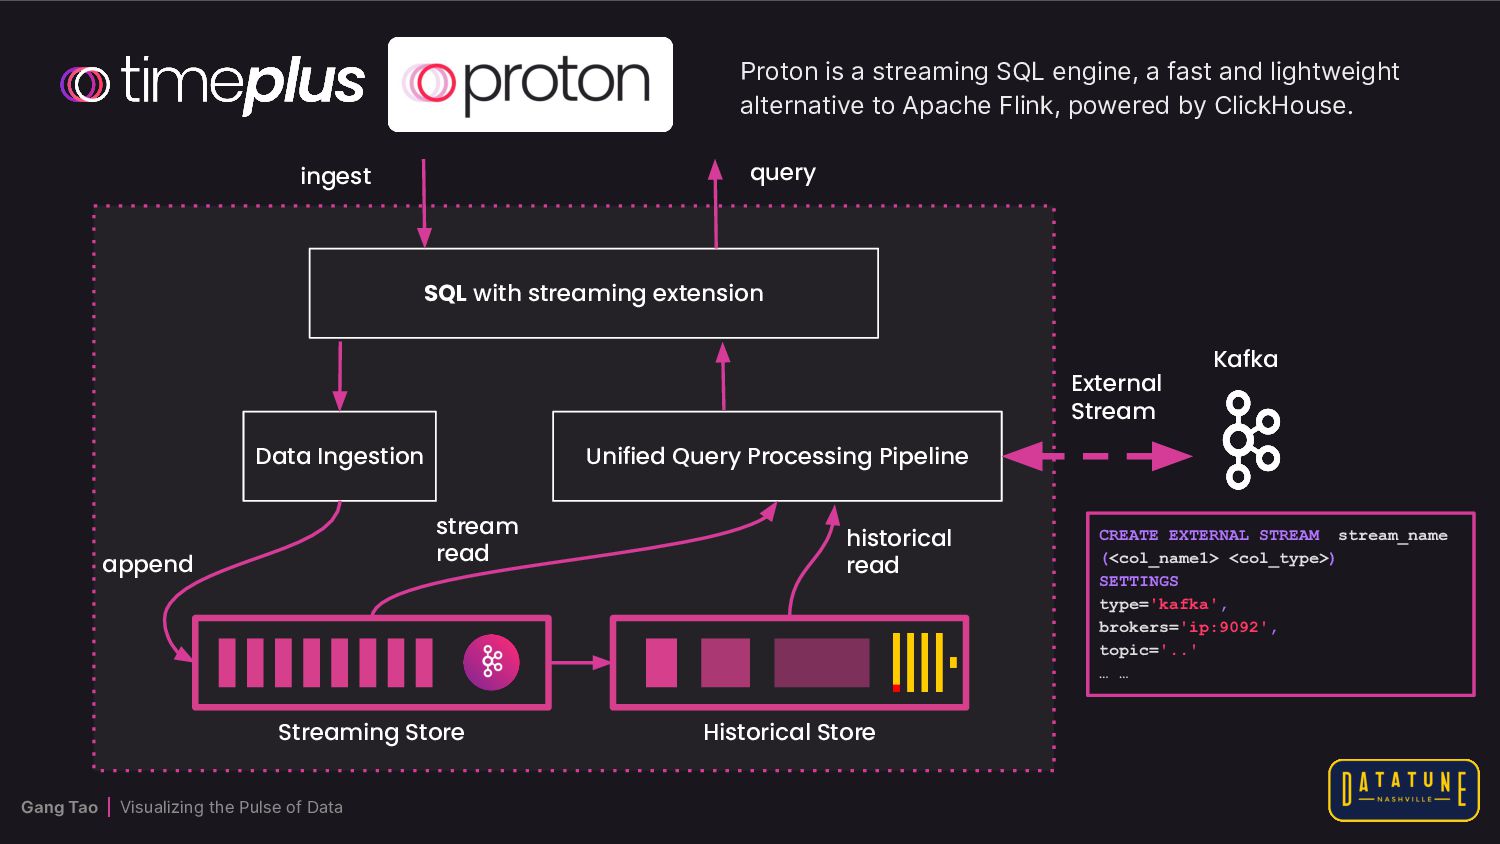
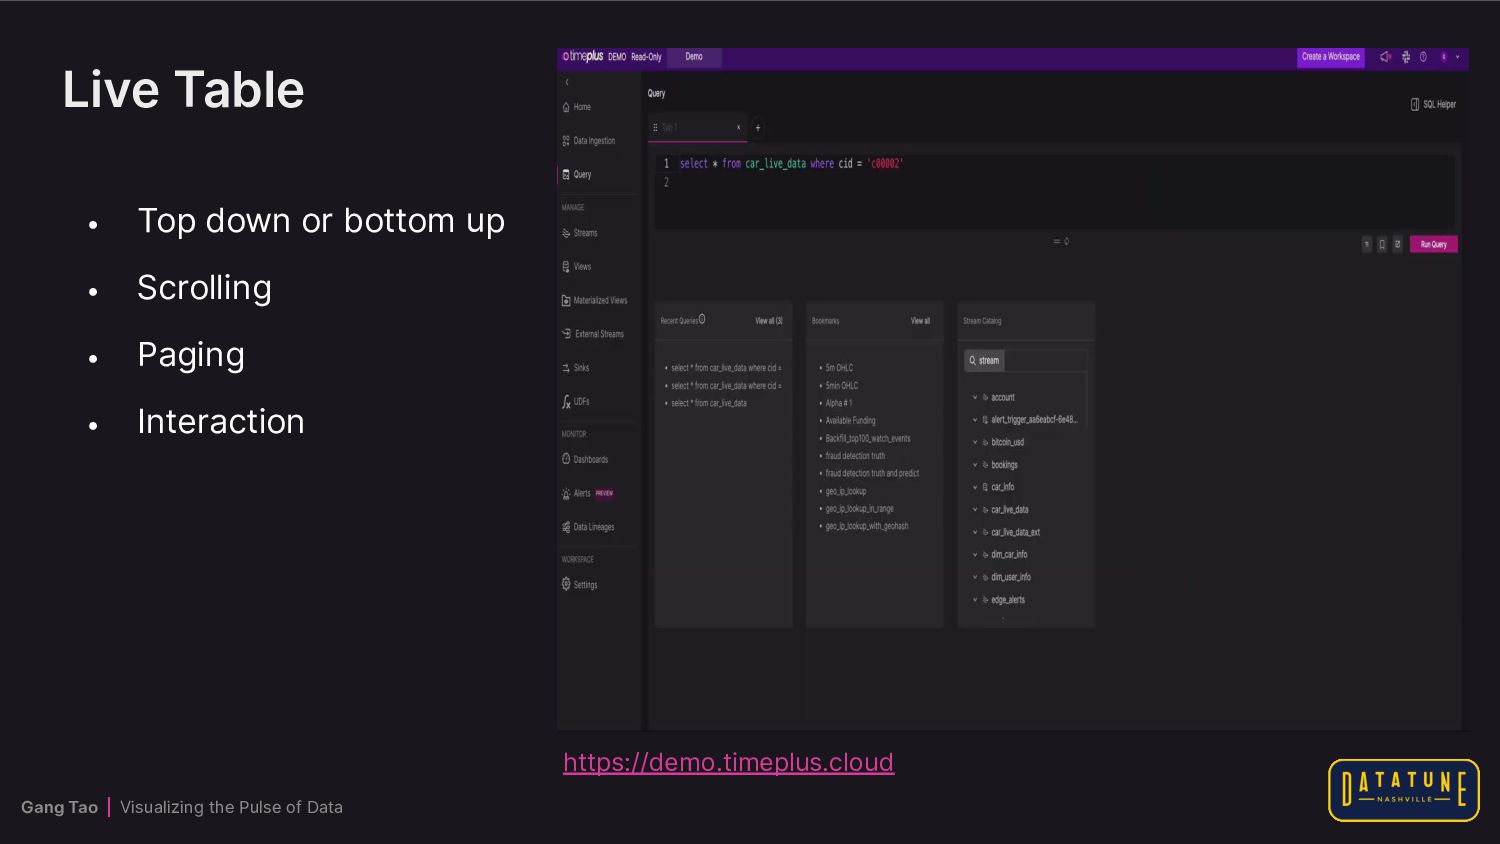
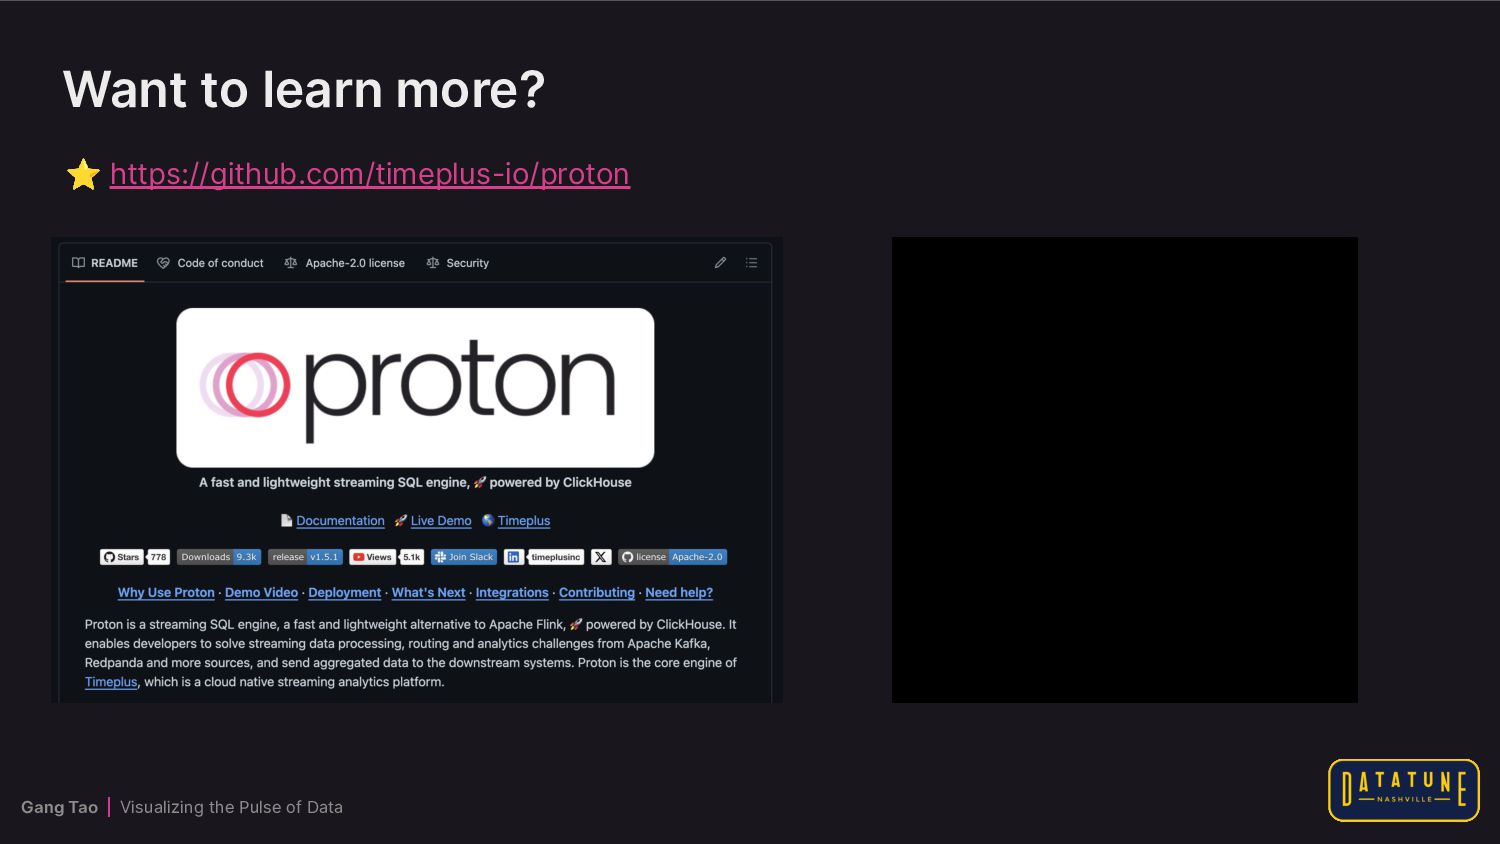
In this session, we will showcase the creation of a real-time streaming data visualization using open-source tools, including Proton (an open-source streaming database) and AntV G2 (an open-source data visualization library). The demonstration will address key challenges, such as making charts dynamic, supporting interactions on live data, managing time series with a moving time scale and axis, and implementing replay functionality to review historical data.

Gang Tao

March 09, 2024
Tweet

More Decks by Gang Tao

Other Decks in Technology

Transcript

  1. Gang Tao | Visualizing the Pulse of Data Visualizing the

    Pulse of Data Unveiling the Power of Real-Time Streaming Data Visualization March 9 | Nashville, TN Gang Tao Co-Founder and CTO, Timeplus
  2. Gang Tao | Visualizing the Pulse of Data Data Visualization:

    Anscombe's quartet 9 mean x 7.5 mean y 0.816 xy correlation 3.00+0.5 regression line 0.67 R2
  3. Gang Tao | Visualizing the Pulse of Data Datasaurus dataset

    https://www.research.autodesk.com/publications/same-stats-different-graphs/
  4. Gang Tao | Visualizing the Pulse of Data Never trust

    summary statistics alone. Always visualize your data.
  5. Gang Tao | Visualizing the Pulse of Data When are

    data visualizations useful? Comunication and Presentation Decision Making Performance Monitoring Pattern Recognition and Anomaly Detection Forecasting and Predictive Analytics Exploratory Data Analysis
  6. Gang Tao | Visualizing the Pulse of Data • Exploratory

    Data Analysis (EDA) • Communication , Story telling and Presentation • Decision Making • Performance Monitoring and Tracking • Pattern Recognition and Anomaly Detection • Forecasting and Predictive Analytics When are data visualizations useful?
  7. Gang Tao | Visualizing the Pulse of Data Streaming Data

    Applications Stream Source Stream store Stream processor Data warehouse OLAP Application Stream Consumer
  8. Gang Tao | Visualizing the Pulse of Data Visualization Libraries

    bokeh highcharts d3js vega chart.js antv observable plot
  9. Gang Tao | Visualizing the Pulse of Data Characteristics of

    Streaming Data • Unbounded Streaming data is continuously produced by various sources. It never ends. • Uncertainty It’s hard to predict when or if new data will come in • High Velocity Streaming data is generated at a high velocity or speed • Variety of Formats Streaming data can come in various formats, including structured data and unstructured data
  10. Gang Tao | Visualizing the Pulse of Data Building your

    own live data visualization antv streamlit vega proton benthos coinbase taxi data simulator
  11. Gang Tao | Visualizing the Pulse of Data Proton is

    a streaming SQL engine, a fast and lightweight alternative to Apache Flink, powered by ClickHouse. SQL with streaming extension Data Ingestion Unified Query Processing Pipeline ingest append stream read historical read Streaming Store Historical Store query Kafka External Stream CREATE EXTERNAL STREAM stream_name (<col_name1> <col_type>) SETTINGS type='kafka', brokers='ip:9092', topic='..' … …
  12. Gang Tao | Visualizing the Pulse of Data Live Table

    • Top down or bottom up • Scrolling • Paging • Interaction https://demo.timeplus.cloud
  13. Gang Tao | Visualizing the Pulse of Data Live Time

    Series • X-axis represents time • Line represents trend • Supports multiple series • Example of a typical use case: market data
  14. Gang Tao | Visualizing the Pulse of Data Key/Time-Based Update

    Update by key • Only show the latest data for each unique object/entity Update by time • Only show data from latest time (window)
  15. Gang Tao | Visualizing the Pulse of Data Live Dashboard

    It’s hard for us humans to process too much live, continuously updated information at the same time.
  16. Gang Tao | Visualizing the Pulse of Data Challenges •

    Update Frequency A reasonable render interval is 250ms to 1s • Data Cache Throw historical data by data size or volume • Life cycle management Handling start, stop, and reconnect of data stream • Complexity Humans can’t handle large amounts of refresing information – we need to keep it simple
  17. Gang Tao | Visualizing the Pulse of Data Summary •

    Relying solely on summary statistics is risky; always visualize your data for deeper insights. • Streaming data visualization enhances storytelling, monitoring, and anomaly detection use cases. • Despite challenges, tools and techniques are available to facilitate streaming data visualization.
  18. Gang Tao | Visualizing the Pulse of Data Want to

    learn more? ⭐ https://github.com/timeplus-io/proton
  19. Gang Tao | Visualizing the Pulse of Data Real-time streaming

    analytics made powerful and accessible. Thank you! Gang Tao | Visualizing the Pulse of Data
  20. Gang Tao | Visualizing the Pulse of Data References •

    Visualizations and the Grammar of Graphics • The best Hans Rosling talks you’ve ever seen • https://codepen.io/gangtao/full/rNGrOXa