Upgrade to Pro — share decks privately, control downloads, hide ads and more …

Parameter tuning for search-based test-data generation revisited

Parameter tuning for search-based test-data generation revisited

Interested in learning more about this topic? Visit this web site to read the paper: https://www.gregorykapfhammer.com/research/papers/Kotelyanskii2014a/

Gregory Kapfhammer

October 02, 2014
Tweet

More Decks by Gregory Kapfhammer

Other Decks in Research

Transcript

  1. Parameter Tuning for Search-Based Test-Data Generation Revisited Support for Previous

    Results Anton Kotelyanskii Gregory M. Kapfhammer shared by creative commons licensed ( BY-NC-ND ) ickr photo sunface13
  2. EvoSuite Amazing test suite generator Uses a genetic algorithm shared

    by creative commons licensed ( BY-SA ) ickr photo mcclanahoochie
  3. EvoSuite Amazing test suite generator Uses a genetic algorithm Input:

    A Java class shared by creative commons licensed ( BY-SA ) ickr photo mcclanahoochie
  4. EvoSuite Amazing test suite generator Uses a genetic algorithm Input:

    A Java class Output: A JUnit test suite shared by creative commons licensed ( BY-SA ) ickr photo mcclanahoochie
  5. EvoSuite Amazing test suite generator Uses a genetic algorithm Input:

    A Java class Output: A JUnit test suite shared by http://www.evosuite.org/ creative commons licensed ( BY-SA ) ickr photo mcclanahoochie
  6. Experiment Design Eight EvoSuite parameters Ten projects from SF100 shared

    by creative commons licensed ( BY-NC ) ickr photo Michael Kappel
  7. Experiment Design Eight EvoSuite parameters Ten projects from SF100 475

    Java classes for subjects shared by creative commons licensed ( BY-NC ) ickr photo Michael Kappel
  8. Experiment Design Eight EvoSuite parameters Ten projects from SF100 475

    Java classes for subjects 100 trials after parameter tuning shared by creative commons licensed ( BY-NC ) ickr photo Michael Kappel
  9. Experiment Design Eight EvoSuite parameters Ten projects from SF100 475

    Java classes for subjects 100 trials after parameter tuning Aiming to improve statement coverage shared by creative commons licensed ( BY-NC ) ickr photo Michael Kappel
  10. Parameters Parameter Name Minimum Maximum Population Size 5 99 Chromosome

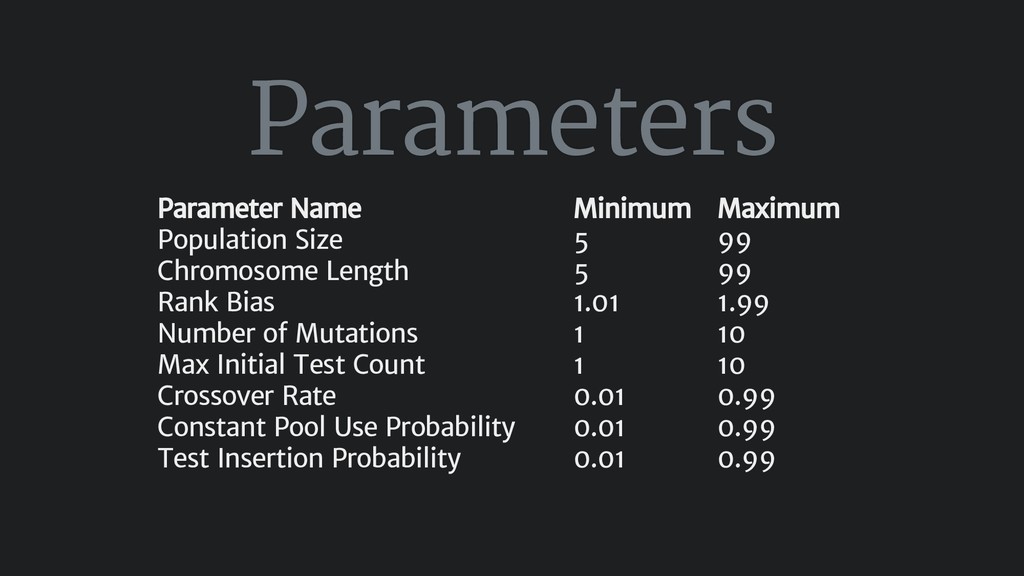
    Length 5 99 Rank Bias 1.01 1.99 Number of Mutations 1 10 Max Initial Test Count 1 10 Crossover Rate 0.01 0.99 Constant Pool Use Probability 0.01 0.99 Test Insertion Probability 0.01 0.99
  11. Experiments 184 days of computation time estimated Cluster of 70

    computers running for weeks Identi ed 139 "easy" and 21 "hard" classes
  12. Experiments 184 days of computation time estimated Cluster of 70

    computers running for weeks Identi ed 139 "easy" and 21 "hard" classes Mann-Whitney U-test and
  13. Experiments 184 days of computation time estimated Cluster of 70

    computers running for weeks Identi ed 139 "easy" and 21 "hard" classes Mann-Whitney U-test and Vargha-Delaney e ect size
  14. Results Category E ect Size p-value Results Across Trials and

    Classes 0.5029 0.1045 No "Easy" and "Hard" Classes 0.5048 0.0314
  15. Results Using lower-is-better inverse statement coverage Category E ect Size

    p-value Results Across Trials and Classes 0.5029 0.1045 No "Easy" and "Hard" Classes 0.5048 0.0314
  16. Results Using lower-is-better inverse statement coverage E ect size greater

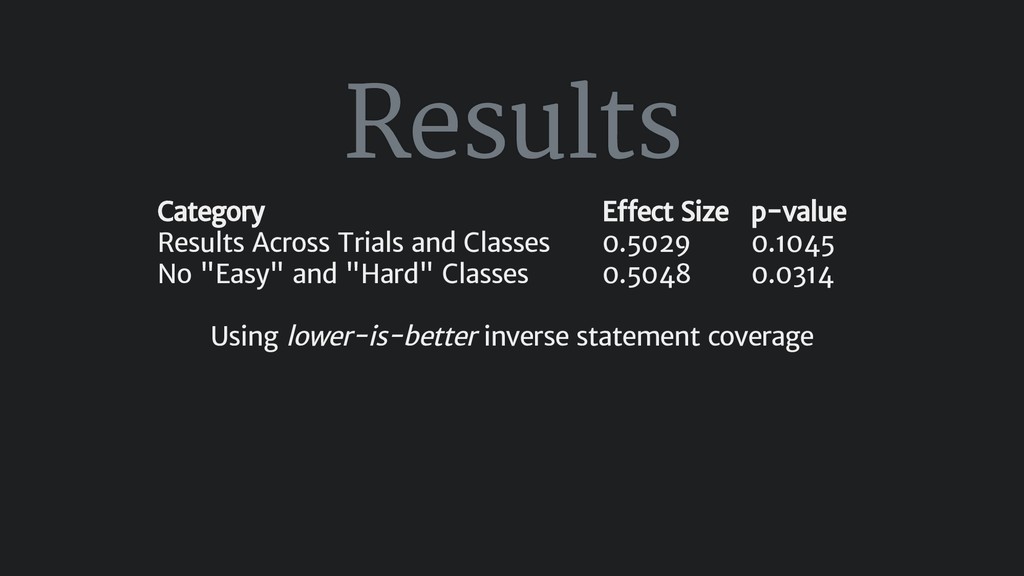
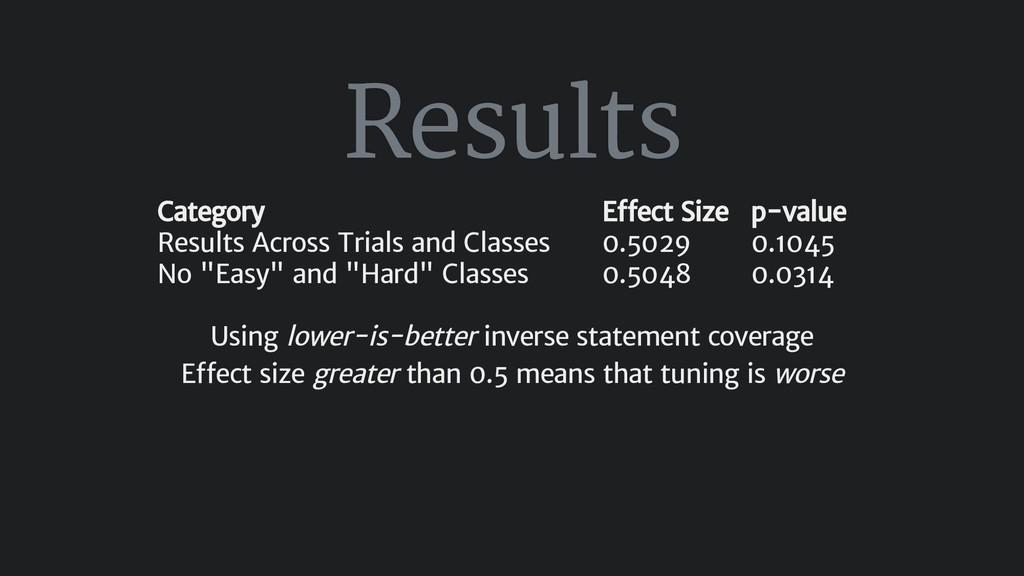
    than 0.5 means that tuning is worse Category E ect Size p-value Results Across Trials and Classes 0.5029 0.1045 No "Easy" and "Hard" Classes 0.5048 0.0314
  17. Results Using lower-is-better inverse statement coverage E ect size greater

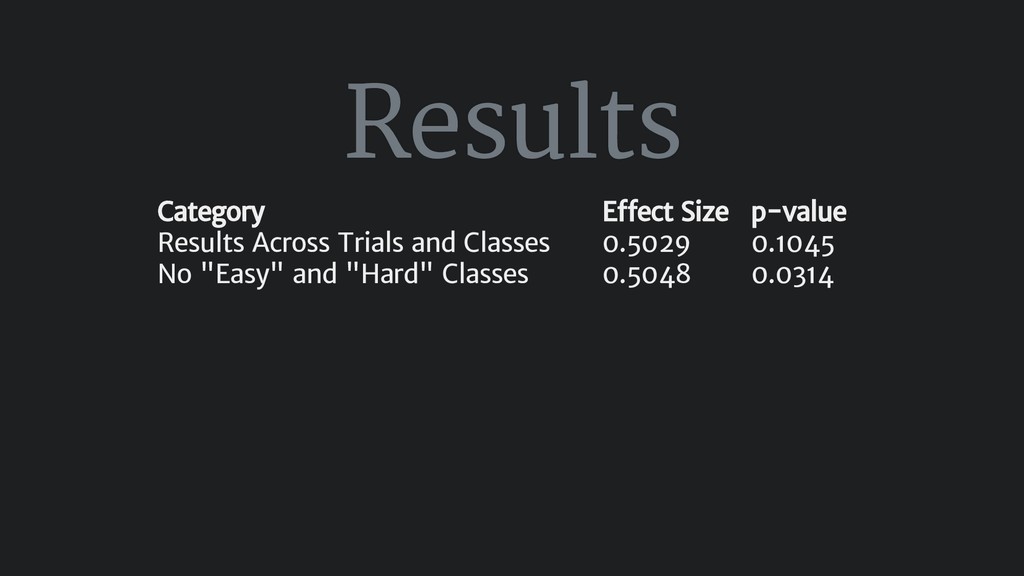
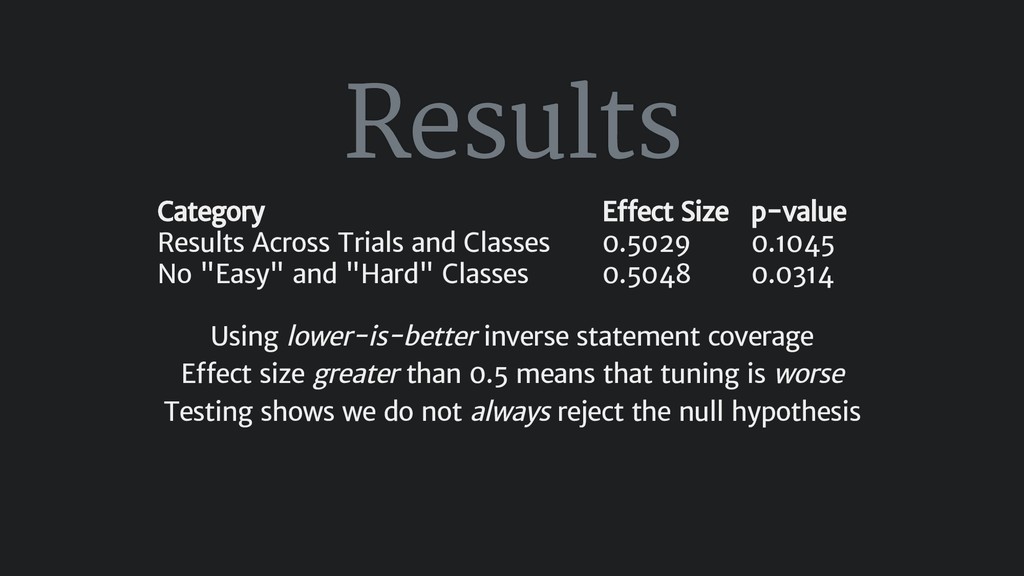
    than 0.5 means that tuning is worse Testing shows we do not always reject the null hypothesis Category E ect Size p-value Results Across Trials and Classes 0.5029 0.1045 No "Easy" and "Hard" Classes 0.5048 0.0314
  18. Results Using lower-is-better inverse statement coverage E ect size greater

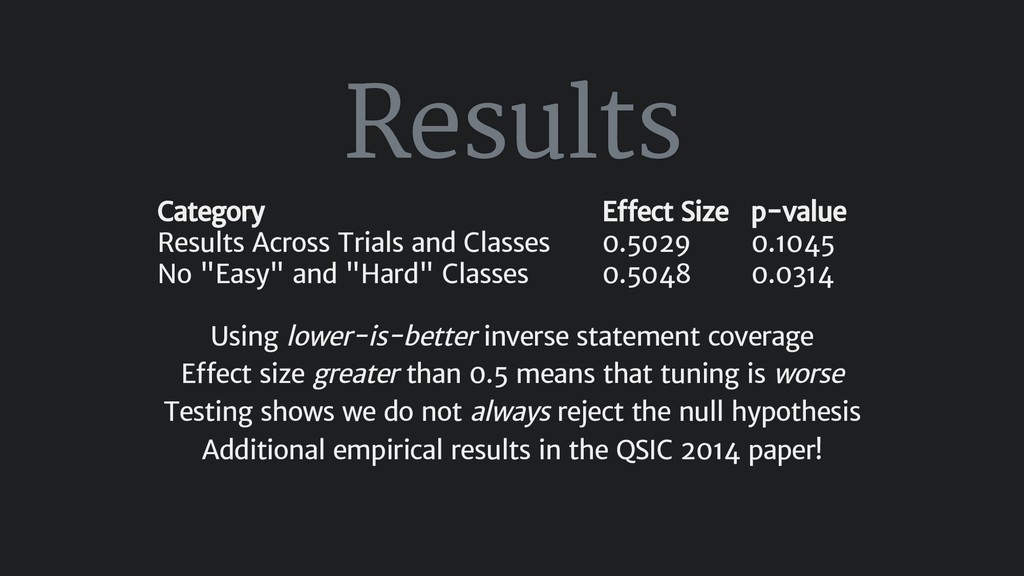
    than 0.5 means that tuning is worse Testing shows we do not always reject the null hypothesis Additional empirical results in the QSIC 2014 paper! Category E ect Size p-value Results Across Trials and Classes 0.5029 0.1045 No "Easy" and "Hard" Classes 0.5048 0.0314
  19. Discussion Tuning improved scores for 11 classes shared by creative

    commons licensed ( BY ) photo Startup Stock Photos
  20. Discussion Tuning improved scores for 11 classes Otherwise, same as

    or worse than defaults shared by creative commons licensed ( BY ) photo Startup Stock Photos
  21. Discussion Tuning improved scores for 11 classes Otherwise, same as

    or worse than defaults A "soft oor" may exist for parameter tuning shared by creative commons licensed ( BY ) photo Startup Stock Photos
  22. Discussion Tuning improved scores for 11 classes Otherwise, same as

    or worse than defaults A "soft oor" may exist for parameter tuning Additional details in the QSIC 2014 paper! shared by creative commons licensed ( BY ) photo Startup Stock Photos
  23. Important Contributions Comprehensive Experiments Conclusive Con rmation For EvoSuite, Defaults

    = Tuned shared by creative commons licensed ( BY-NC-ND ) ickr photo sunface13