Evaluate Coverage-Based Test Case Prioritization David Paterson University of Sheffield Gregory Kapfhammer Allegheny College Gordon Fraser University of Passau Phil McMinn University of Sheffield Workshop on Automation of Software Test 29th May 2018 [email protected]
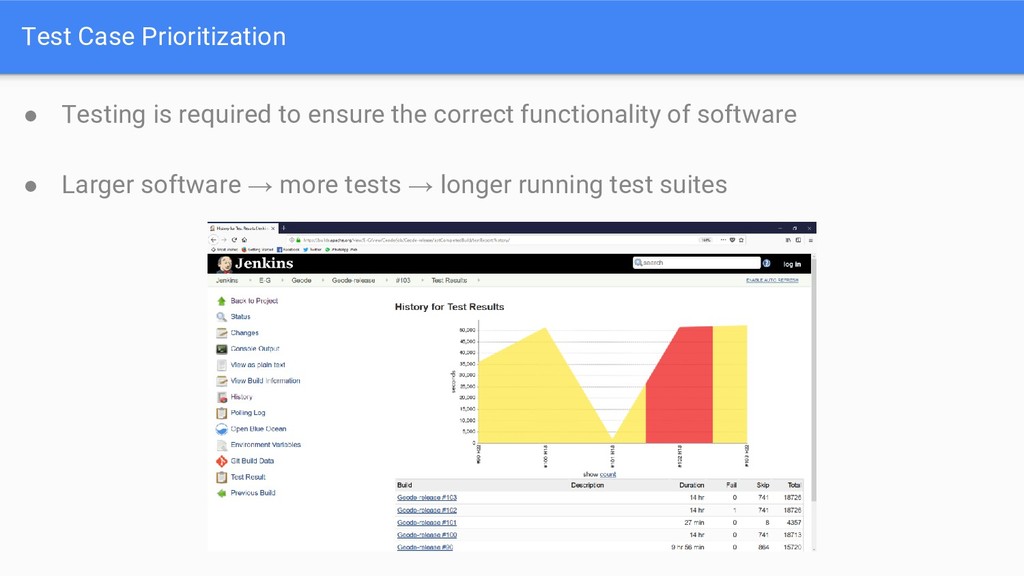
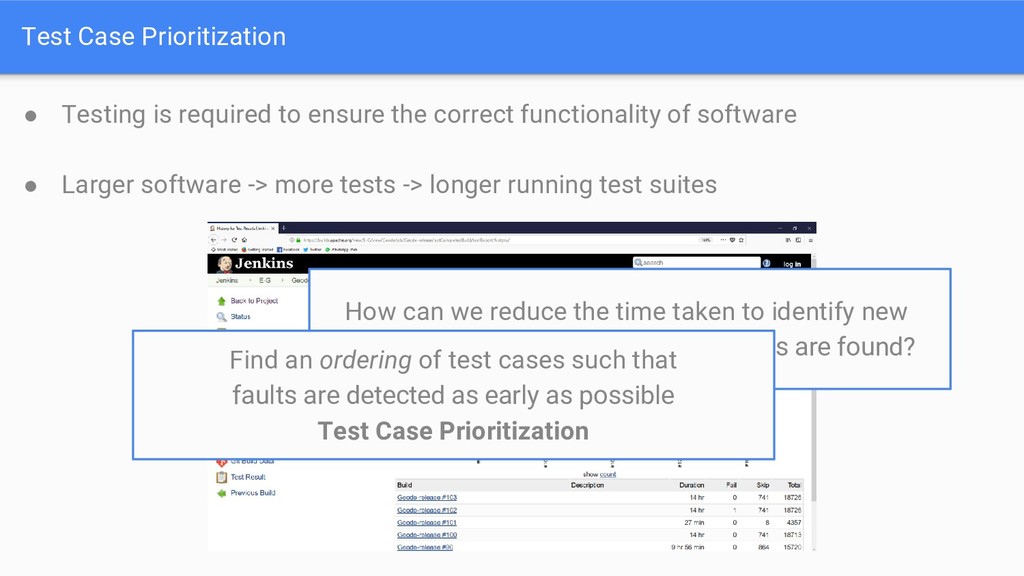
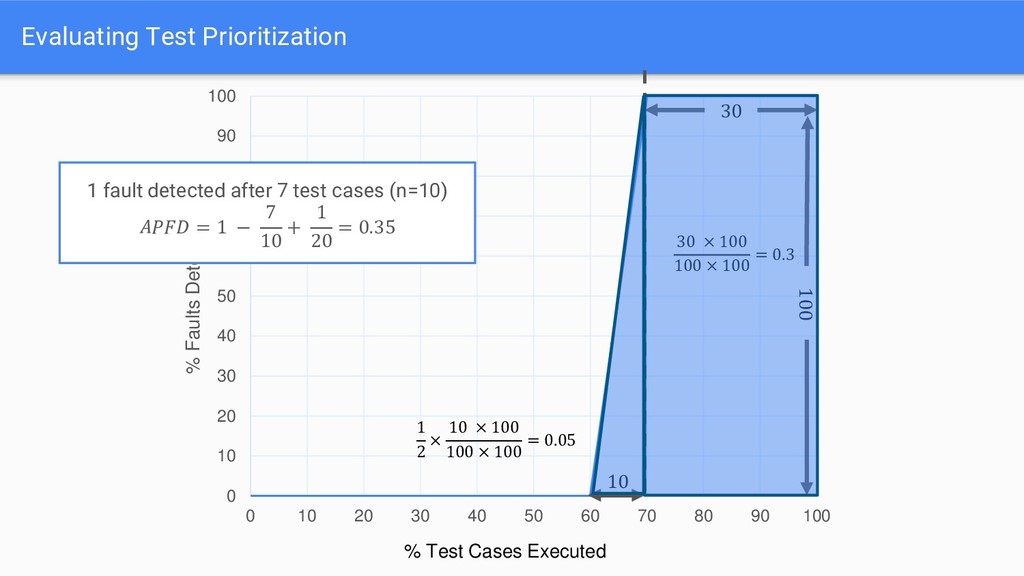
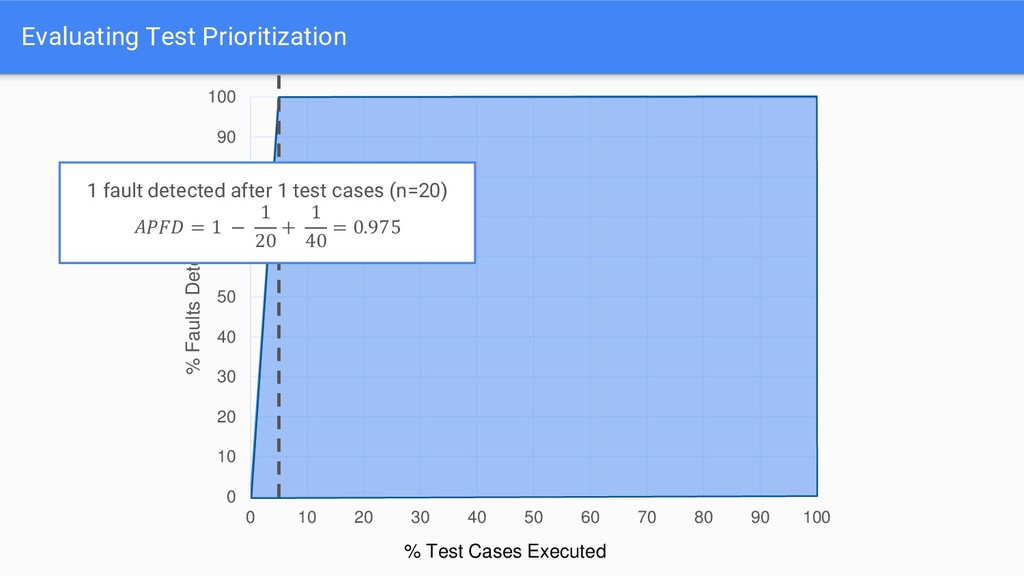
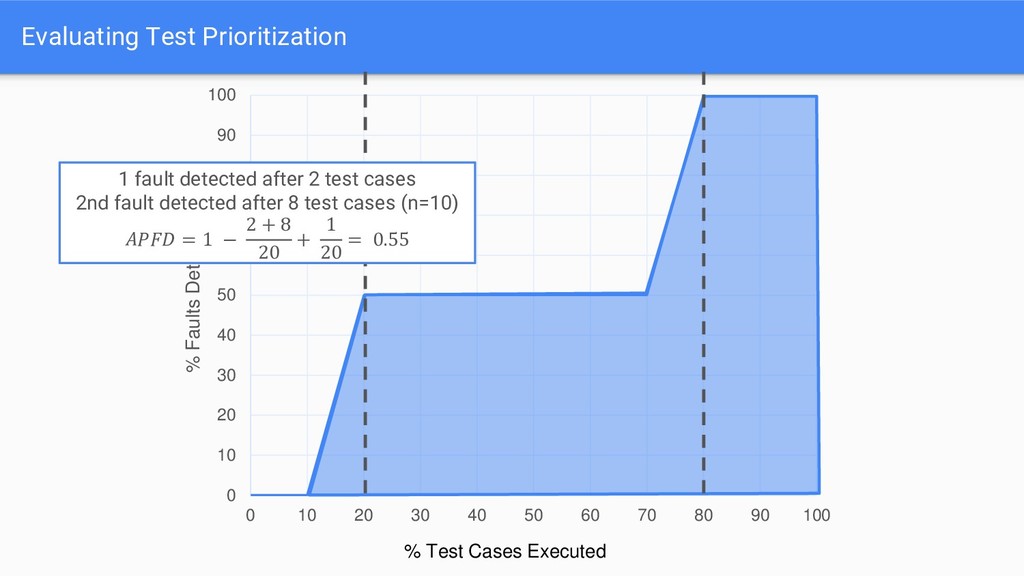
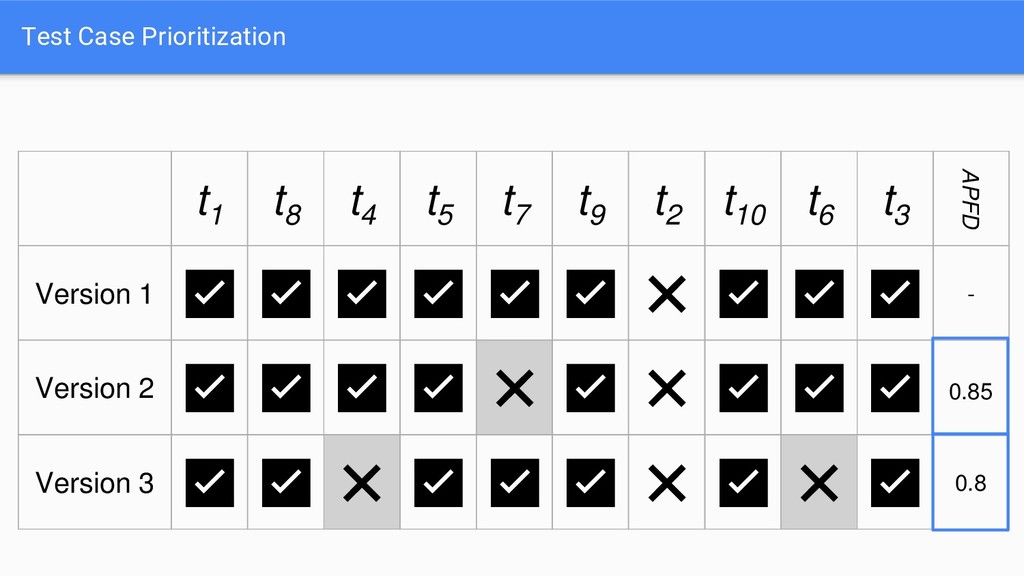
correct functionality of software • Larger software -> more tests -> longer running test suites How can we reduce the time taken to identify new faults whilst still ensuring that all faults are found? Find an ordering of test cases such that faults are detected as early as possible Test Case Prioritization
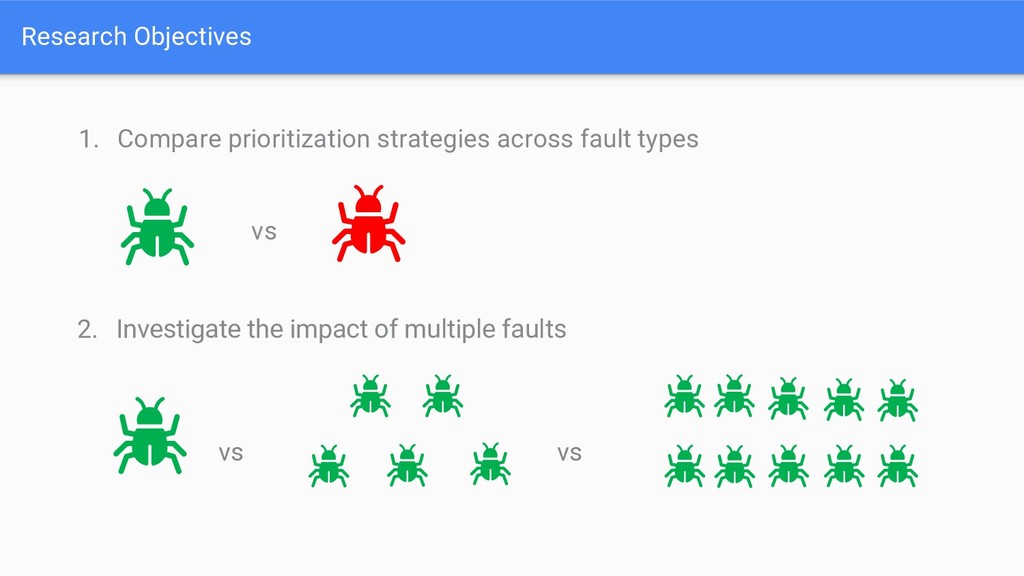
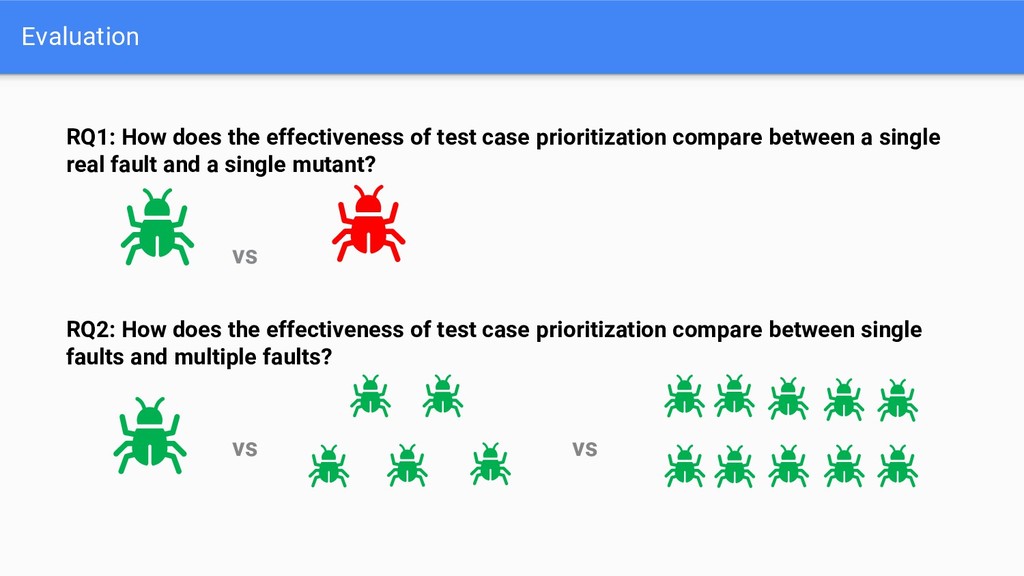
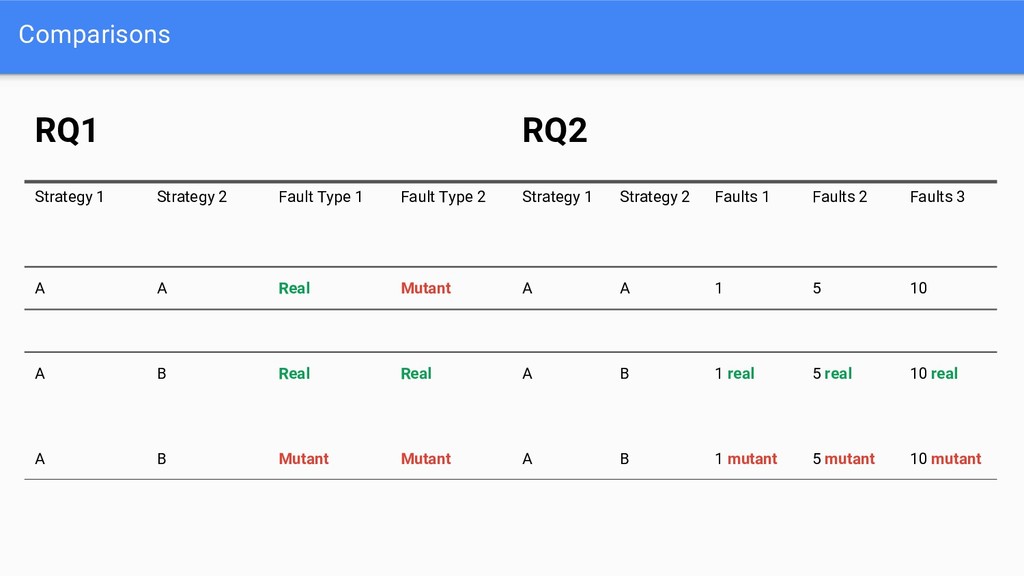
strategies across fault types RQ2: How does the effectiveness of test case prioritization compare between single faults and multiple faults? vs vs Evaluation RQ1: How does the effectiveness of test case prioritization compare between a single real fault and a single mutant? vs
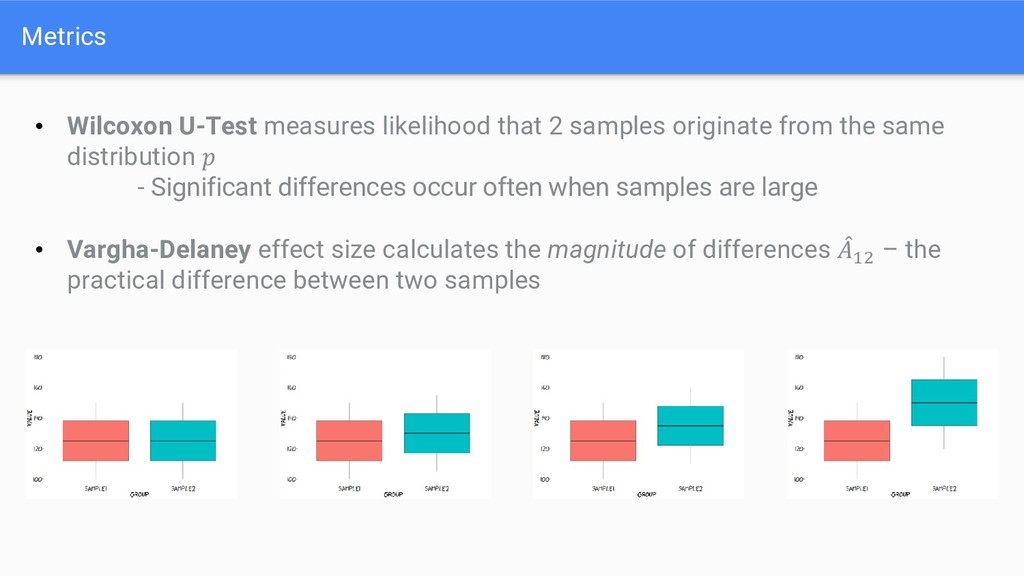
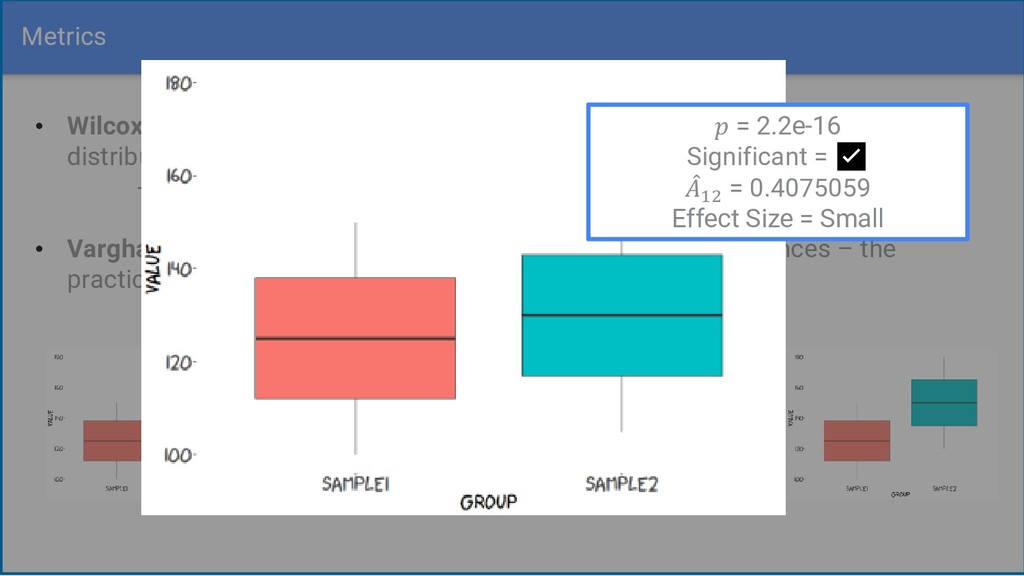
from the same distribution - Significant differences occur often when samples are large • Vargha-Delaney effect size calculates the magnitude of differences መ 12 – the practical difference between two samples
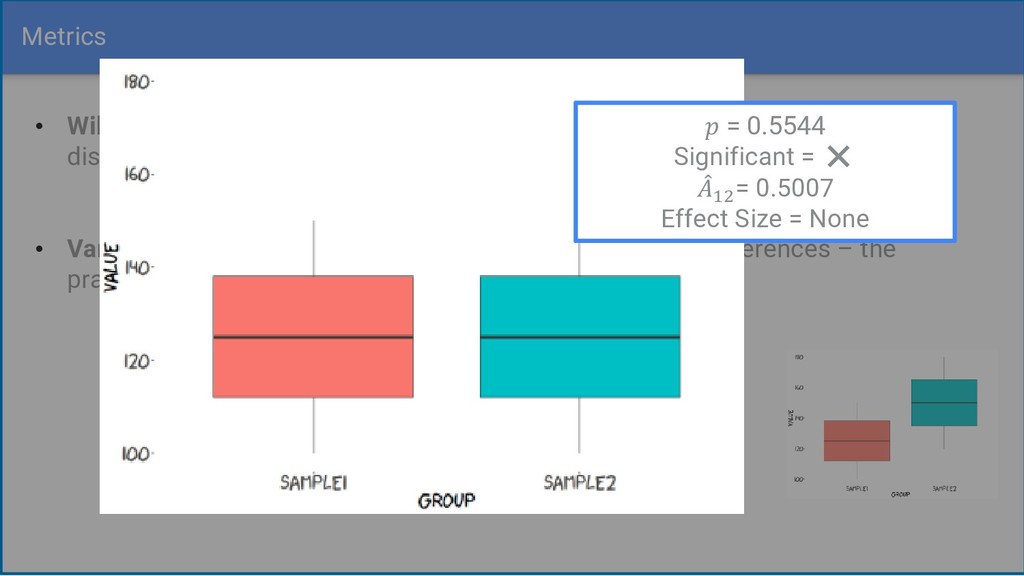
from the same distribution - Significant differences occur often when samples are large • Vargha-Delaney effect size calculates the magnitude of differences – the practical difference between two samples = 0.5544 Significant = ❌ መ 12 = 0.5007 Effect Size = None
from the same distribution - Significant differences occur often when samples are large • Vargha-Delaney effect size calculates the magnitude of differences – the practical difference between two samples = 2.2e-16 Significant = ✅ መ 12 = 0.4075059 Effect Size = Small
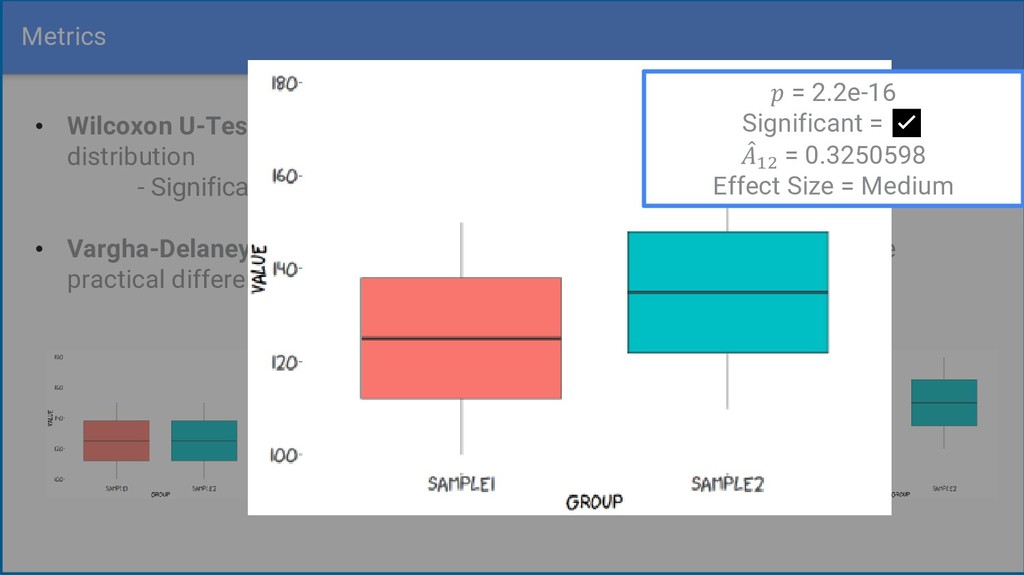
from the same distribution - Significant differences occur often when samples are large • Vargha-Delaney effect size calculates the magnitude of differences – the practical difference between two samples = 2.2e-16 Significant = ✅ መ 12 = 0.3250598 Effect Size = Medium
from the same distribution - Significant differences occur often when samples are large • Vargha-Delaney effect size calculates the magnitude of differences – the practical difference between two samples = 2.2e-16 Significant = ✅ መ 12 = 0.005826003 Effect Size = Large
Fault Type 2 Strategy 1 Strategy 2 Faults 1 Faults 2 Faults 3 A A Real Mutant A A 1 5 10 A B Real Real A B 1 real 5 real 10 real A B Mutant Mutant A B 1 mutant 5 mutant 10 mutant
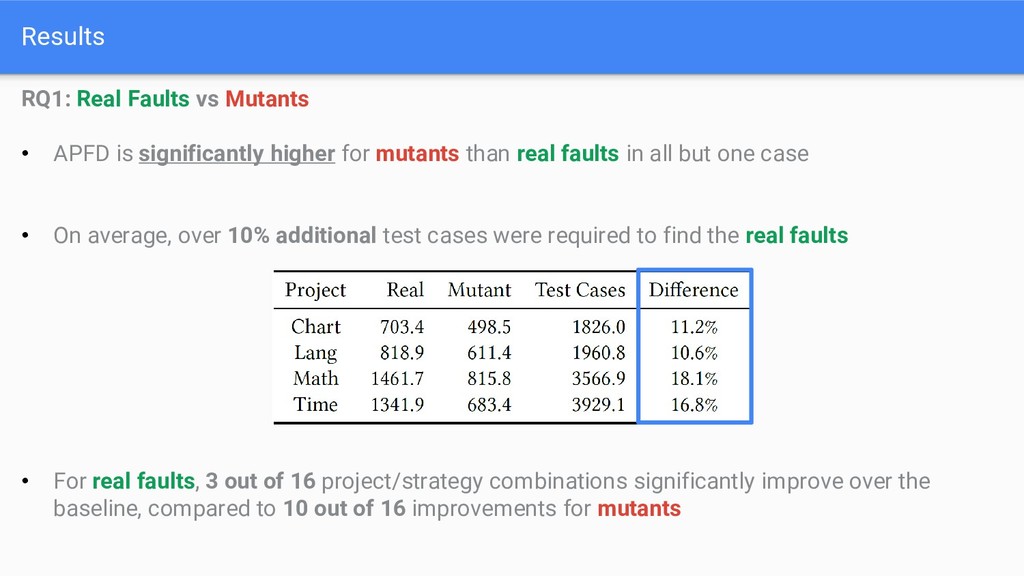
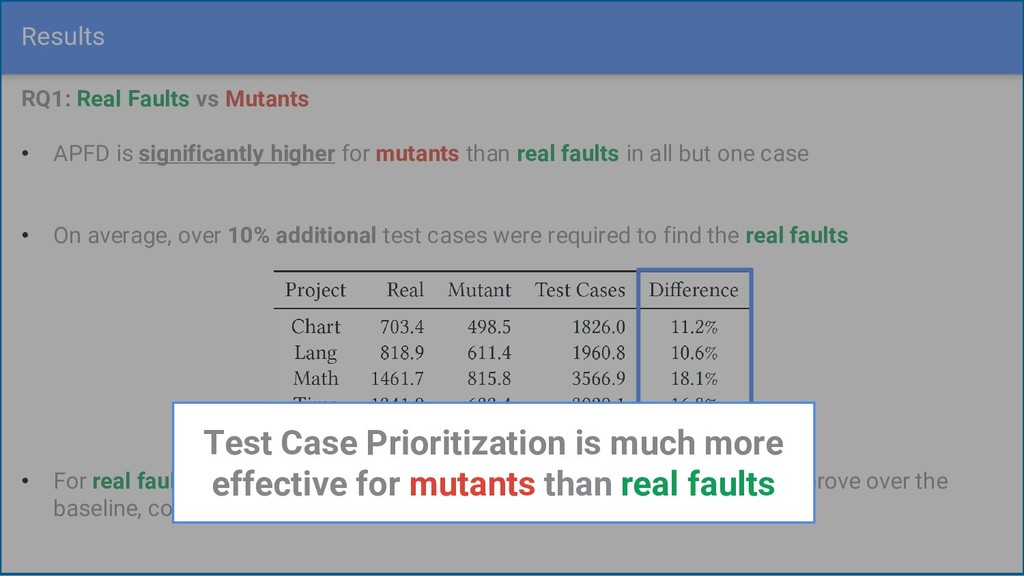
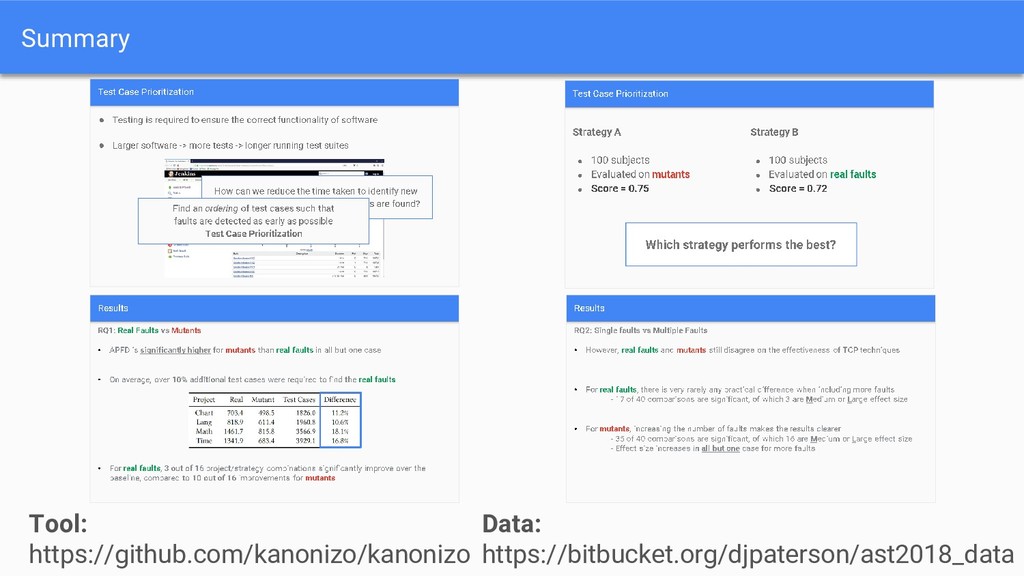
higher for mutants than real faults in all but one case • On average, over 10% additional test cases were required to find the real faults • For real faults, 3 out of 16 project/strategy combinations significantly improve over the baseline, compared to 10 out of 16 improvements for mutants
higher for mutants than real faults in all but one case • On average, over 10% additional test cases were required to find the real faults • For real faults, 3 out of 16 project/technique combinations significantly improve over the baseline, compared to 10 out of 16 improvements for mutants Test Case Prioritization is much more effective for mutants than real faults
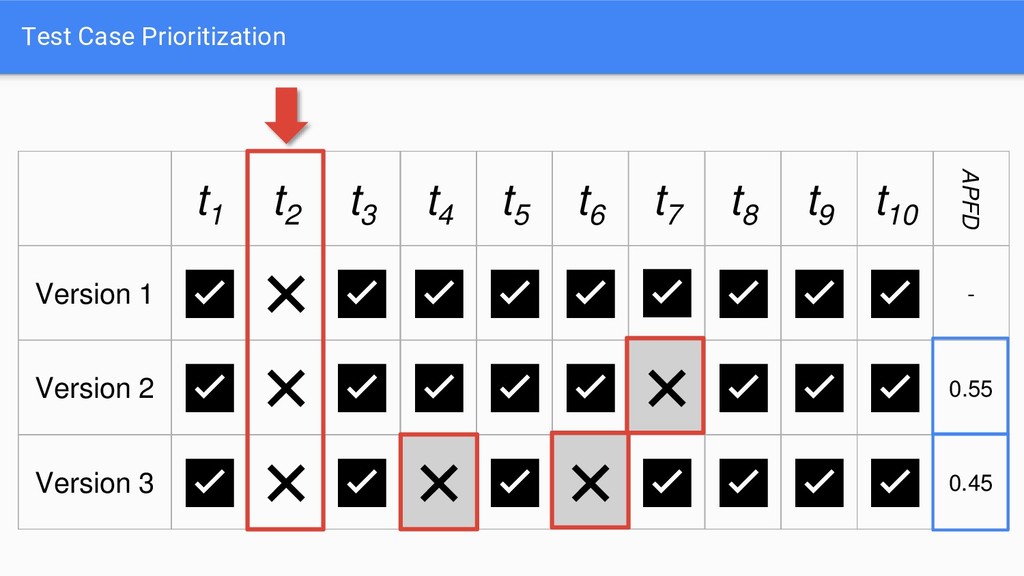
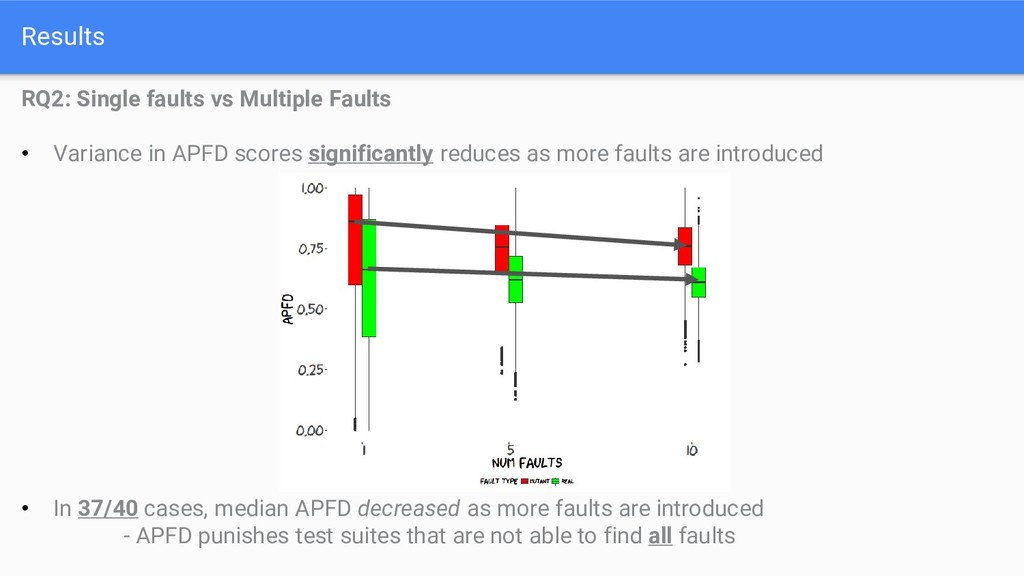
APFD scores significantly reduces as more faults are introduced • In 37/40 cases, median APFD decreased as more faults are introduced - APFD punishes test suites that are not able to find all faults
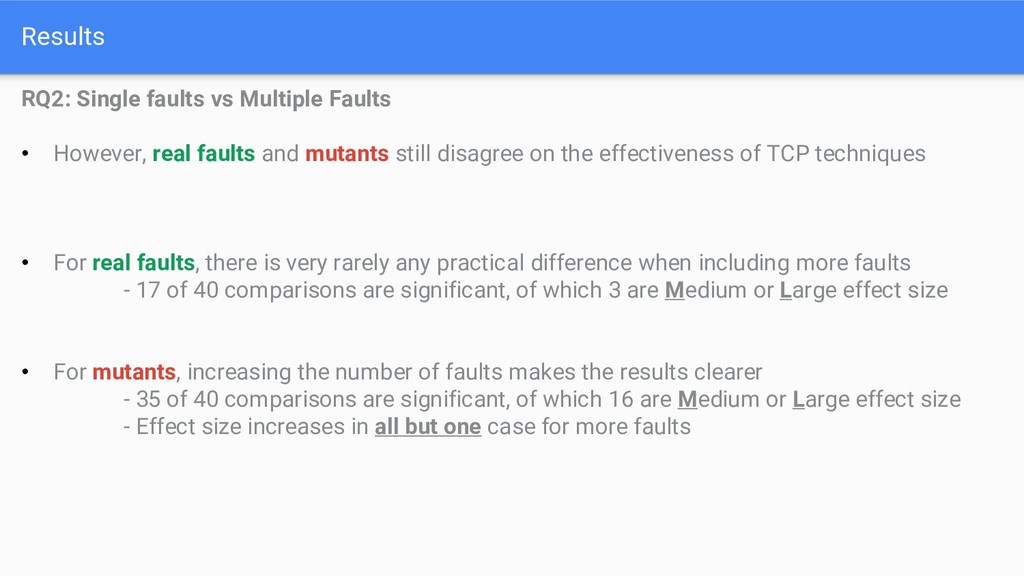
faults and mutants still disagree on the effectiveness of TCP techniques • For real faults, there is very rarely any practical difference when including more faults - 17 of 40 comparisons are significant, of which 3 are Medium or Large effect size • For mutants, increasing the number of faults makes the results clearer - 35 of 40 comparisons are significant, of which 16 are Medium or Large effect size - Effect size increases in all but one case for more faults
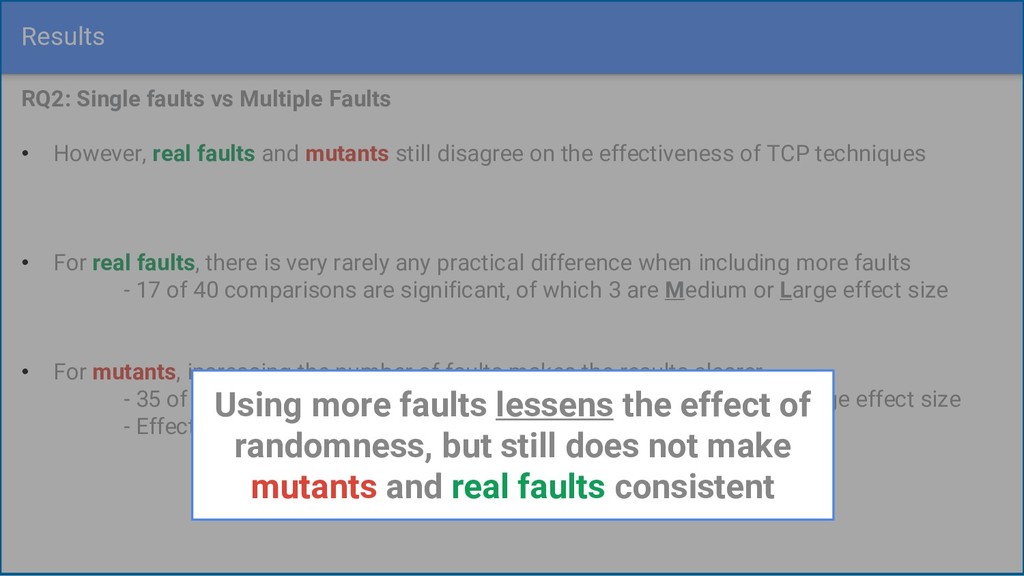
faults and mutants still disagree on the effectiveness of TCP techniques • For real faults, there is very rarely any practical difference when including more faults - 17 of 40 comparisons are significant, of which 3 are Medium or Large effect size • For mutants, increasing the number of faults makes the results clearer - 35 of 40 comparisons are significant, of which 16 are Medium or Large effect size - Effect size increases in all but one case for more faults Using more faults lessens the effect of randomness, but still does not make mutants and real faults consistent
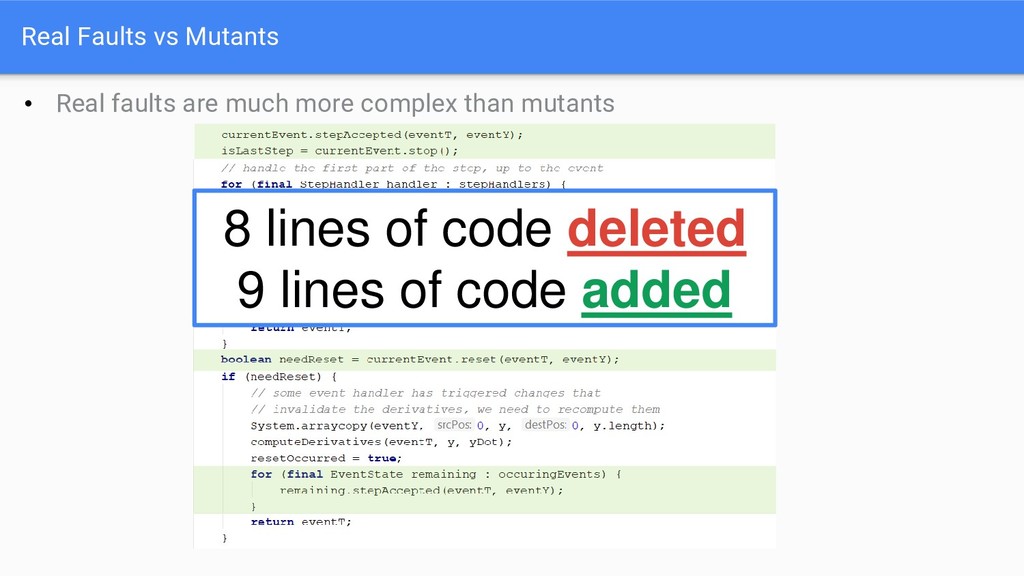
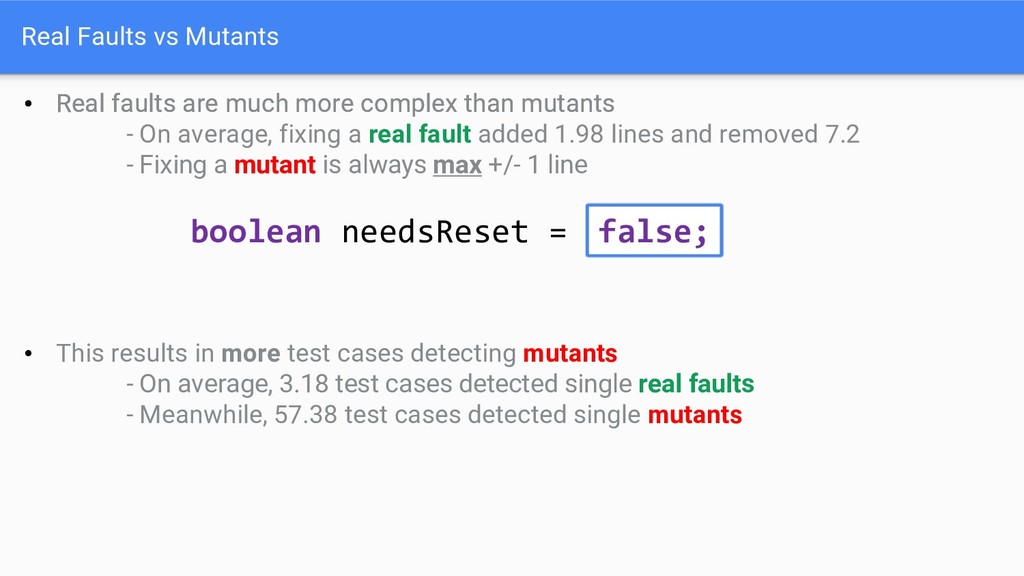
complex than mutants - On average, fixing a real fault added 1.98 lines and removed 7.2 - Fixing a mutant is always max +/- 1 line • Real faults are much more complex than mutants boolean needsReset = • This results in more test cases detecting mutants - On average, 3.18 test cases detected single real faults - Meanwhile, 57.38 test cases detected single mutants false;