Upgrade to Pro — share decks privately, control downloads, hide ads and more …

Starspots with K2 and IGRINS

gully
January 17, 2018

Starspots with K2 and IGRINS

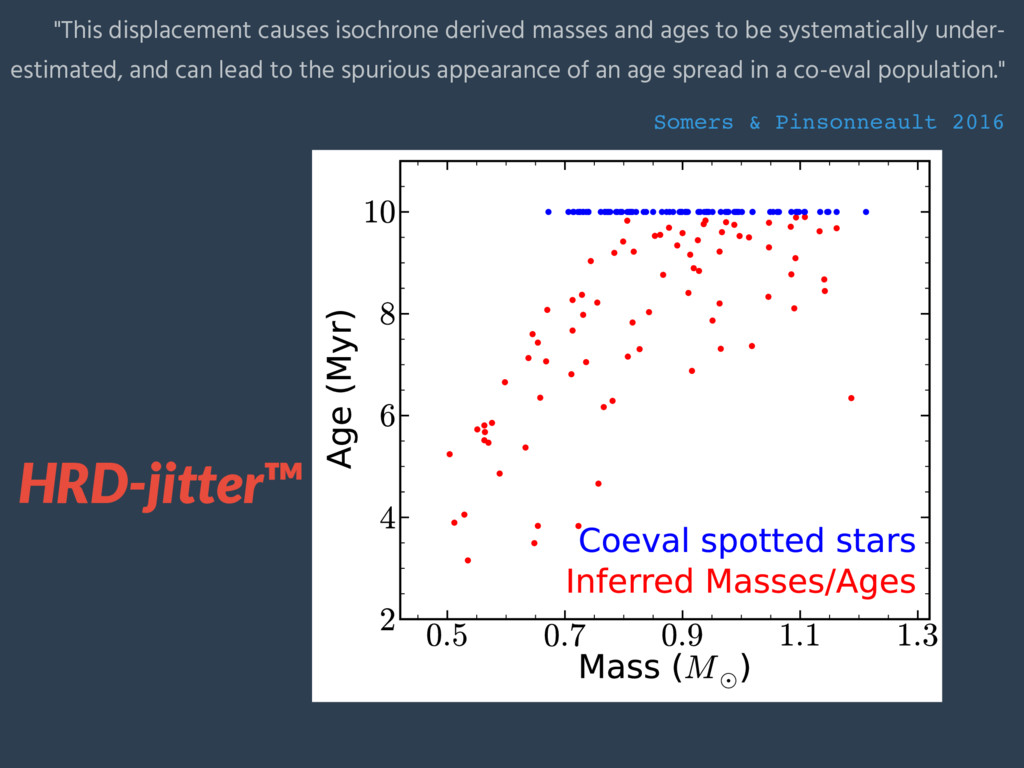
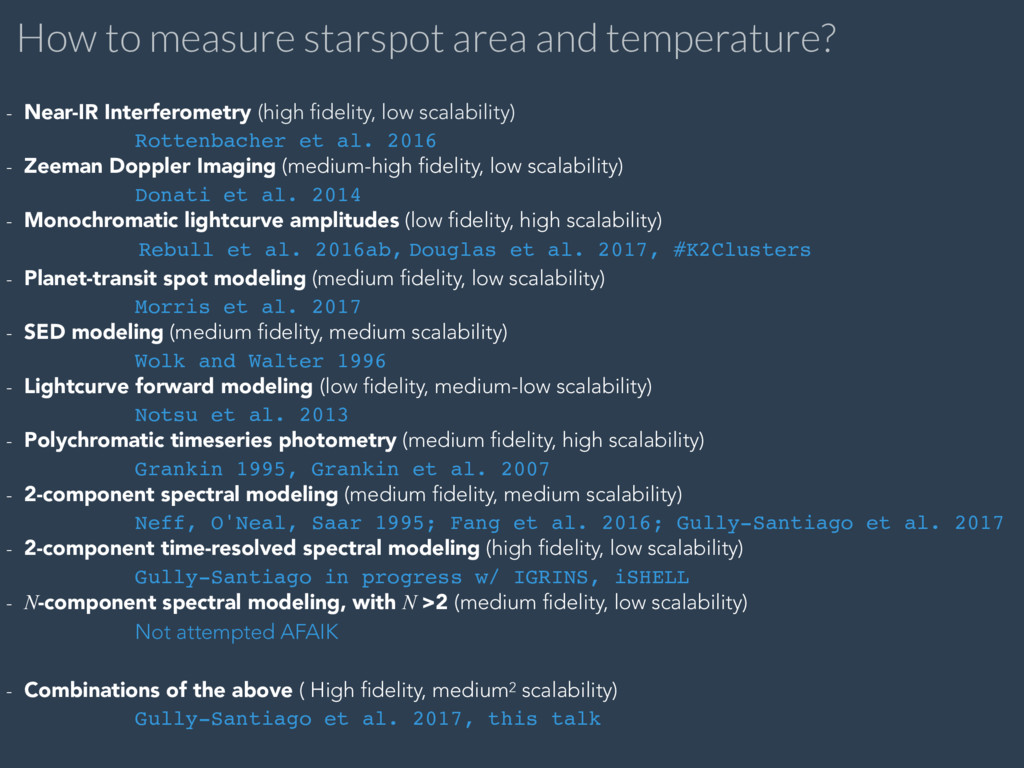
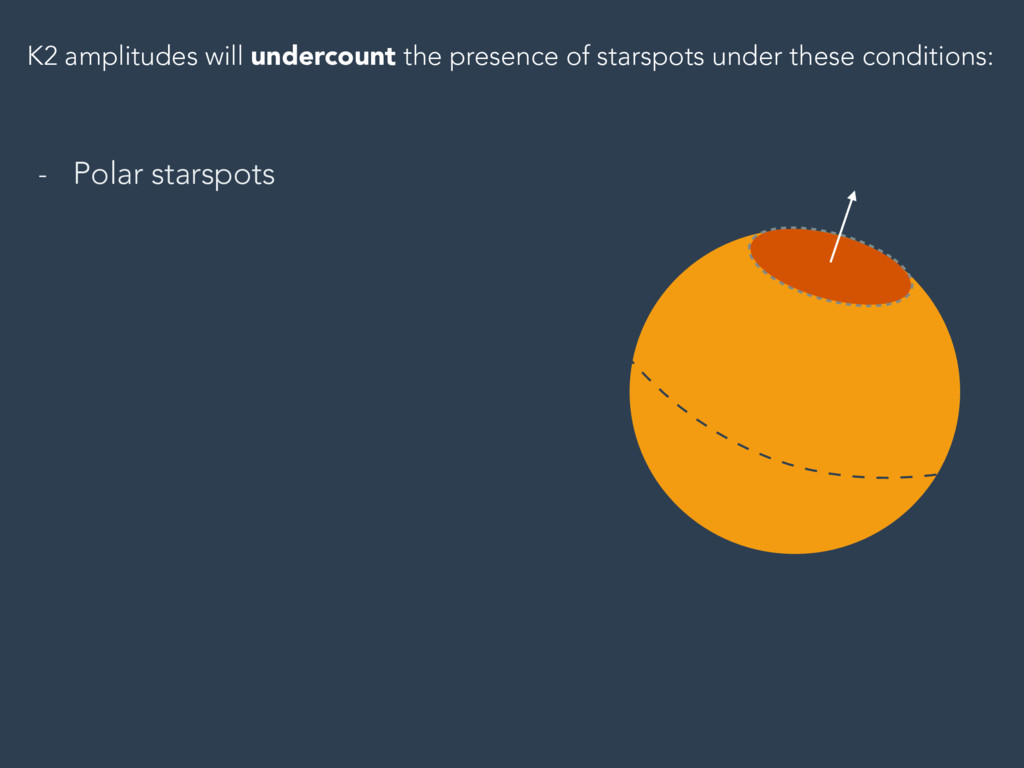
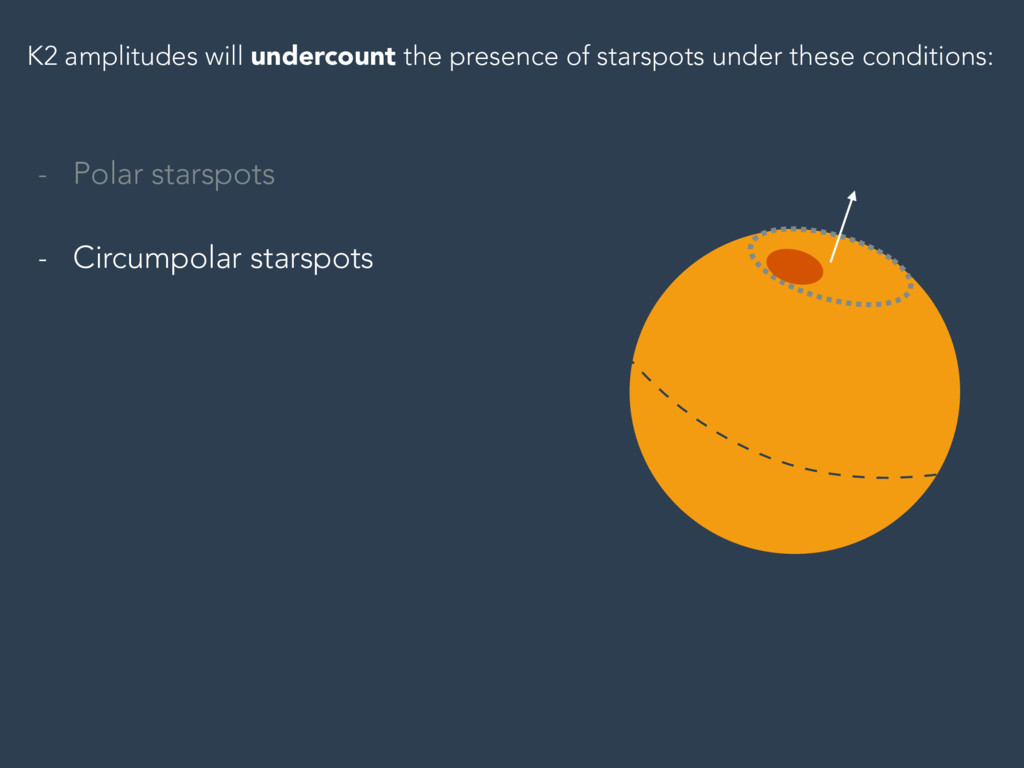
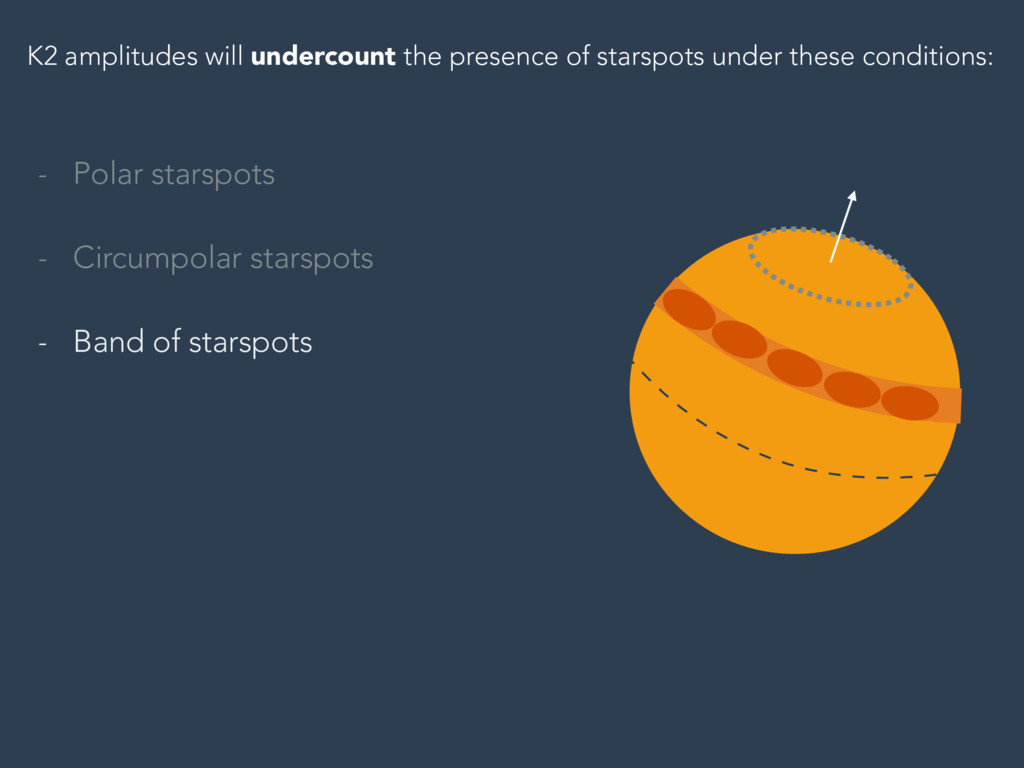
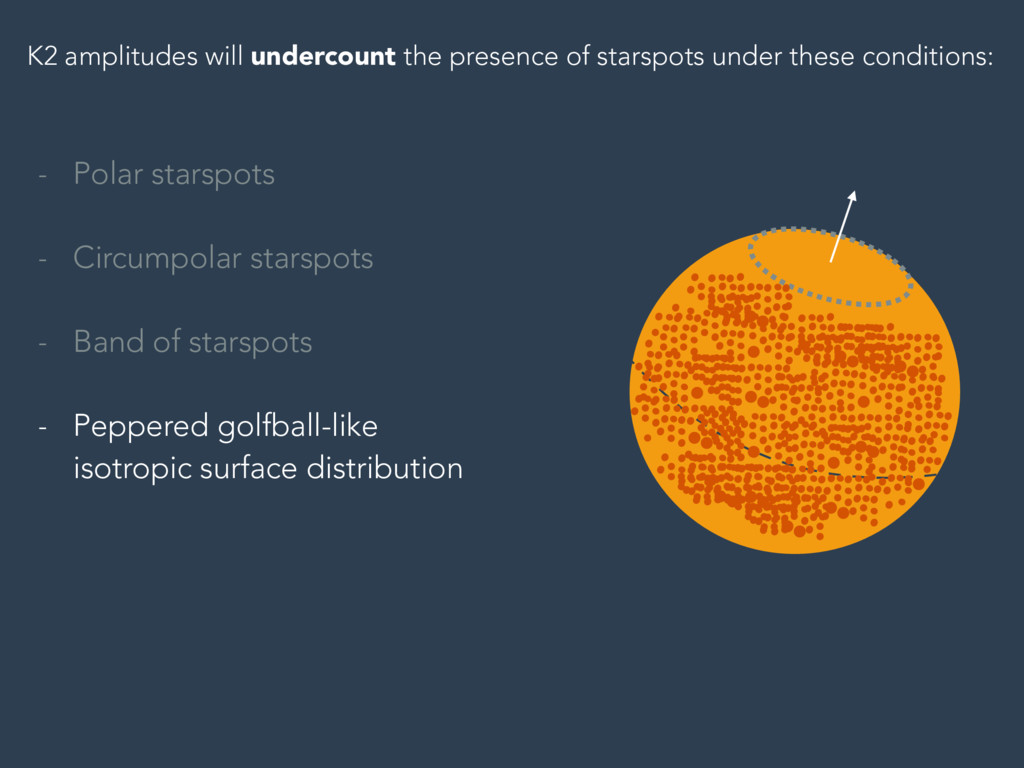
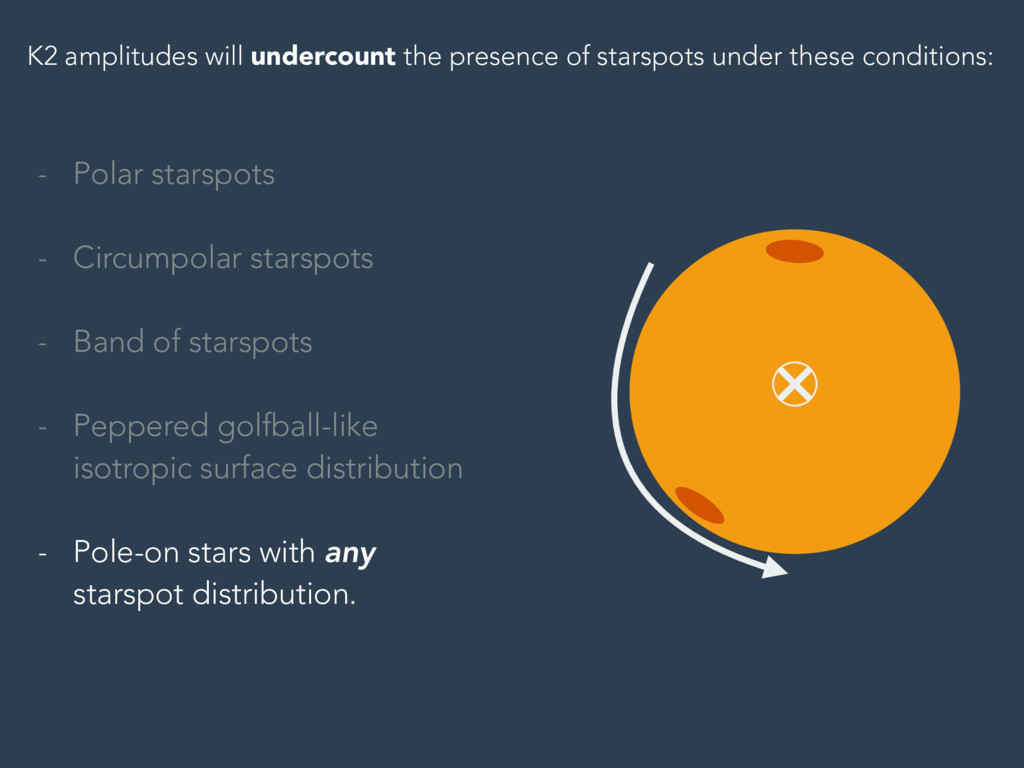
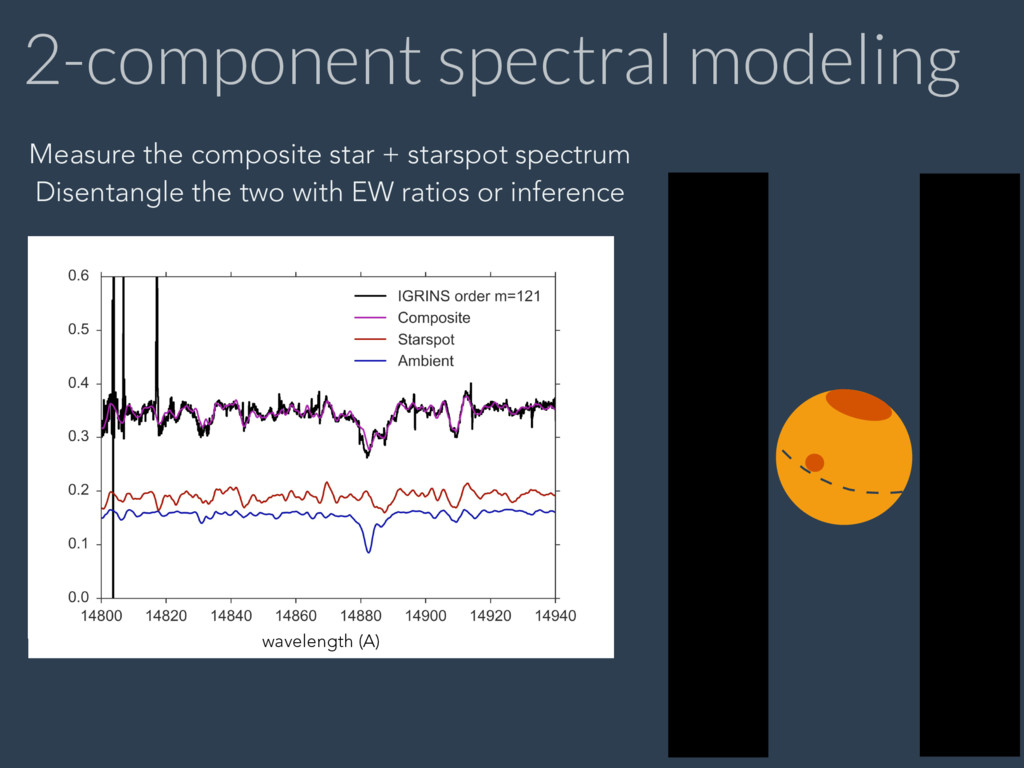
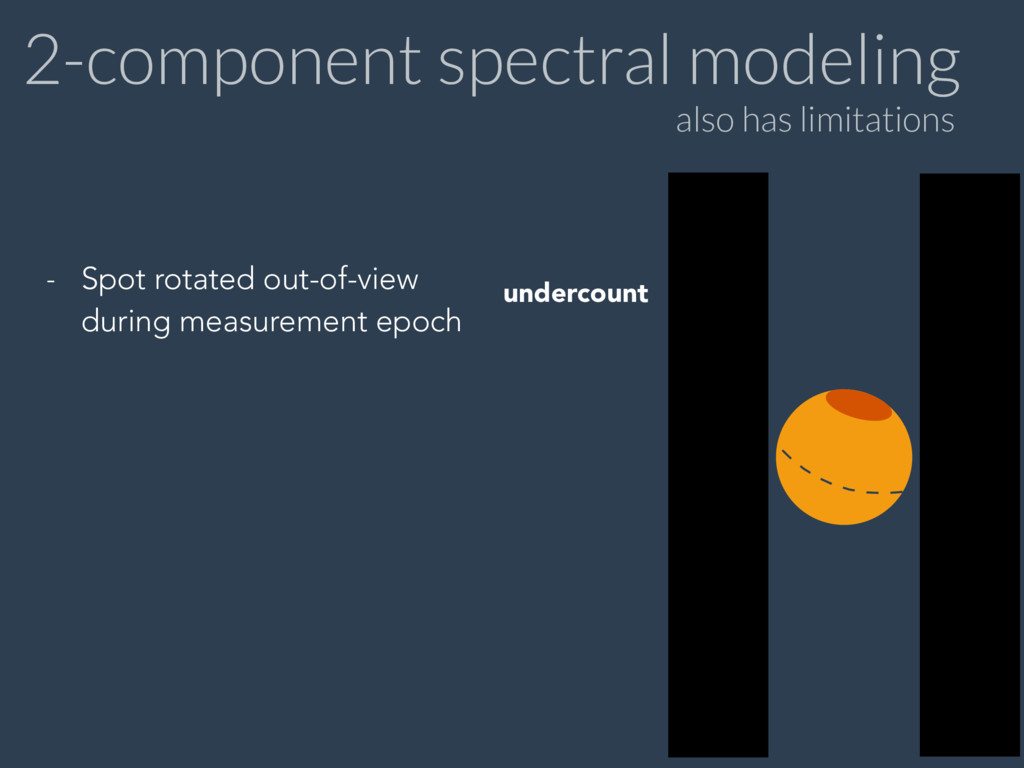
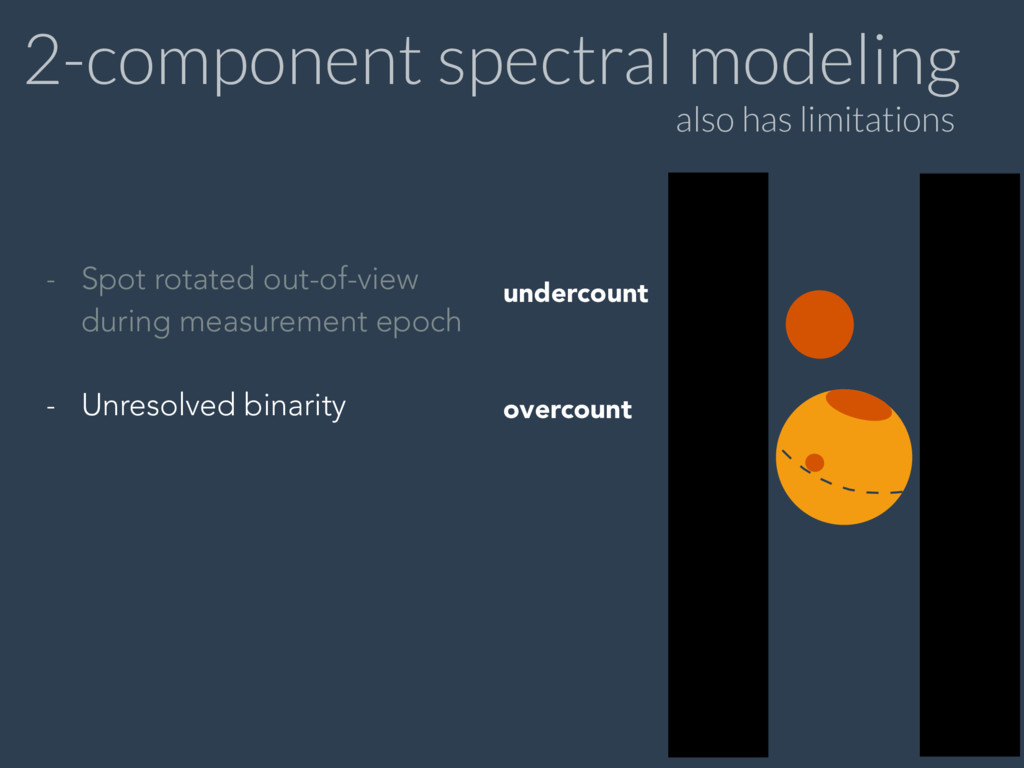
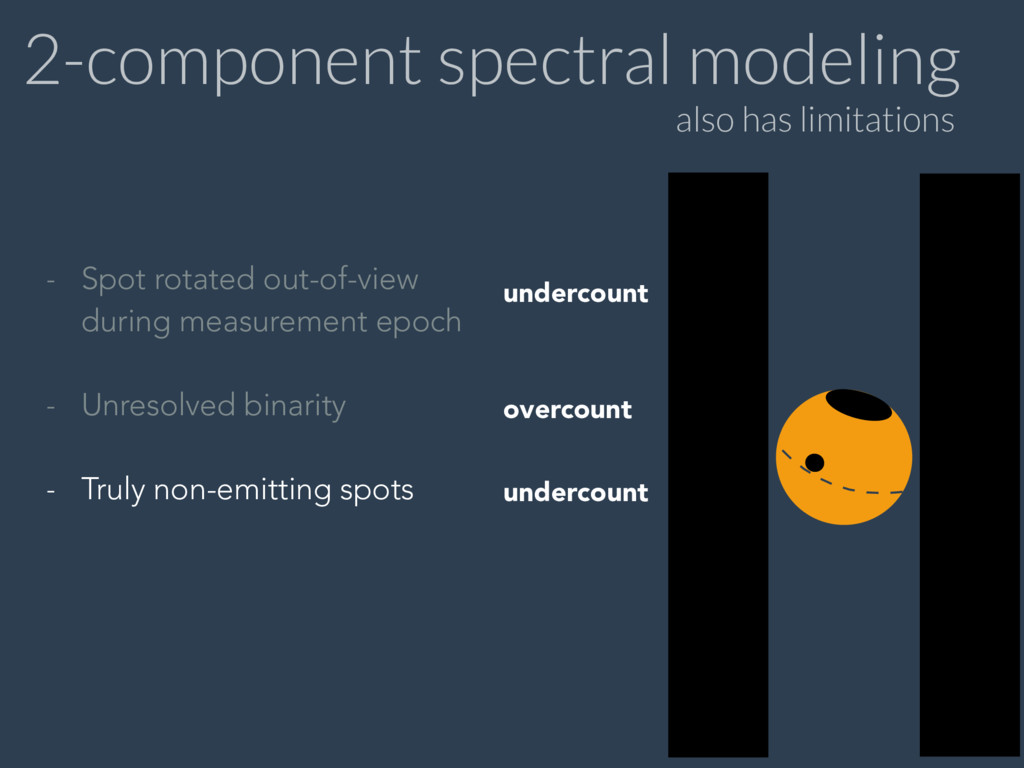
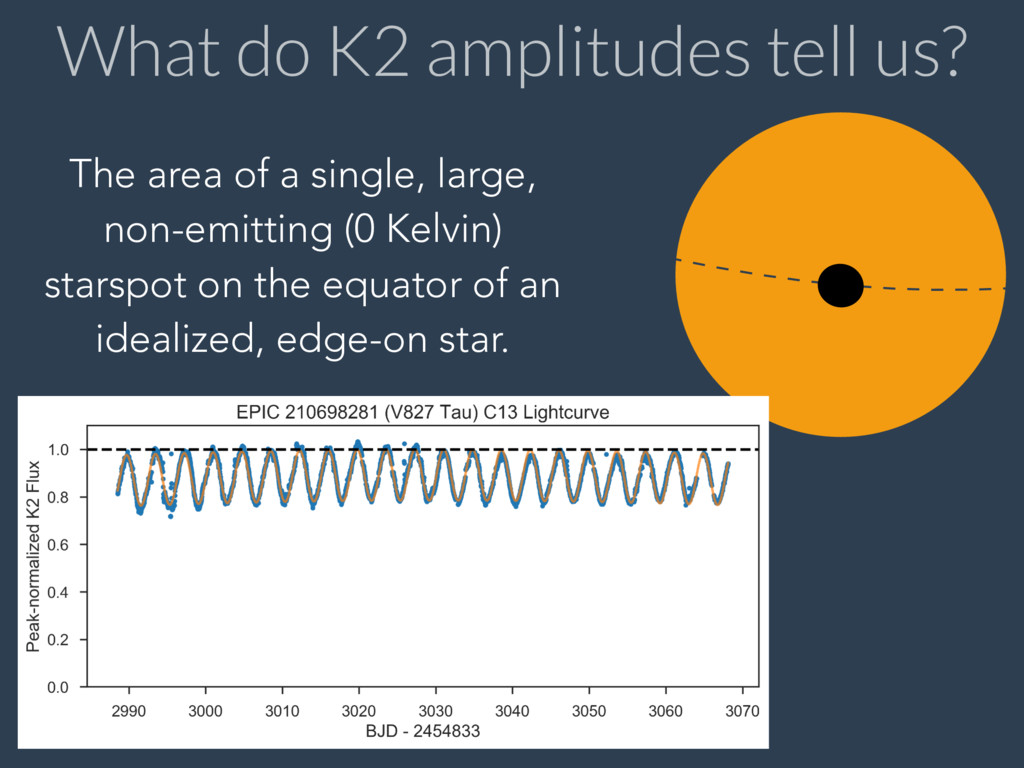
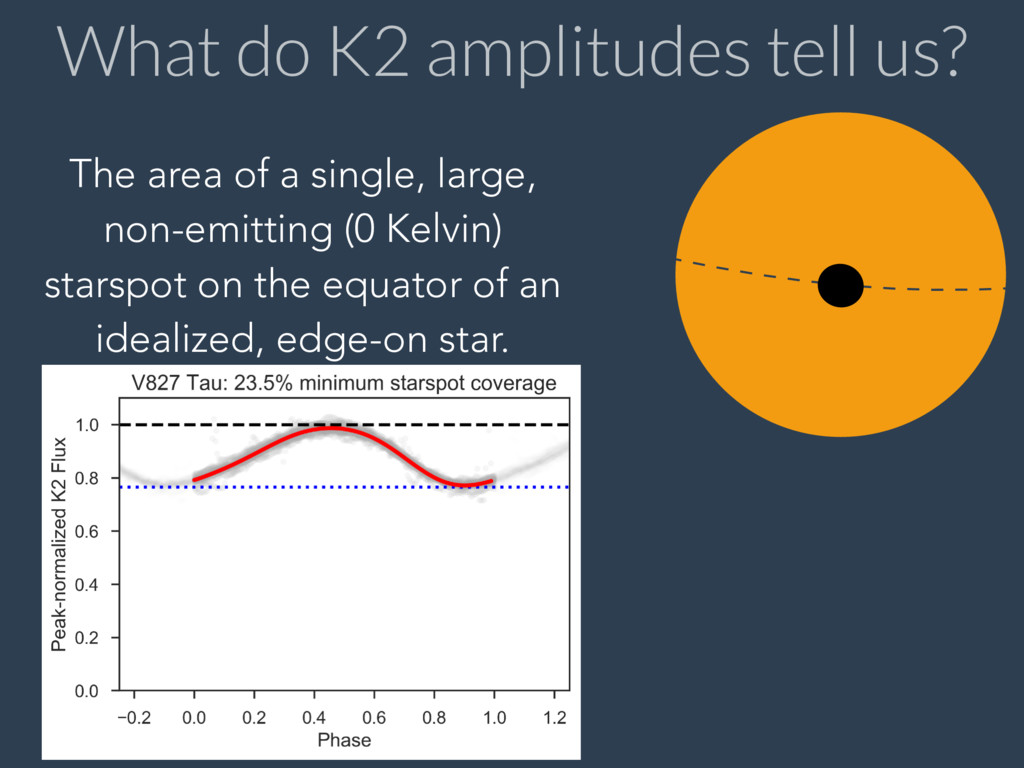
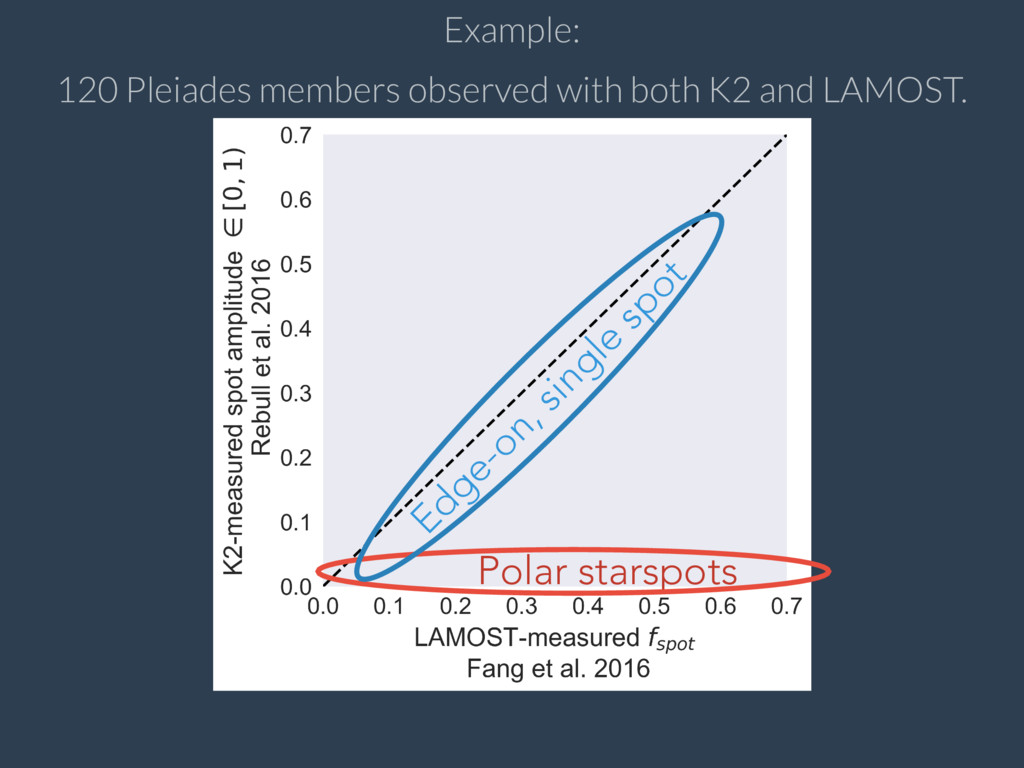
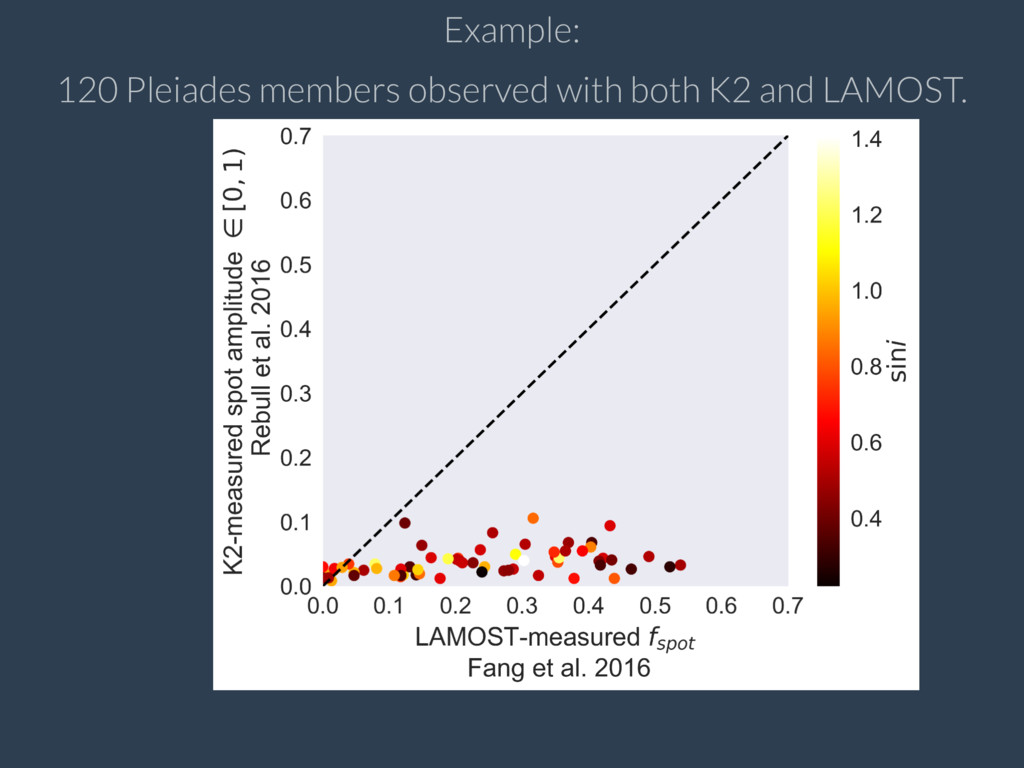
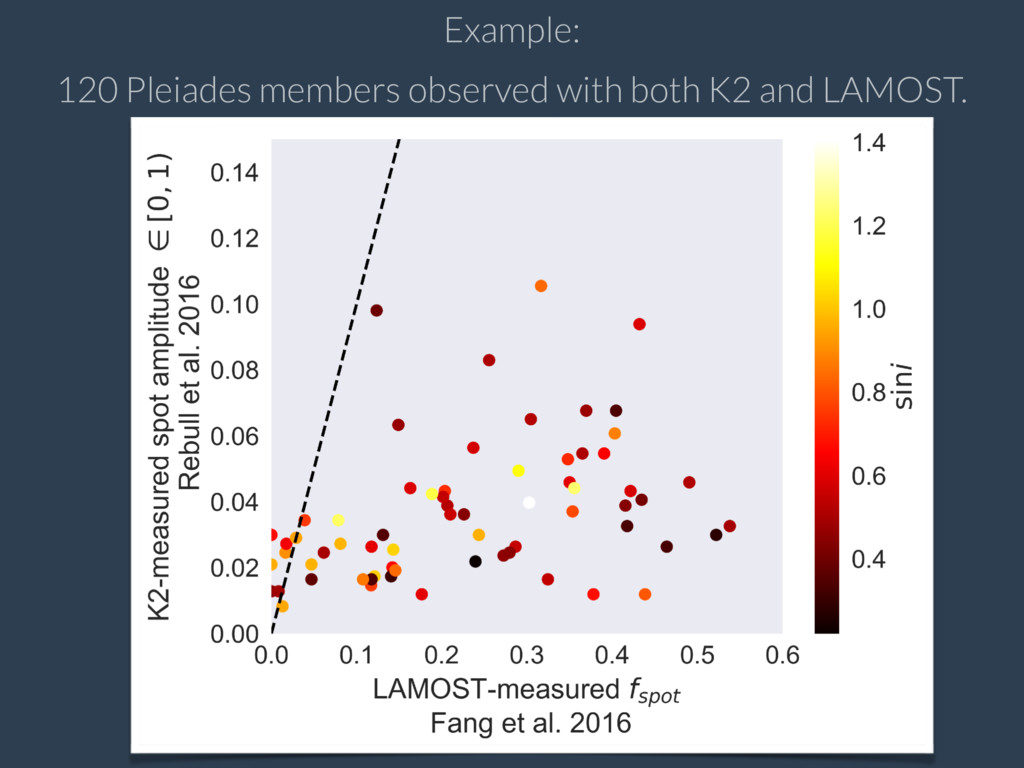
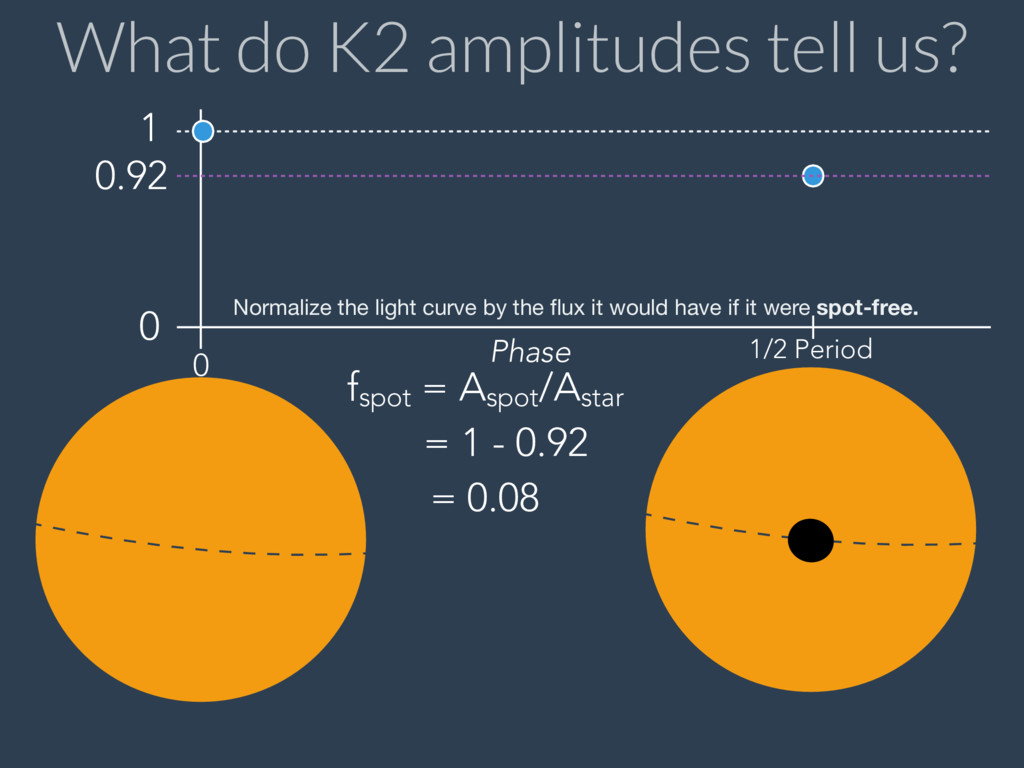
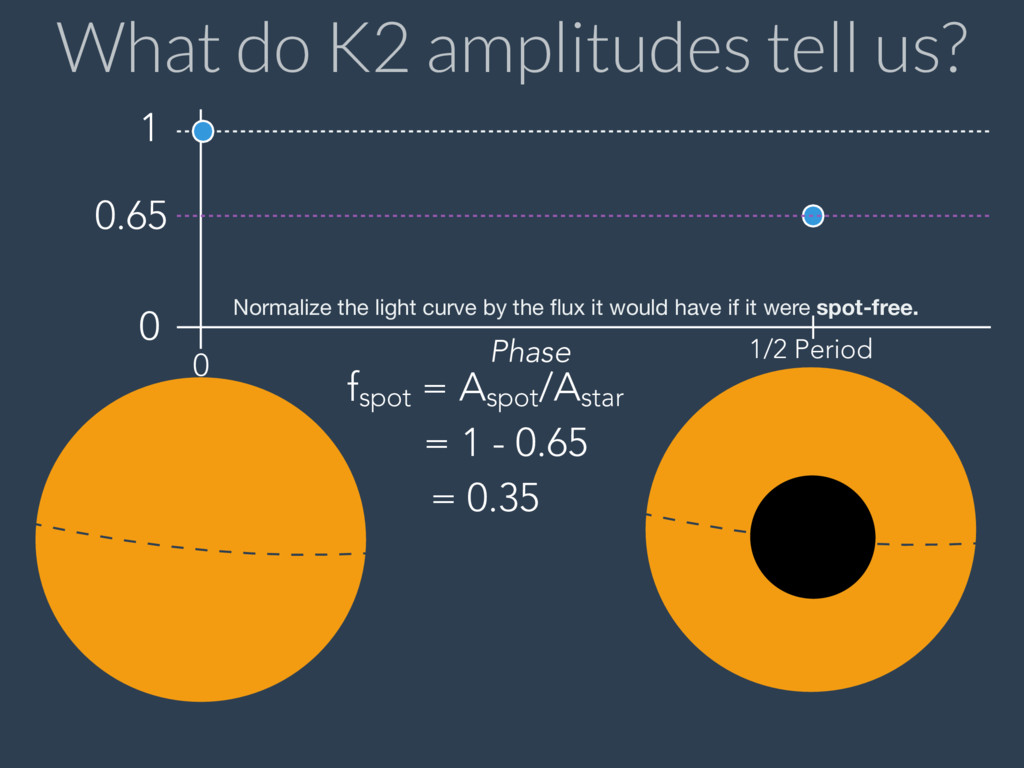
Talk given at #K2Clusters at Boston University on Wednesday, January 17, 2018. I overview methods for starspot measurements, and highlight geometrical limitations in lightcurve analysis. As an example I compare starspot coverages derived from K2 lightcurve amplitudes (Rebull et al. 2016) with starspot coverages estimated from LAMOST TiO analysis (Fang et al. 2016). We see that spectroscopic techniques show larger starspot coverage fractions than lightcurve amplitude analysis, as would be expected if polar starspots or isotropic starspots were common. The widespread presence of such geometries could explain several unsolved problems in stellar astrophysics. The noisy measurement will benefit from future inference based analysis on higher resolution, higher bandwidth spectra from IGRINS and iSHELL.

gully

January 17, 2018
Tweet

More Decks by gully

Other Decks in Science

Transcript

  1. Starspots with K2 and IGRINS Michael Gully-Santiago Kepler/K2 Guest Observer

    Office NASA Ames Research Center #K2Clusters at Boston University January 2018
  2. Starspots know thy star Know thy Starspot characterization informs our

    understanding of fundamental stellar properties.
  3. "...mass, composition, and age do not uniquely specify the Hertzsprung-

    Russell diagram location of pre-MS stars." Somers & Pinsonneault 2015
  4. "This displacement causes isochrone derived masses and ages to be

    systematically under- estimated, and can lead to the spurious appearance of an age spread in a co-eval population." Somers & Pinsonneault 2016
  5. "This displacement causes isochrone derived masses and ages to be

    systematically under- estimated, and can lead to the spurious appearance of an age spread in a co-eval population." Somers & Pinsonneault 2016 HRD-jitter™
  6. What to measure? In order to assess the role of

    starspots in HRD-jitter™ 1. Starspot area 2. Starspot temperature Really we want 2D surface Temperature distribution, but these quantities comprise the first moments Ignoring complementary approaches that measure related properties (RV jitter, B-field, spot lifetime). e.g. ongoing work from Johns-Krull, Giles, Wang, Prato, Cegla, Haywood
  7. How to measure starspot area and temperature? - Near-IR Interferometry

    (high fidelity, low scalability) Rottenbacher et al. 2016 - Zeeman Doppler Imaging (medium-high fidelity, low scalability) Donati et al. 2014 - Monochromatic lightcurve amplitudes (low fidelity, high scalability) Rebull et al. 2016ab, Douglas et al. 2017, #K2Clusters - Planet-transit spot modeling (medium fidelity, low scalability) Morris et al. 2017 - SED modeling (medium fidelity, medium scalability) Wolk and Walter 1996 - Lightcurve forward modeling (low fidelity, medium-low scalability) Notsu et al. 2013 - Polychromatic timeseries photometry (medium fidelity, high scalability) Grankin 1995, Grankin et al. 2007 - 2-component spectral modeling (medium fidelity, medium scalability) Neff, O'Neal, Saar 1995; Fang et al. 2016; Gully-Santiago et al. 2017 - 2-component time-resolved spectral modeling (high fidelity, low scalability) Gully-Santiago in progress w/ IGRINS, iSHELL - N-component spectral modeling, with N >2 (medium fidelity, low scalability) Not attempted AFAIK - Combinations of the above ( High fidelity, medium2 scalability) Gully-Santiago et al. 2017, this talk
  8. Key distinction among starspot measurement techniques 1. Perturbative- Capture "merely"

    perturbations arising from rotational modulation from longitudinal asymmetries in starspot location detects starspot A 2. Full stellar disk- Captures all the starspot flux at a given hemisphere epoch, regardless of longitudinal/latitudinal distribution, distinguishing starspots through some other means, e.g. spatially or spectrally detects starspots A & B A B
  9. - Polar starspots - Circumpolar starspots - Band of starspots

    - Peppered golfball-like isotropic surface distribution - Pole-on stars with any starspot distribution. K2 amplitudes will undercount the presence of starspots under these conditions:
  10. - Polar starspots - Circumpolar starspots - Band of starspots

    - Peppered golfball-like isotropic surface distribution - Pole-on stars with any starspot distribution. K2 amplitudes will undercount the presence of starspots under these conditions:
  11. - Polar starspots - Circumpolar starspots - Band of starspots

    - Peppered golfball-like isotropic surface distribution - Pole-on stars with any starspot distribution. K2 amplitudes will undercount the presence of starspots under these conditions:
  12. - Polar starspots - Circumpolar starspots - Band of starspots

    - Peppered golfball-like isotropic surface distribution - Pole-on stars with any starspot distribution. K2 amplitudes will undercount the presence of starspots under these conditions:
  13. - Polar starspots - Circumpolar starspots - Band of starspots

    - Peppered golfball-like isotropic surface distribution - Pole-on stars with any starspot distribution. K2 amplitudes will undercount the presence of starspots under these conditions:
  14. 2-component spectral modeling wavelength (A) Measure the composite star +

    starspot spectrum Disentangle the two with EW ratios or inference
  15. 2-component spectral modeling - Spot rotated out-of-view during measurement epoch

    - Unresolved binarity - Truly non-emitting spots - Very low area of starspots also has limitations
  16. 2-component spectral modeling - Spot rotated out-of-view during measurement epoch

    - Unresolved binarity - Truly non-emitting spots - Very low area of starspots also has limitations undercount
  17. 2-component spectral modeling - Spot rotated out-of-view during measurement epoch

    - Unresolved binarity - Truly non-emitting spots - Very low area of starspots also has limitations undercount overcount
  18. 2-component spectral modeling - Spot rotated out-of-view during measurement epoch

    - Unresolved binarity - Truly non-emitting spots - Very low area of starspots also has limitations undercount overcount undercount
  19. What do K2 amplitudes tell us? The area of a

    single, large, non-emitting (0 Kelvin) starspot on the equator of an idealized, edge-on star.
  20. What do K2 amplitudes tell us? The area of a

    single, large, non-emitting (0 Kelvin) starspot on the equator of an idealized, edge-on star.
  21. Questions that polar starspots can answer. (L. Doyle) Why don't

    flares correlate with starspot minumum in K2 lightcurves ---> Because some starspots are always visible (R. Jeffries) Why do we see 14% radius inflation from Rsini maximum likelihood analysis. ---> Because large coverage fraction of starspots inhibit convective efficiency. (G. Zhen) Why are K2 periodic lightcurves sinusoidal and not piece-wise flat topped? ---> Because circumpolar spots on an inclined star cause smooth variations. (e.g. Magnetic spin axis is misaligned w.r.t. rotation axis) (C. Deen) Why do we sometimes get different spectral types in the optical and near-IR? ---> Because your near-IR spectrograph is picking up the starspot flux. (K. Covey) Why are the rapidly rotating stars in the Pleiades so infrared? ---> Because spot coverage scales with rotation, decreasing convective efficiency. (Anon) Why don't we see polar starspots on the Sun? ---> Because the Sun has different B field configuration than young stars. (D. Jaffe) Why do we see an spread in ages in young clusters pre-MS HRD? ---> Because a spread in starspot coverage fraction results in a spread in ages. (G. Sommers) Are stellar ages derived from pre-MS HRD biased? ---> Yes
  22. Conclusions Circumpolar starspots and other non-solar geometries can occur on

    stars. These starspot geometries elude photometric detection from K2. Starspots inflate stellar radii, causing both bias and scatter in the PMS HRD. Large population of polar-like geometry casts doubt on ages derived from PMS HRD. We are undertaking a project to combine K2 light curves with high-grasp IGRINS and iSHELL spectroscopy to make high(er) fidelity measurements of starspot properties. These techniques could scale to many more stars with LAMOST/APOGEE/Gaia/LSST. Spectral inference (Starfish) + GPU acceleration (The Payne + pytorch) can improve robustness/practicality of modeling composite stellar spectra.
  23. What do K2 amplitudes tell us? 0 1 0.92 Normalize

    the light curve by the flux it would have if it were spot-free. Phase 0 1/2 Period fspot = Aspot /Astar = 1 - 0.92 = 0.08
  24. What do K2 amplitudes tell us? 0 1 Normalize the

    light curve by the flux it would have if it were spot-free. 0.65 fspot = Aspot /Astar = 1 - 0.65 = 0.35 0 1/2 Period Phase