Upgrade to Pro — share decks privately, control downloads, hide ads and more …

Condensate clouds on ultracool dwarfs with TESS and IGRINS

gully
August 03, 2021

Condensate clouds on ultracool dwarfs with TESS and IGRINS

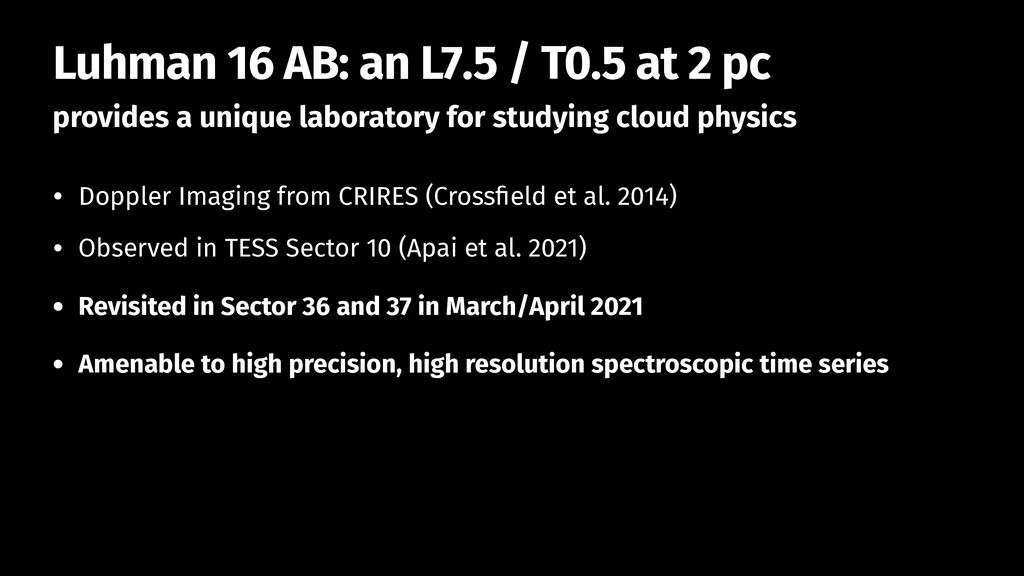
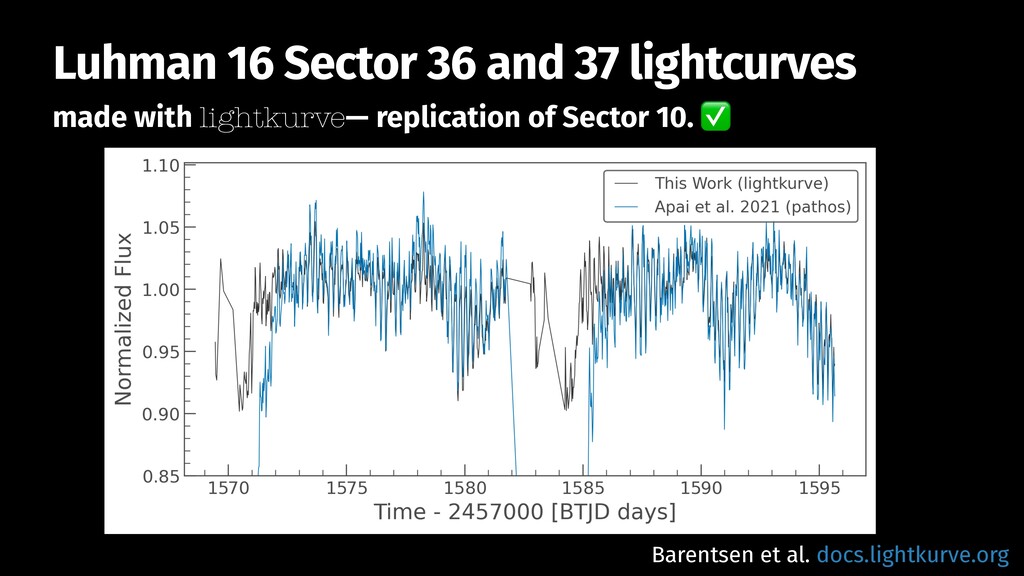
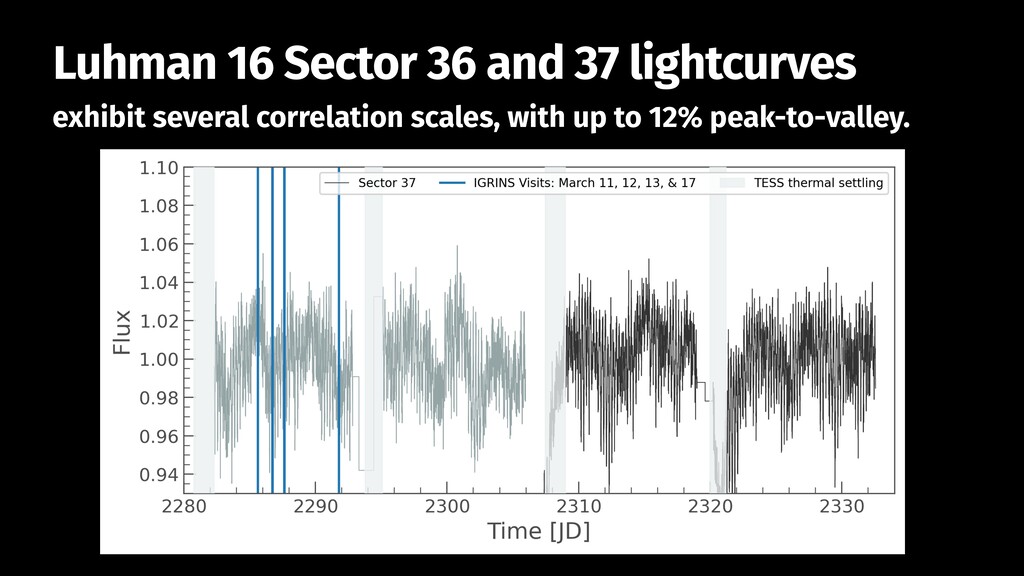
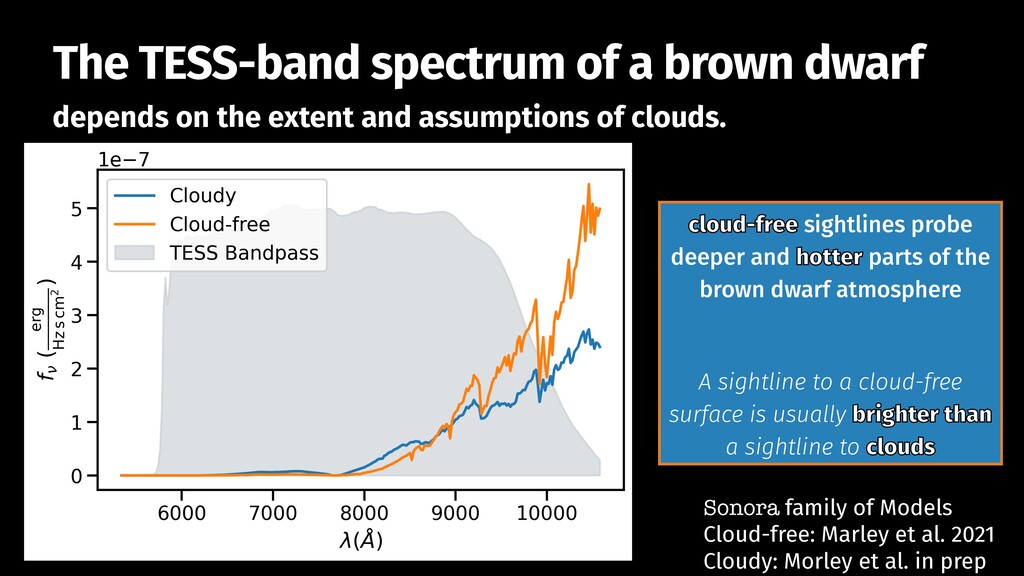
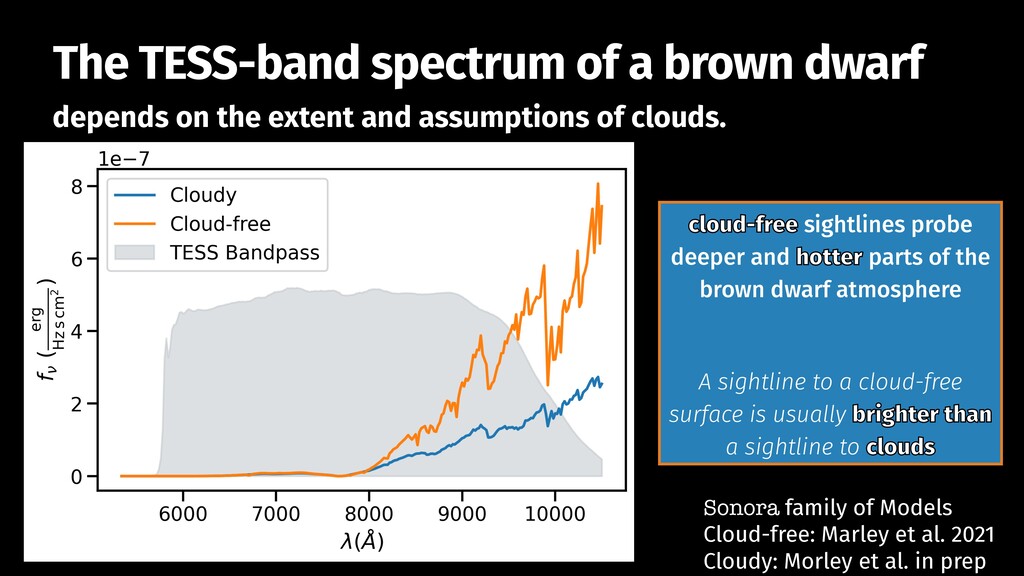
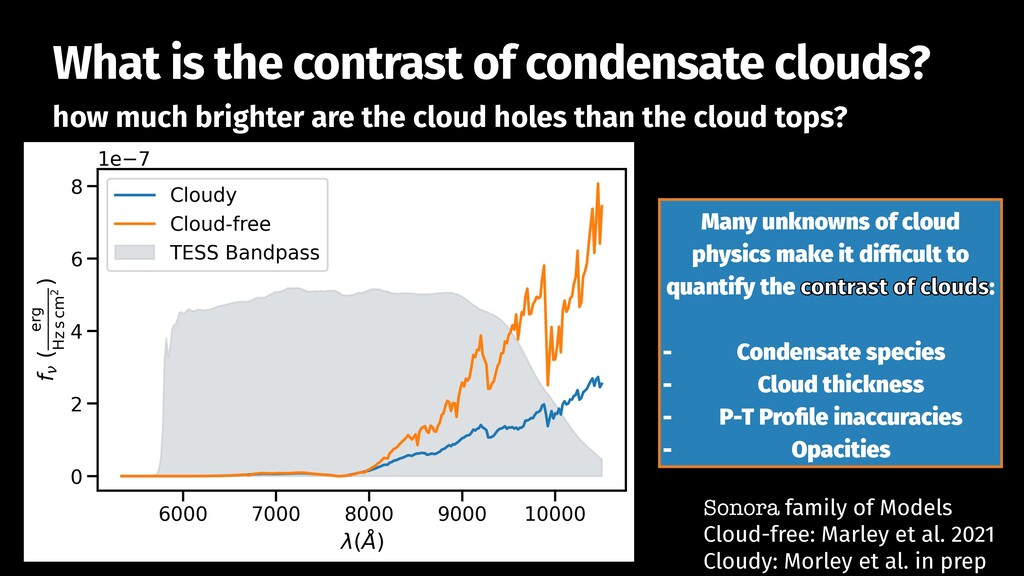
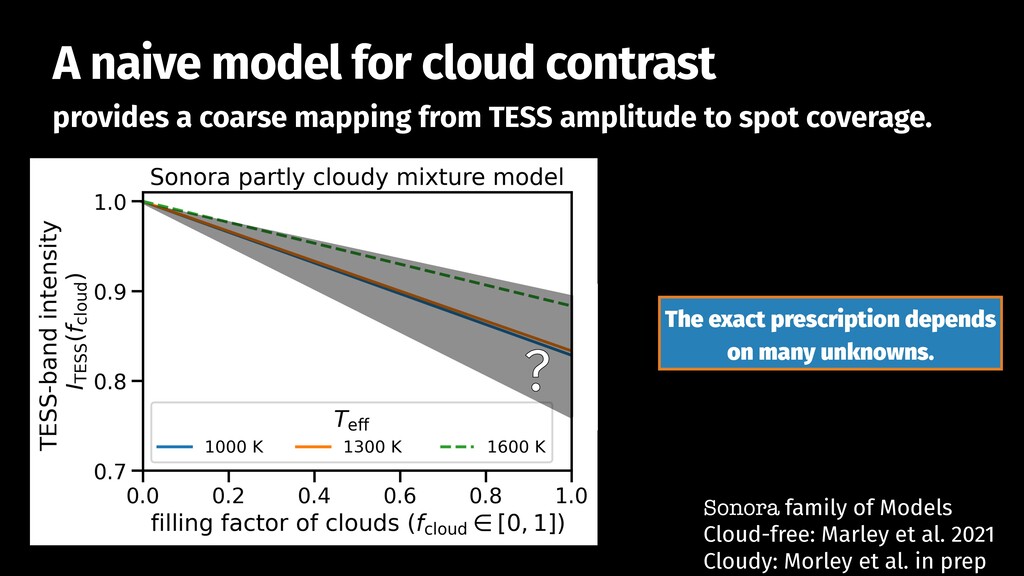
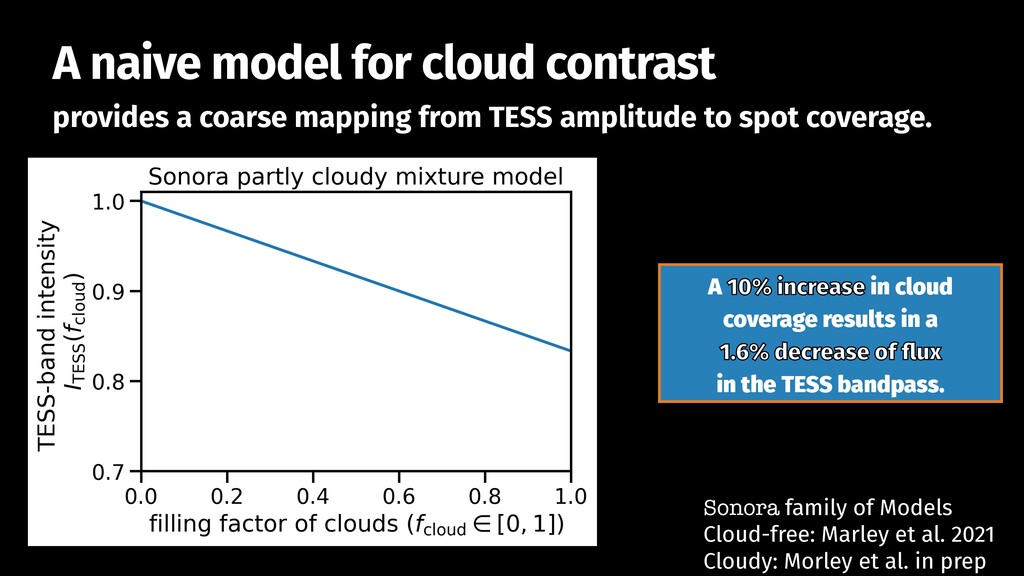
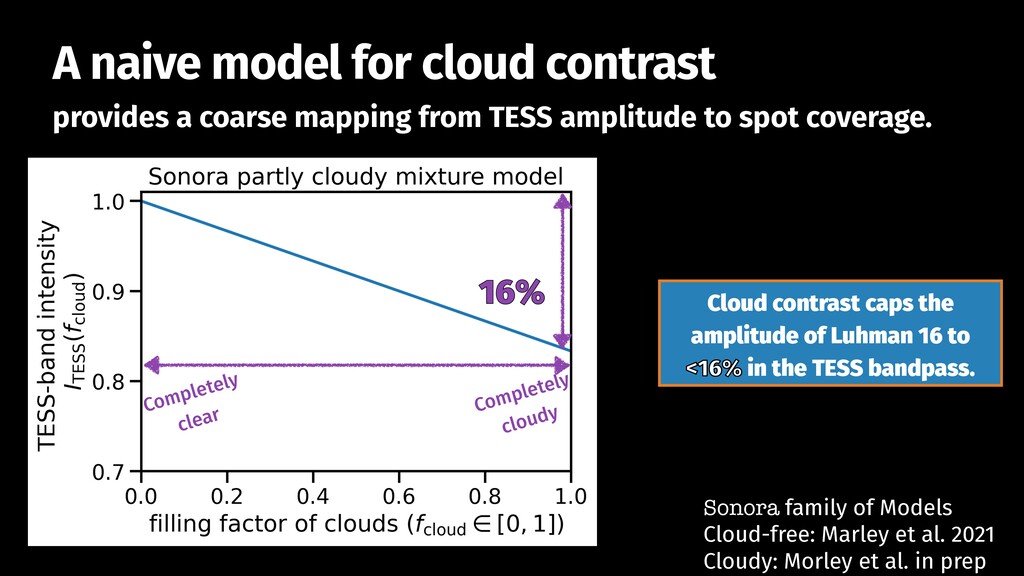
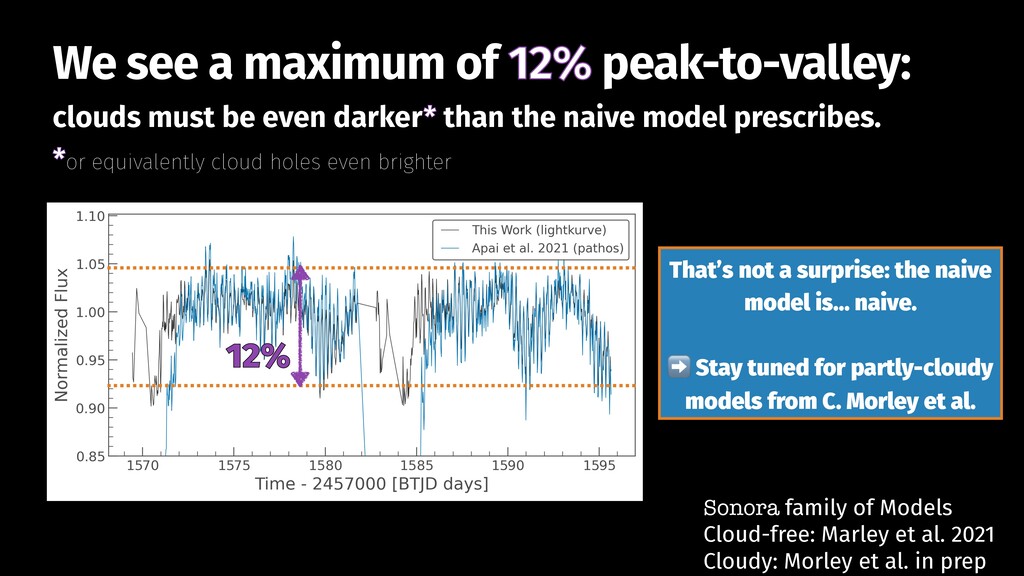
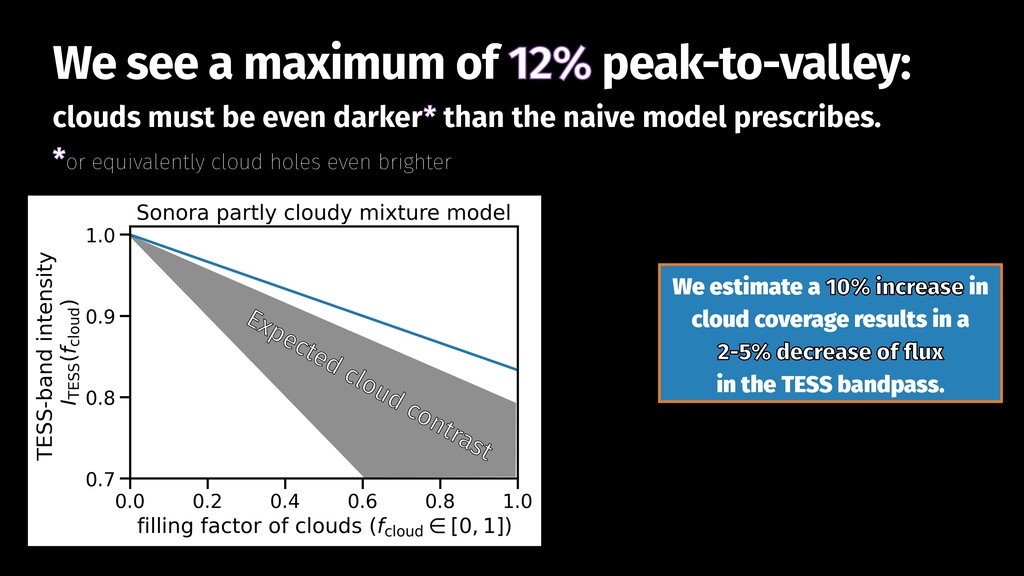
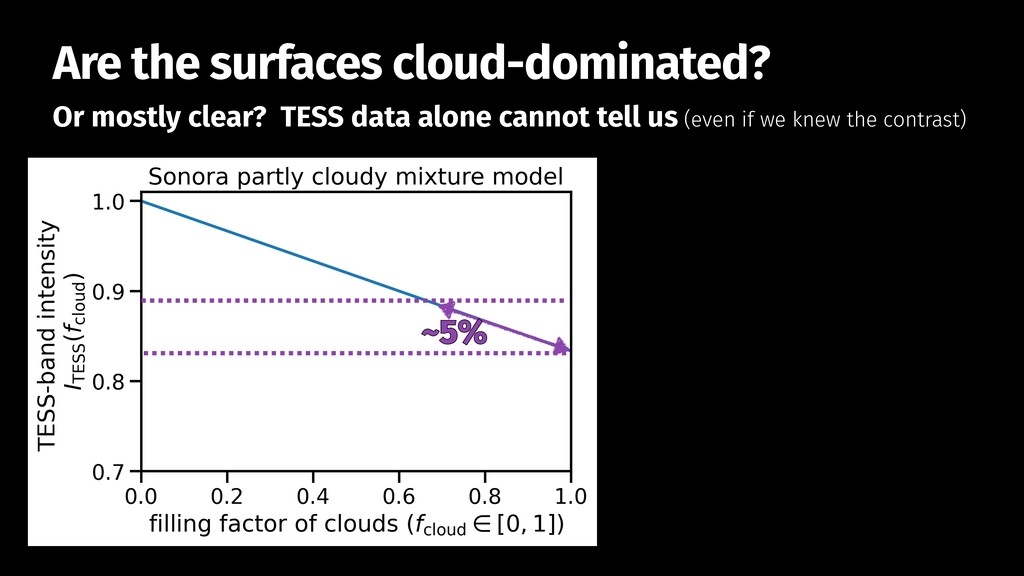
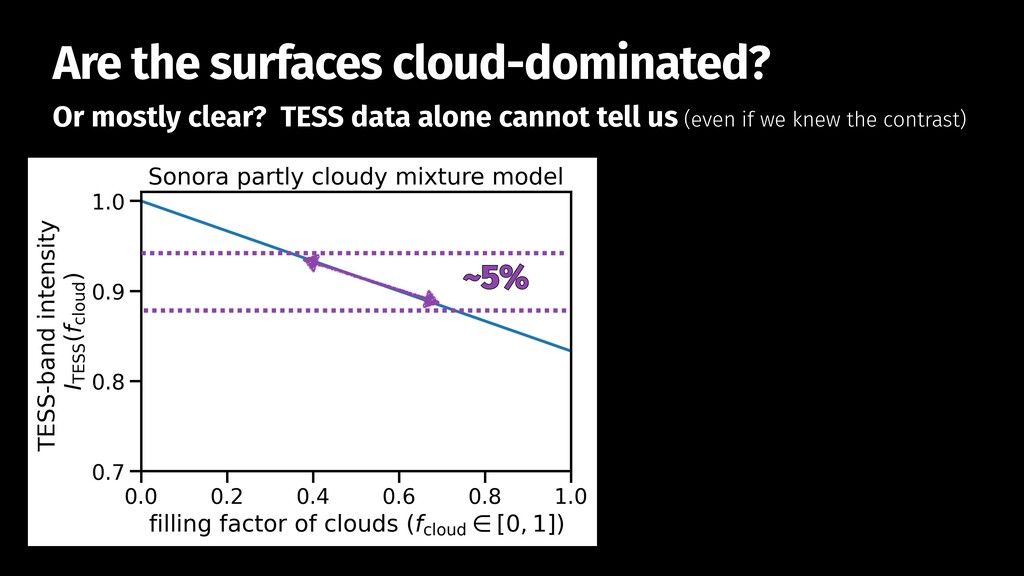
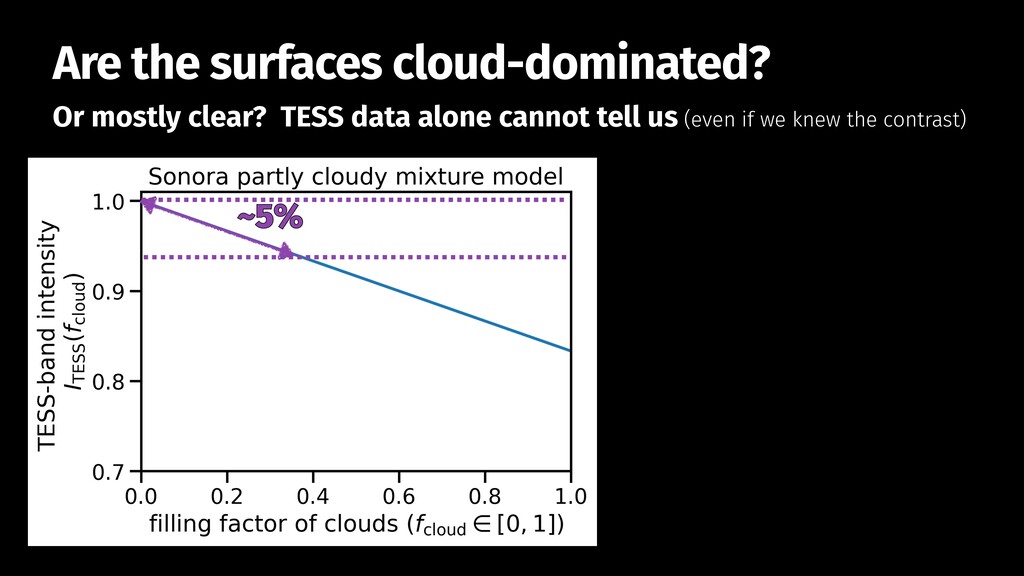
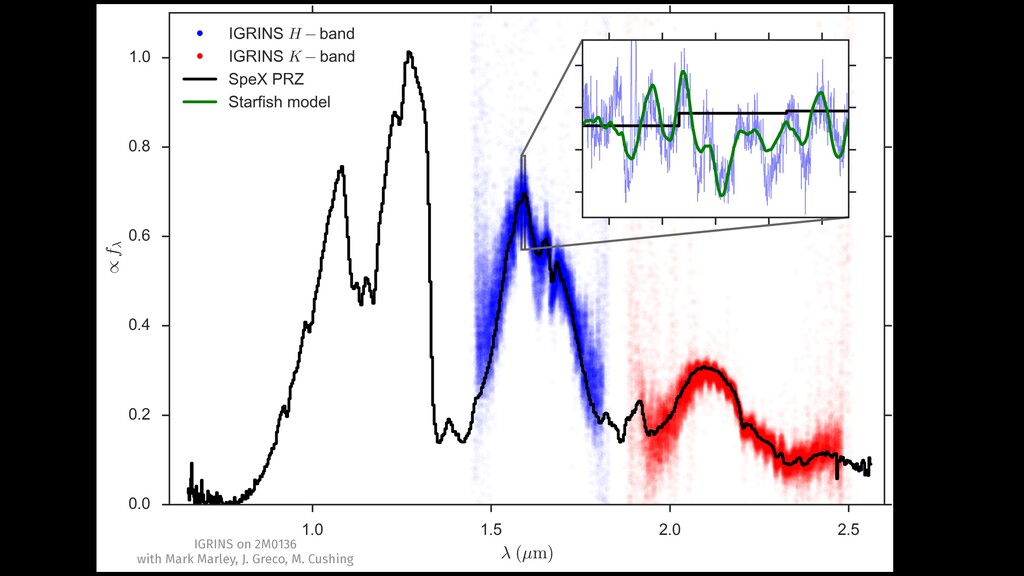
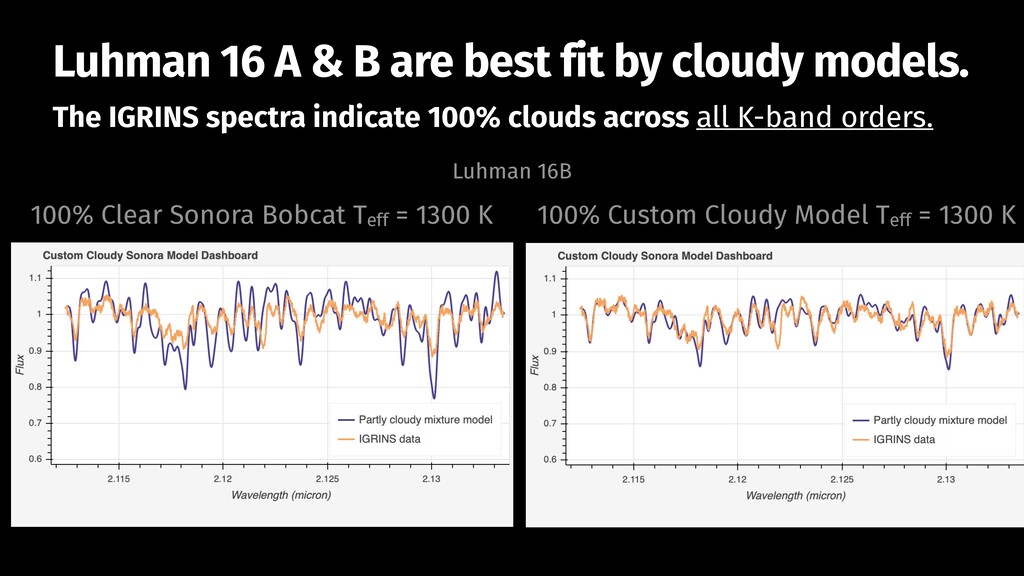
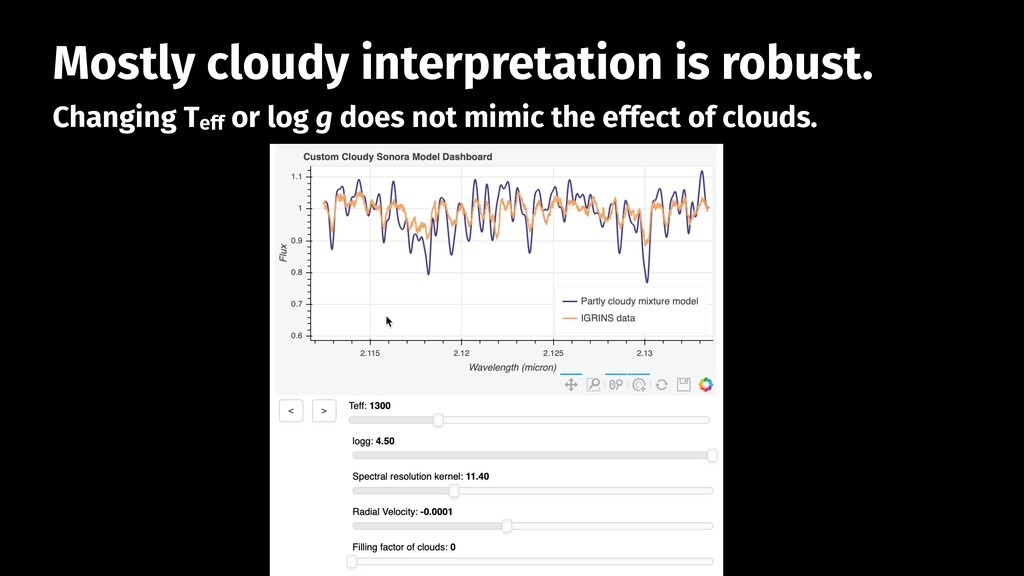
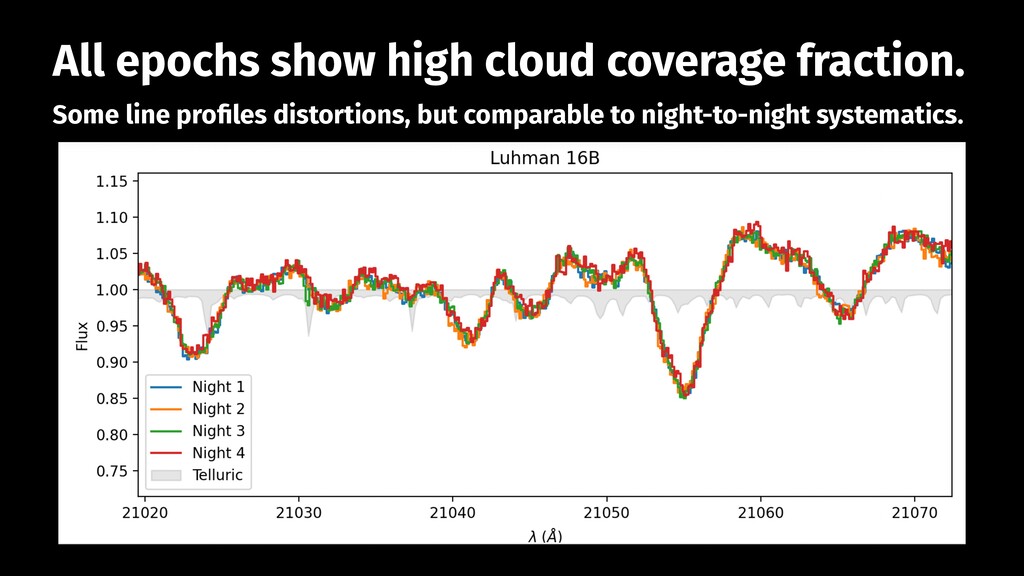
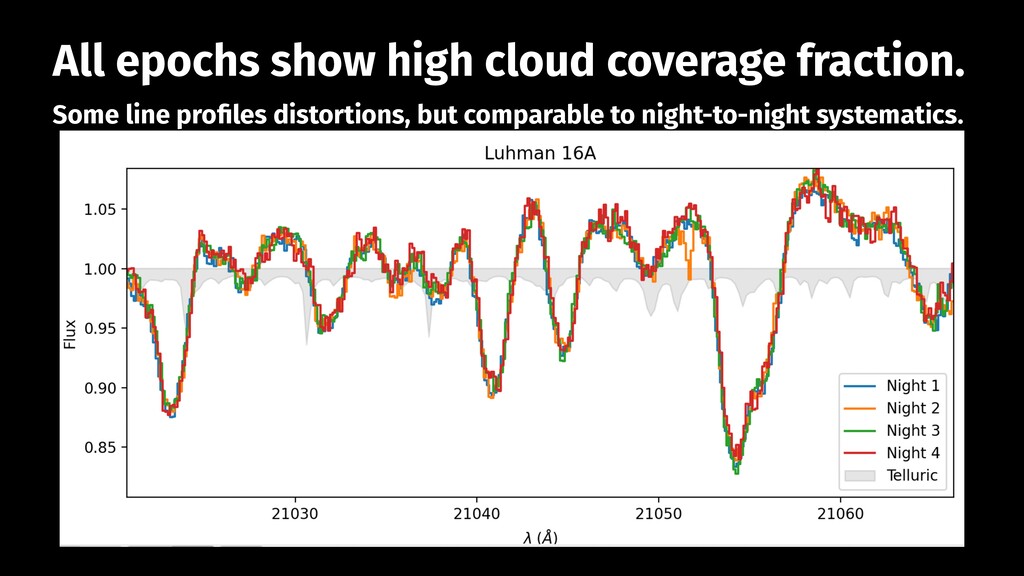
Condensate clouds should pervade the atmospheres of brown dwarfs and exoplanets, dictating the energy balance of these substellar objects and controlling their photometric and spectroscopic properties. Yet physical understanding of these clouds has largely been limited to coarse phenomenology: clouds are difficult to model and even more difficult to observe, owing to the absence of prominent spectral features and the intrinsic low luminosity of ultracool LT dwarfs. Here we present high resolution near-IR echelle spectra from IGRINS taken contemporaneously with TESS Sector 36 to quantify brown dwarf cloud modulation of Luhman 16AB, an exemplar L-T transition binary residing 2 pc from the Sun. The Sector 10, 36, and 37 lightcurves show conspicuous 10% peak-to-valley modulations arising from longitudinal asymmetries of cloud coverage, with rich harmonics suggestive of surface structures. The four epochs of IGRINS spectra sample both high and low states of cloud coverage of the B component, exhibiting wide agreement with custom cloudy synthetic grid models. We animate conceivable dynamic surface structures consistent with these two precision datasets.

gully

August 03, 2021
Tweet

More Decks by gully

Other Decks in Science

Transcript

  1. Condensate cloud modulation seen in multi-epoch IGRINS and TESS monitoring

    of ultracool dwarfs Michael Gully-Santiago The University of Texas at Austin Department of Astronomy Collaborators: Caroline Morley, Will Best, Yifan Zhou, Brendan Bowler August 3, 2021 TESS Science Conference
  2. Luhman 16 AB: an L7.5 / T0.5 at 2 pc

    provides a unique laboratory for studying cloud physics • Doppler Imaging from CRIRES (Cross fi eld et al. 2014)
  3. Luhman 16 AB: an L7.5 / T0.5 at 2 pc

    provides a unique laboratory for studying cloud physics • Doppler Imaging from CRIRES (Cross fi eld et al. 2014) • Observed in TESS Sector 10 (Apai et al. 2021)
  4. Luhman 16 AB: an L7.5 / T0.5 at 2 pc

    provides a unique laboratory for studying cloud physics • Doppler Imaging from CRIRES (Cross fi eld et al. 2014) • Observed in TESS Sector 10 (Apai et al. 2021) • Revisited in Sector 36 and 37 in March/April 2021 • Amenable to high precision, high resolution spectroscopic time series
  5. HST-based orbit: In March 2021: Sep = 1.3” PA =

    134° Luhman 16 AB occupies << 1 TESS pixel Lazorenko & Sahlmann 2018 Foreman-Mackey et al. 2021 docs.exoplanet.codes A B
  6. Luhman 16 AB occupies << 1 TESS pixel HST-based orbit:

    In March 2021: Sep = 1.3” PA = 134° IGRINS 2021 Slit Viewing Camera HST 2015-2018 A B
  7. made with lightkurve— replication of Sector 10. ✅ Luhman 16

    Sector 36 and 37 lightcurves Barentsen et al. docs.lightkurve.org
  8. depends on the extent and assumptions of clouds. The TESS-band

    spectrum of a brown dwarf cloud-free sightlines probe deeper and hotter parts of the brown dwarf atmosphere A sightline to a cloud-free surface is usually brighter than a sightline to clouds Sonora family of Models Cloud-free: Marley et al. 2021 Cloudy: Morley et al. in prep
  9. depends on the extent and assumptions of clouds. The TESS-band

    spectrum of a brown dwarf cloud-free sightlines probe deeper and hotter parts of the brown dwarf atmosphere A sightline to a cloud-free surface is usually brighter than a sightline to clouds Sonora family of Models Cloud-free: Marley et al. 2021 Cloudy: Morley et al. in prep
  10. Many unknowns of cloud physics make it dif fi cult

    to quantify the contrast of clouds: - Condensate species - Cloud thickness - P-T Pro fi le inaccuracies - Opacities Sonora family of Models Cloud-free: Marley et al. 2021 Cloudy: Morley et al. in prep how much brighter are the cloud holes than the cloud tops? What is the contrast of condensate clouds?
  11. provides a coarse mapping from TESS amplitude to spot coverage.

    A naive* model for cloud contrast where f is the coverage fraction of clouds S is the emergent spectrum of cloudy or clear patches *The model is “naive” because it employs self-consistent Sonora models that have converged separately, with e.g. different P-T pro fi les. Snet = f ⋅ Scloudy + (1 − f) ⋅ Sclear
  12. Sonora family of Models Cloud-free: Marley et al. 2021 Cloudy:

    Morley et al. in prep provides a coarse mapping from TESS amplitude to spot coverage. A naive model for cloud contrast The exact prescription depends on many unknowns. ?
  13. A 10% increase in cloud coverage results in a 1.6%

    decrease of fl ux in the TESS bandpass. Sonora family of Models Cloud-free: Marley et al. 2021 Cloudy: Morley et al. in prep provides a coarse mapping from TESS amplitude to spot coverage. A naive model for cloud contrast
  14. Sonora family of Models Cloud-free: Marley et al. 2021 Cloudy:

    Morley et al. in prep provides a coarse mapping from TESS amplitude to spot coverage. A naive model for cloud contrast Cloud contrast caps the amplitude of Luhman 16 to <16% in the TESS bandpass. Completely cloudy Completely clear 16%
  15. Sonora family of Models Cloud-free: Marley et al. 2021 Cloudy:

    Morley et al. in prep provides a coarse mapping from TESS amplitude to spot coverage. A naive model for cloud contrast Plausible geometrical considerations prefer TESS- band amplitudes <5%. ~5%
  16. Sonora family of Models Cloud-free: Marley et al. 2021 Cloudy:

    Morley et al. in prep clouds must be even darker* than the naive model prescribes. *or equivalently cloud holes even brighter We see a maximum of 12% peak-to-valley: That’s not a surprise: the naive model is… naive. ➡ Stay tuned for partly-cloudy models from C. Morley et al. 12%
  17. clouds must be even darker* than the naive model prescribes.

    *or equivalently cloud holes even brighter We see a maximum of 12% peak-to-valley: We estimate a 10% increase in cloud coverage results in a 2-5% decrease of fl ux in the TESS bandpass. Expected cloud contrast
  18. Or mostly clear? TESS data alone cannot tell us (even

    if we knew the contrast) Are the surfaces cloud-dominated? ~5%
  19. ~5% Or mostly clear? TESS data alone cannot tell us

    (even if we knew the contrast) Are the surfaces cloud-dominated?
  20. ~5% Or mostly clear? TESS data alone cannot tell us

    (even if we knew the contrast) Are the surfaces cloud-dominated?
  21. All of H- and K- bands at R=45,000 IGRINS at

    Gemini South • Seeing-limited slit 0.34ʺ x 5ʺ • Custom Silicon Immersion Grating • High bandwidth and resolution Gully-Santiago et al. 2012, Park et al. 2014, Mace et al. 2018
  22. IGRINS on 2M0136 with Mark Marley, J. Greco, M. Cushing

    The challenge: How to interpret complex substellar IGRINS spectra while leveraging the large spectral grasp?
  23. star fi sh Two tools for forward modeling IGRINS data

    Czekala et al. 2015, Gully-Santiago et al. 2017, ZJ Zhang et al. 2021 🆕 gollum https://youtu.be/ME7kSjPe7mM github.com/Star fi sh-develop/Star fi sh github.com/BrownDwarf/gollum gollum-astro.readthedocs.io pip install gollum
  24. 🆕 gollum github.com/BrownDwarf/gollum gollum-astro.readthedocs.io pip install gollum • Interactive dashboards

    with human-in-the-loop design • Inspired by lightkurve’s interact, built with bokeh and specutils • Great for students and intuition- building • Currently support Sonora and PHOENIX synthetic spectra
  25. Four visits of Luhman 16 A&B during Sector 36 The

    visits probe snapshots at different surface morphologies. Gemini South DDT Program: GS-2021A-DD-104
  26. The IGRINS spectra indicate 100% clouds across all K-band orders.

    Luhman 16 A & B are best fit by cloudy models. 100% Clear Sonora Bobcat Teff = 1300 K 100% Custom Cloudy Model Teff = 1300 K Luhman 16B
  27. Changing Teff or log g does not mimic the effect

    of clouds. Mostly cloudy interpretation is robust.
  28. Some line pro fi les distortions, but comparable to night-to-night

    systematics. All epochs show high cloud coverage fraction.
  29. Some line pro fi les distortions, but comparable to night-to-night

    systematics. All epochs show high cloud coverage fraction.
  30. In practice, zonal bands require better models than we have

    available. Can we see zonal bands? Cross fi eld et al. 2014
  31. 🆕 blasé github.com/gully/blase blase.readthedocs.io • An experimental technique to clone

    pre-computed models to make them more fl exible • Should yield reasonably accurate noise-free templates https://youtu.be/gSIeg2drSTw
  32. Takeaways • We observed 4 epochs of IGRINS spectra contemporaneous

    with TESS S36 • The 12% amplitude of TESS-band suggests high-contrast clouds 0.83 - 1 um • The IGRINS spectra are consistent with a high coverage fraction of clouds • Spectral variability is comparable to the small visit-to-visit systematics, indicating a high persistent cloud coverage fraction.