• “Most versatile analytics tool” • Working with data just feels natural, data is “tangible” • Almost anything I might want to do with my data feels quickly well within reach • Thanks in large part to design of R for interactive analysis and a lot of packages and vis tools FLEXIBILITY However, when it comes to “big data”, we can easily lose this flexibility
on other systems / engineers to process / aggregate the data for us • We can rely on other systems to apply algorithms to the data while we analyze the small results in R • We can analyze it in RAM • We can analyze just a subset of the data While these are often true, they are often not, and if we concede to any of these, we lose a lot of flexibility that is absolutely necessary for a lot of problems
/ aggregate the data for us” • Analyzing summaries is better than not doing anything at all • But computing summaries without understanding what information is preserved or lost in the process goes against all statistical sense • If the first thing you do is summarize without any investigation of the full data, what’s the point of having collected the finer-granularity data in the first place? NOT FLEXIBLE
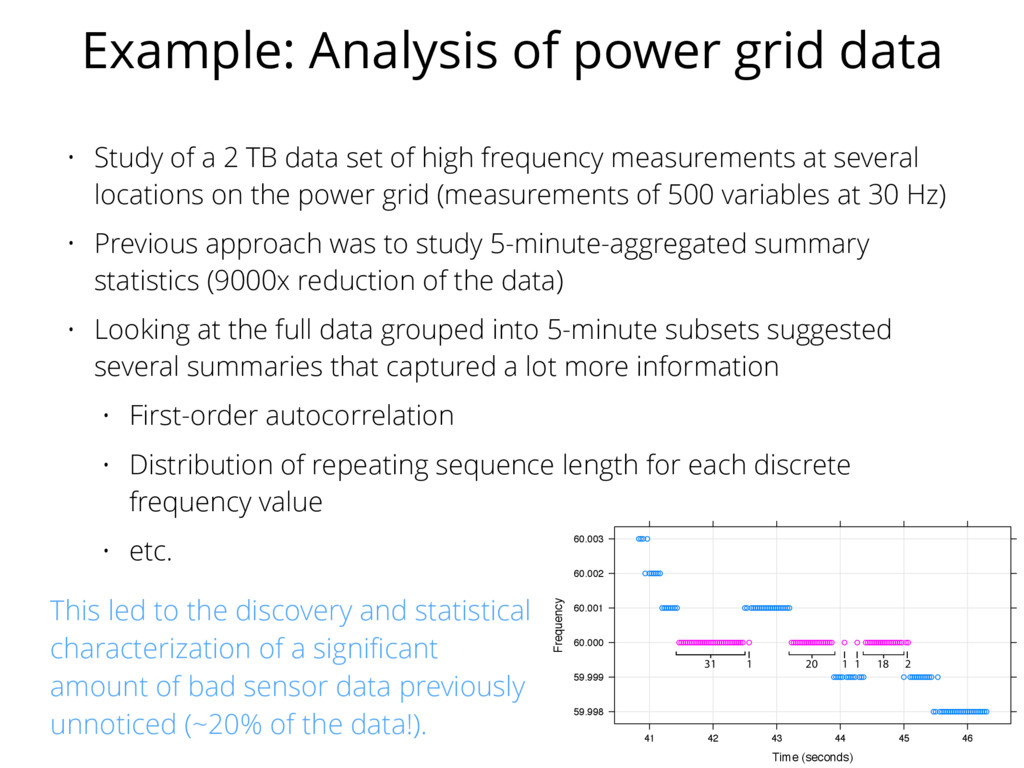
42 43 44 45 46 31 1 20 1 1 18 2 Example: Analysis of power grid data • Study of a 2 TB data set of high frequency measurements at several locations on the power grid (measurements of 500 variables at 30 Hz) • Previous approach was to study 5-minute-aggregated summary statistics (9000x reduction of the data) • Looking at the full data grouped into 5-minute subsets suggested several summaries that captured a lot more information • First-order autocorrelation • Distribution of repeating sequence length for each discrete frequency value • etc. This led to the discovery and statistical characterization of a significant amount of bad sensor data previously unnoticed (~20% of the data!).
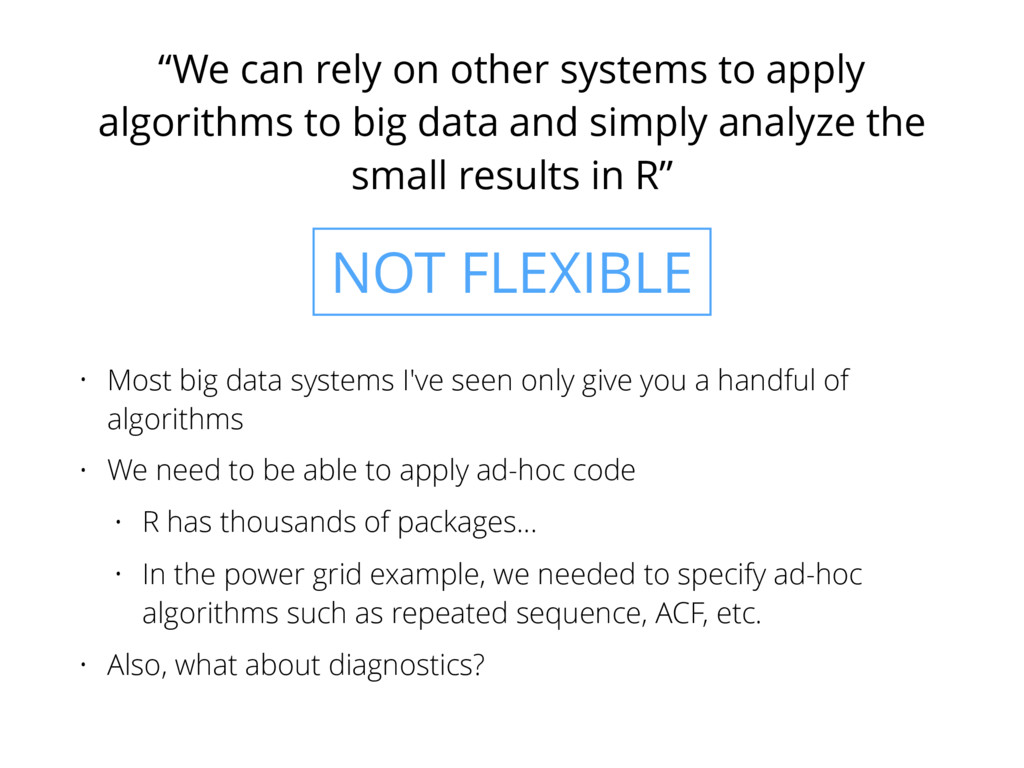
big data and simply analyze the small results in R” • Most big data systems I've seen only give you a handful of algorithms • We need to be able to apply ad-hoc code • R has thousands of packages… • In the power grid example, we needed to specify ad-hoc algorithms such as repeated sequence, ACF, etc. • Also, what about diagnostics? NOT FLEXIBLE
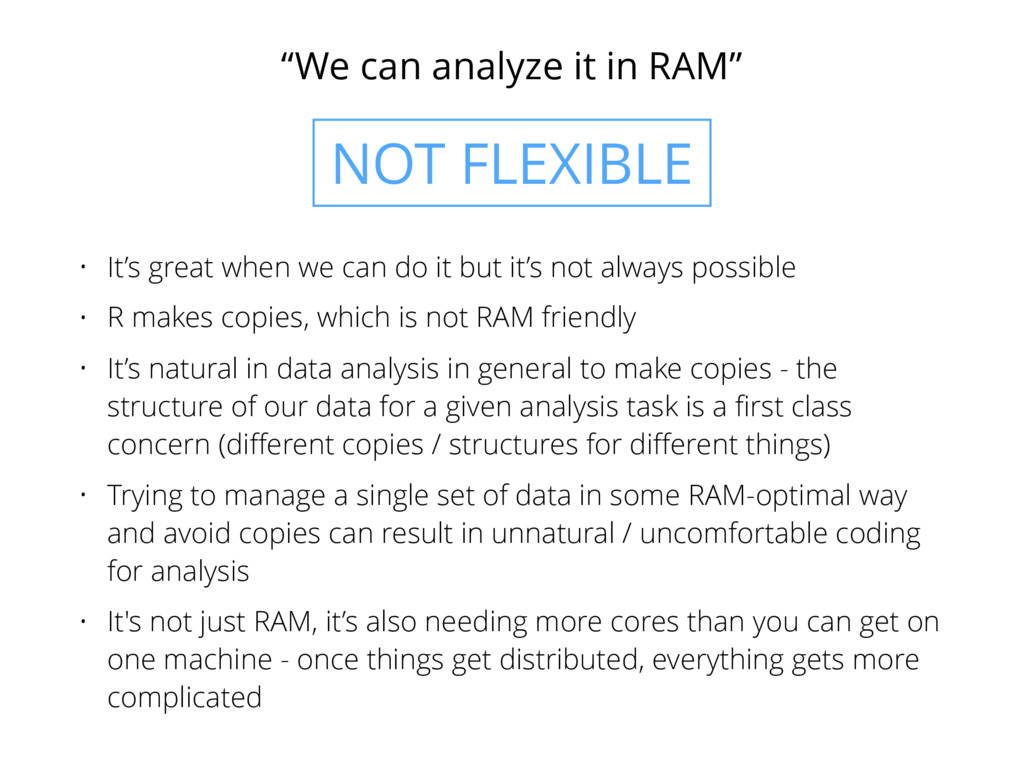
we can do it but it’s not always possible • R makes copies, which is not RAM friendly • It’s natural in data analysis in general to make copies - the structure of our data for a given analysis task is a first class concern (different copies / structures for different things) • Trying to manage a single set of data in some RAM-optimal way and avoid copies can result in unnatural / uncomfortable coding for analysis • It's not just RAM, it’s also needing more cores than you can get on one machine - once things get distributed, everything gets more complicated NOT FLEXIBLE
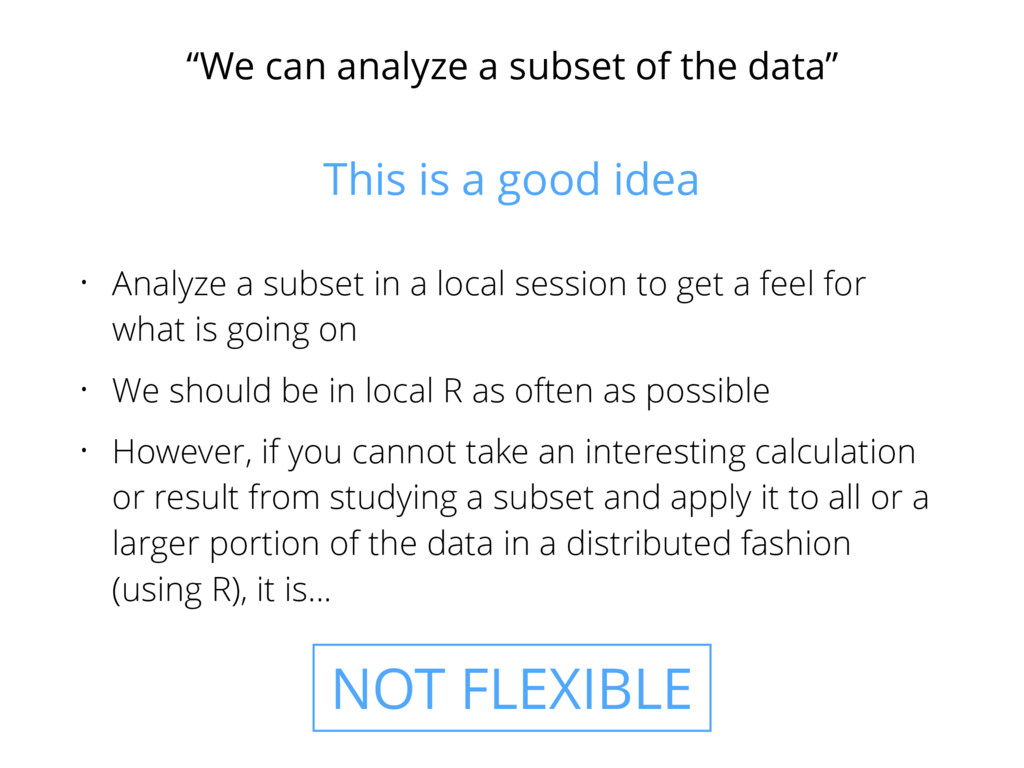
a subset in a local session to get a feel for what is going on • We should be in local R as often as possible • However, if you cannot take an interesting calculation or result from studying a subset and apply it to all or a larger portion of the data in a distributed fashion (using R), it is... NOT FLEXIBLE This is a good idea
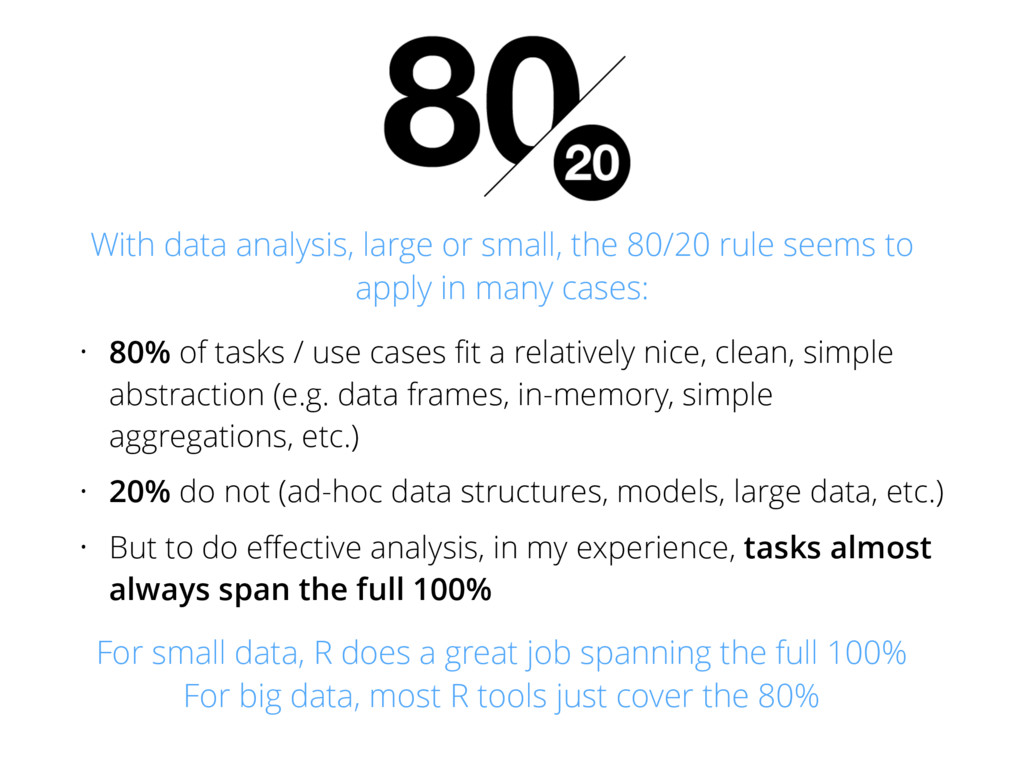
nice, clean, simple abstraction (e.g. data frames, in-memory, simple aggregations, etc.) • 20% do not (ad-hoc data structures, models, large data, etc.) • But to do effective analysis, in my experience, tasks almost always span the full 100% For small data, R does a great job spanning the full 100% For big data, most R tools just cover the 80% With data analysis, large or small, the 80/20 rule seems to apply in many cases:
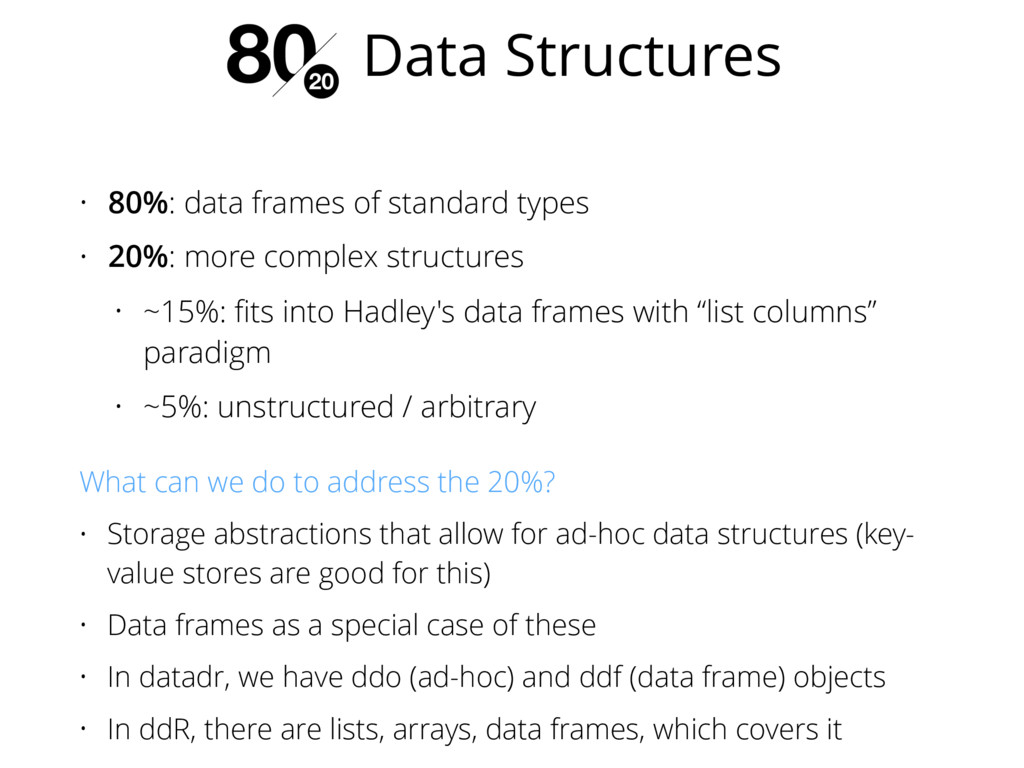
complex structures • ~15%: fits into Hadley's data frames with “list columns” paradigm • ~5%: unstructured / arbitrary Data Structures What can we do to address the 20%? • Storage abstractions that allow for ad-hoc data structures (key- value stores are good for this) • Data frames as a special case of these • In datadr, we have ddo (ad-hoc) and ddf (data frame) objects • In ddR, there are lists, arrays, data frames, which covers it
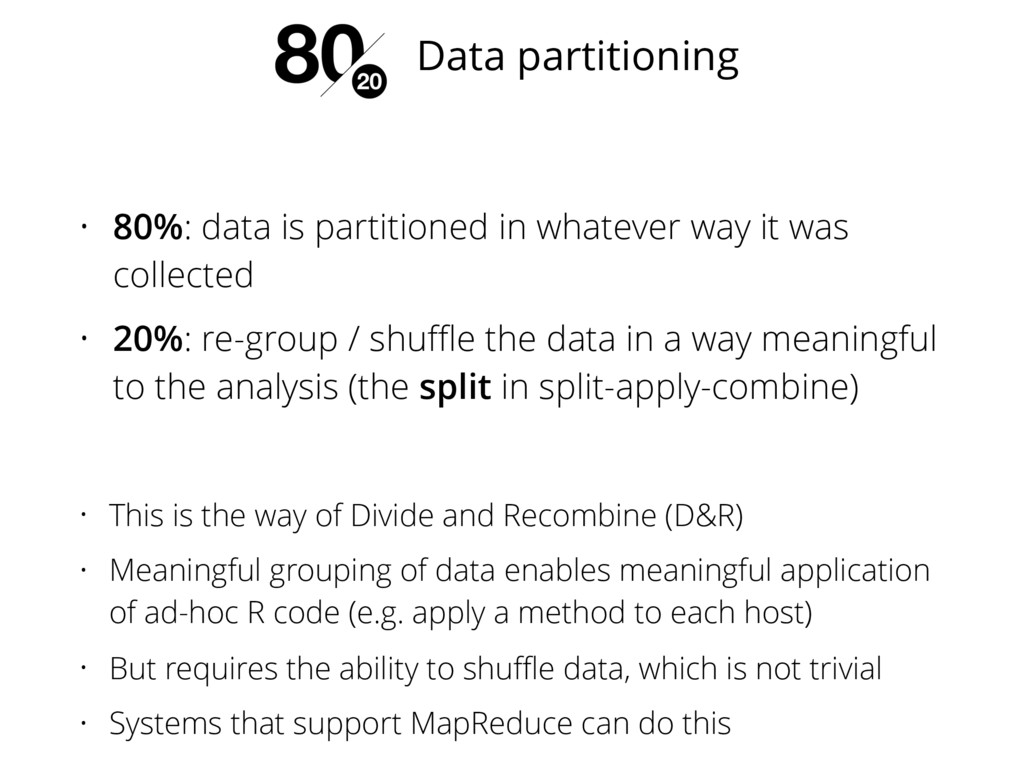
collected • 20%: re-group / shuffle the data in a way meaningful to the analysis (the split in split-apply-combine) Data partitioning • This is the way of Divide and Recombine (D&R) • Meaningful grouping of data enables meaningful application of ad-hoc R code (e.g. apply a method to each host) • But requires the ability to shuffle data, which is not trivial • Systems that support MapReduce can do this
ML methods • 20%: any ad-hoc R code / scalable vis Flexibility of Methods What can we do to address the 20%? • We need to be able to run R processes on the nodes of a cluster against each chunk of the data • Usually this makes most sense when the chunking is intentional (hence the importance of being able to repartition the data)
group distributed data is critical for scalable statistical visualization • Trelliscope is a scalable framework for detailed visualization that provides a way to meaningfully navigate faceted plots applied to each subset of the data • Demo of prototype pure JS, client-side Trelliscope viewer: http://hafen.github.io/trelliscopejs-demo/
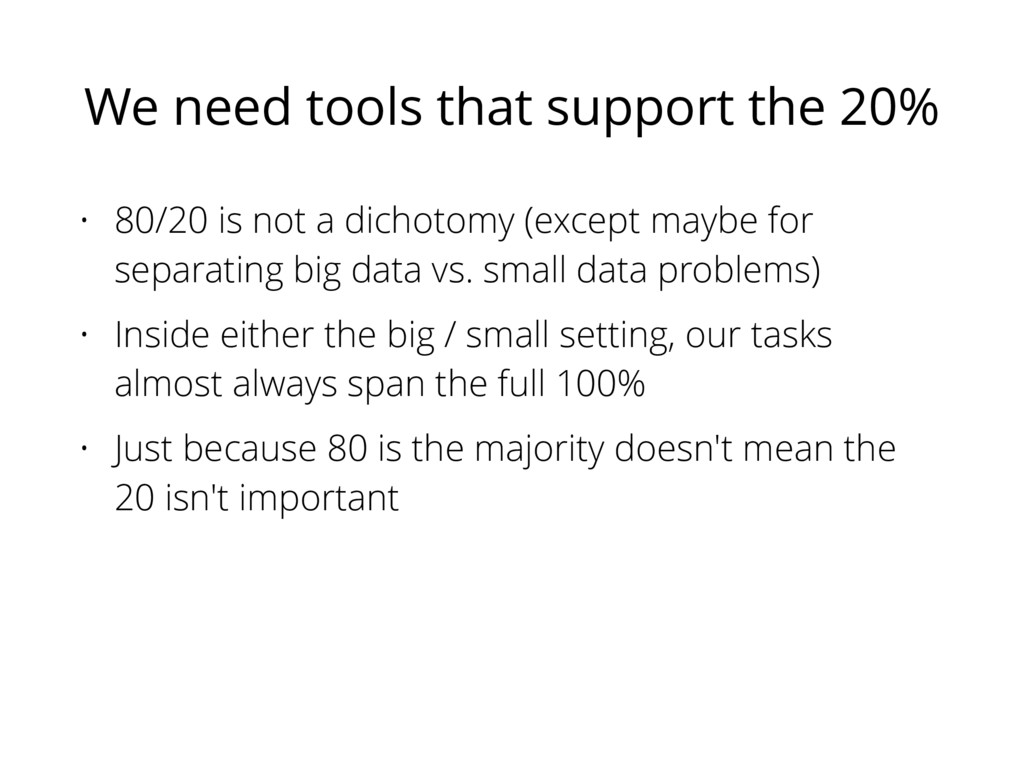
not a dichotomy (except maybe for separating big data vs. small data problems) • Inside either the big / small setting, our tasks almost always span the full 100% • Just because 80 is the majority doesn't mean the 20 isn't important
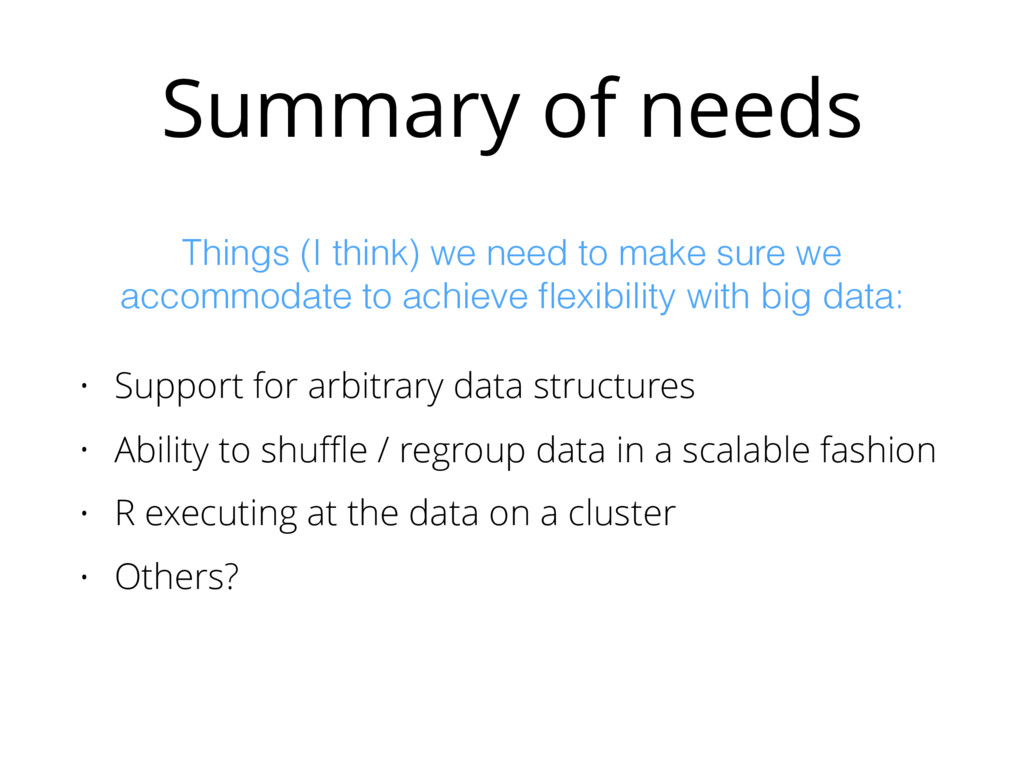
Ability to shuffle / regroup data in a scalable fashion • R executing at the data on a cluster • Others? Things (I think) we need to make sure we accommodate to achieve flexibility with big data:
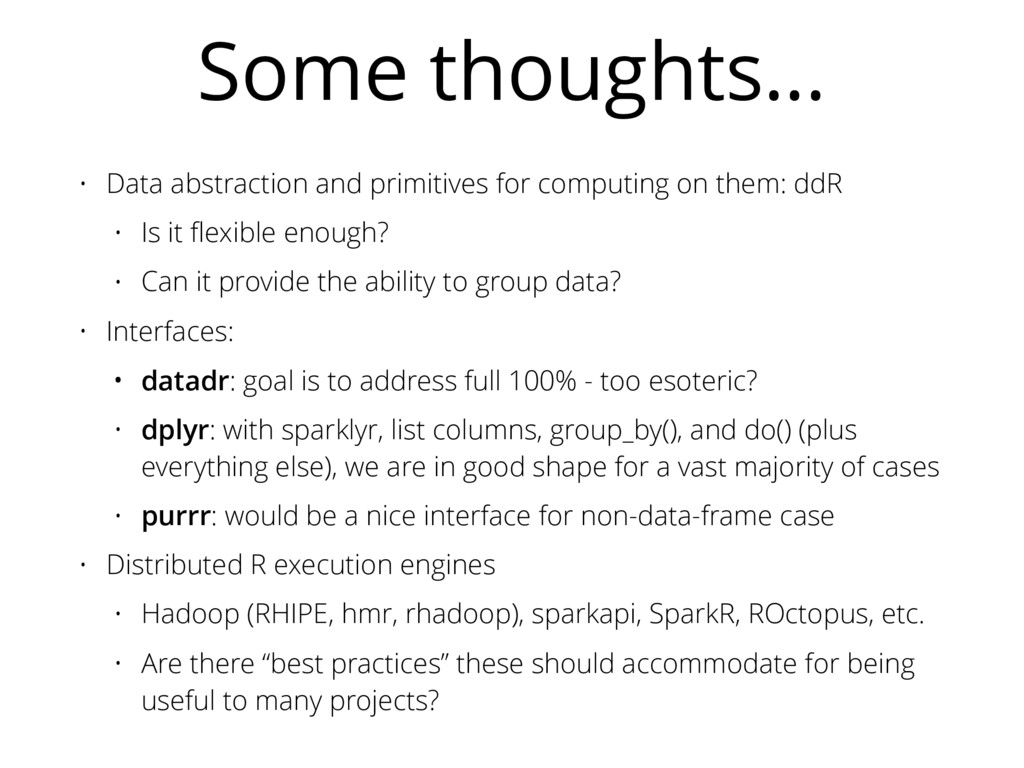
them: ddR • Is it flexible enough? • Can it provide the ability to group data? • Interfaces: • datadr: goal is to address full 100% - too esoteric? • dplyr: with sparklyr, list columns, group_by(), and do() (plus everything else), we are in good shape for a vast majority of cases • purrr: would be a nice interface for non-data-frame case • Distributed R execution engines • Hadoop (RHIPE, hmr, rhadoop), sparkapi, SparkR, ROctopus, etc. • Are there “best practices” these should accommodate for being useful to many projects?
existing 80% solutions to provide capabilities that help address the 20% cases? • Can we build a consensus on basic functionality that will support flexibility for multiple projects?