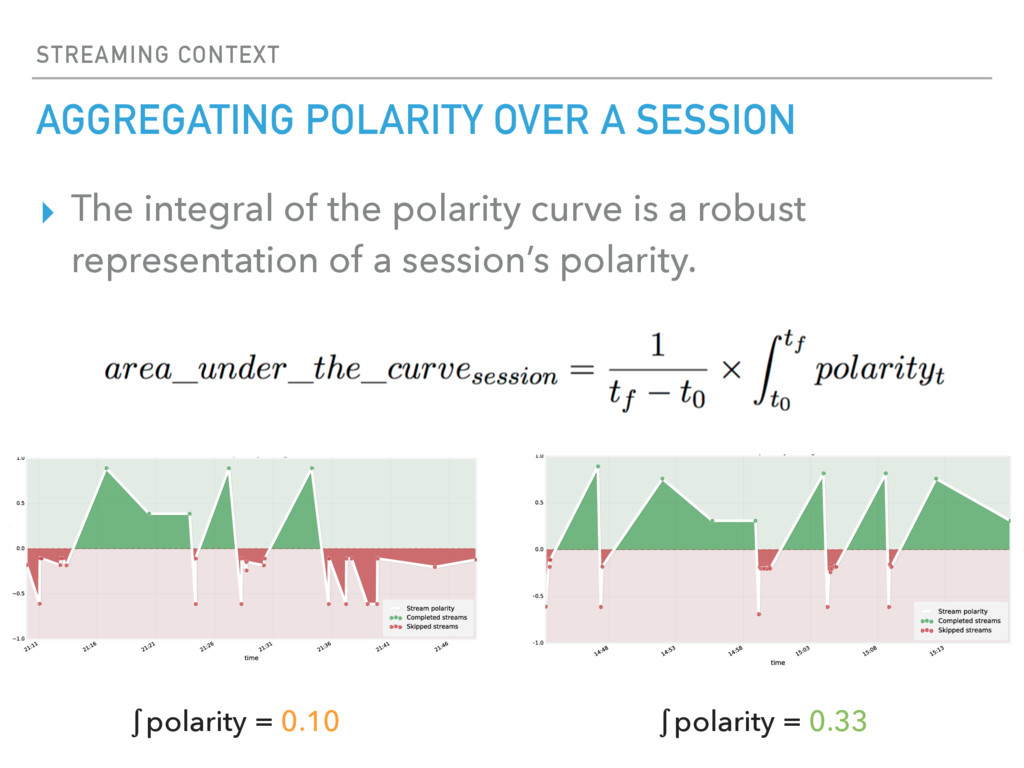
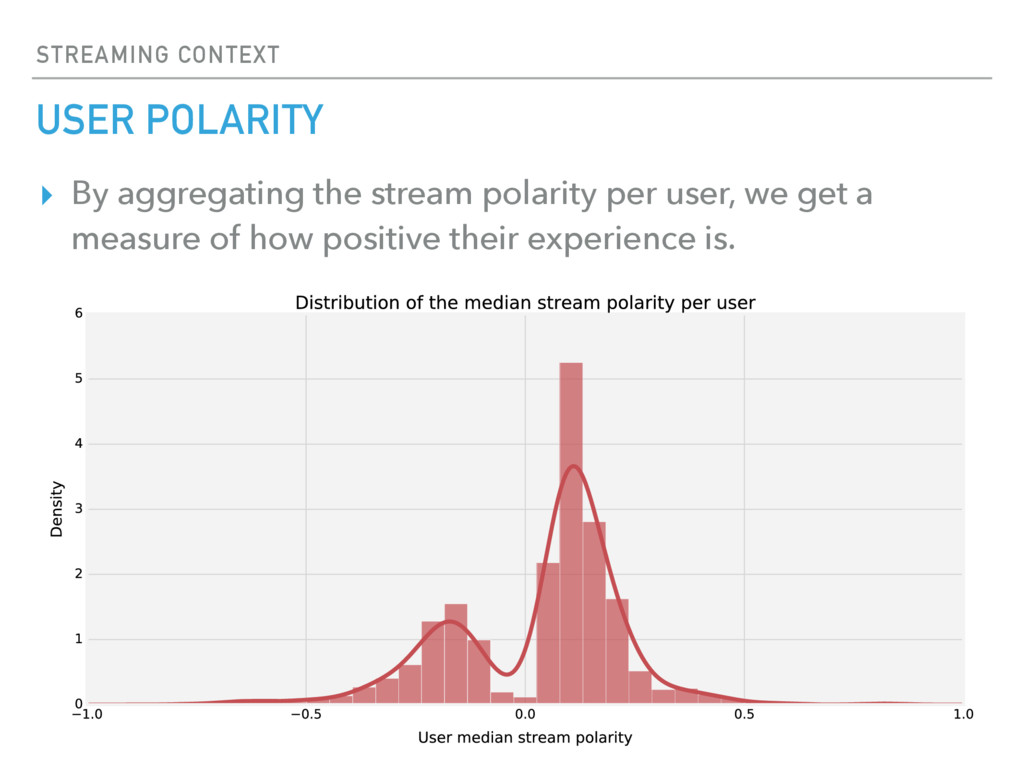
Upgrade to Pro — share decks privately, control downloads, hide ads and more …

Analyzing user behavior and sentiment in music streaming services

Analyzing user behavior and sentiment in music streaming services

Ahmed Kachkach

April 18, 2016
Tweet

More Decks by Ahmed Kachkach

Other Decks in Research

Transcript

  1. SUMMARY I. Introduction II. Background III. Data and methods IV.

    Results: I. Streaming context II. User attention III. Sequential analysis V. Conclusions & Future Work
  2. INTRODUCTION MOTIVATION ▸ Understanding users and inferring their taste and

    preferences is vital for streaming services. ▸ These services collect large amounts of data from diverse interactions with their users, but it is rarely fully exploited. ▸ Traditional aggregated metrics are sensitive to noise and some types of user behavior. A more granular approach is necessary.
  3. INTRODUCTION CONTRIBUTIONS ▸ Concepts allowing a better and more granular

    analysis of streaming services’ data. ▸ A series of models for these concepts. ▸ Several practical applications for these models to infer users’ preferences and sentiment, and improve their experience on the service.
  4. BACKGROUND STREAMING AND THE MUSIC INDUSTRY ▸ After a slow

    switch from physical sales to digital downloads, the music industry is now shifting from downloads to streaming. Source: RIAA 2015 year-end memo $Millions $0 $750 $1500 $2250 $3000 2013 2014 2015 Streaming Downloads
  5. BACKGROUND SPOTIFY ▸ Spotify is the leading music streaming service.

    ▸ Now facing new challenges with Apple and Google entering the music streaming market. Source: Spotify Explained
  6. BACKGROUND SPOTIFY AND RECOMMENDATIONS ▸ Customization is a core component

    of any streaming service: it’s vital to provide personal recommendations to retain users and convert free users to paying customers.
  7. BACKGROUND EXPLICIT FEEDBACK ▸ Explicit feedback is obtained by asking

    users to give ratings on items. As such, it is intrusive and biased. ▸ Many streaming companies, such as Netflix, have moved away from explicit feedback and found better results in implicit feedback.
  8. BACKGROUND IMPLICIT FEEDBACK ▸ A user/item rating is inferred from

    the users’ consumption history. ▸ Many challenges: noisy feedback, no negative feedback, preference vs confidence. score(user, rick_astley) = 1.0 score(user, stati) = 0.0 score(user, kanye_west) = 0.2
  9. BACKGROUND EXAMPLE: MATRIX FACTORIZATION ▸ By factorizing the user/item matrix,

    we build a vectorial representation of users and items and efficiently generate accurate recommendations. item1 item2 item3 item4 user1 5 2 0 4 user2 5 4 0 0 user3 2 0 4 0 user4 2 5 4 0 → 2.4 → 0.6 new-user 5 ? ? 4
  10. BACKGROUND BUSINESS METRICS ▸ Robust metrics are vital for product

    development and quality insurance. ▸ Simple business metrics like clickthrough, session length and skipping ratio: ✘ Sensitive to noise and some user behavior common in streaming services.
  11. DATA AND METHODS ENDSONGS ▸ Our main dataset is EndSongs,

    a dataset containing one row for every song streamed by a user. ▸ After pre-processing and cleaning the data, the result is ~685 000 rows with 39 columns. user_id track_id reason_end ms_played … stream1 1 12 clickrow 45310 … stream2 1 41 fwdbtn 1202 … stream3 2 12 trackdone 245805 … stream4 3 85 trackdone 221580 …
  12. DATA AND METHODS SAMPLING ▸ Random sampling gives sparse data

    and is bias towards users that have more streams and seasonality effects. ▸ We extract all streams done by a subset of users during the month of November 2015. Number of streams per hour during November 2015
  13. METHODS METHODOLOGY ▸ We analyze and model three main facets

    of streaming services. ▸ These components can be used independently or combined for certain applications. User model 1. Streaming context 2. User attention 3. Sequential analysis
  14. STREAMING CONTEXT THE IMPORTANCE OF CONTEXT ▸ Knowing that a

    song was skipped or finished is not enough to infer the user’s preference towards that song ▸ The same action done in different contexts can have different interpretations. score(rick_astley) = 1.0 ! 0.3 score(stati) = 0.0 ! -0.2 score(kanye_west) = 1. ! 0.8 + + + +
  15. STREAMING CONTEXT EXAMPLE: EFFECT OF THE PLATFORM / PLAN TYPE

    ‣ The platform used has a significant effect on user behavior. ‣ When combined with the type of plan, this impact is even bigger.
  16. STREAMING CONTEXT EXAMPLE: EFFECT OF USER BIAS ‣ Different users

    have different needs and preferences. ‣ With other contextual parameters constant, there still is a large variance in user behavior.
  17. RESULTS BUILDING A CONTEXT MODEL ▸ We model the impact

    context has on a user’s skipping behavior, regardless of the content. ▸ This allows us to extract the user’s sentiment towards the content. Context Platform Feature Plan type Last action … Song skipped Content User biases
  18. STREAMING CONTEXT TRADITIONAL APPROACHES ▸ Cohorts are segments of users/datapoints

    where some variables are kept constant (platform, plan type, account age, …) ▸ Many drawbacks: reducing the size of exploitable data, ignoring feature interactions, choice of variable, scalability issues, … desktop=true premium=true group_ group_ group_c
  19. RESULTS A MACHINE LEARNING APPROACH ▸ We train a machine

    learning models on previously collected streams. ▸ Contextual variables are used as features, and the target is whether the song was skipped or not. Output: Input: Contextual features Song skipped ML Model Platform Feature Plan type Last action … User biases
  20. RESULTS EVALUATING DIFFERENT MODELS ▸ We evaluate a set of

    diverse models with cross-validation. ▸ Logistic Regression, Random Forest and Gradient Boosting Trees perform equally well.
  21. STREAMING CONTEXT STREAM POLARITY ▸ The intuition is: the more

    unexpected an event is, the more important it is. (similarly to log loss) ▸ We use a Logistic Regression model, for its interpretable estimated probability. P(skip | context) = 89%
 
 score(skip | context) = - 0.11
 score(!skip | context) = + 0.89 + +
  22. STREAMING CONTEXT STREAM POLARITY FLUCTUATION ▸ A user’s context can

    change during the same session. ▸ The polarity curve’s shape represents the user experience.
  23. STREAMING CONTEXT AGGREGATING POLARITY OVER A SESSION ▸ The integral

    of the polarity curve is a robust representation of a session’s polarity. ∫polarity = 0.10 ∫polarity = 0.33
  24. STREAMING CONTEXT USER POLARITY ▸ By aggregating the stream polarity

    per user, we get a measure of how positive their experience is.
  25. STREAMING CONTEXT APPLICATIONS FOR THE CONTEXT MODEL ▸ Product development:

    Used as a metric in A/B tests. ▸ Analytics: A more granular and robust metric to monitor user sentiment (across different countries, features and demographics) ▸ For recommendations, stream polarity can be used as an improved implicit feedback: ▸ Both positive and negative feedback. ▸ Less weight for predictable events.
  26. USER ATTENTION ”AN ATTENTION ECONOMY” ▸ Attention is a increasingly

    scarce resource, solicited by all devices, advertisement and entertainment. ▸ Streaming services can be used passively or actively. ▸ Monitoring the level of attention on these platforms is vital. Models for user attention must be built.
  27. USER ATTENTION PASSIVE & ACTIVE EVENTS ▸ We infer the

    user’s attention level through their actions. ▸ When the user actively interacts with the service, their attention level is renewed. ▸ Examples of active events: ▸ Skipping a song ▸ Seeking through a song ▸ …
  28. USER ATTENTION ATTENTION MODEL ▸ Self-excitatory point processes: every event

    increases the event arrival likelihood. ▸ A simpler approach only takes the last active event into account:
  29. USER ATTENTION INTERPRETATION OF THE ATTENTION LEVEL ▸ Streams closer

    to an active event are more likely to have the user’s attention.
  30. USER ATTENTION CHARACTERIZING SESSIONS ▸ A normalized integral of the

    attention level is an appropriate way to characterize a session. ∫attention = 0.83 ∫attention = 0.34
  31. USER ATTENTION APPLICATIONS OF THE ATTENTION MODEL ▸ Improving recommendations:

    weighting played songs by the attention level at playback. Is the user actually listening to these songs?
  32. USER ATTENTION APPLICATIONS OF THE ATTENTION MODEL ▸ Monitoring the

    differences in usage between platforms, features and users.
  33. SEQUENTIAL ANALYSIS & LATENT USER STATES PATTERNS IN USER ACTIONS

    ▸ Aggregated analyses metrics ignores the sequential nature of actions in a streaming service.
  34. SEQUENTIAL ANALYSIS & LATENT USER STATES MARKOV CHAIN ANALYSIS ▸

    The probability of performing an action heavily depends on the previously taken action.
  35. SEQUENTIAL ANALYSIS & LATENT USER STATES LATENT STATES AND HIDDEN

    MARKOV MODELS ▸ Users transition between a series of latent states where they are more or less likely to perform certain actions. Hidden State #1 Hidden State #2 … Skip a song Click
 on a song …
  36. SEQUENTIAL ANALYSIS & LATENT USER STATES APPLICATIONS AND LIMITATIONS ▸

    Transition probabilities can be used to classify users and sessions. ▸ Fraud detection, by detecting outliers in the transition probabilities. ▸ Interesting approach, but needs to be researched more in depth.
  37. CONCLUSION GENERAL CONCLUSIONS ✓ Explored under-exploited aspects of data analysis

    for streaming services. ✓ Stream polarity and User attention have many practical applications, used separately or jointly. ✓ Applications for analytics, as business metrics and in improving recommendations.
  38. CONCLUSION LIMITATIONS & FUTURE WORK ‣ More sophisticated models should

    be evaluated for the attention model. ‣ Stream polarity’s application to improve recommendations needs to be evaluated. ‣ The sequential analysis is promising, but it has to be done in more depth.