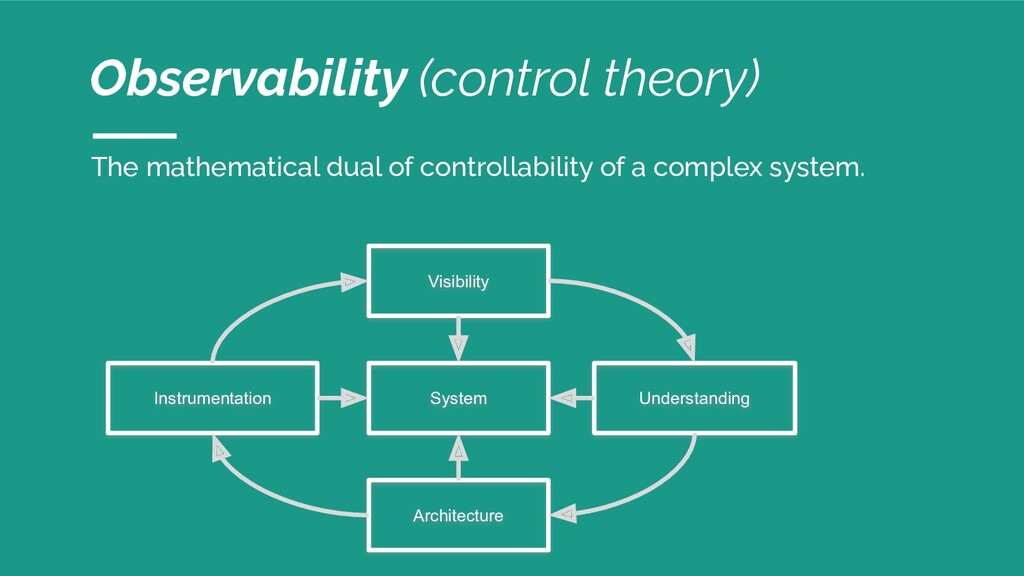
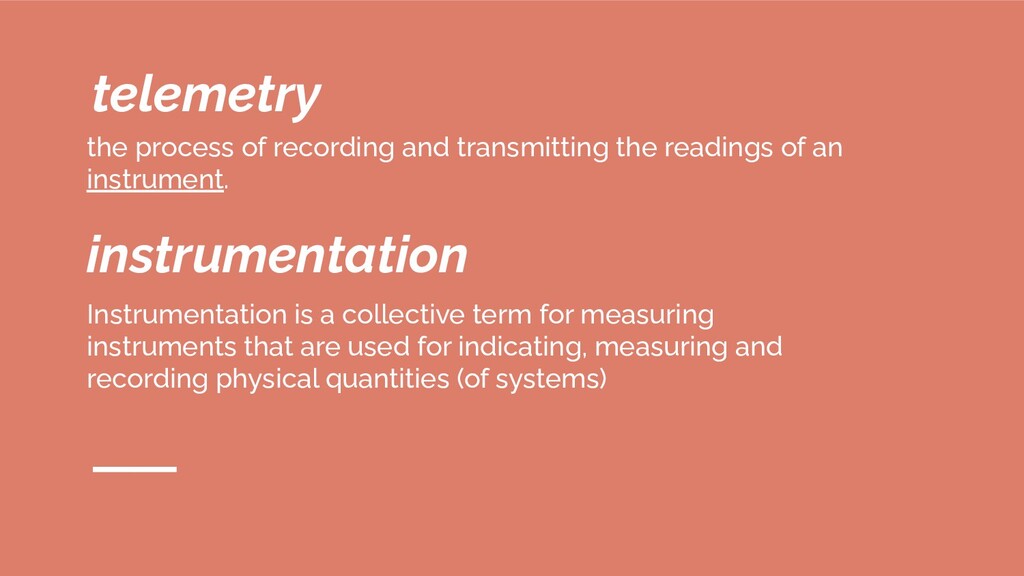
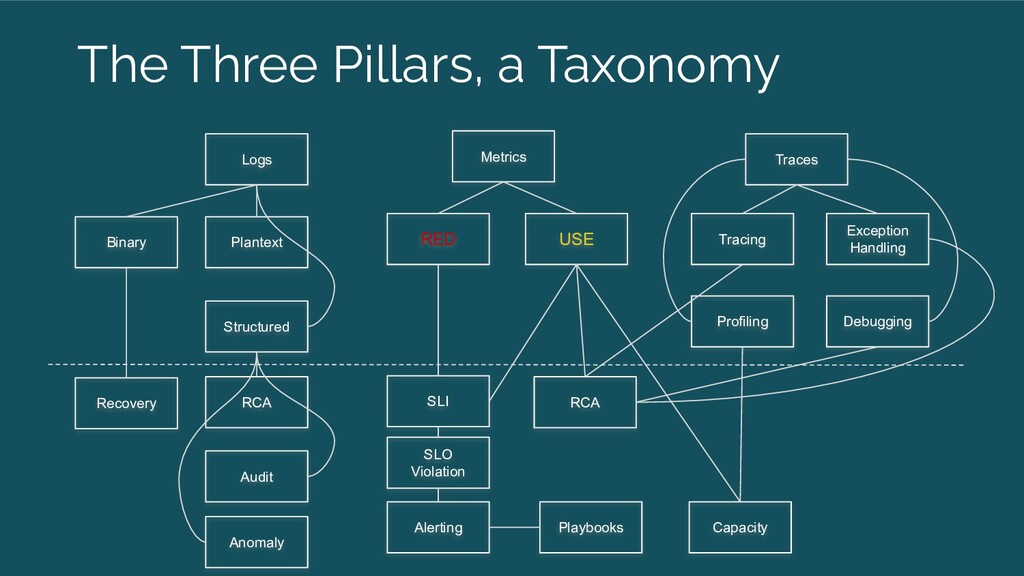
- What is Telemetry and why do we need to have an open standard for it
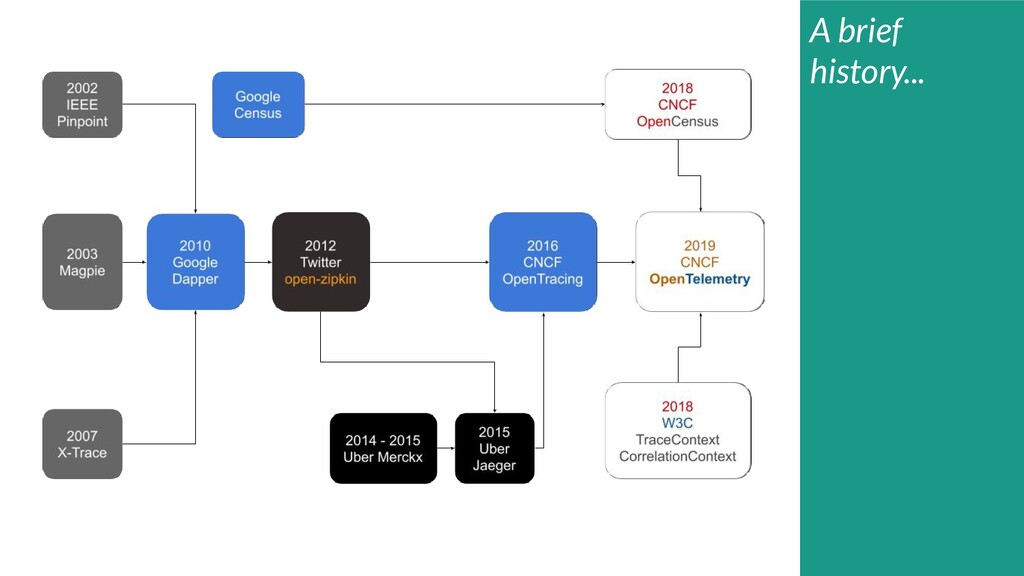
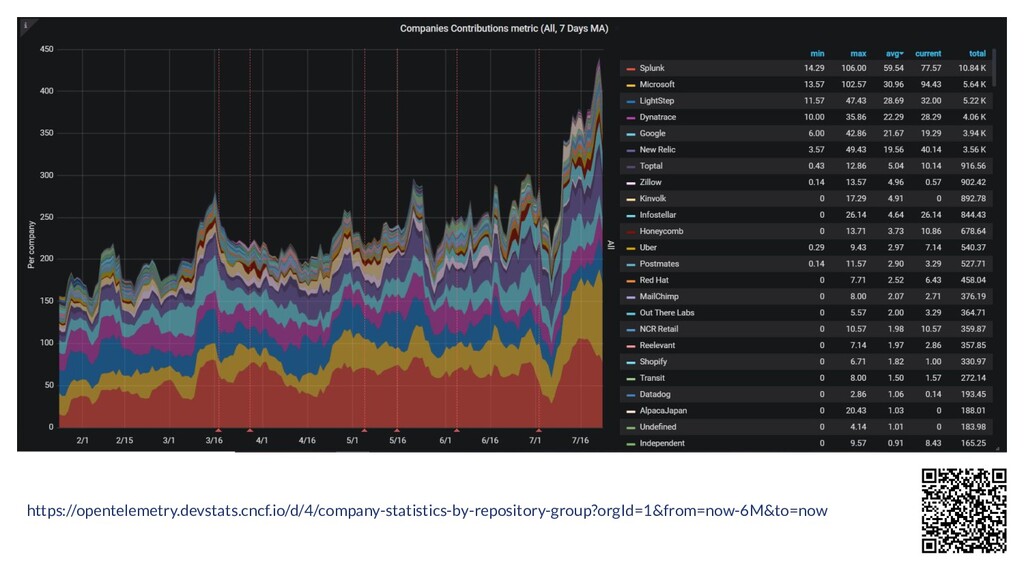
- The History and lineage of OpenTelemetry
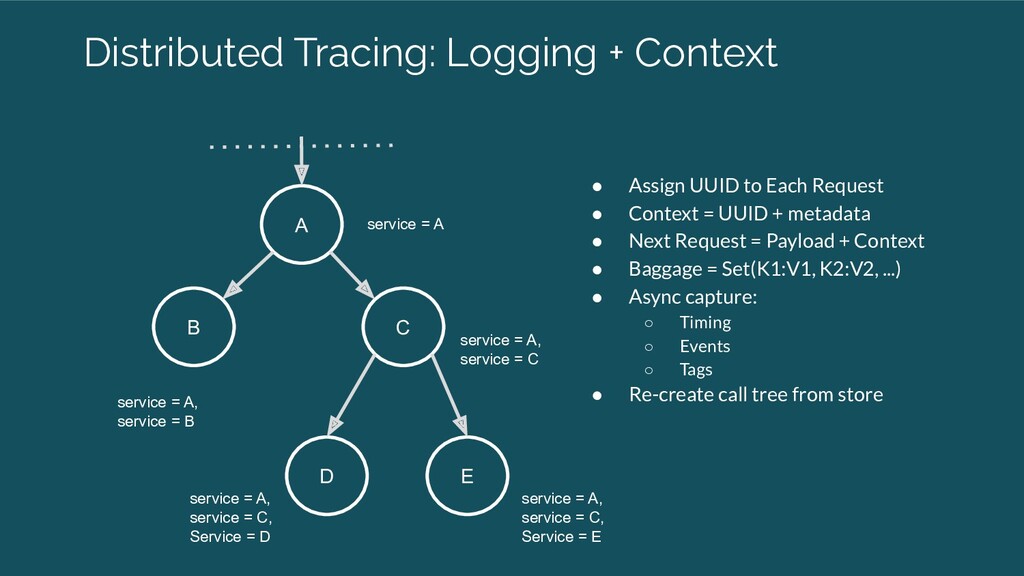
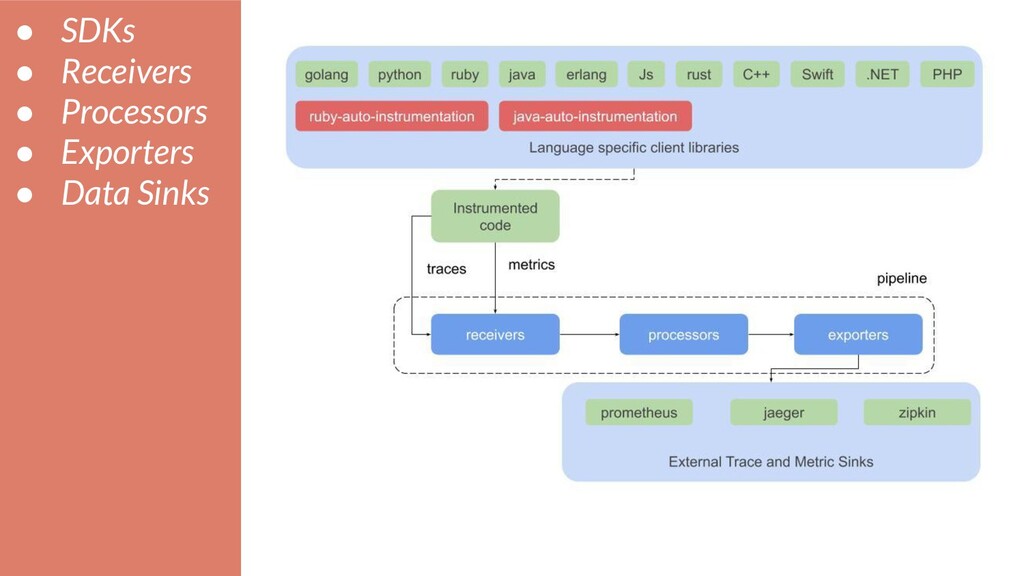
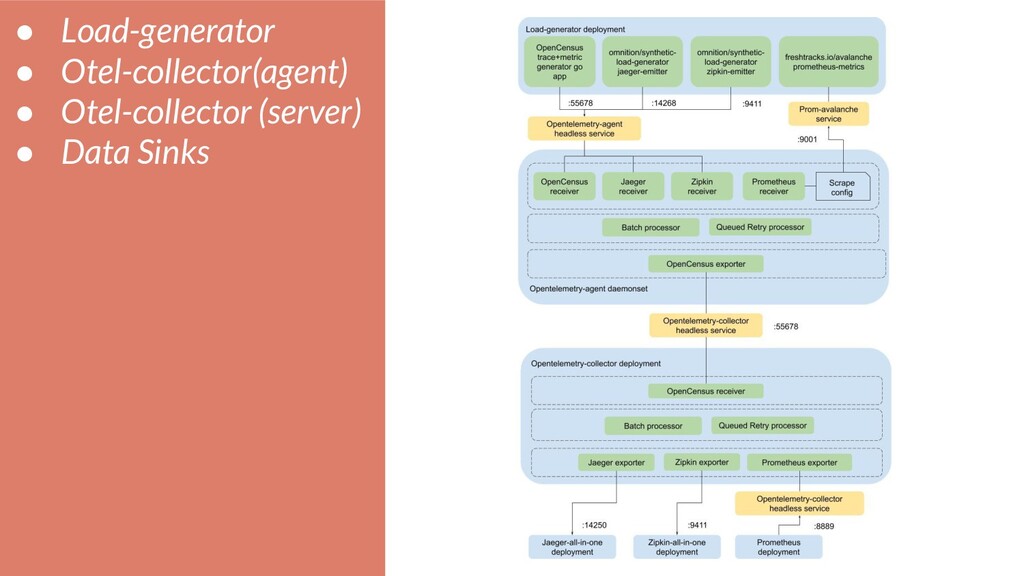
- Architecture
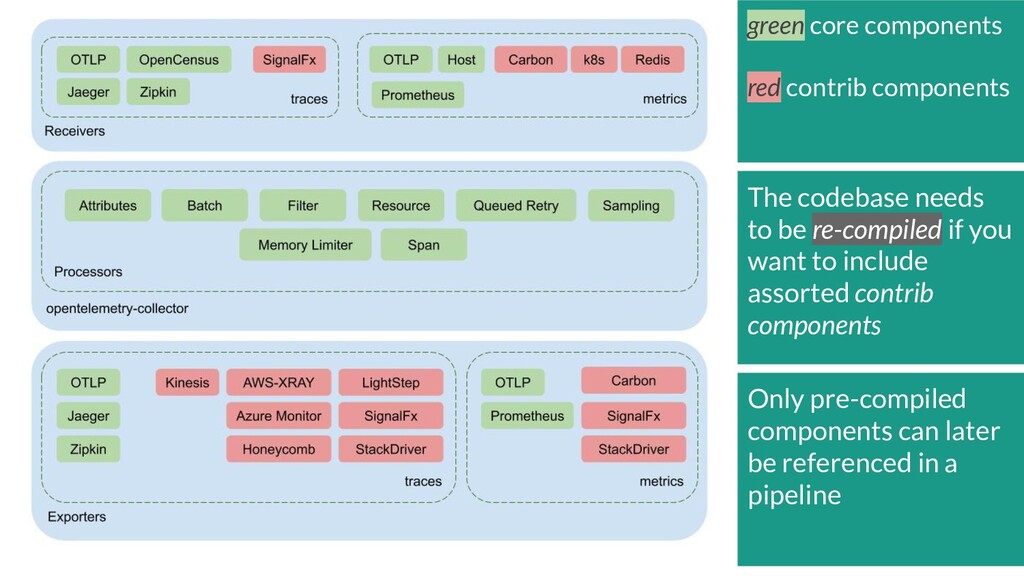
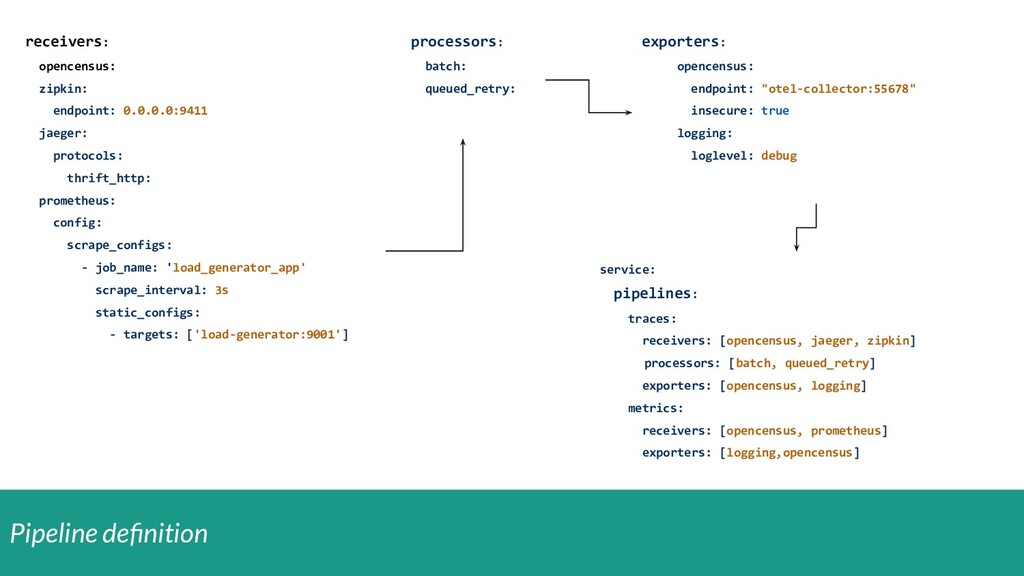
- Component Layout
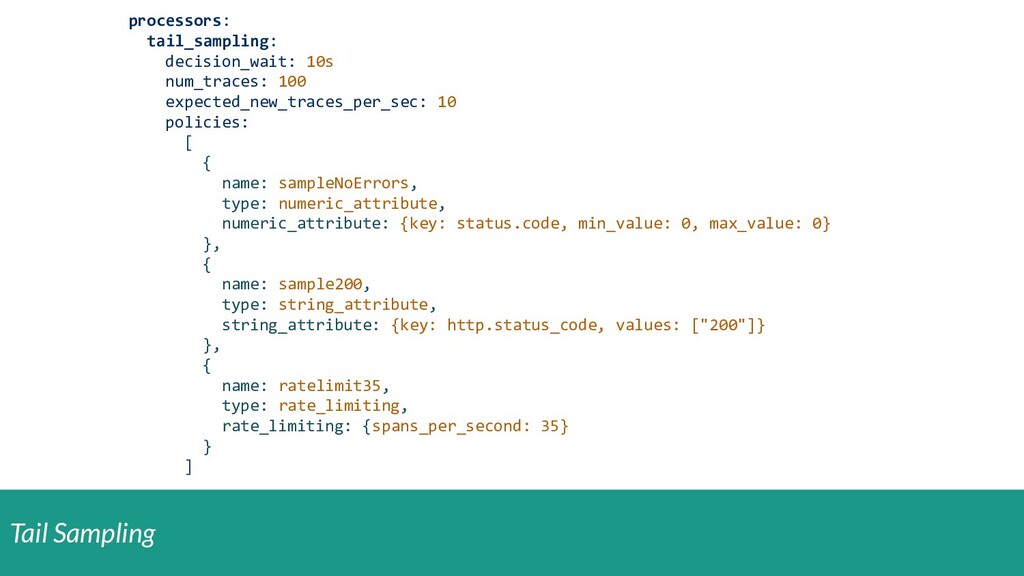
- Basic Sampling, constant, probabilistc and tail-sampling
- Caveat of using tail-sampling w.r.t. scalability
- Kubernetes Deployment of OpenTelemetry stack
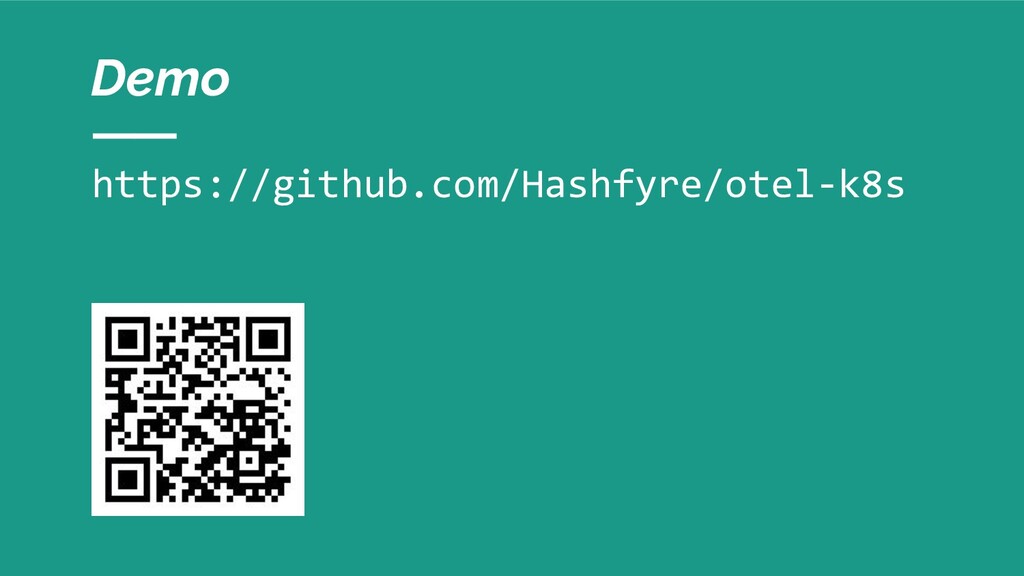
- Quick Demo of open-source code
- Q&A