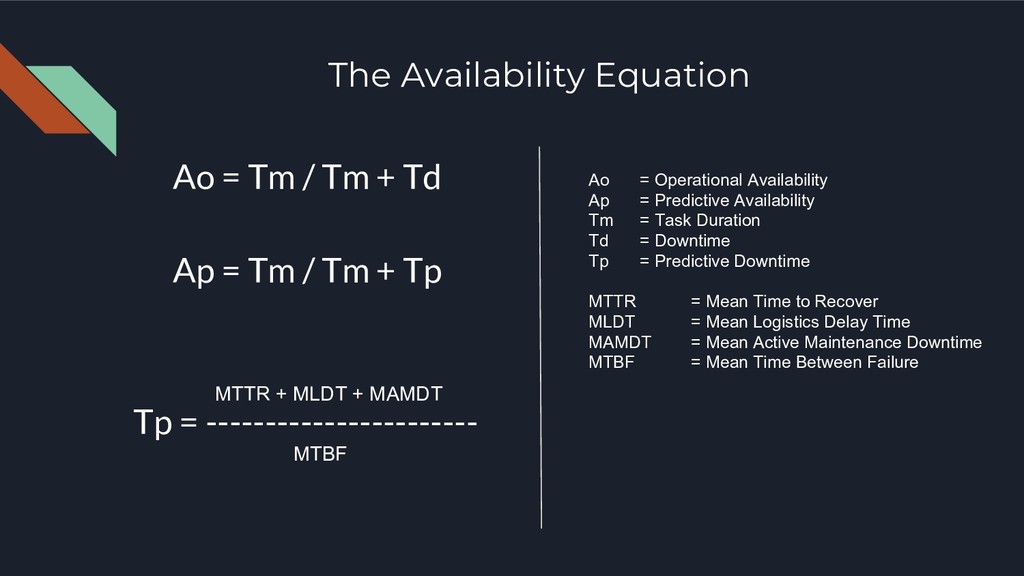
Ap = Tm / Tm + Tp Tp = ----------------------- MTTR + MLDT + MAMDT MTBF Ao = Operational Availability Ap = Predictive Availability Tm = Task Duration Td = Downtime Tp = Predictive Downtime MTTR = Mean Time to Recover MLDT = Mean Logistics Delay Time MAMDT = Mean Active Maintenance Downtime MTBF = Mean Time Between Failure
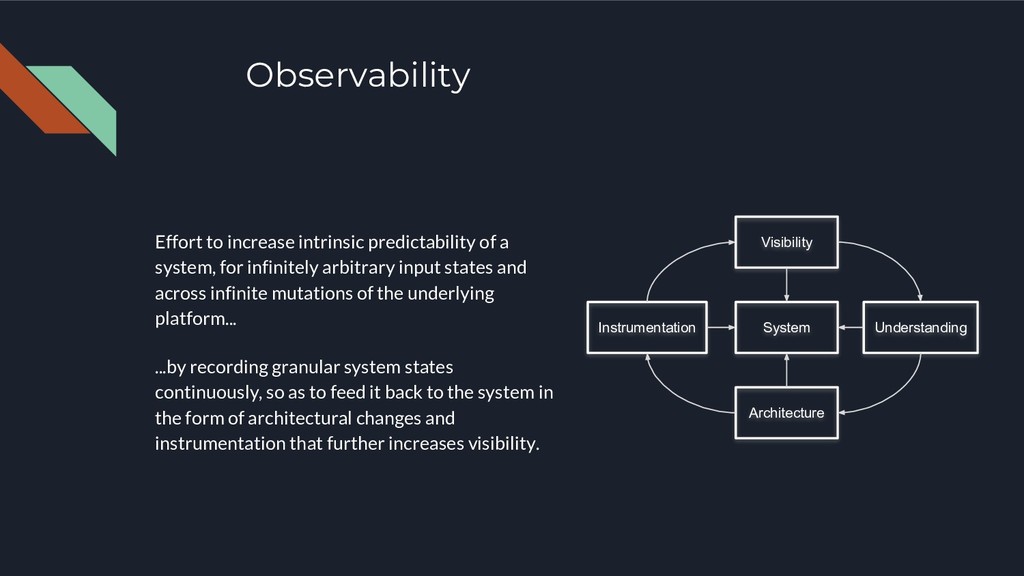
infinitely arbitrary input states and across infinite mutations of the underlying platform... ...by recording granular system states continuously, so as to feed it back to the system in the form of architectural changes and instrumentation that further increases visibility. System Visibility Understanding Architecture Instrumentation
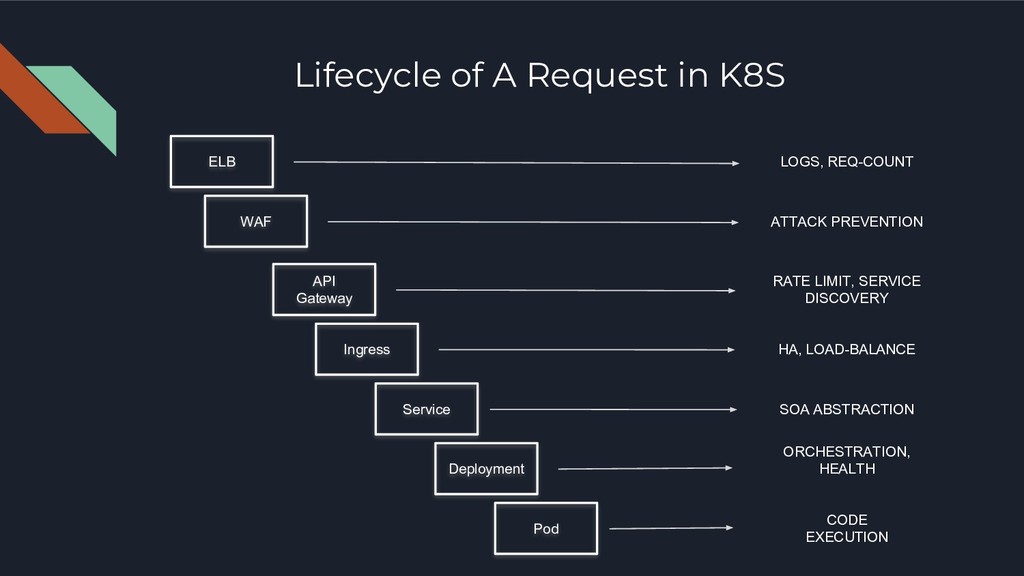
Ingress Service Deployment Pod LOGS, REQ-COUNT ATTACK PREVENTION RATE LIMIT, SERVICE DISCOVERY HA, LOAD-BALANCE SOA ABSTRACTION ORCHESTRATION, HEALTH CODE EXECUTION
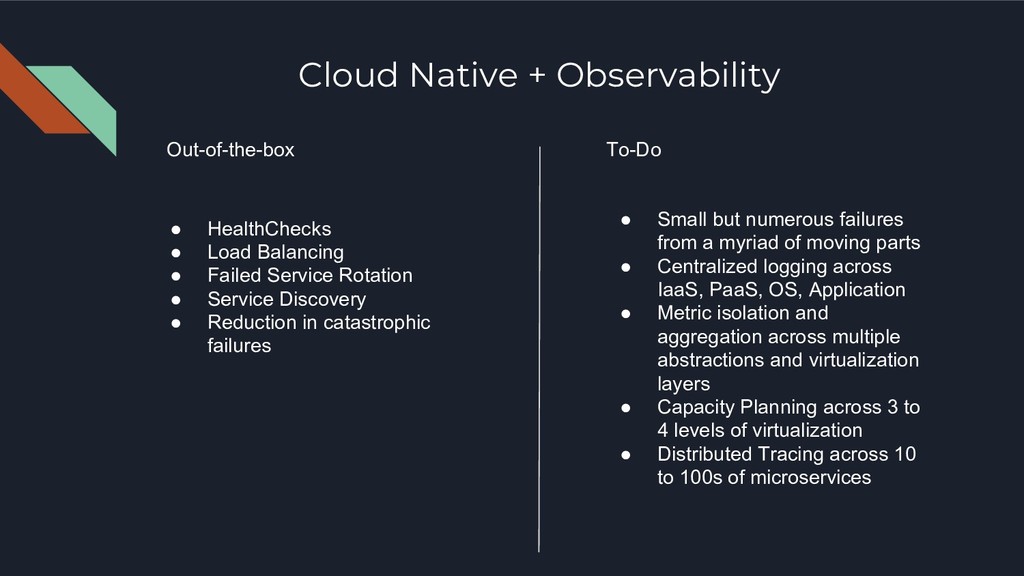
Failed Service Rotation • Service Discovery • Reduction in catastrophic failures Out-of-the-box To-Do • Small but numerous failures from a myriad of moving parts • Centralized logging across IaaS, PaaS, OS, Application • Metric isolation and aggregation across multiple abstractions and virtualization layers • Capacity Planning across 3 to 4 levels of virtualization • Distributed Tracing across 10 to 100s of microservices
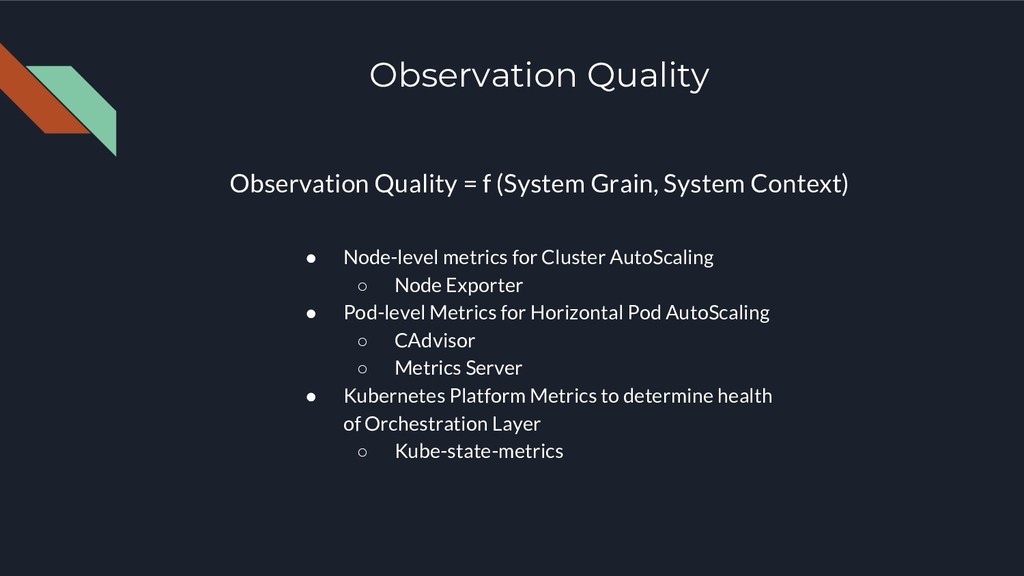
• Node-level metrics for Cluster AutoScaling ◦ Node Exporter • Pod-level Metrics for Horizontal Pod AutoScaling ◦ CAdvisor ◦ Metrics Server • Kubernetes Platform Metrics to determine health of Orchestration Layer ◦ Kube-state-metrics
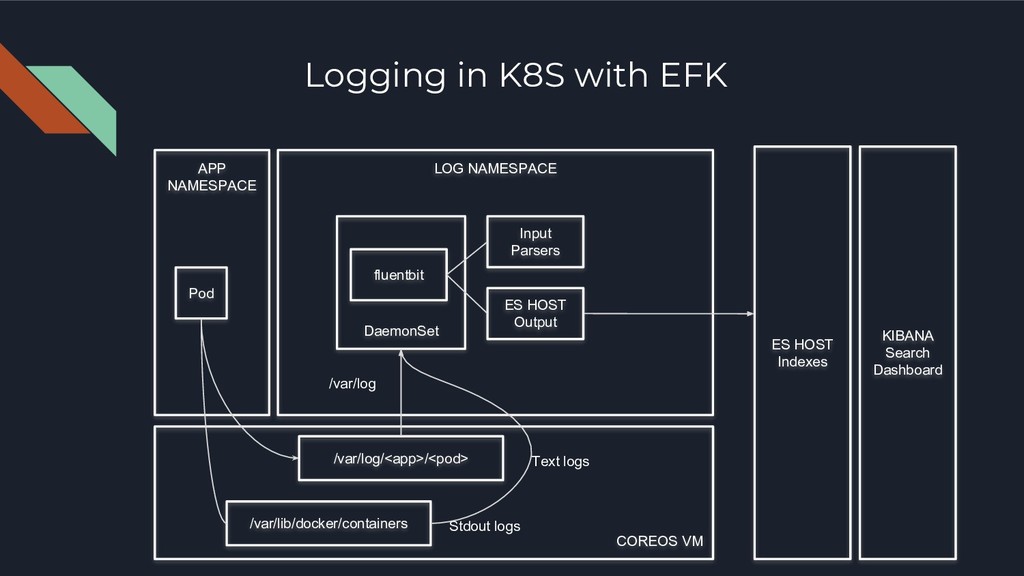
VM Pod DaemonSet /var/log/<app>/<pod> /var/log fluentbit /var/lib/docker/containers Text logs Stdout logs Input Parsers ES HOST Output ES HOST Indexes KIBANA Search Dashboard
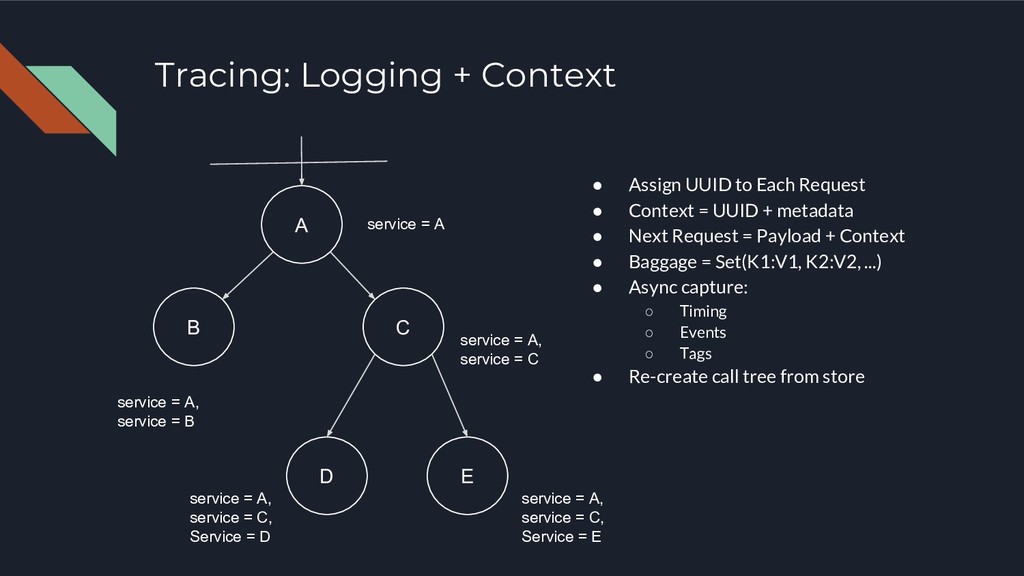
• Context = UUID + metadata • Next Request = Payload + Context • Baggage = Set(K1:V1, K2:V2, ...) • Async capture: ◦ Timing ◦ Events ◦ Tags • Re-create call tree from store A B C D E service = A service = A, service = B service = A, service = C service = A, service = C, Service = D service = A, service = C, Service = E
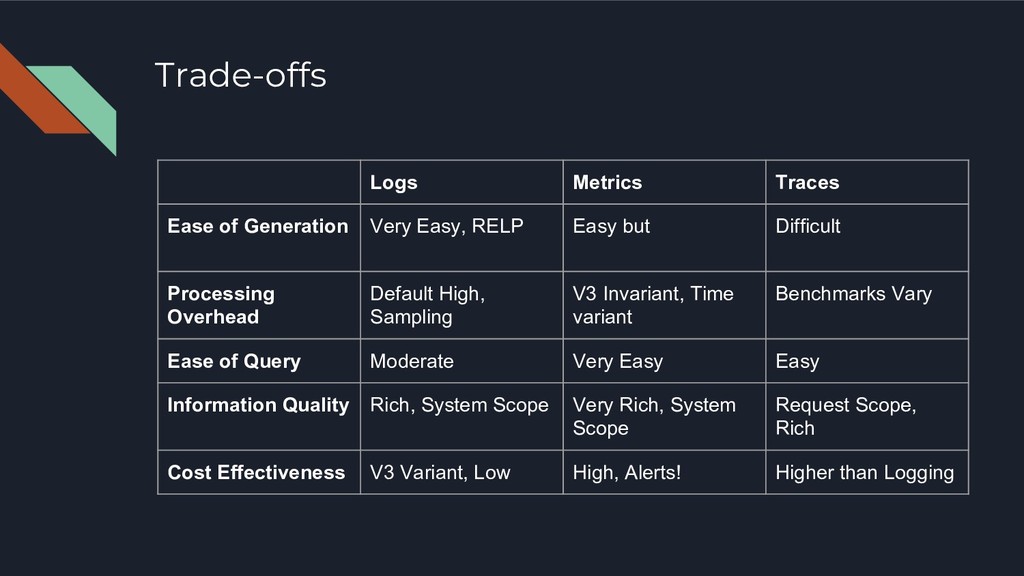
Easy but Difficult Processing Overhead Default High, Sampling V3 Invariant, Time variant Benchmarks Vary Ease of Query Moderate Very Easy Easy Information Quality Rich, System Scope Very Rich, System Scope Request Scope, Rich Cost Effectiveness V3 Variant, Low High, Alerts! Higher than Logging
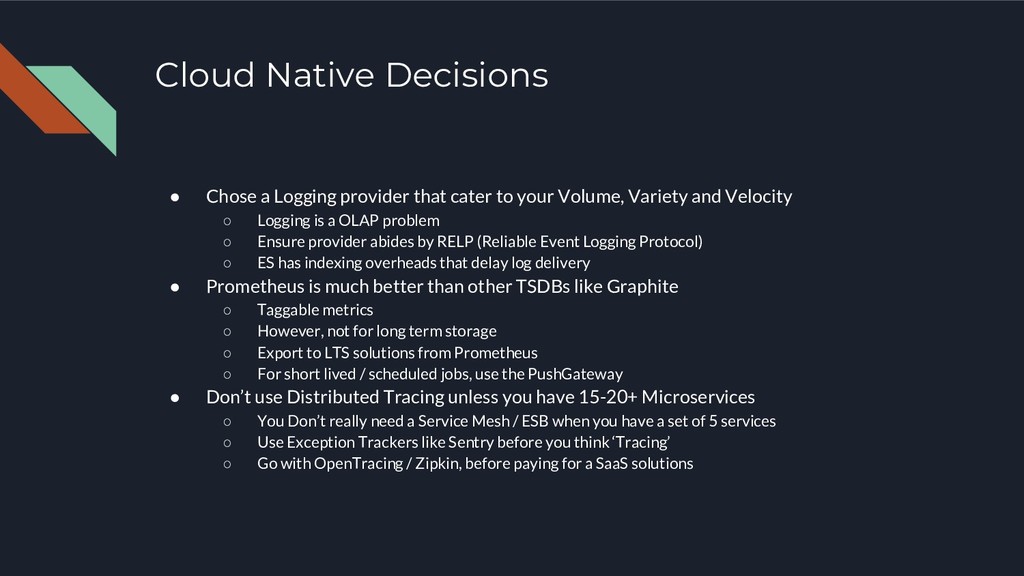
to your Volume, Variety and Velocity ◦ Logging is a OLAP problem ◦ Ensure provider abides by RELP (Reliable Event Logging Protocol) ◦ ES has indexing overheads that delay log delivery • Prometheus is much better than other TSDBs like Graphite ◦ Taggable metrics ◦ However, not for long term storage ◦ Export to LTS solutions from Prometheus ◦ For short lived / scheduled jobs, use the PushGateway • Don’t use Distributed Tracing unless you have 15-20+ Microservices ◦ You Don’t really need a Service Mesh / ESB when you have a set of 5 services ◦ Use Exception Trackers like Sentry before you think ‘Tracing’ ◦ Go with OpenTracing / Zipkin, before paying for a SaaS solutions
panacea ◦ You need humans to debug and architect ◦ But: ▪ n(team) != n(services) ▪ Complex systems evolve with high velocity ▪ Knowledge of Complex systems evolve amongst practitioners ▪ More humans -> more ambiguity -> more error introduction • Automate Playbook and Dashboard generation ◦ Link playbooks to Dashboard to reduce MLDT • Create an uniform Logging / Monitoring framework across your services ◦ Make each app log the same way, track the same metrics ◦ Triaging becomes uniform across the Org