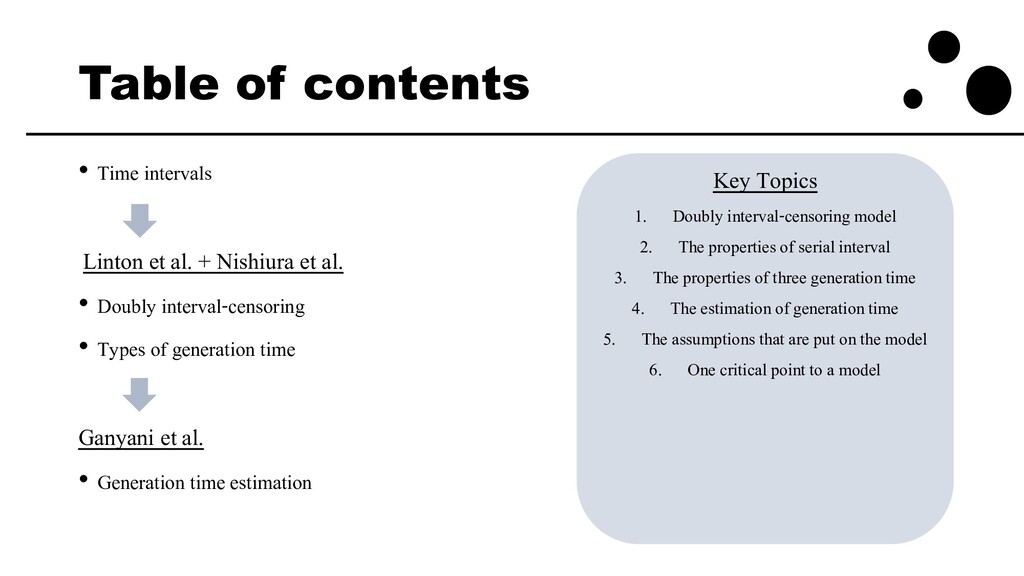
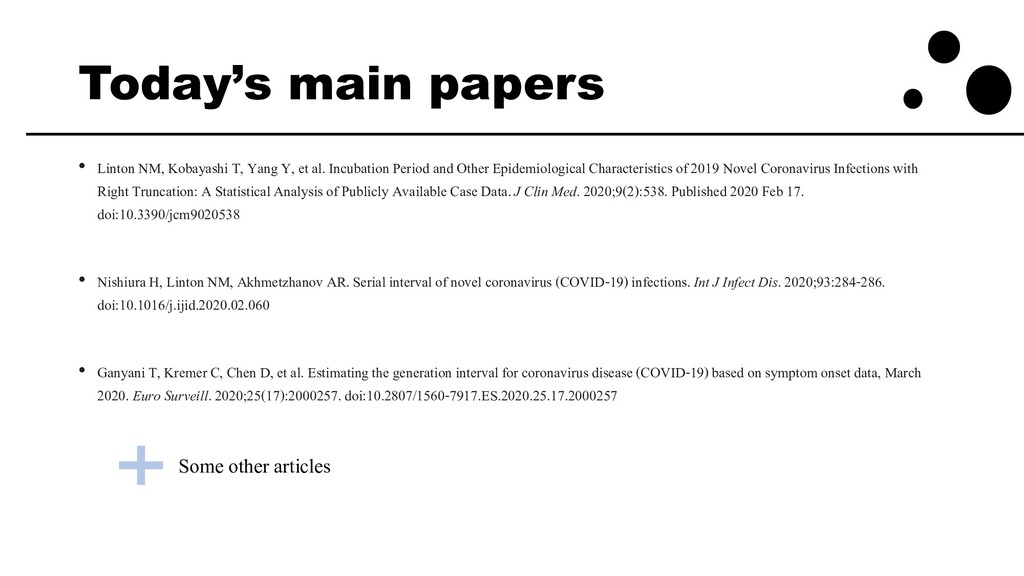
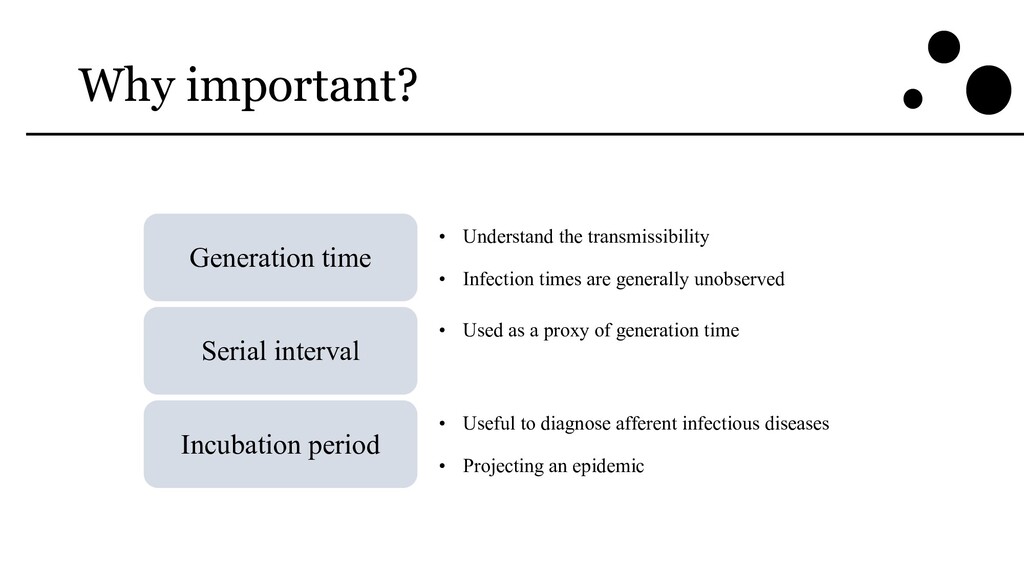
世代時間 (generation time), 発症間隔 (serial interval), 潜伏期間 (incubation period)などのCOVID-19における推定とそれらの性質や関係について, 次の3本の論文を軸に抄読会MERCにて発表しました。
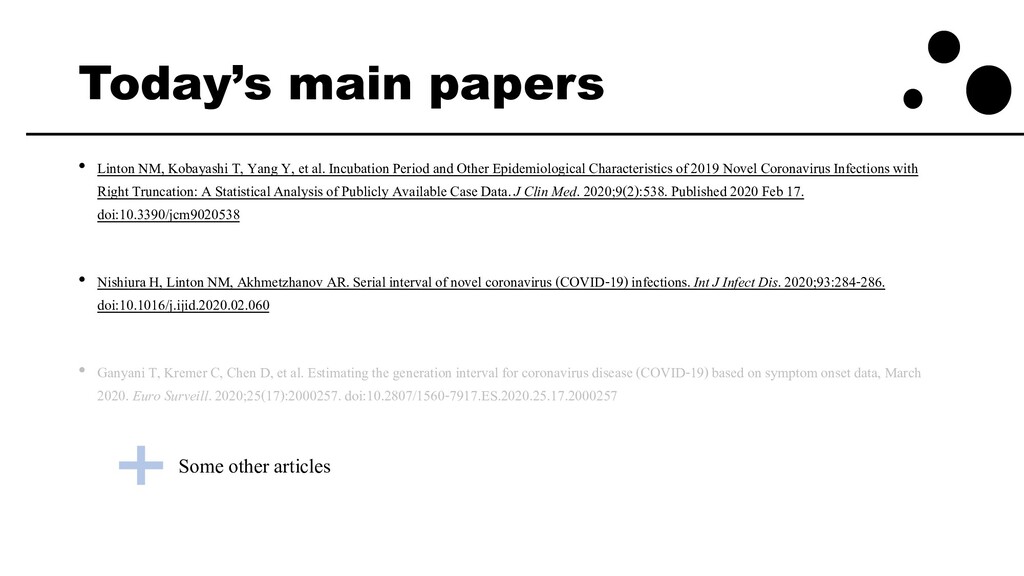
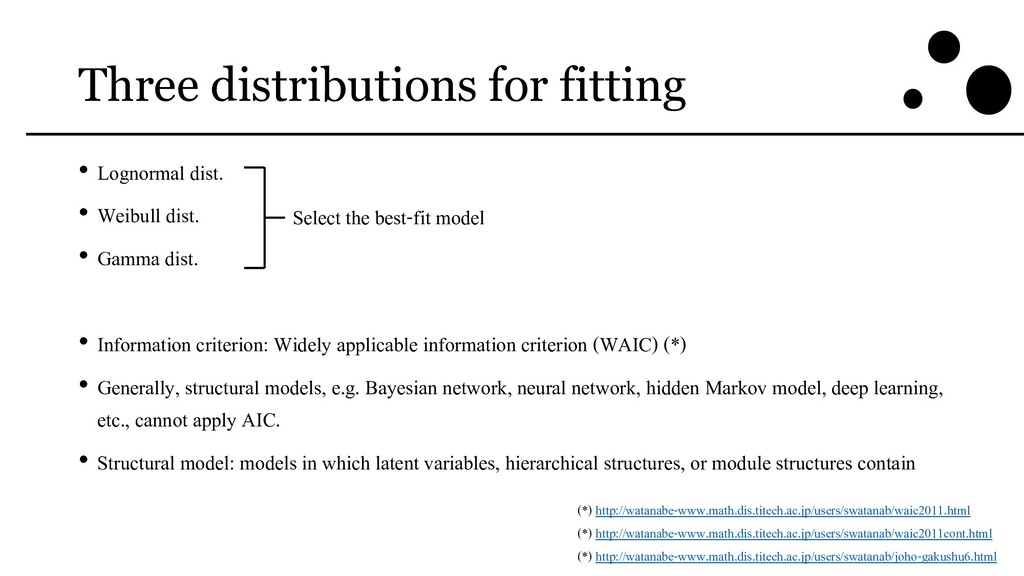
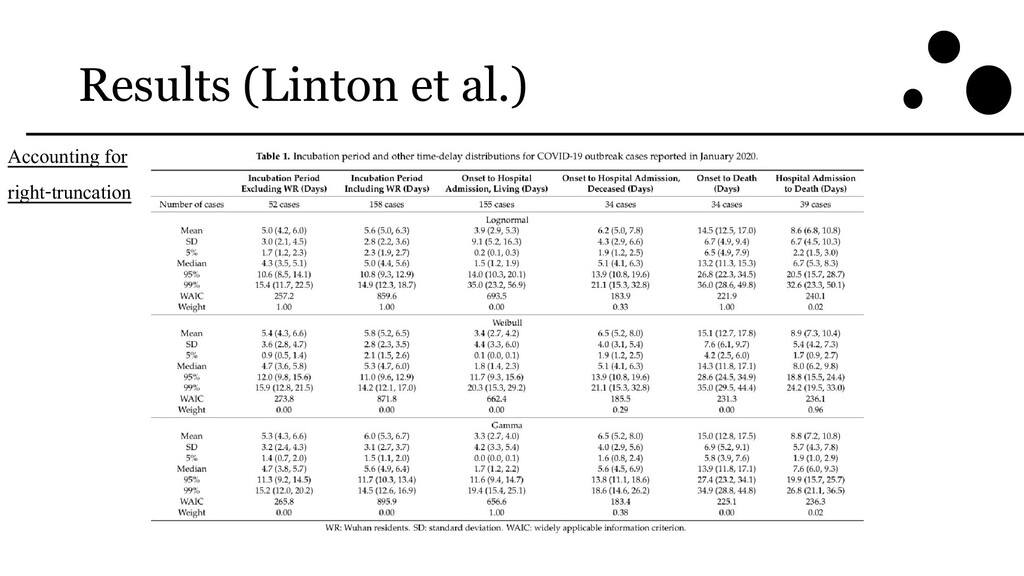
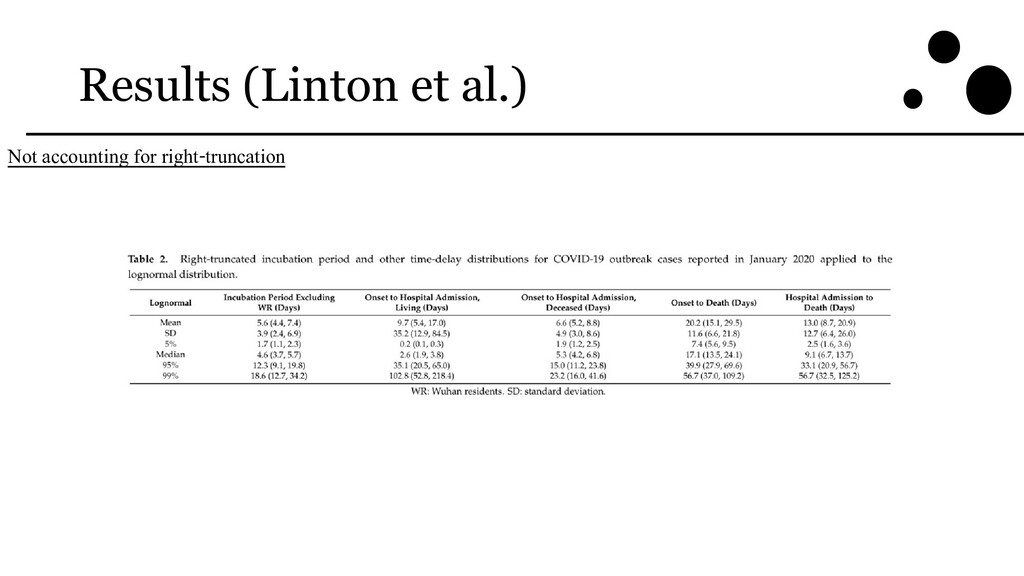
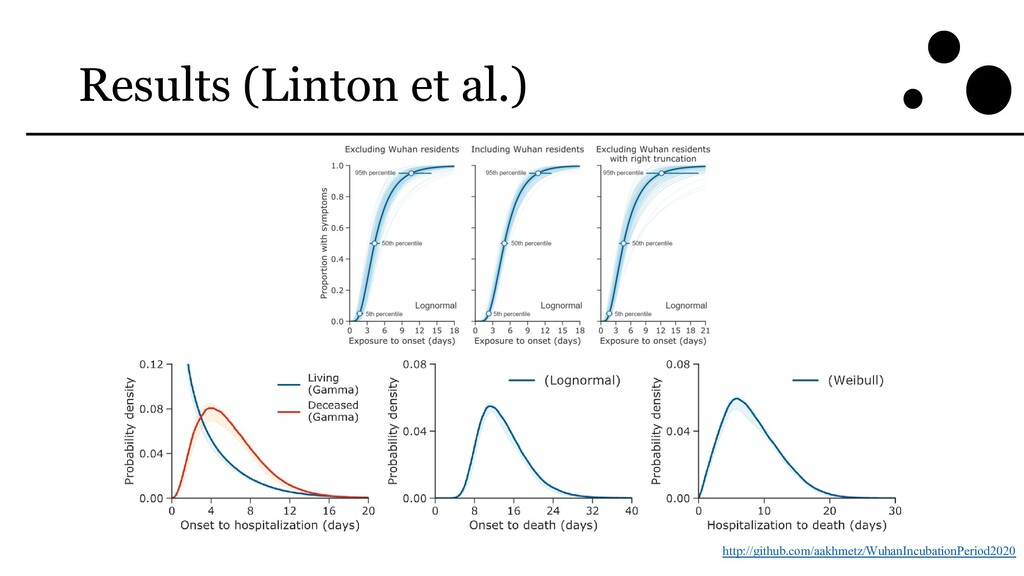
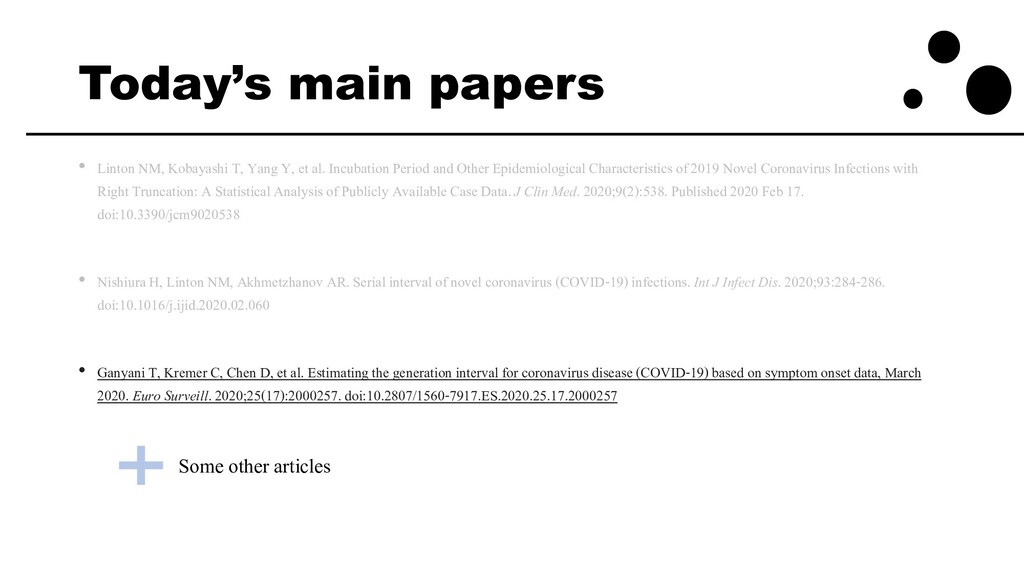
Linton NM, Kobayashi T, Yang Y, et al. Incubation Period and Other Epidemiological Characteristics of 2019 Novel Coronavirus Infections with Right Truncation: A Statistical Analysis of Publicly Available Case Data. J Clin Med. 2020;9(2):538. Published 2020 Feb 17. doi:10.3390/jcm9020538
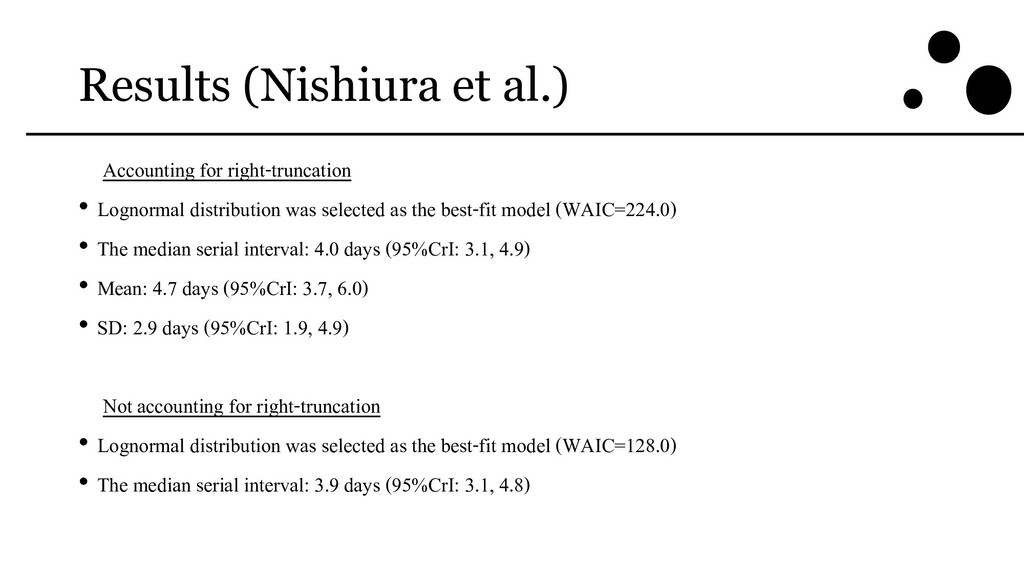
Nishiura H, Linton NM, Akhmetzhanov AR. Serial interval of novel coronavirus (COVID-19) infections. Int J Infect Dis. 2020;93:284-286. doi:10.1016/j.ijid.2020.02.060
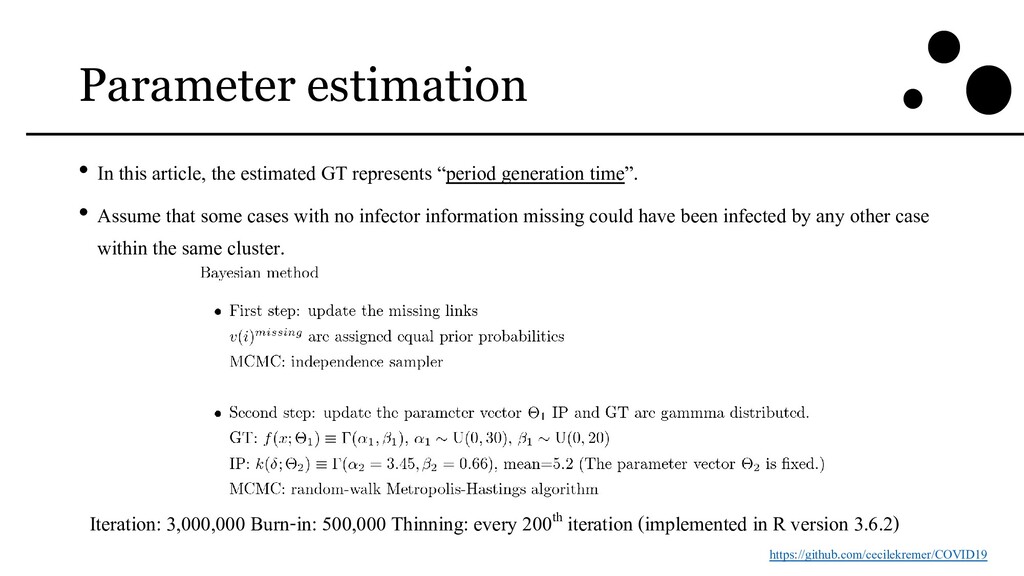
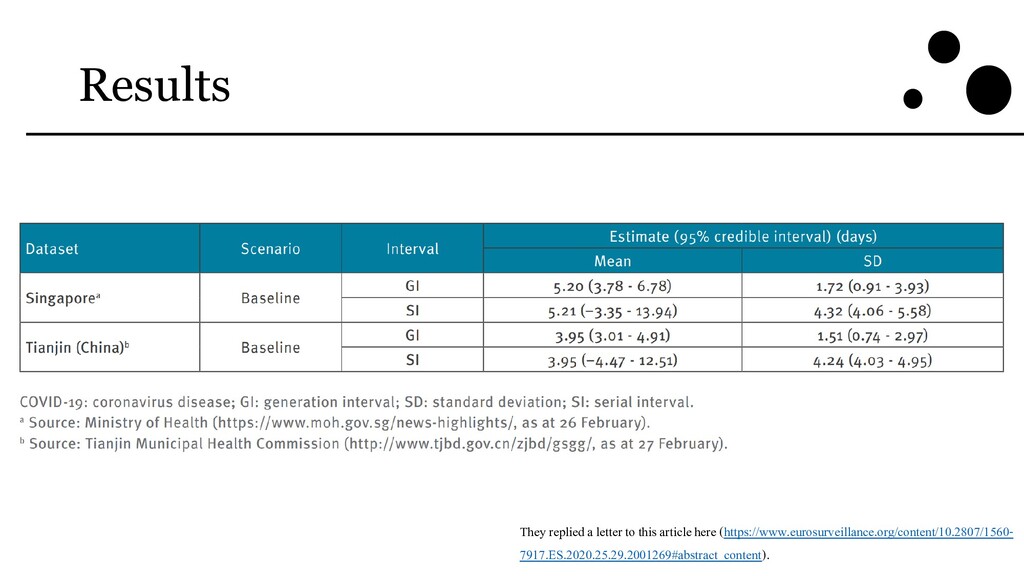
Ganyani T, Kremer C, Chen D, et al. Estimating the generation interval for coronavirus disease (COVID-19) based on symptom onset data, March 2020. Euro Surveill. 2020;25(17):2000257. doi:10.2807/1560-7917.ES.2020.25.17.2000257
![Biased estimates of generation time Nishiura [5] Champredon et al.](https://files.speakerdeck.com/presentations/02003dcd46964541b3617a86b605b2e9/slide_33.jpg)
![The correlation between GT and IP Klinkenberg et al. [9]](https://files.speakerdeck.com/presentations/02003dcd46964541b3617a86b605b2e9/slide_42.jpg)