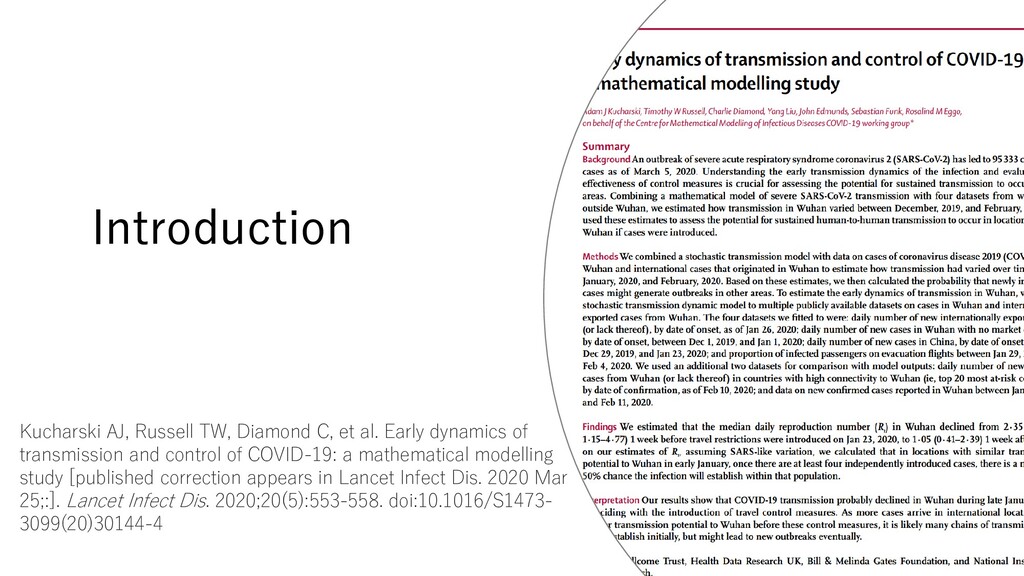
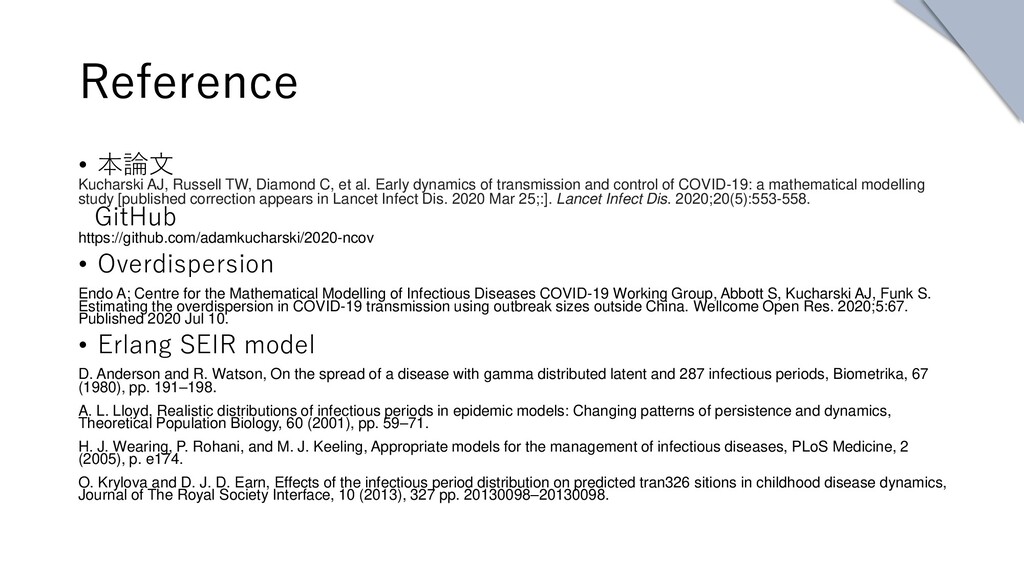
Kucharski AJ, Russell TW, Diamond C, et al. Early dynamics of transmission and control of COVID-19: a mathematical modelling study [published correction appears in Lancet Infect Dis. 2020 Mar 25;:]. Lancet Infect Dis. 2020;20(5):553-558. doi:10.1016/S1473-3099(20)30144-4