Share
Embed
When benchmarks go bad - what I learned from measuring performance wrong
The world of performance analysis is littered with flawed claims, cognitive biases, dangerous intuitions, and beguiling
fallacies. Sadly, Holly has been guilty of all of the above! Repeatedly. But this is a no-judgement zone. Some
measurement anti-patterns are subtle, and some are downright counter-intuitive. In this talk, Holly will explain why
measuring performance is important, and talk through some of the ways it can go wrong. That would be depressing if that
was all there was, so she’ll also introduce a toolbox of questions and principles that you can use to improve the
performance of your own applications.
Holly Cummins
October 06, 2026
Transcript
199 slides
-
Devoxx when benchmarks go bad what we learned by measuring
performance wrong holly cummins francesco nigro -
you are not measuring what you think you are you
are measuring noise -
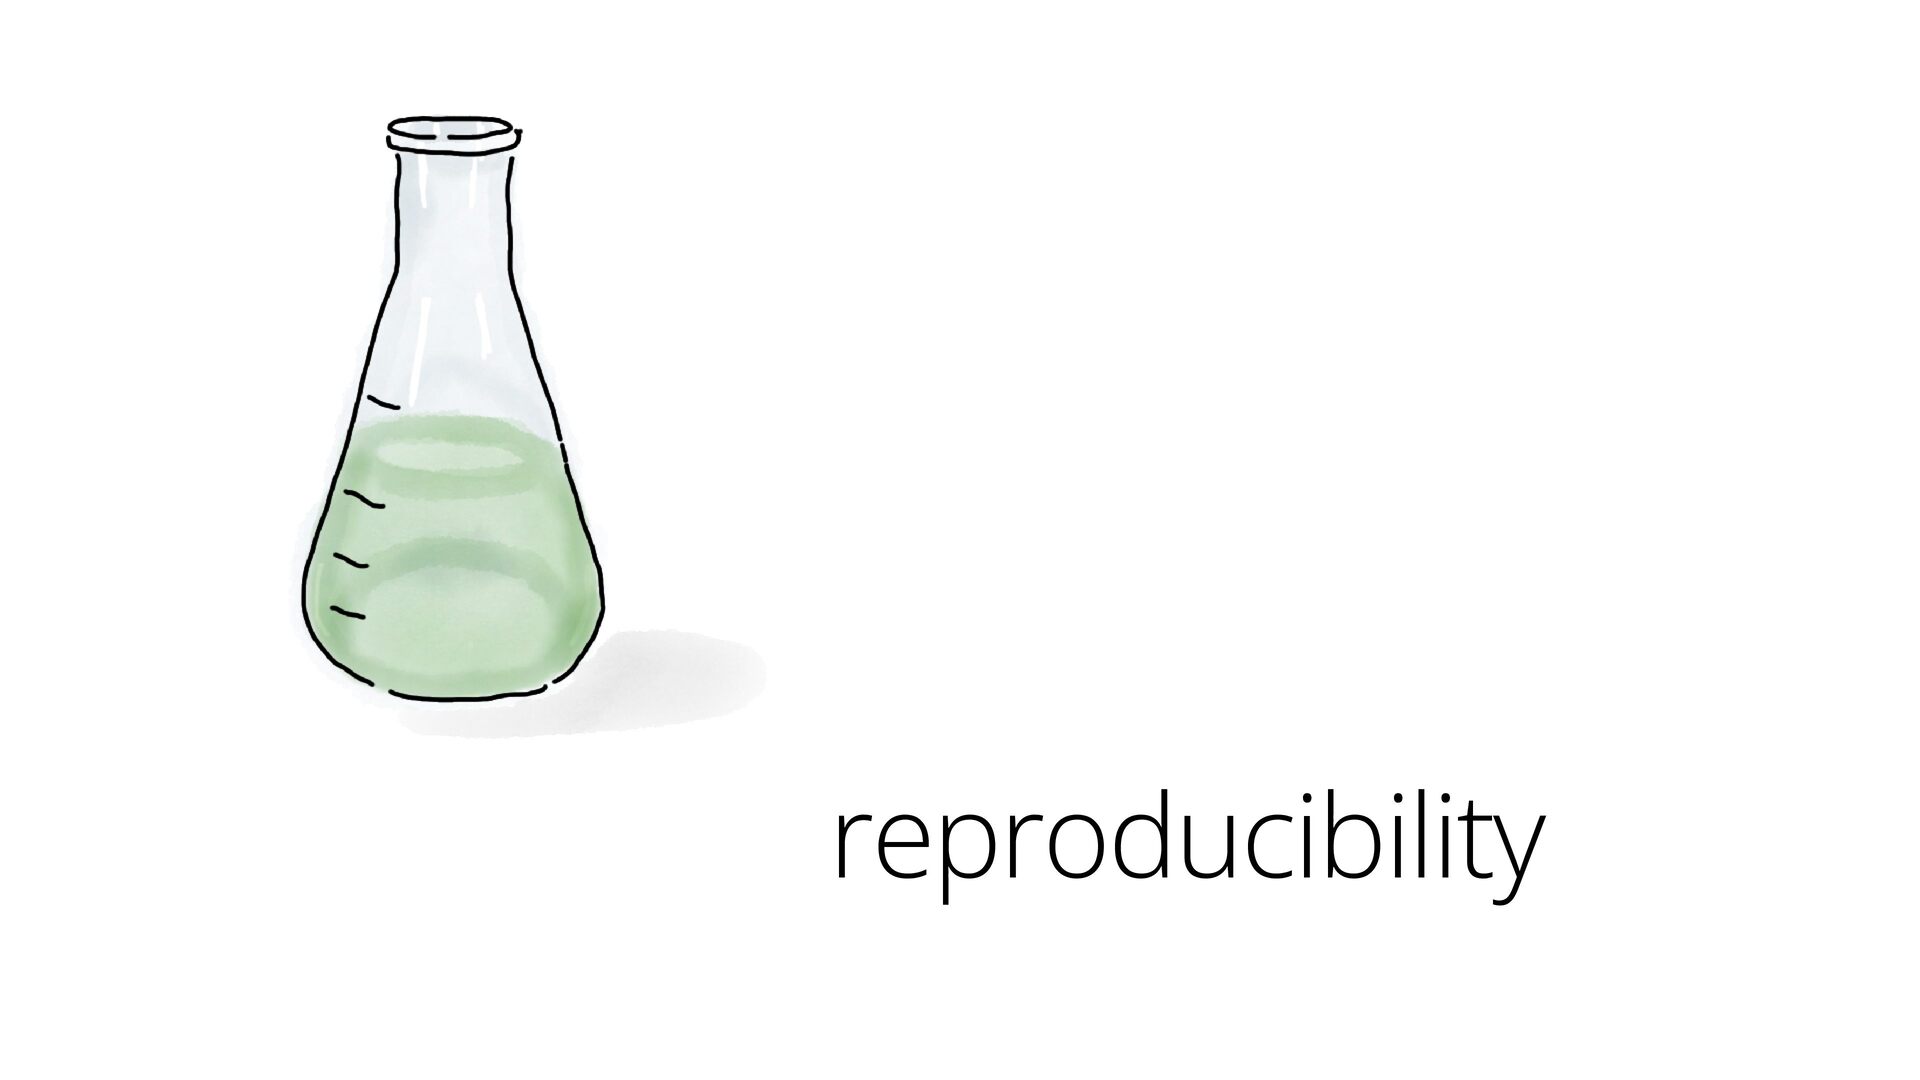
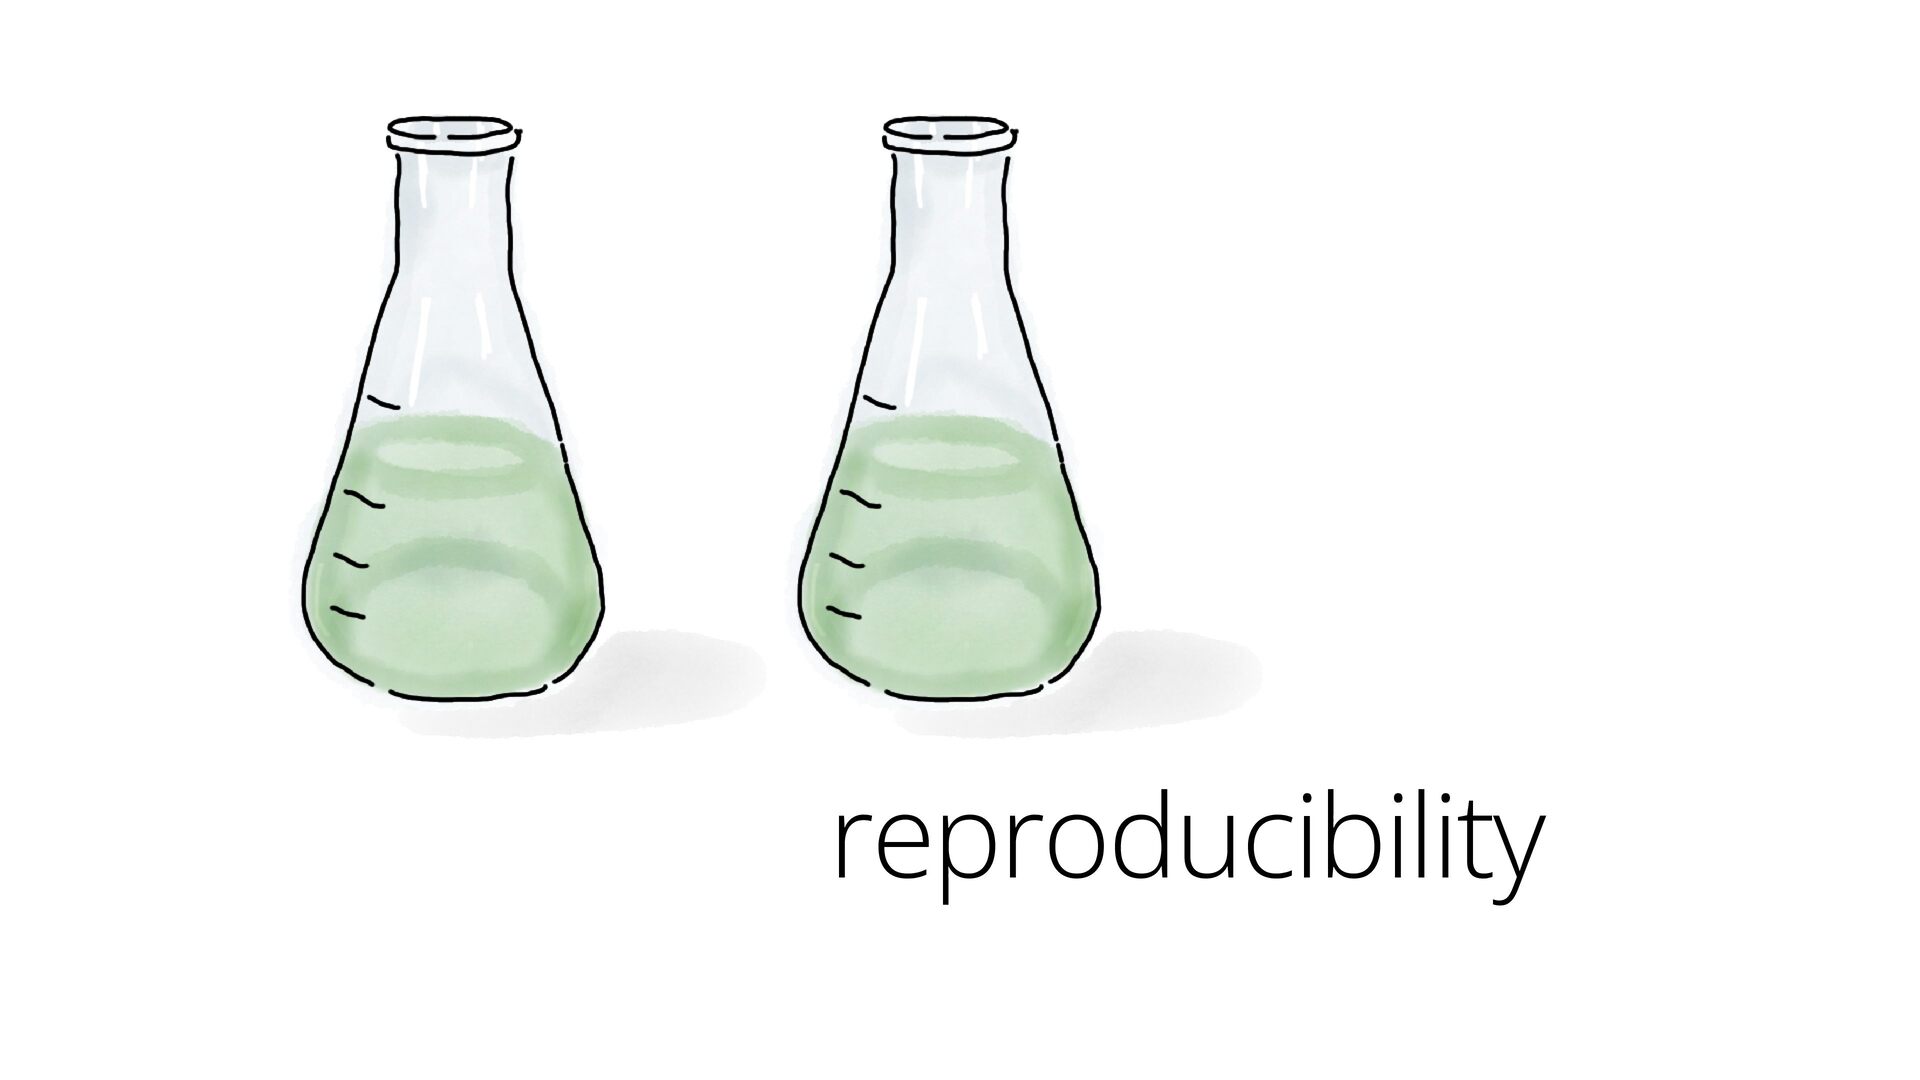
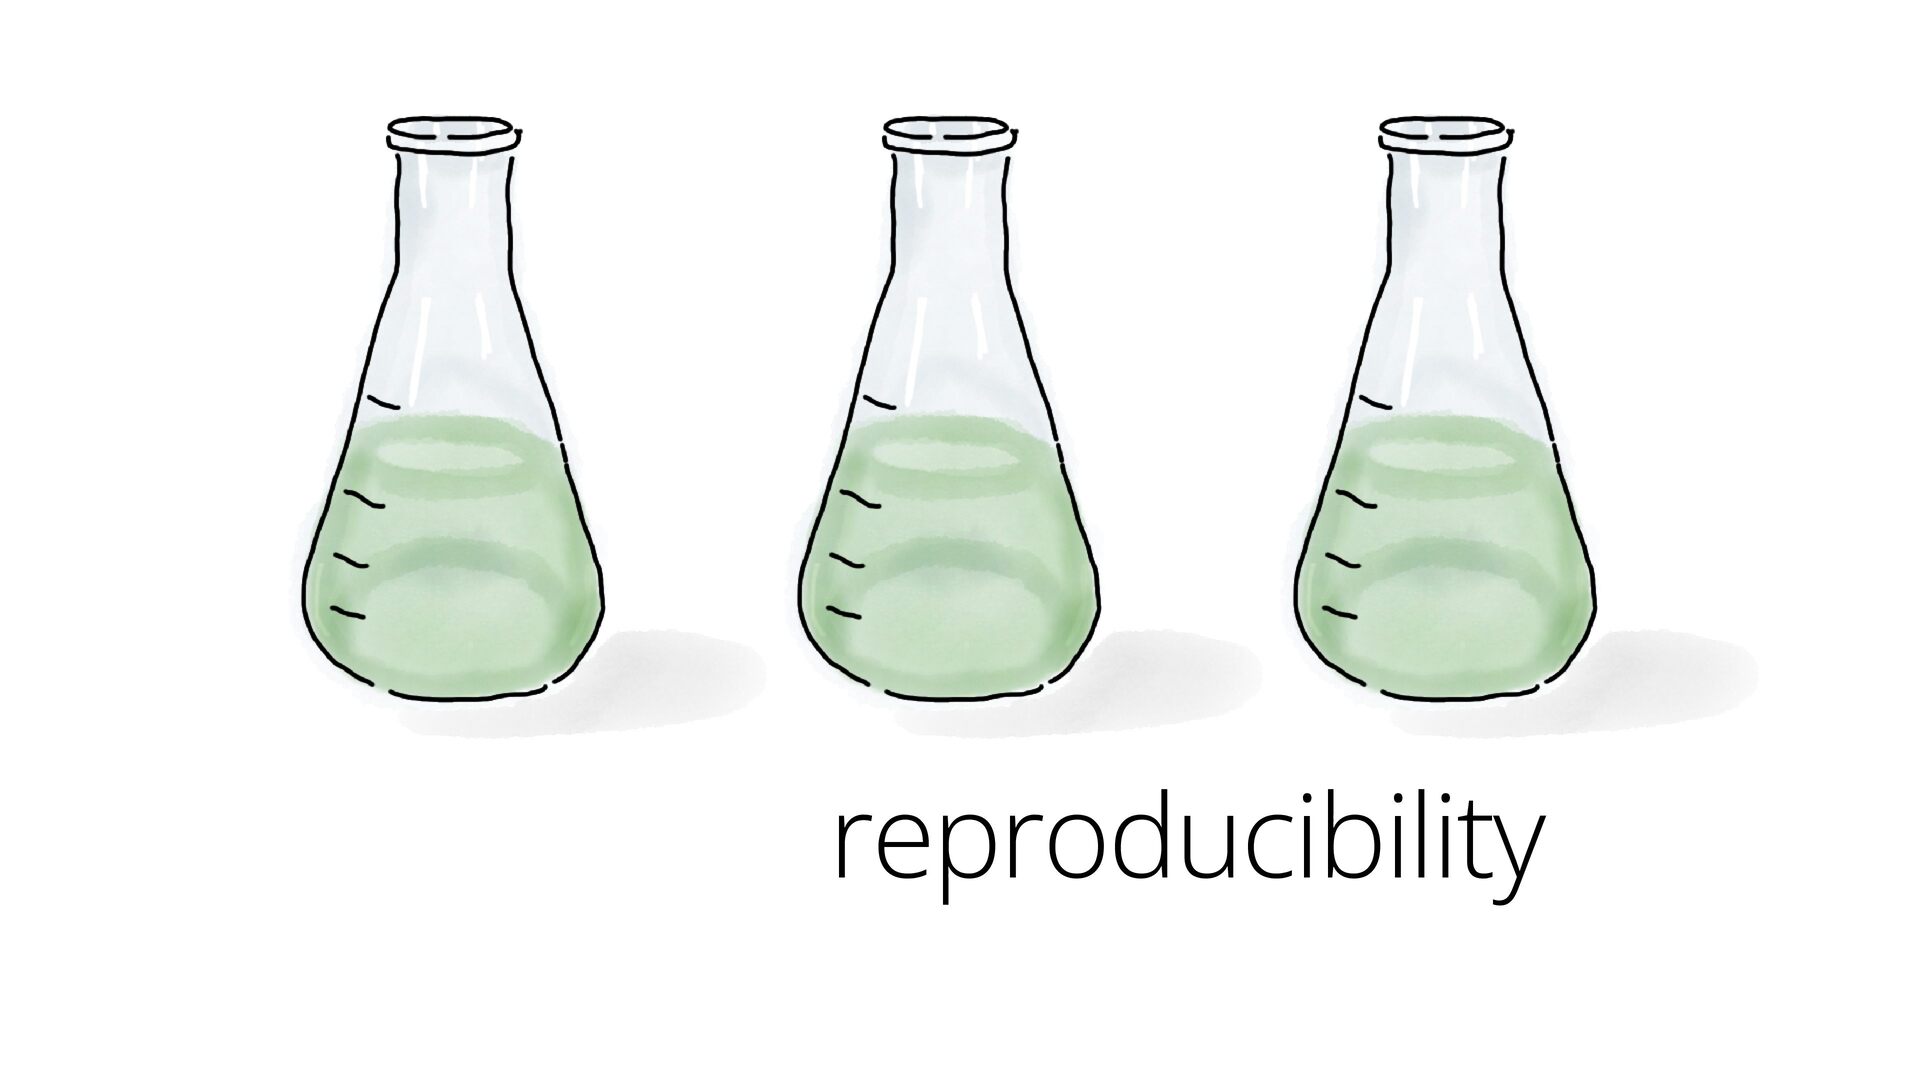
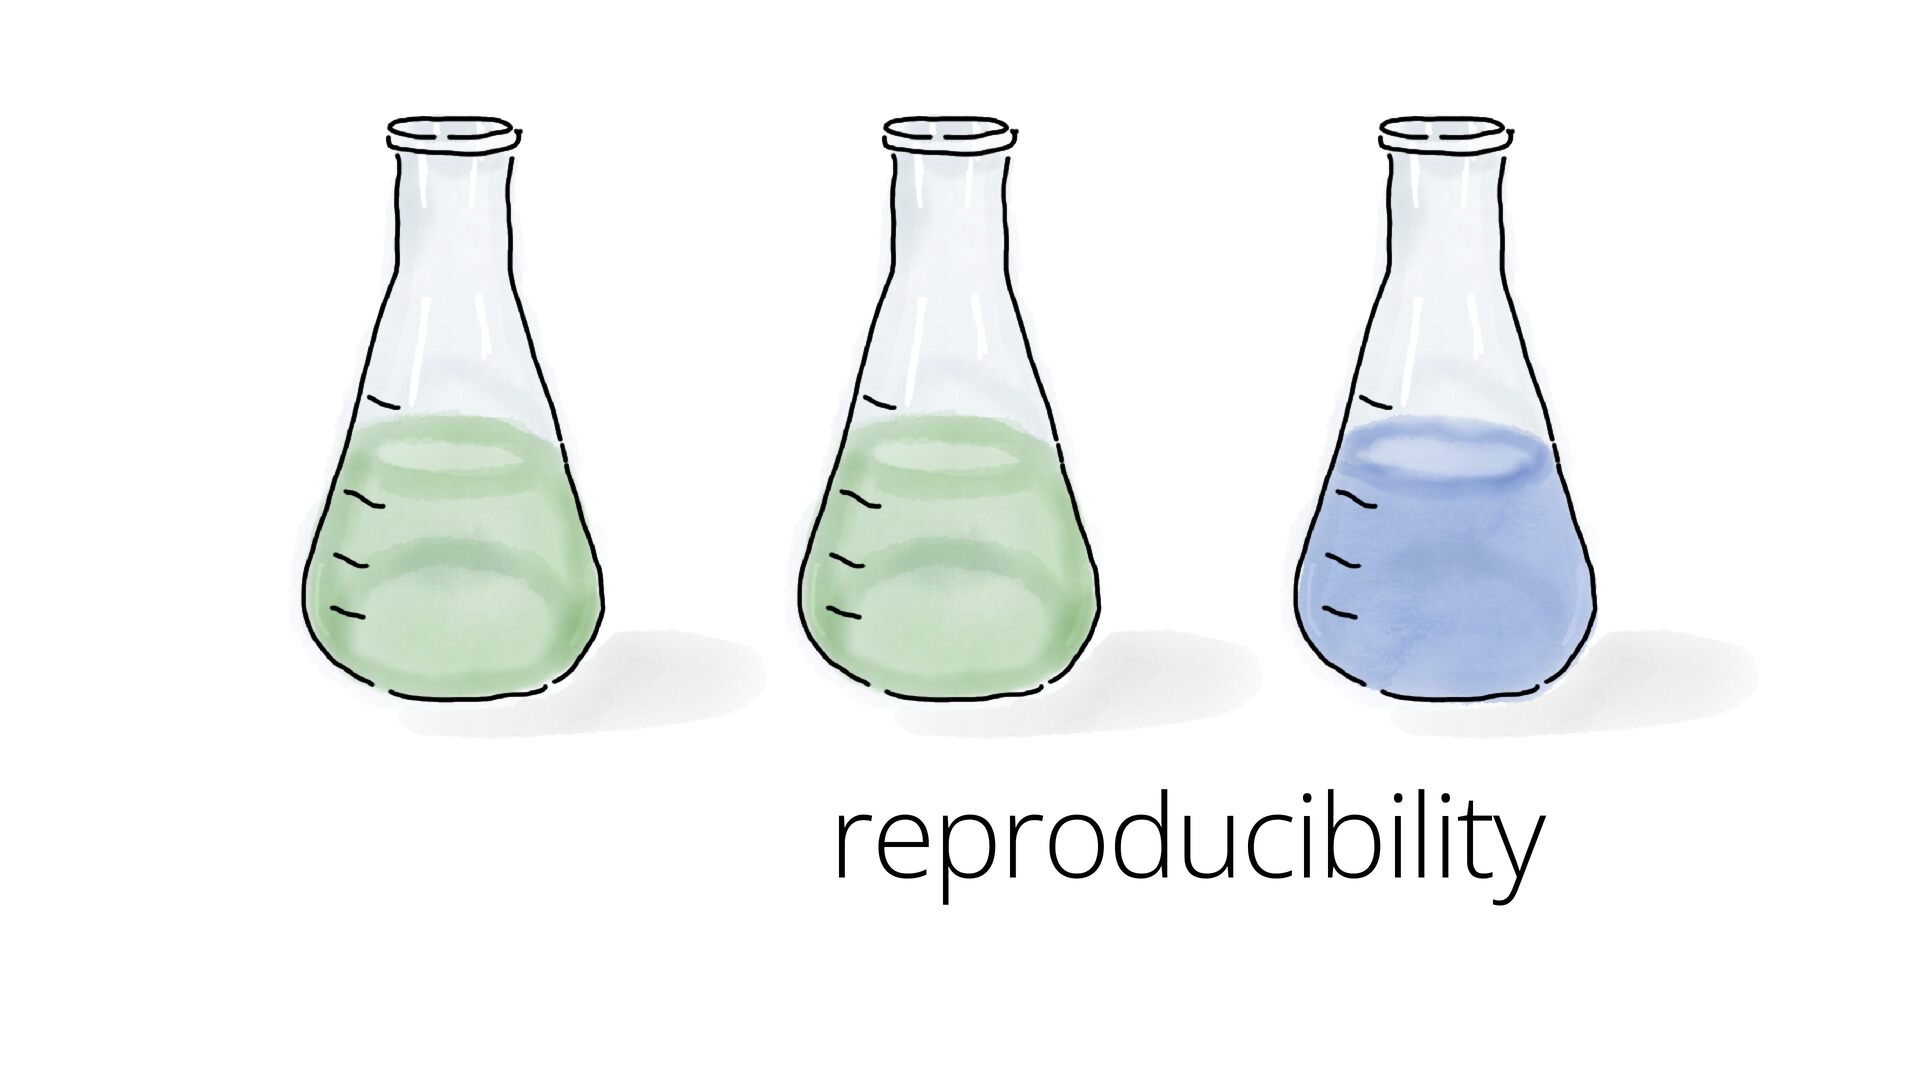
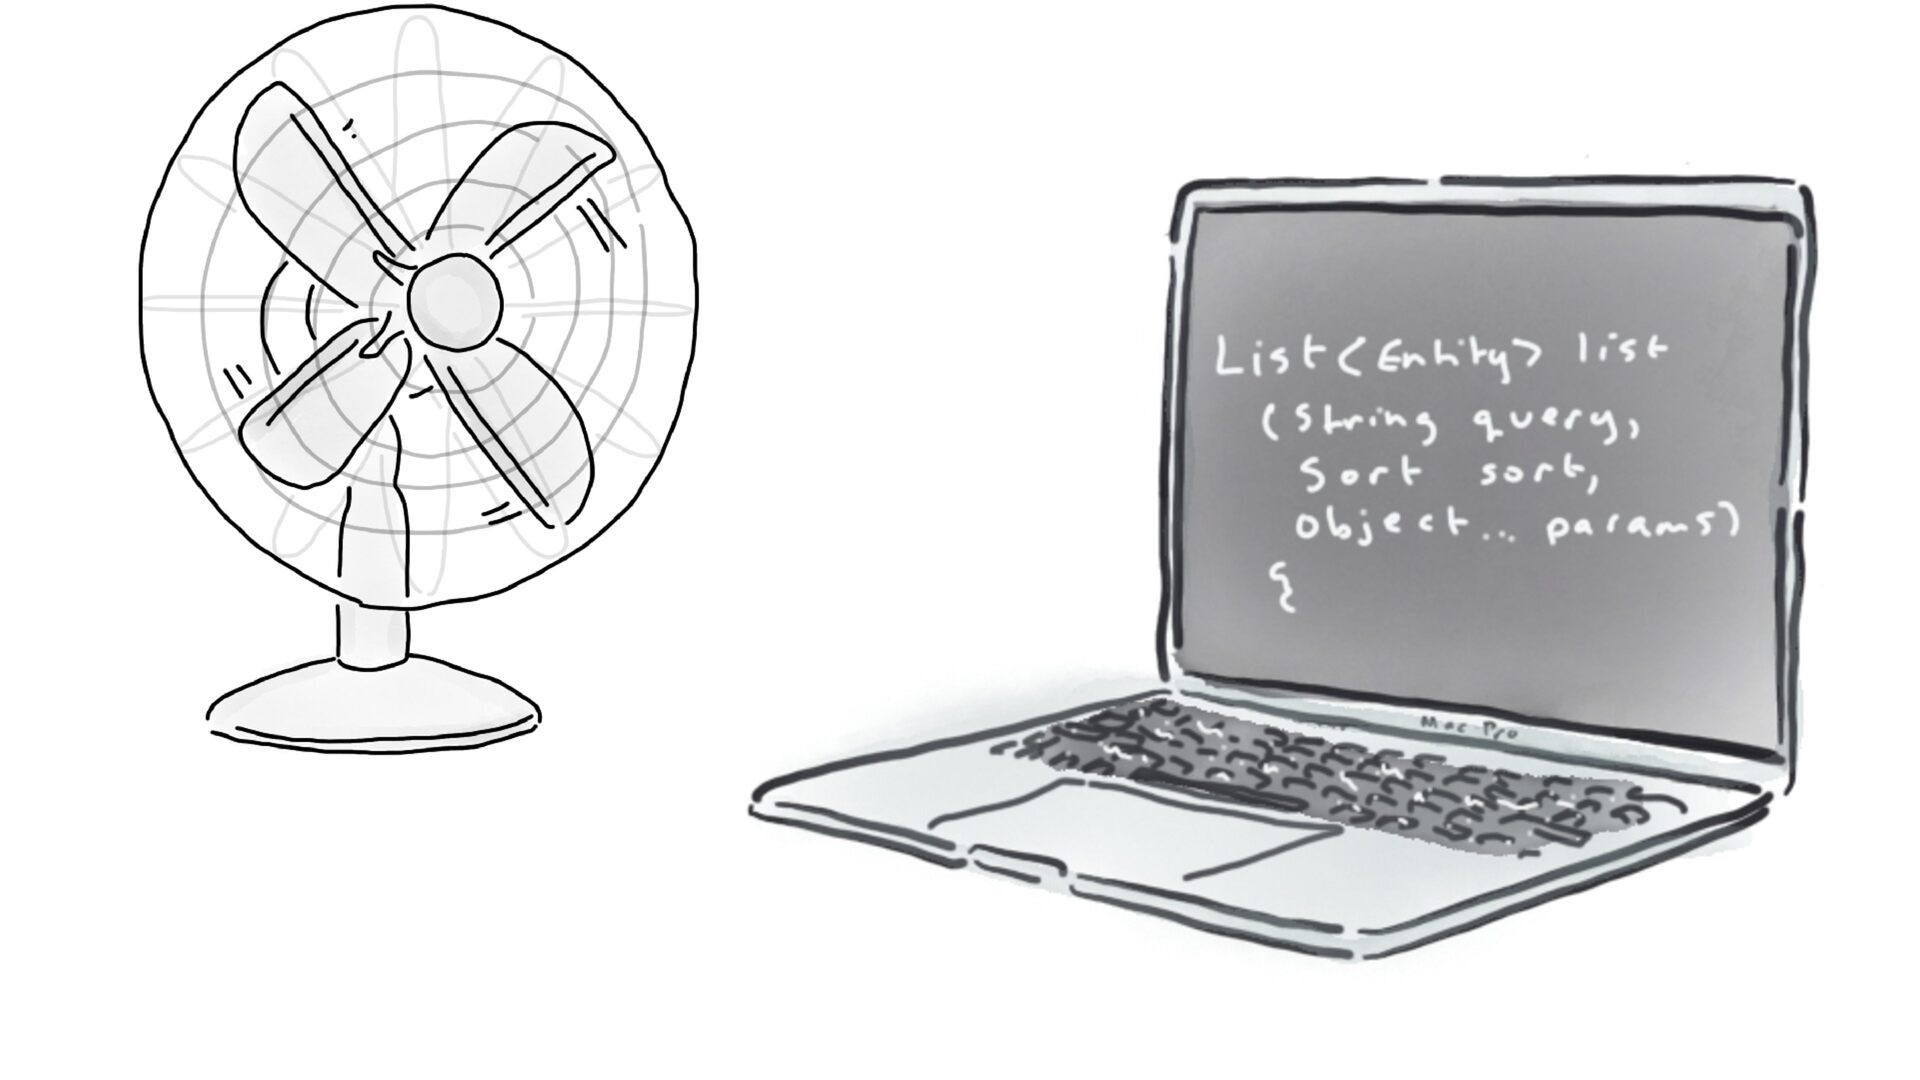
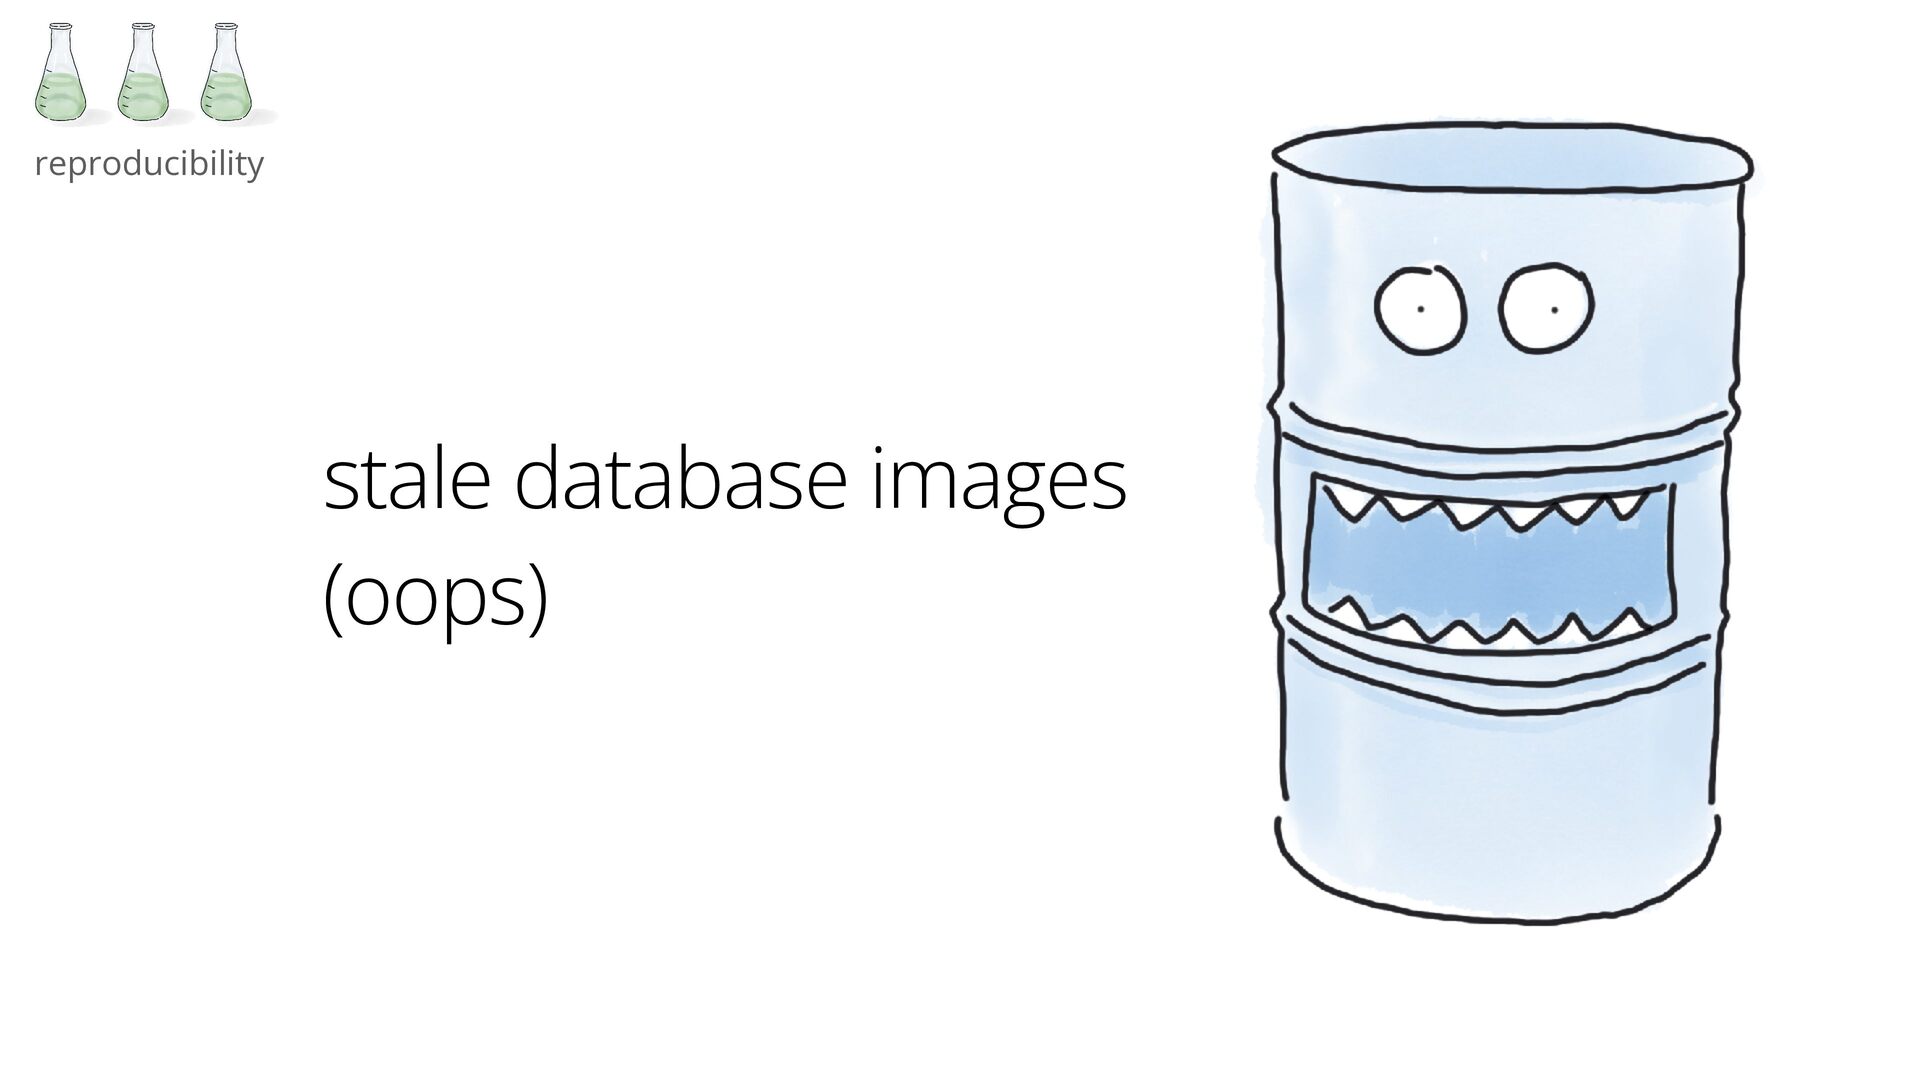
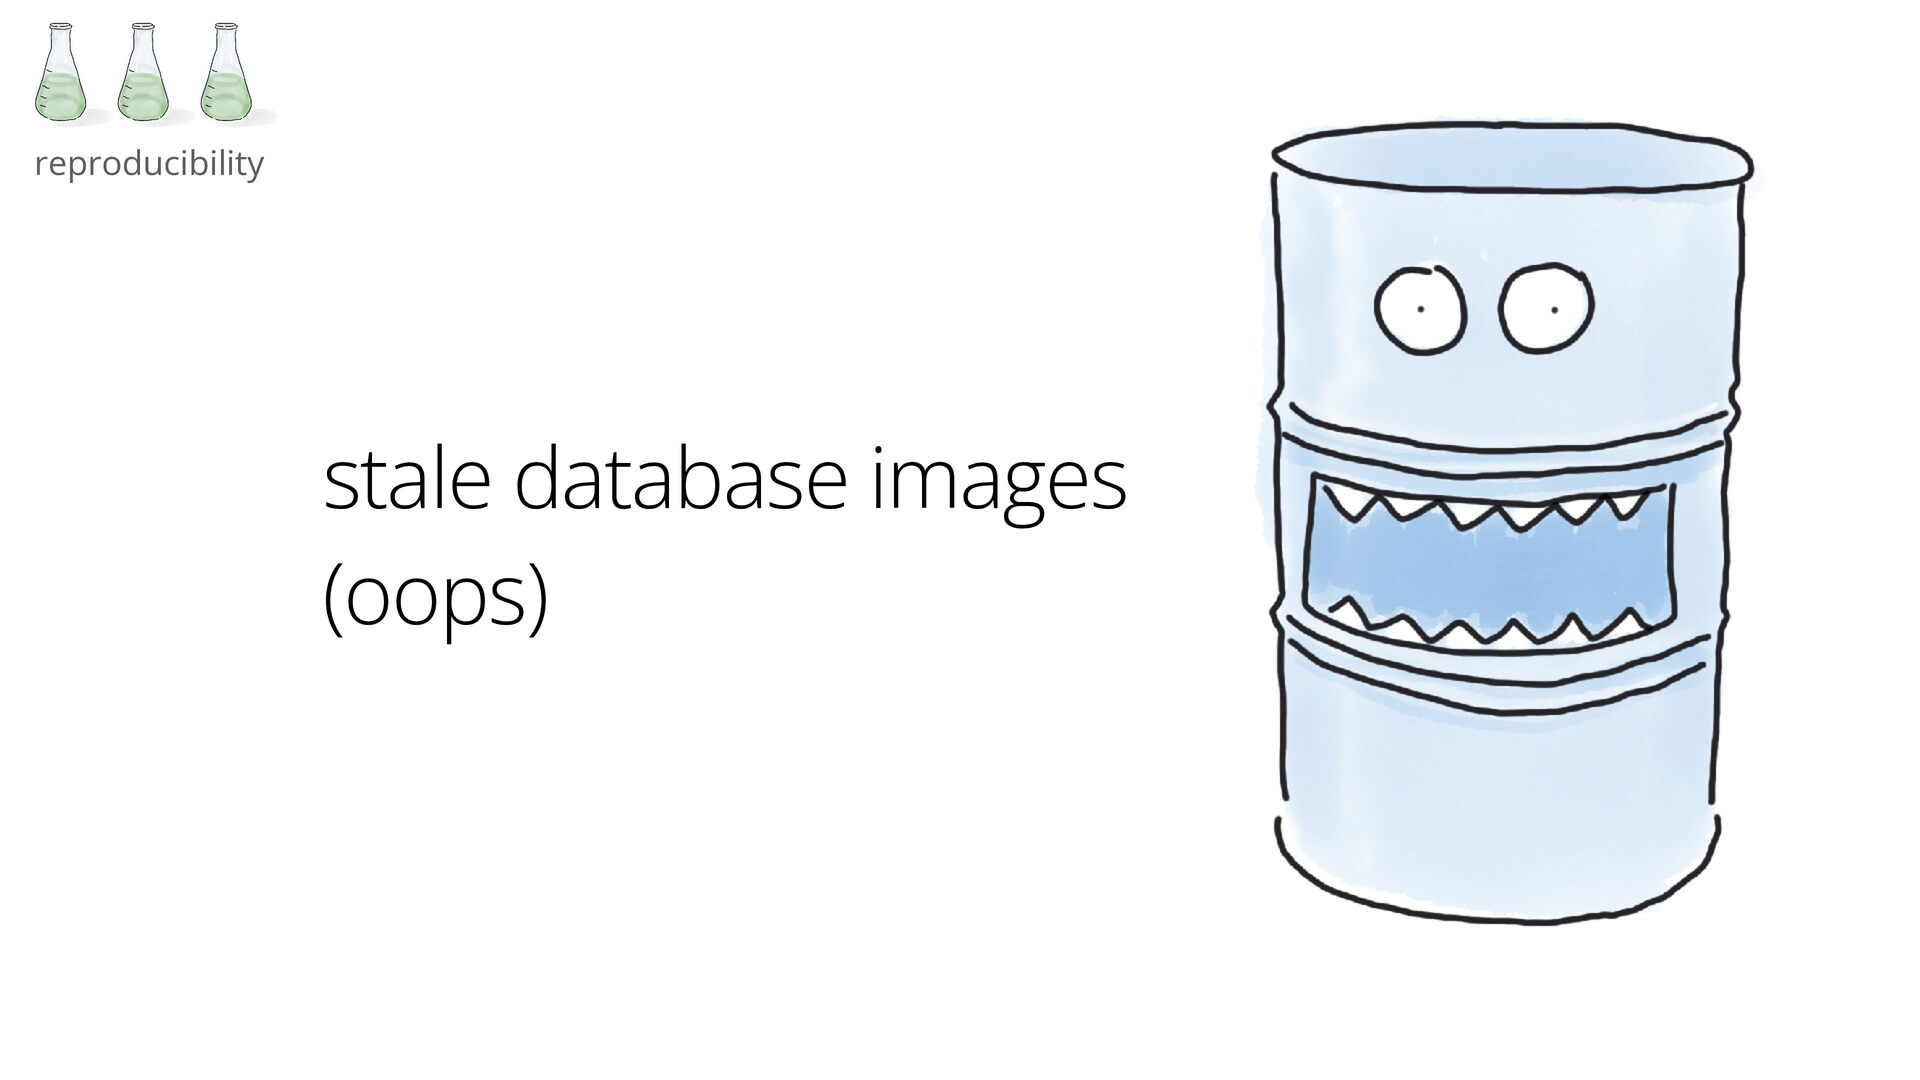
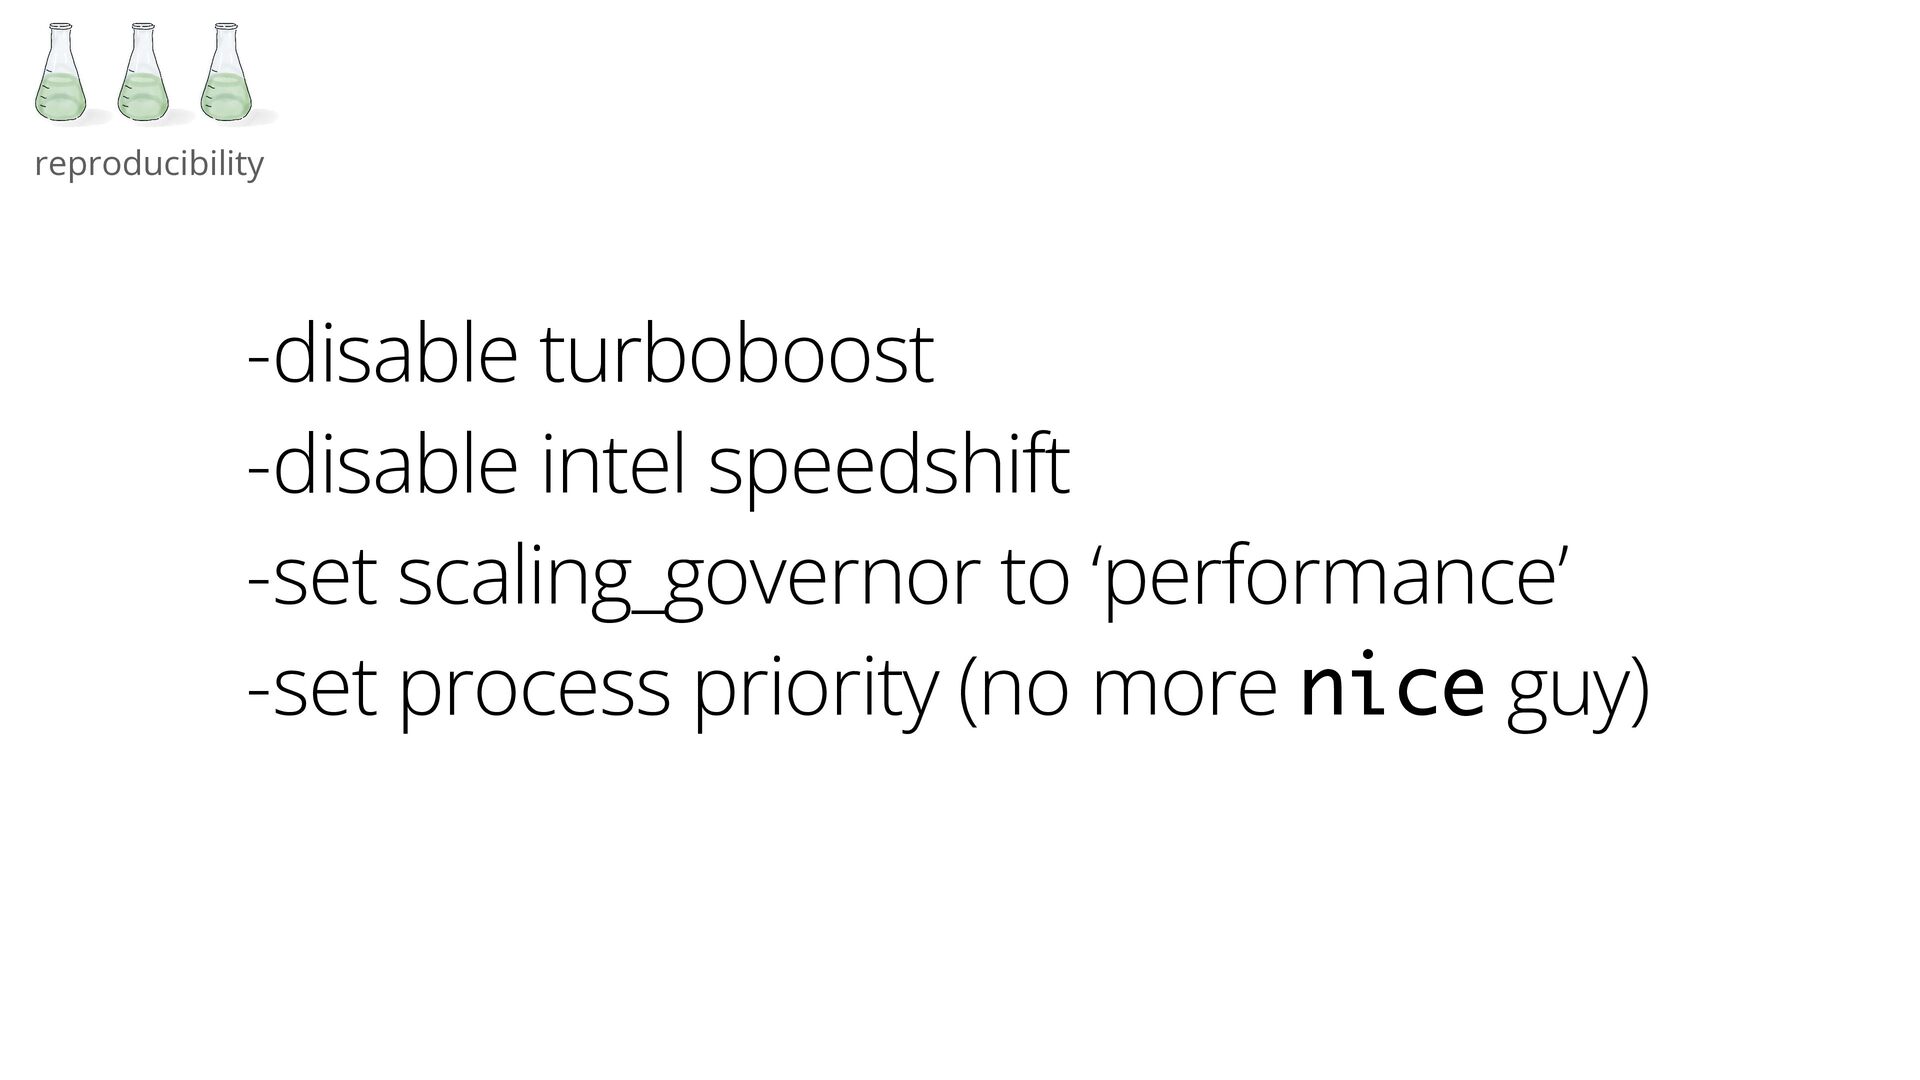
reproducibility -disable turboboost -disable intel speedshift -set scaling_governor to ‘performance’
-set process priority (no more nice guy) -
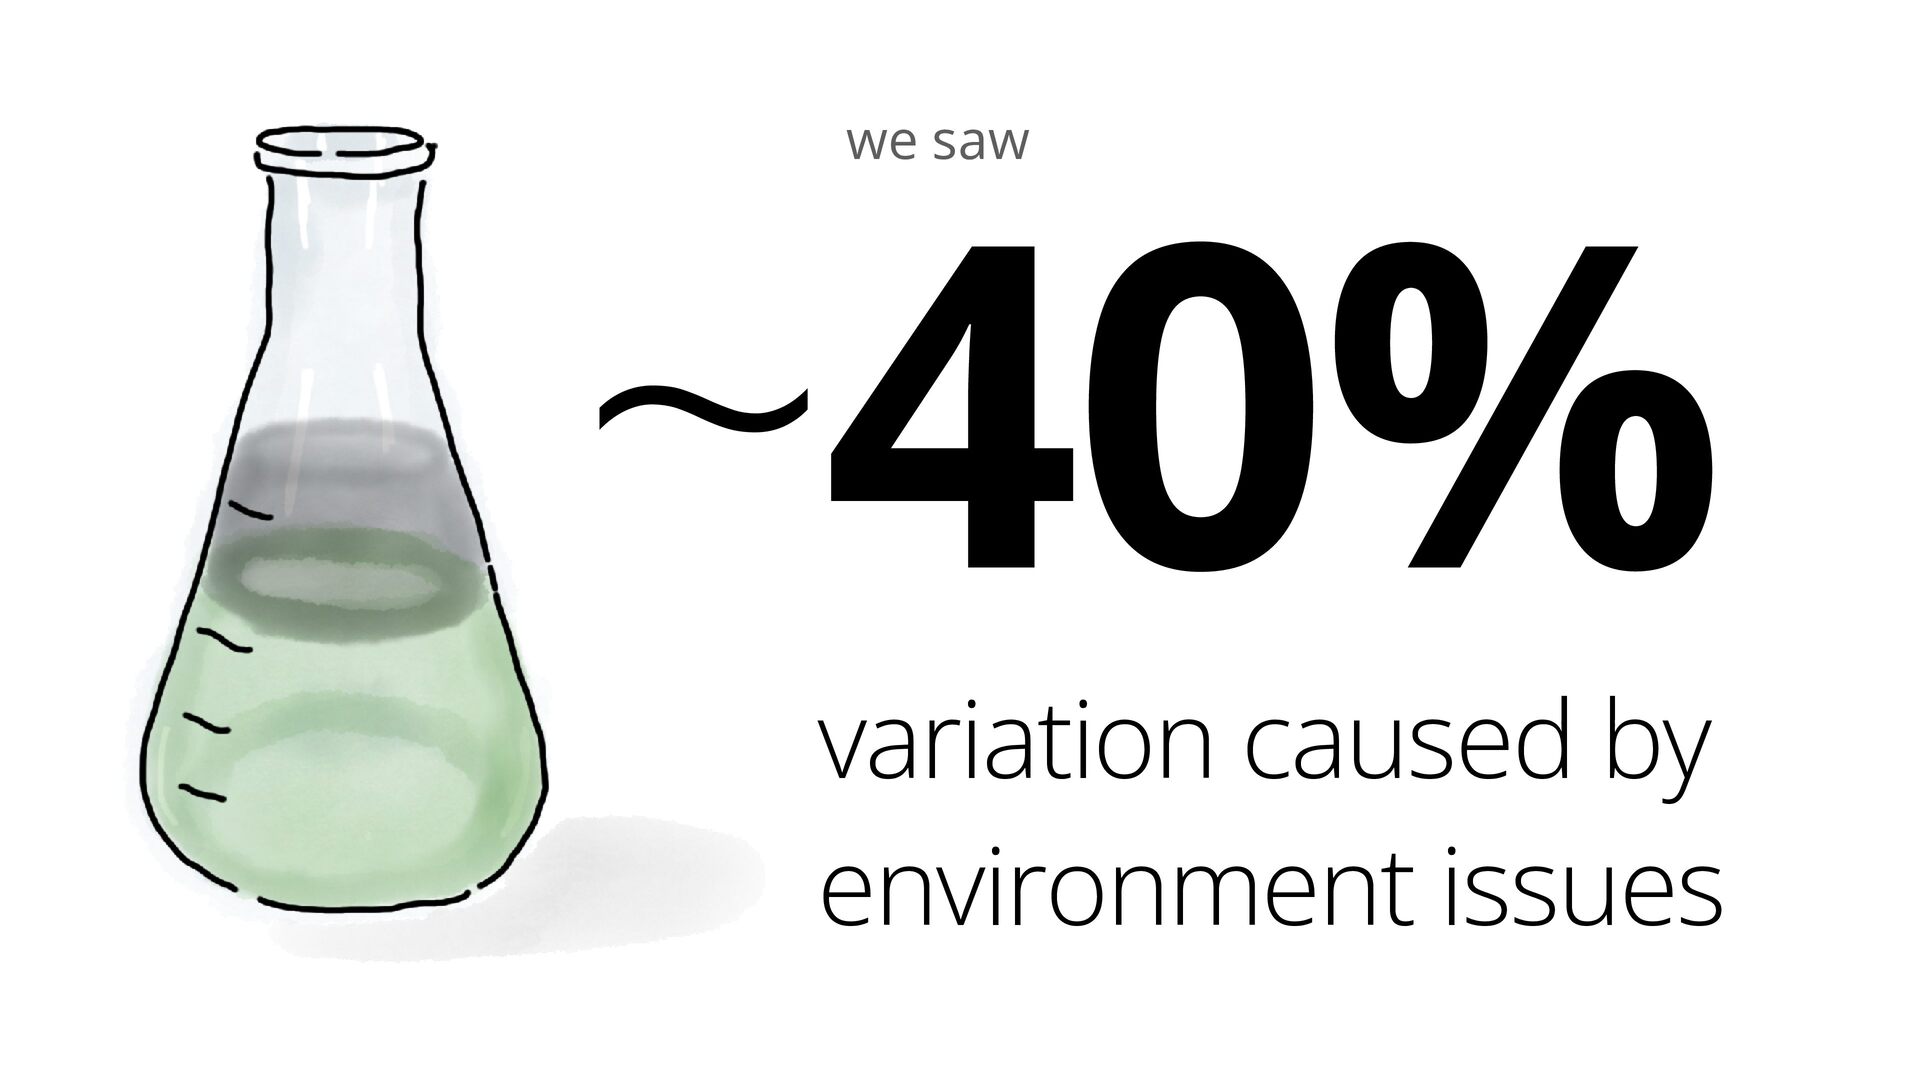
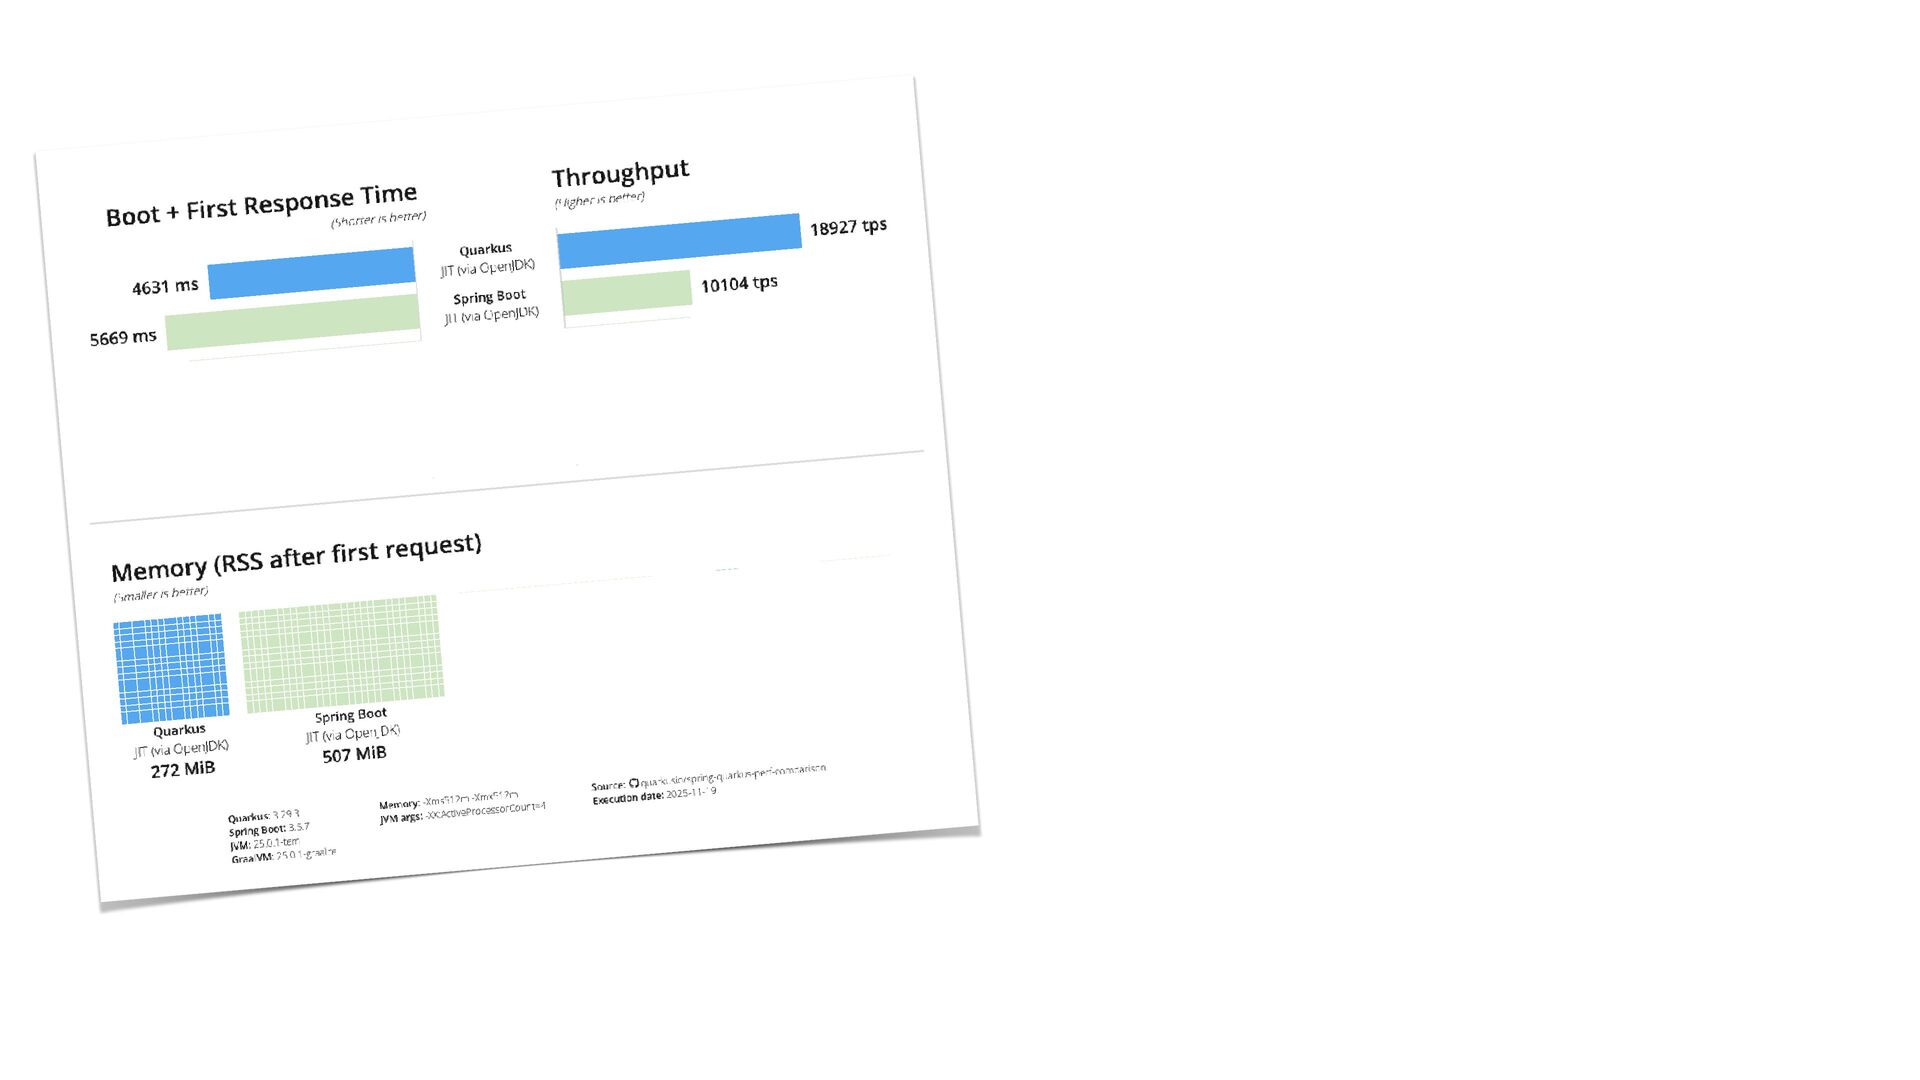
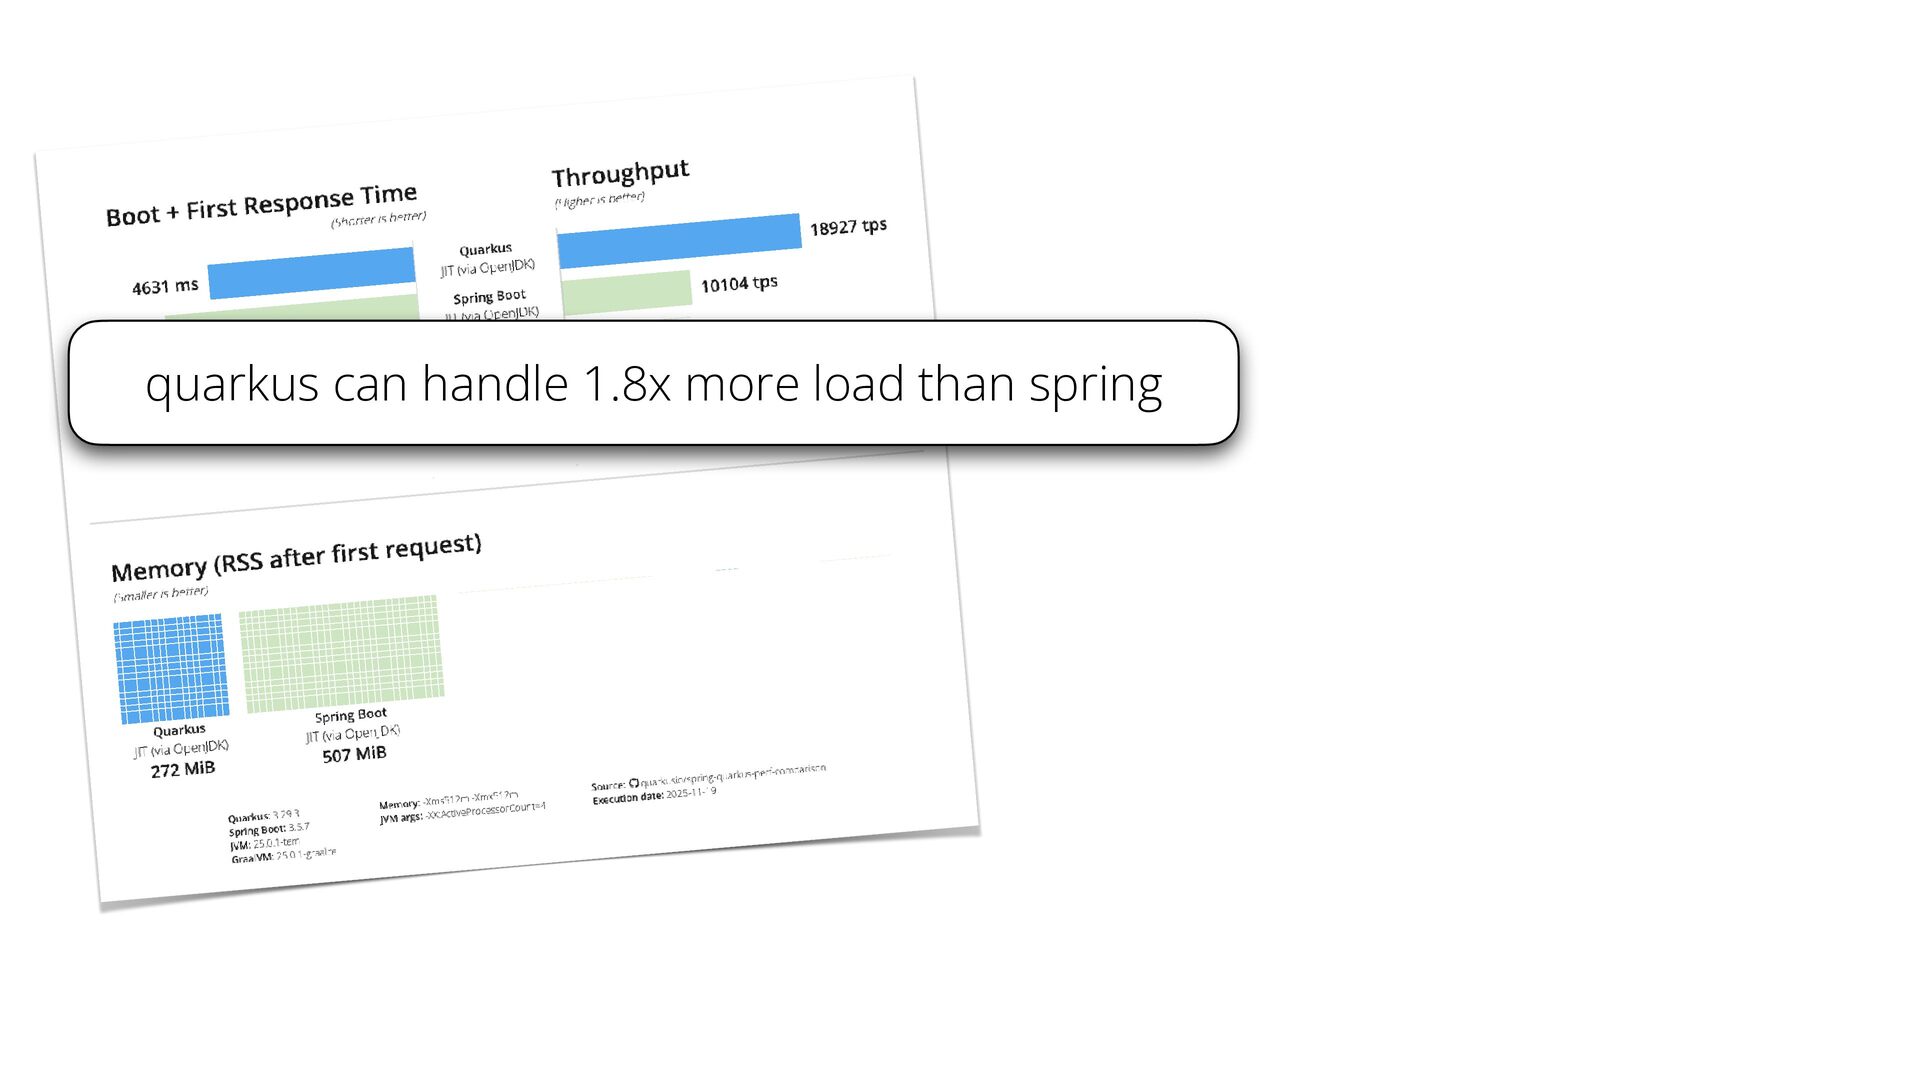
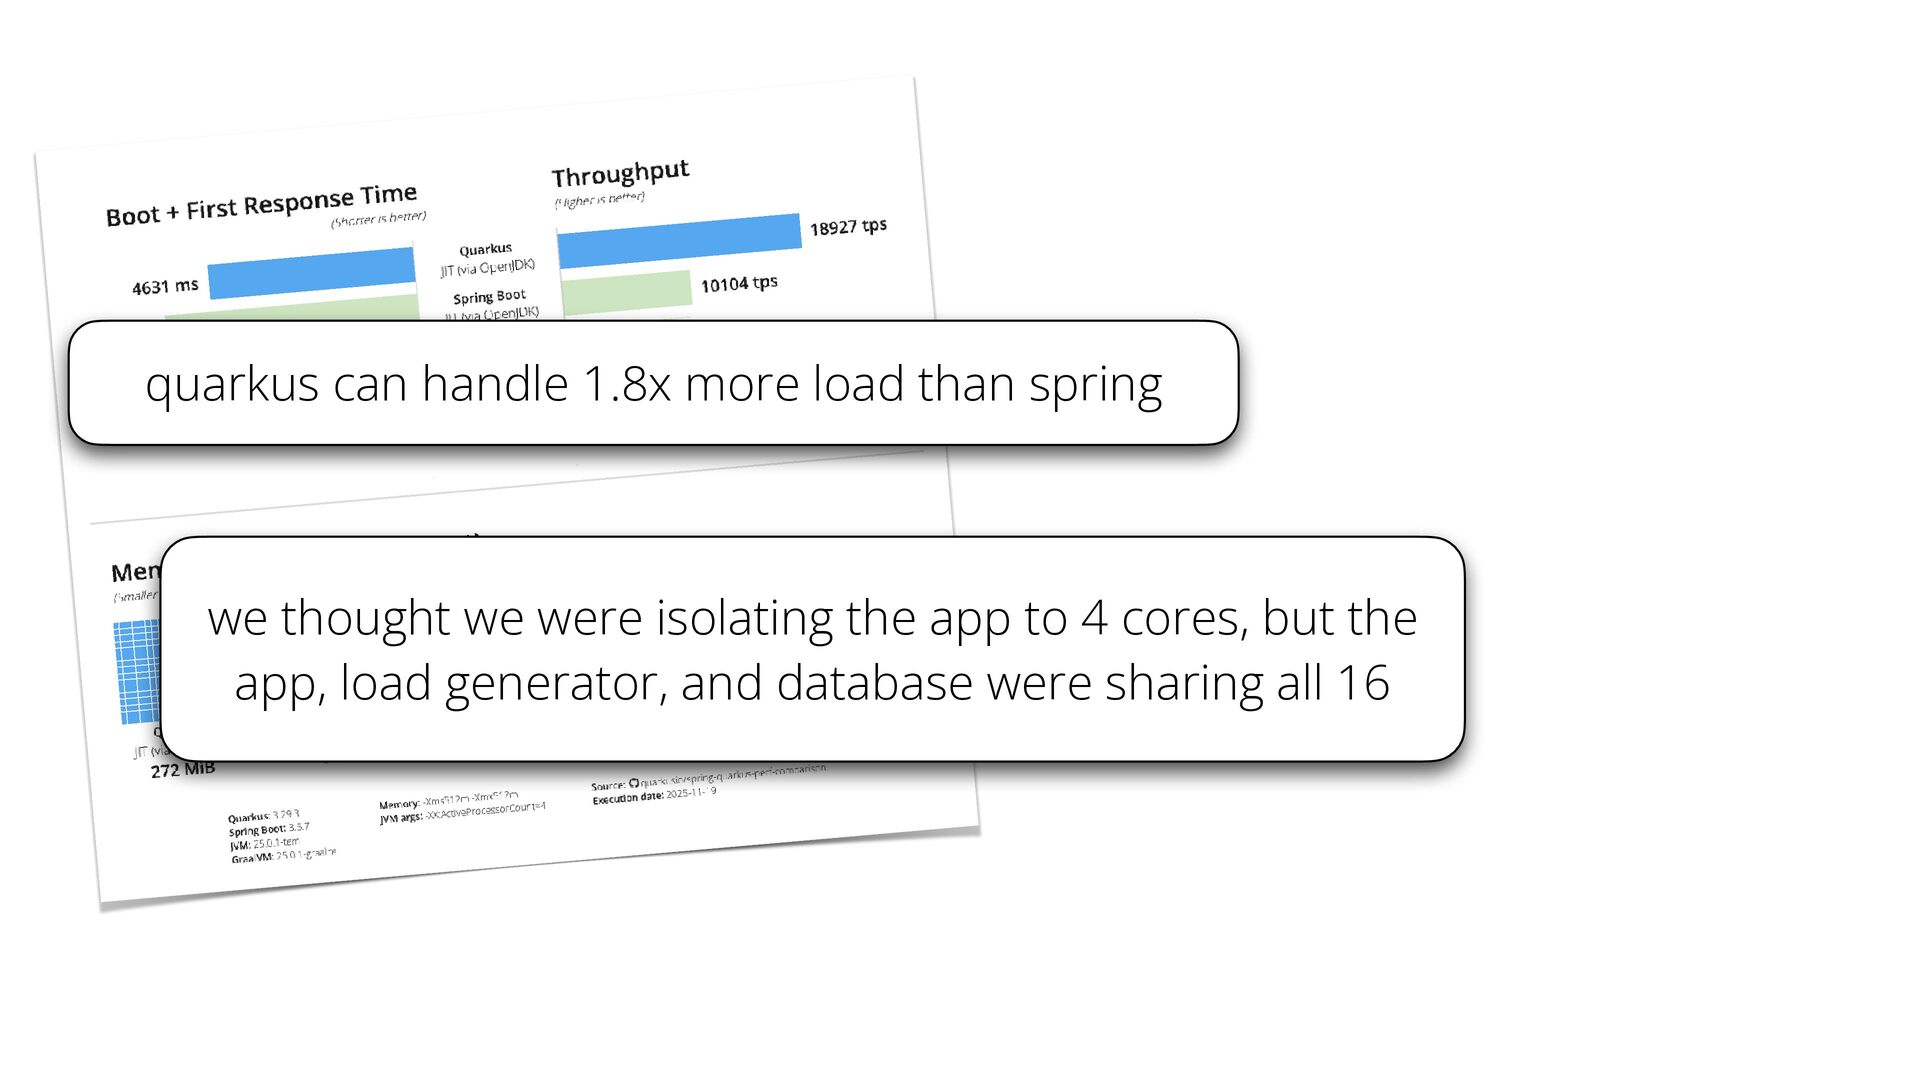
quarkus can handle 1.8x more load than spring we thought
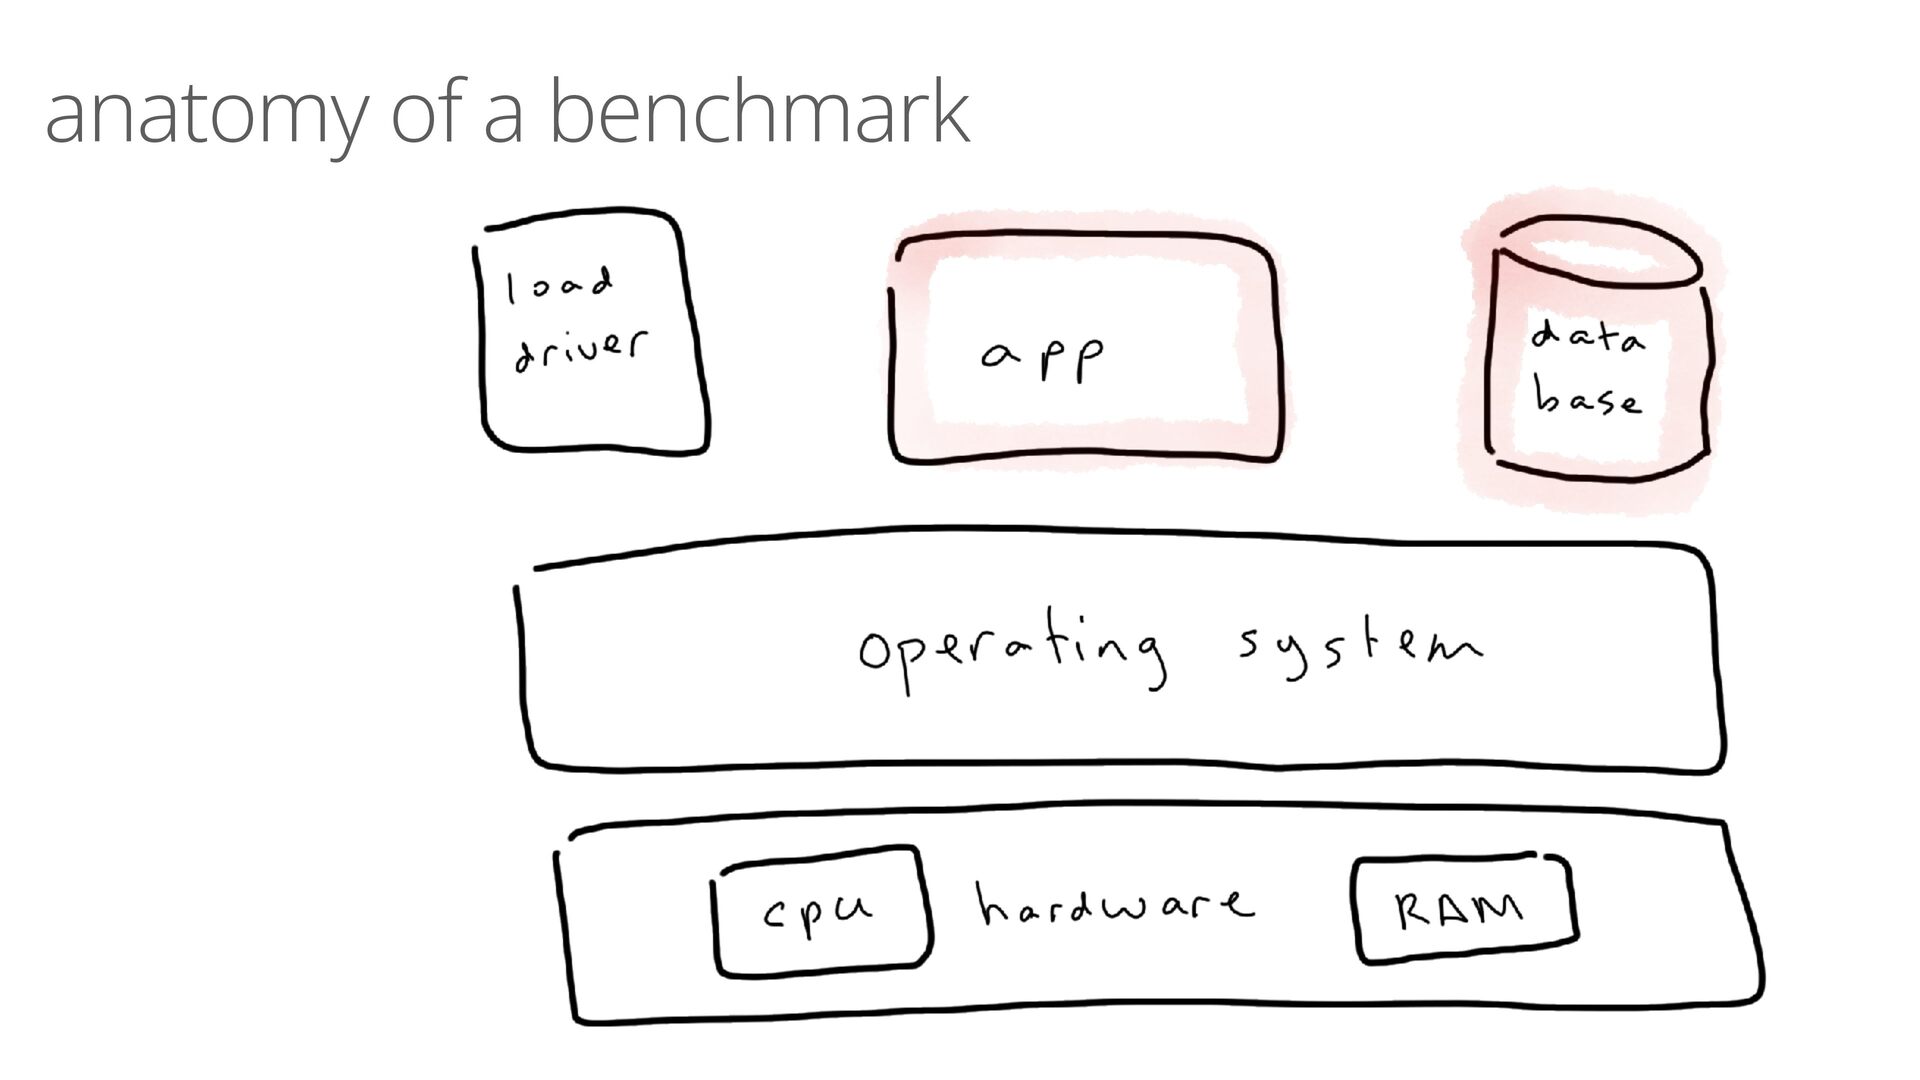
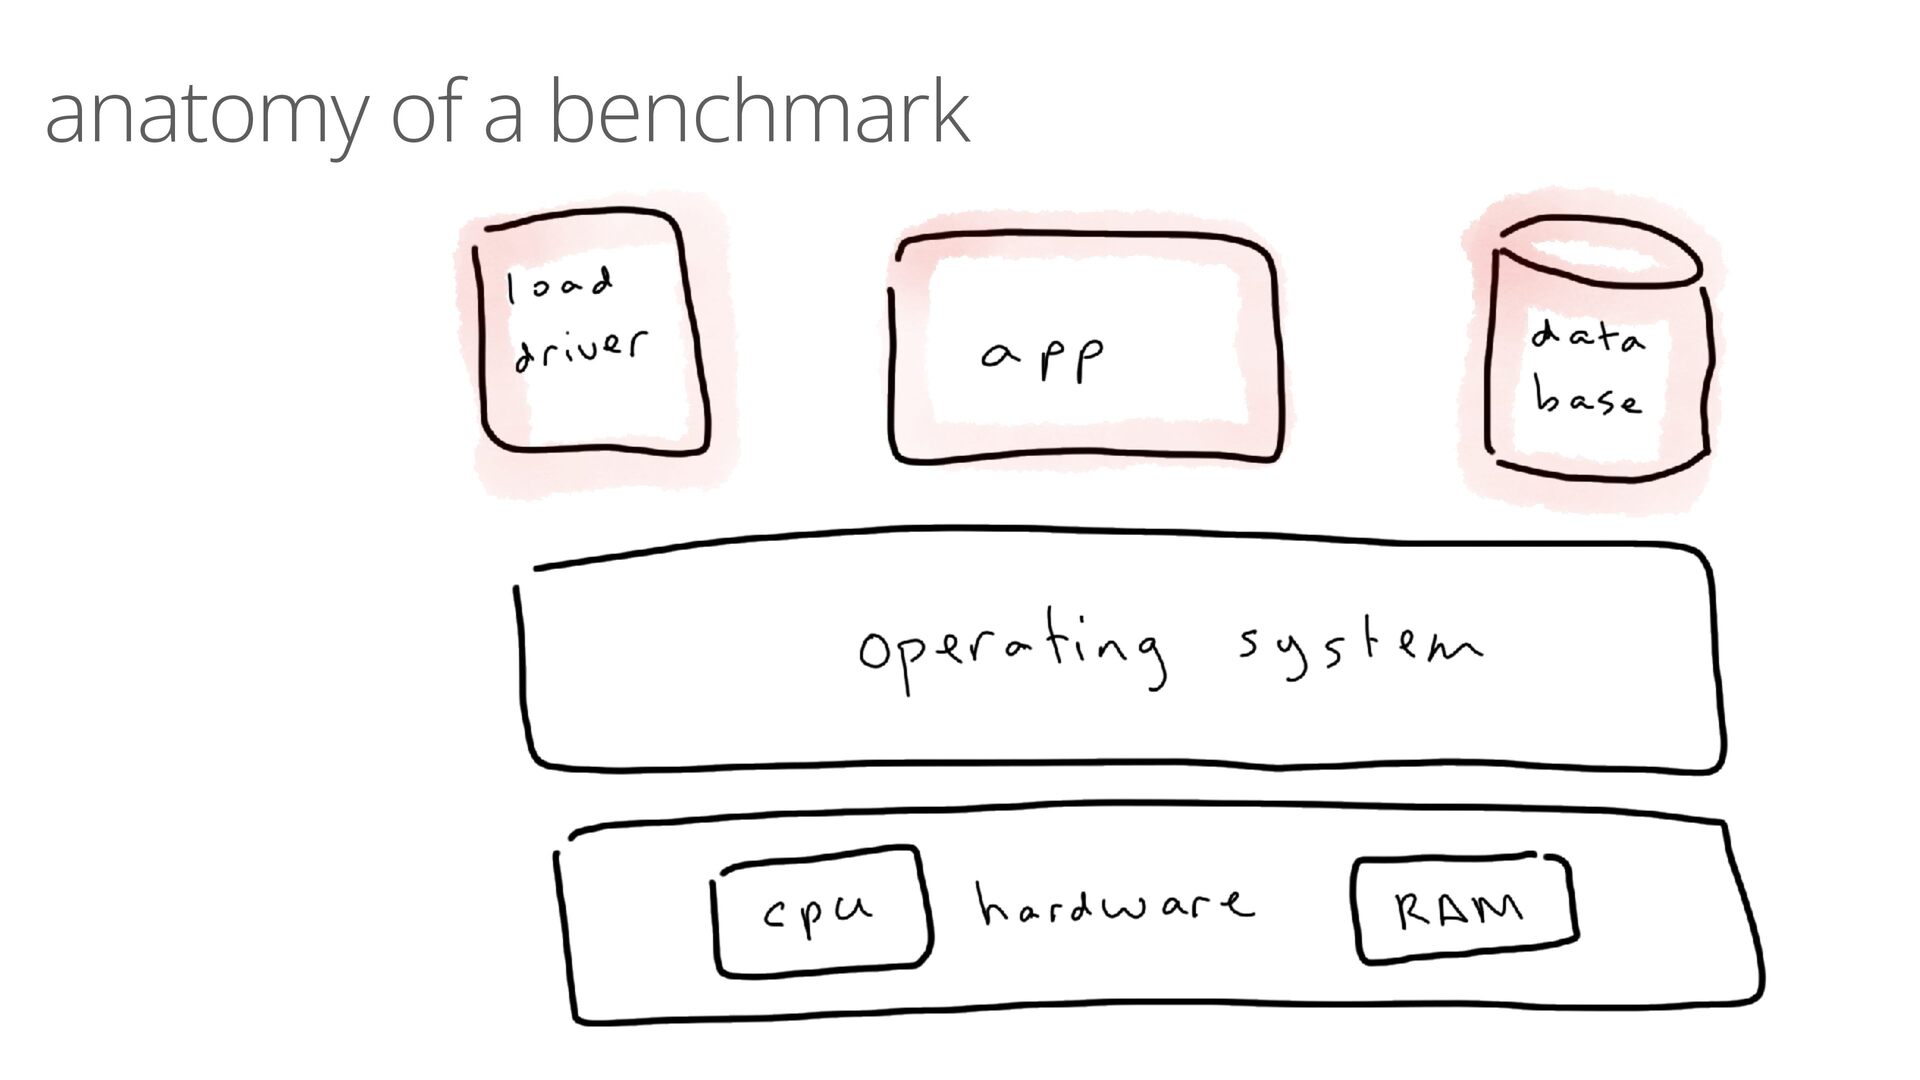
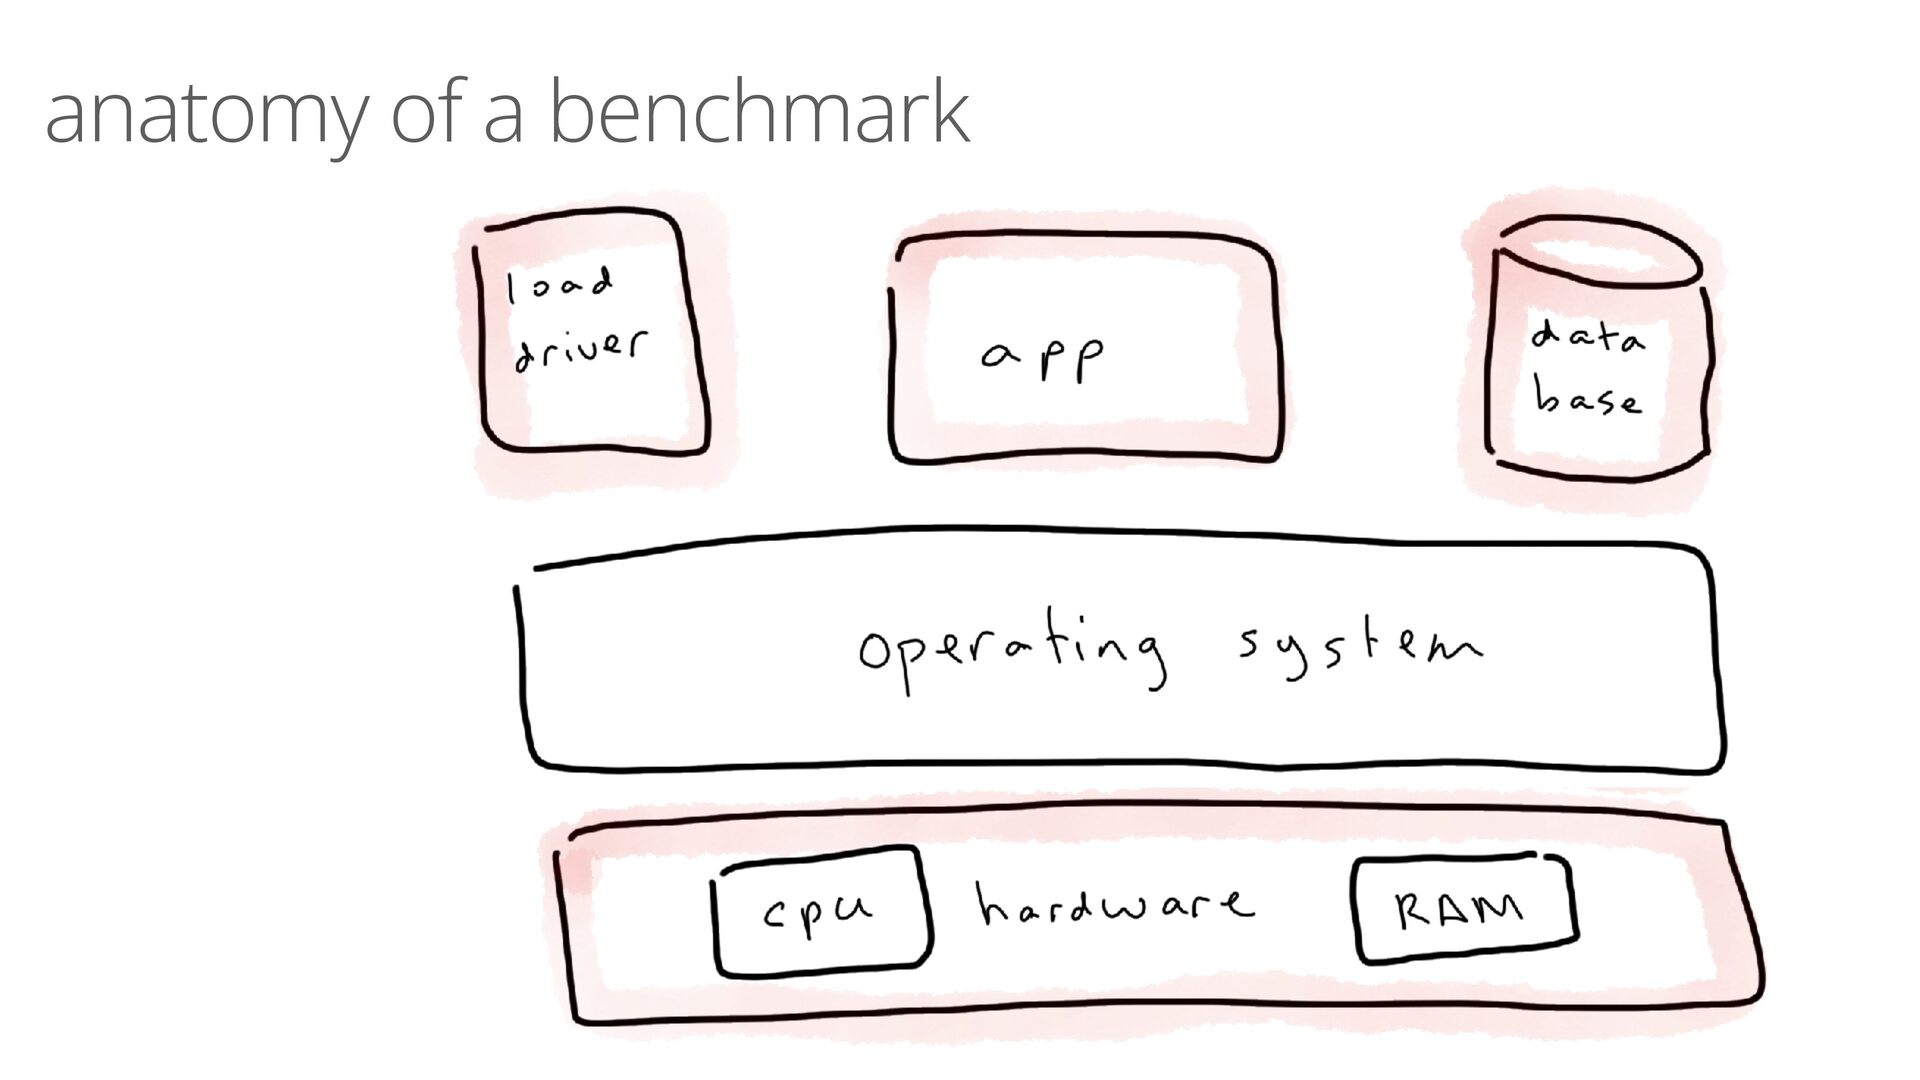
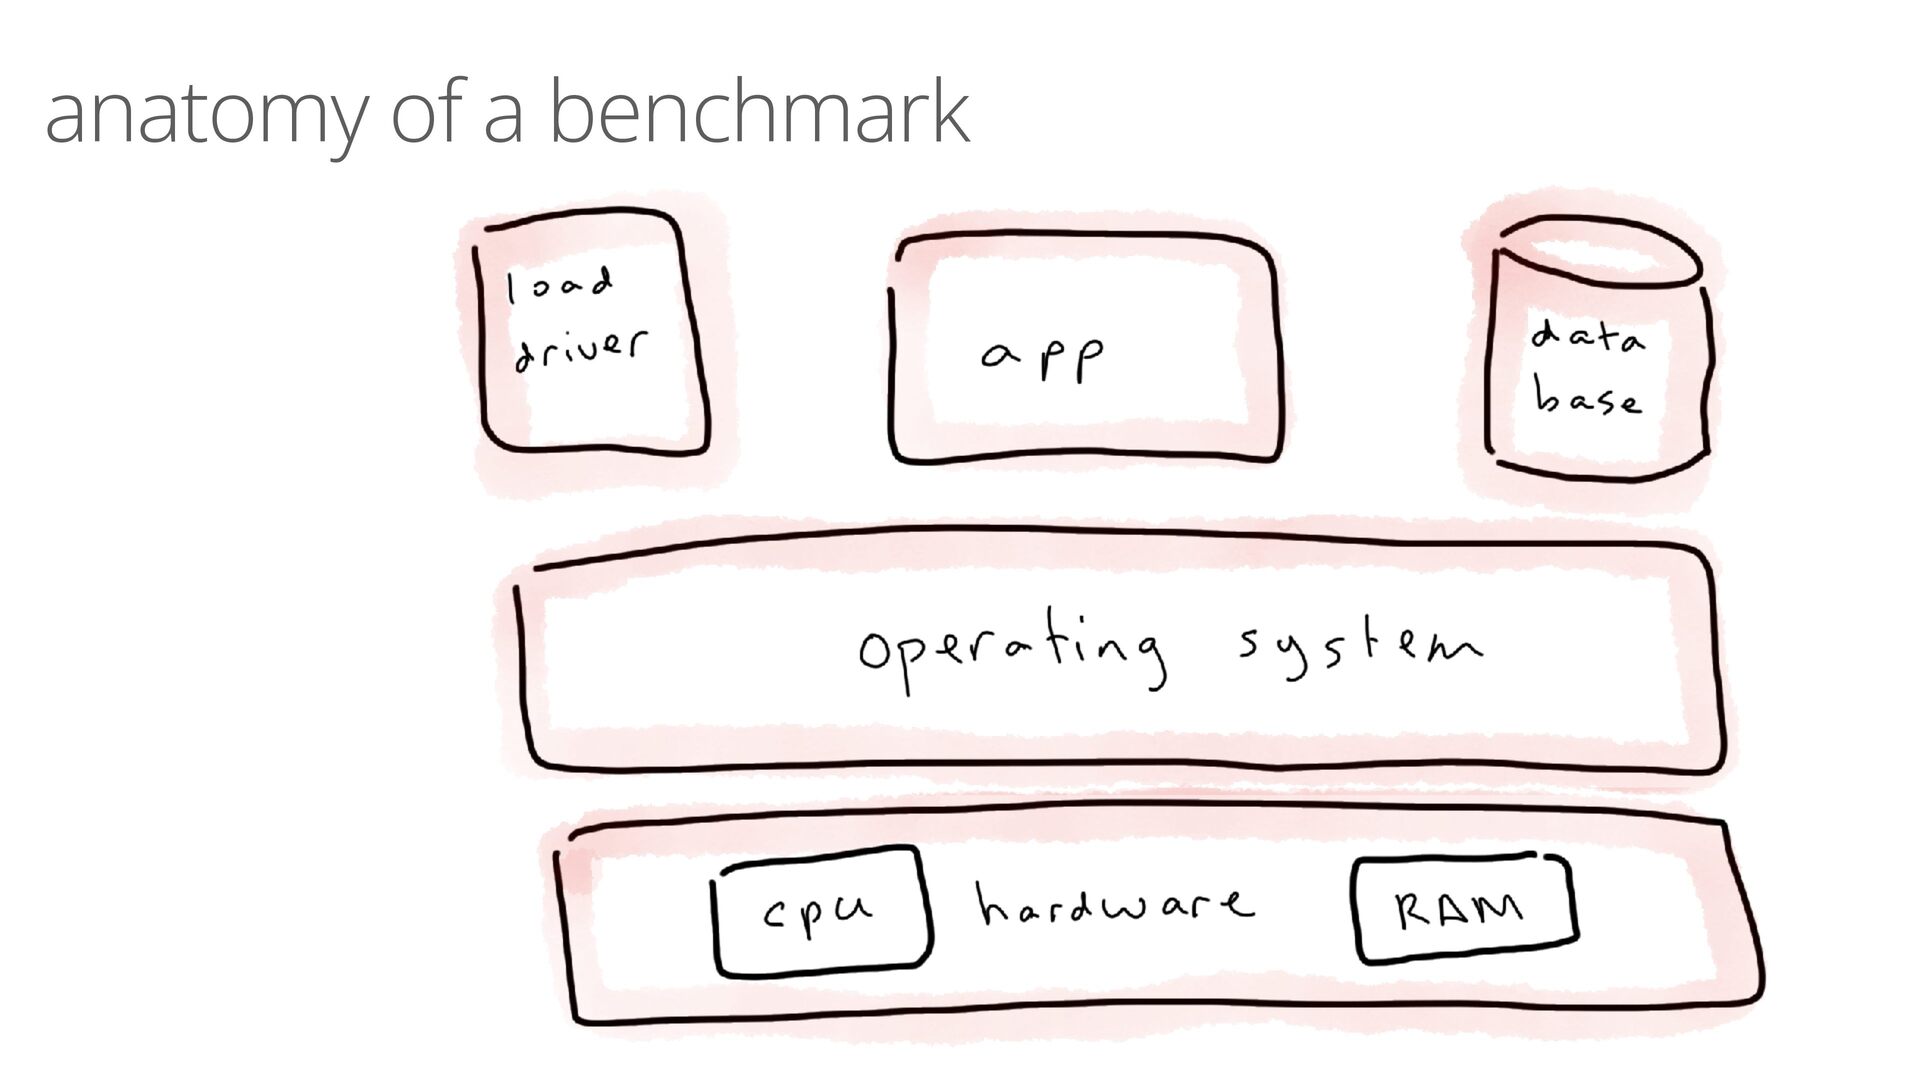
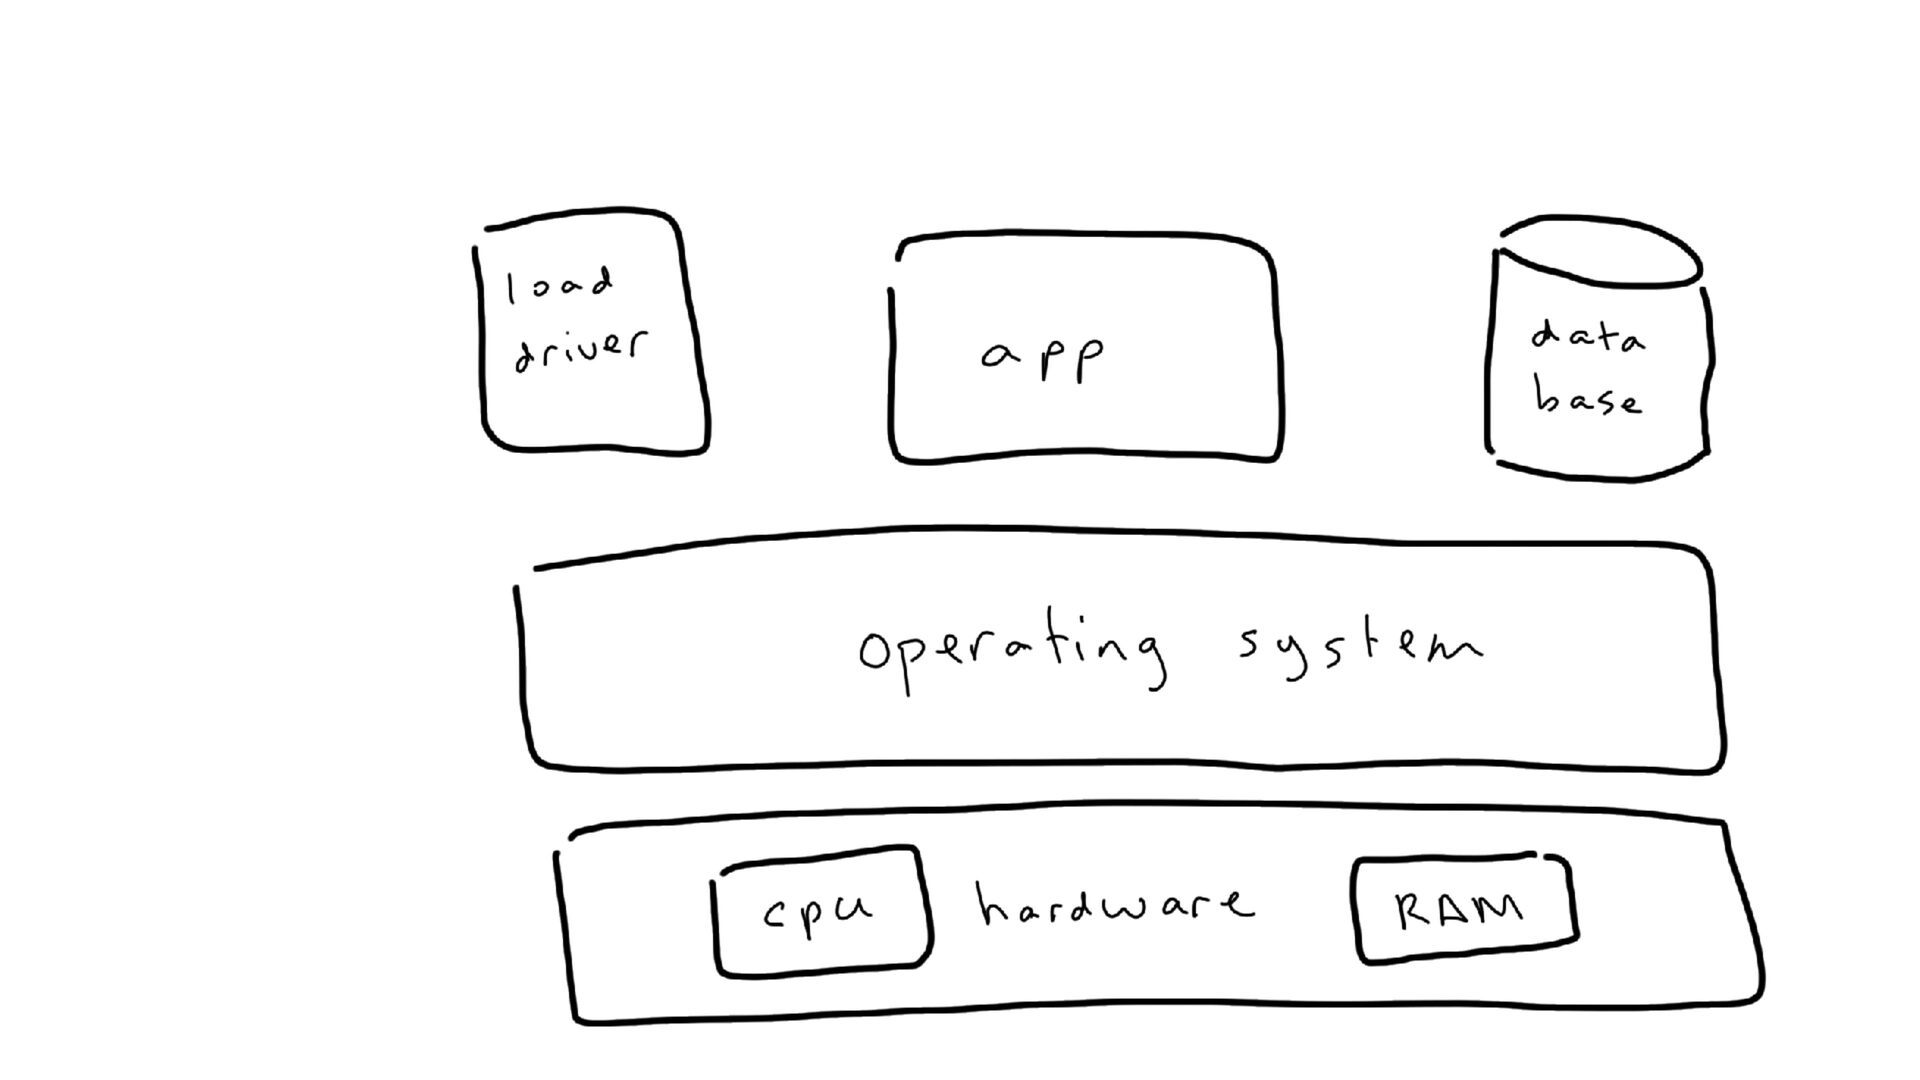
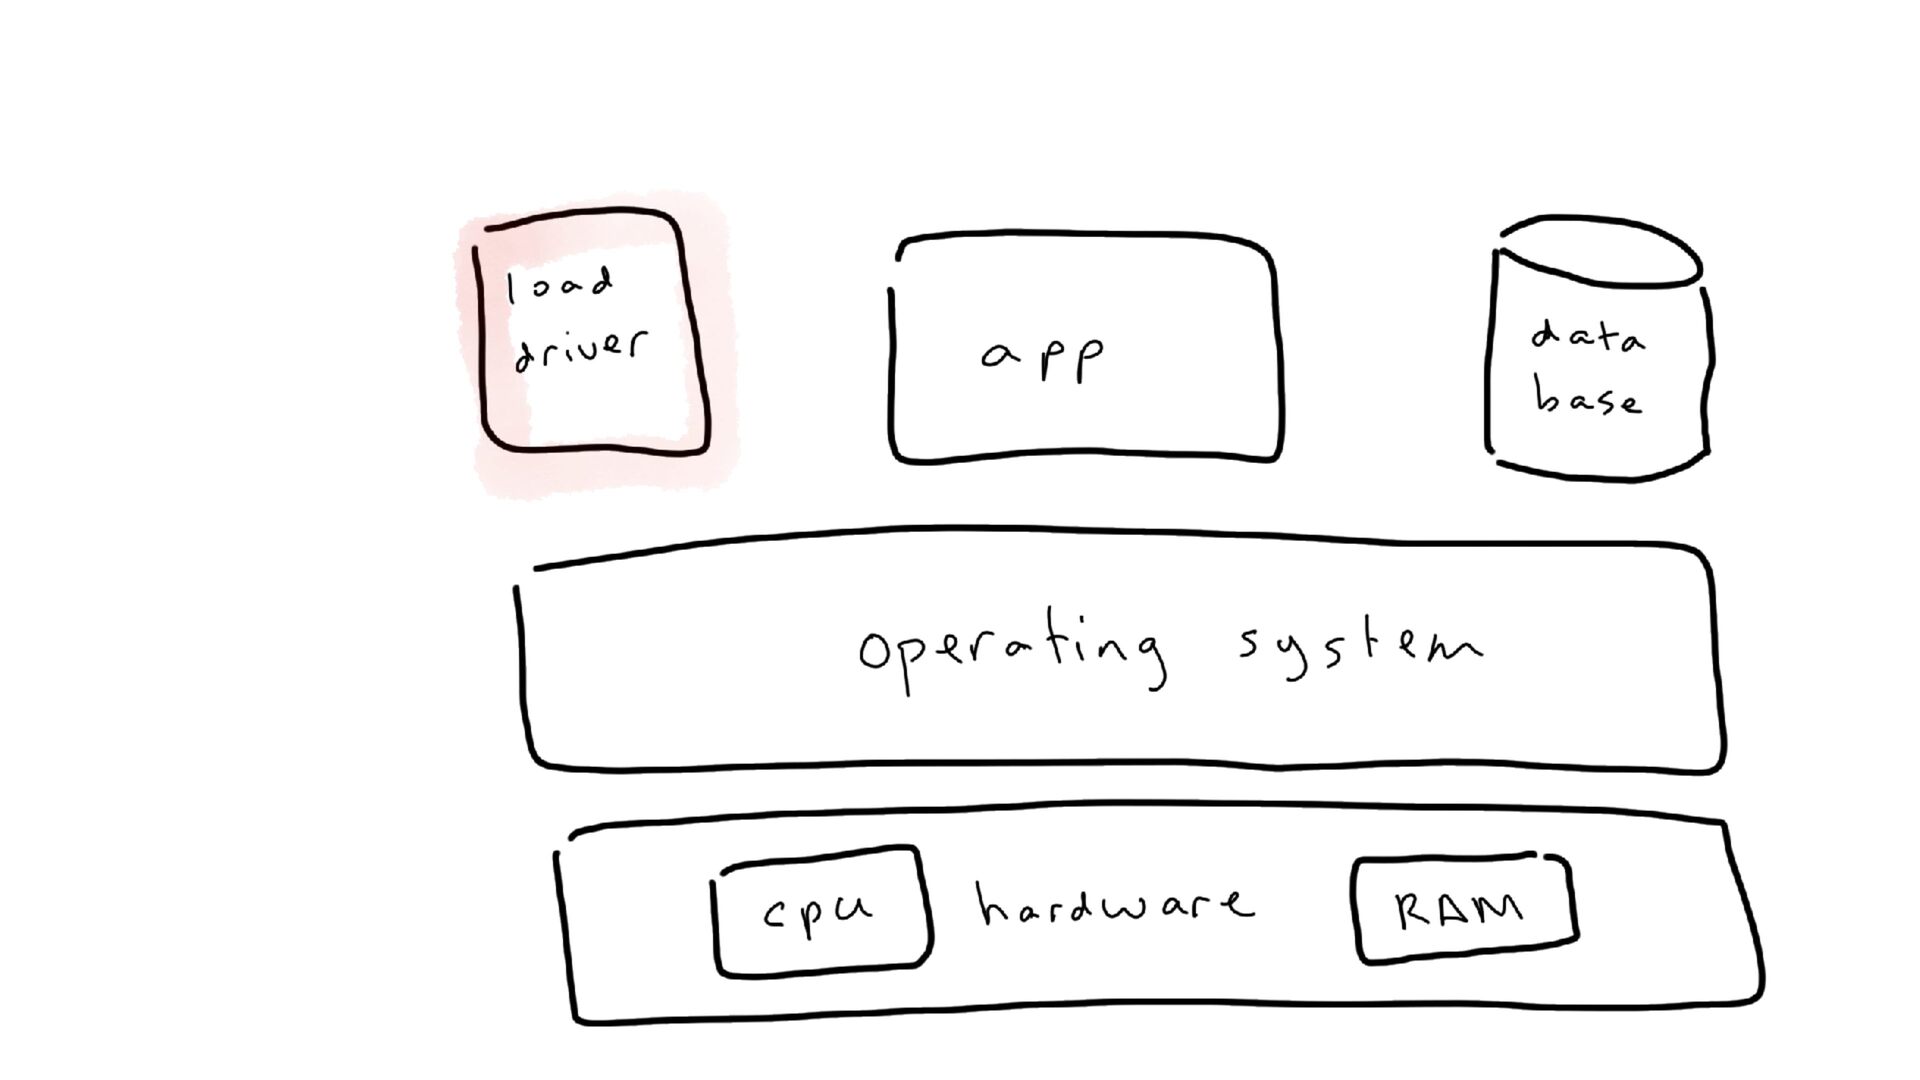
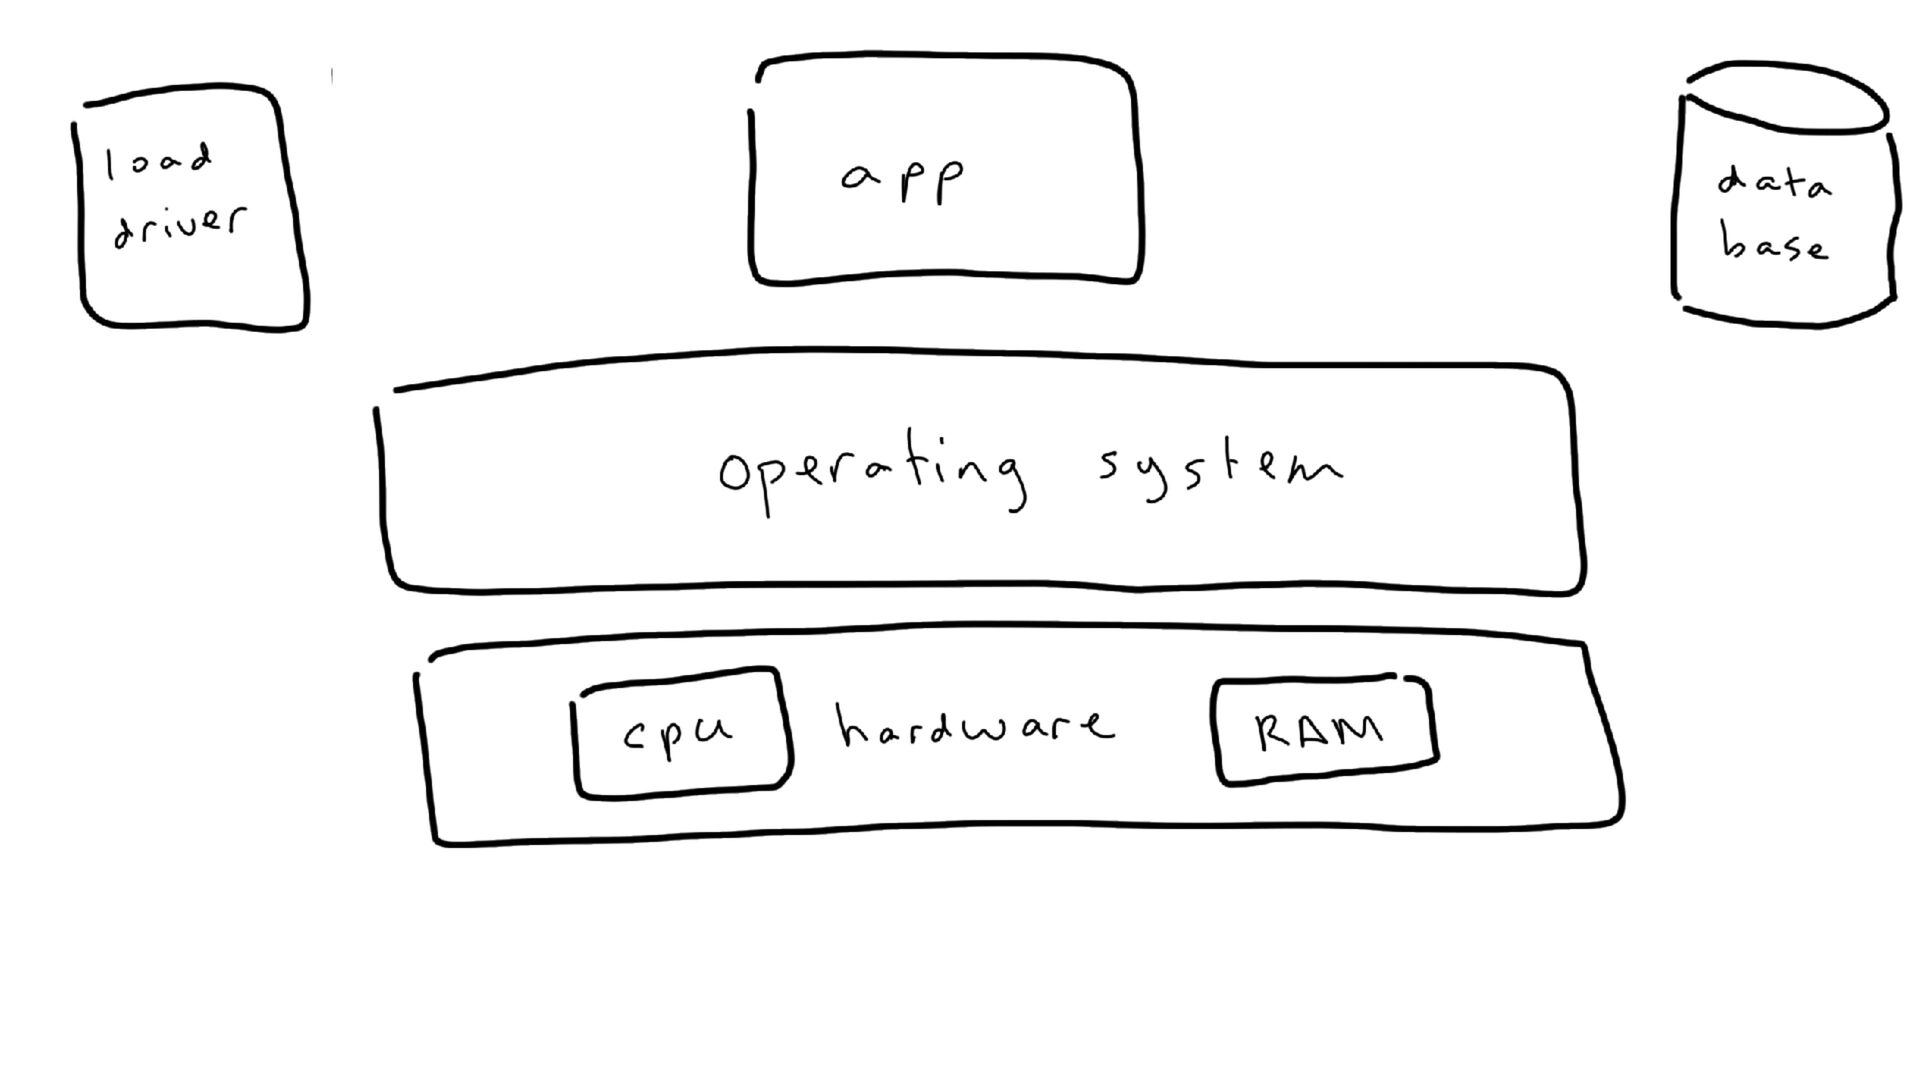
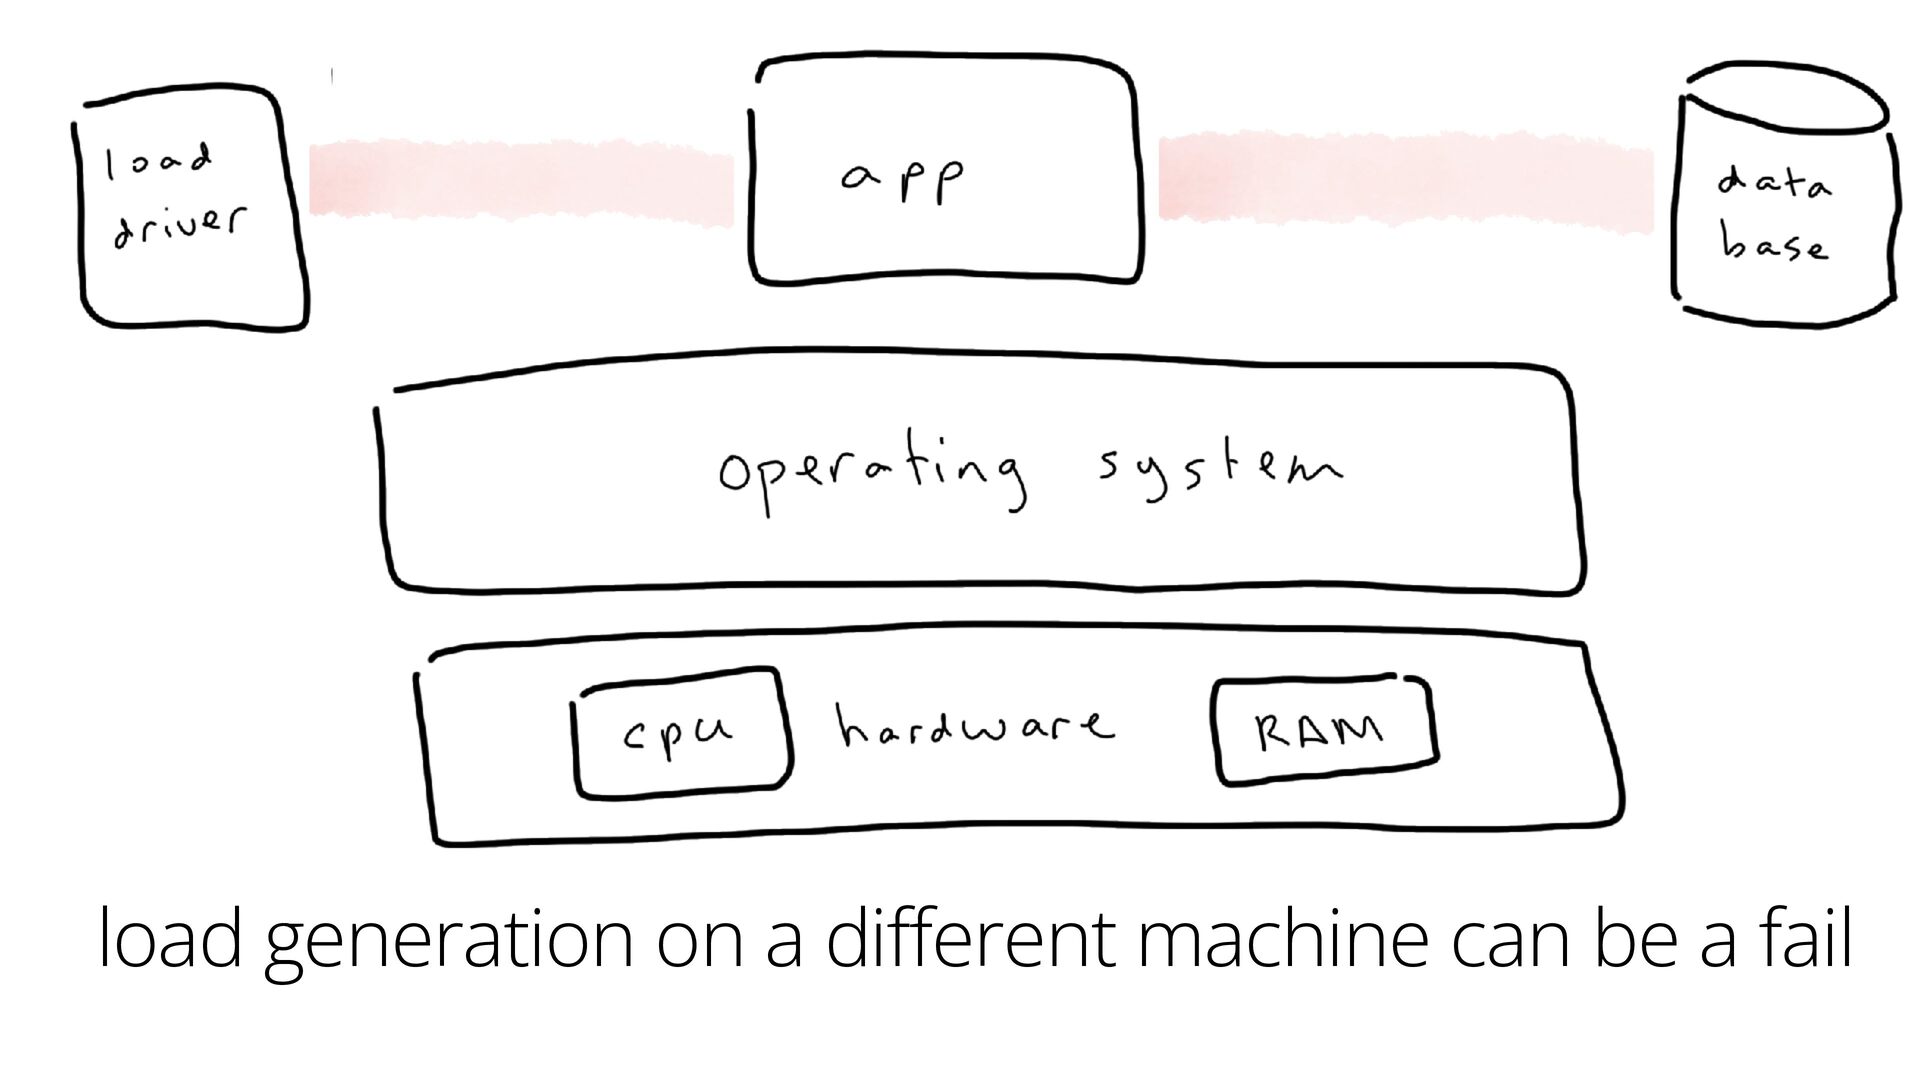
we were isolating the app to 4 cores, but the app, load generator, and database were sharing all 16 -
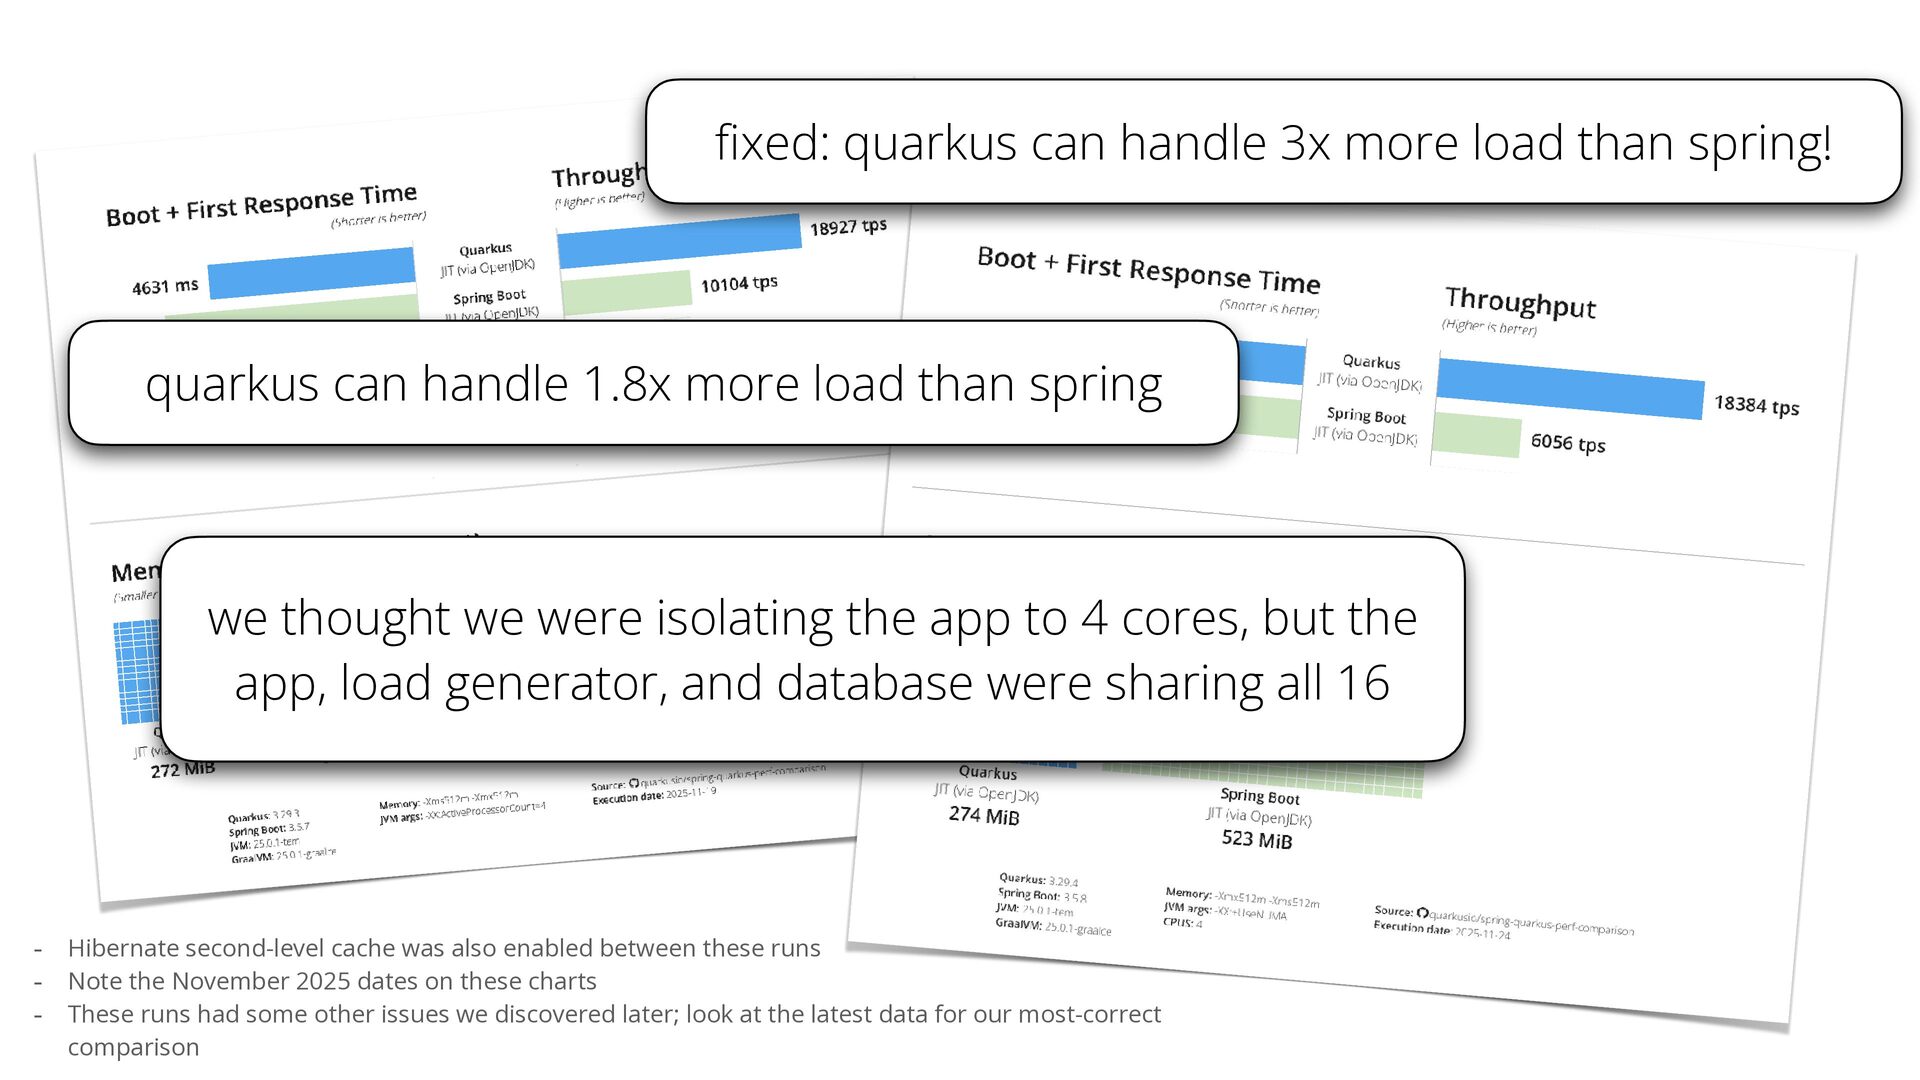
fi xed: quarkus can handle 3x more load than spring!
quarkus can handle 1.8x more load than spring we thought we were isolating the app to 4 cores, but the app, load generator, and database were sharing all 16 - Hibernate second-level cache was also enabled between these runs - Note the November 2025 dates on these charts - These runs had some other issues we discovered later; look at the latest data for our most-correct comparison -
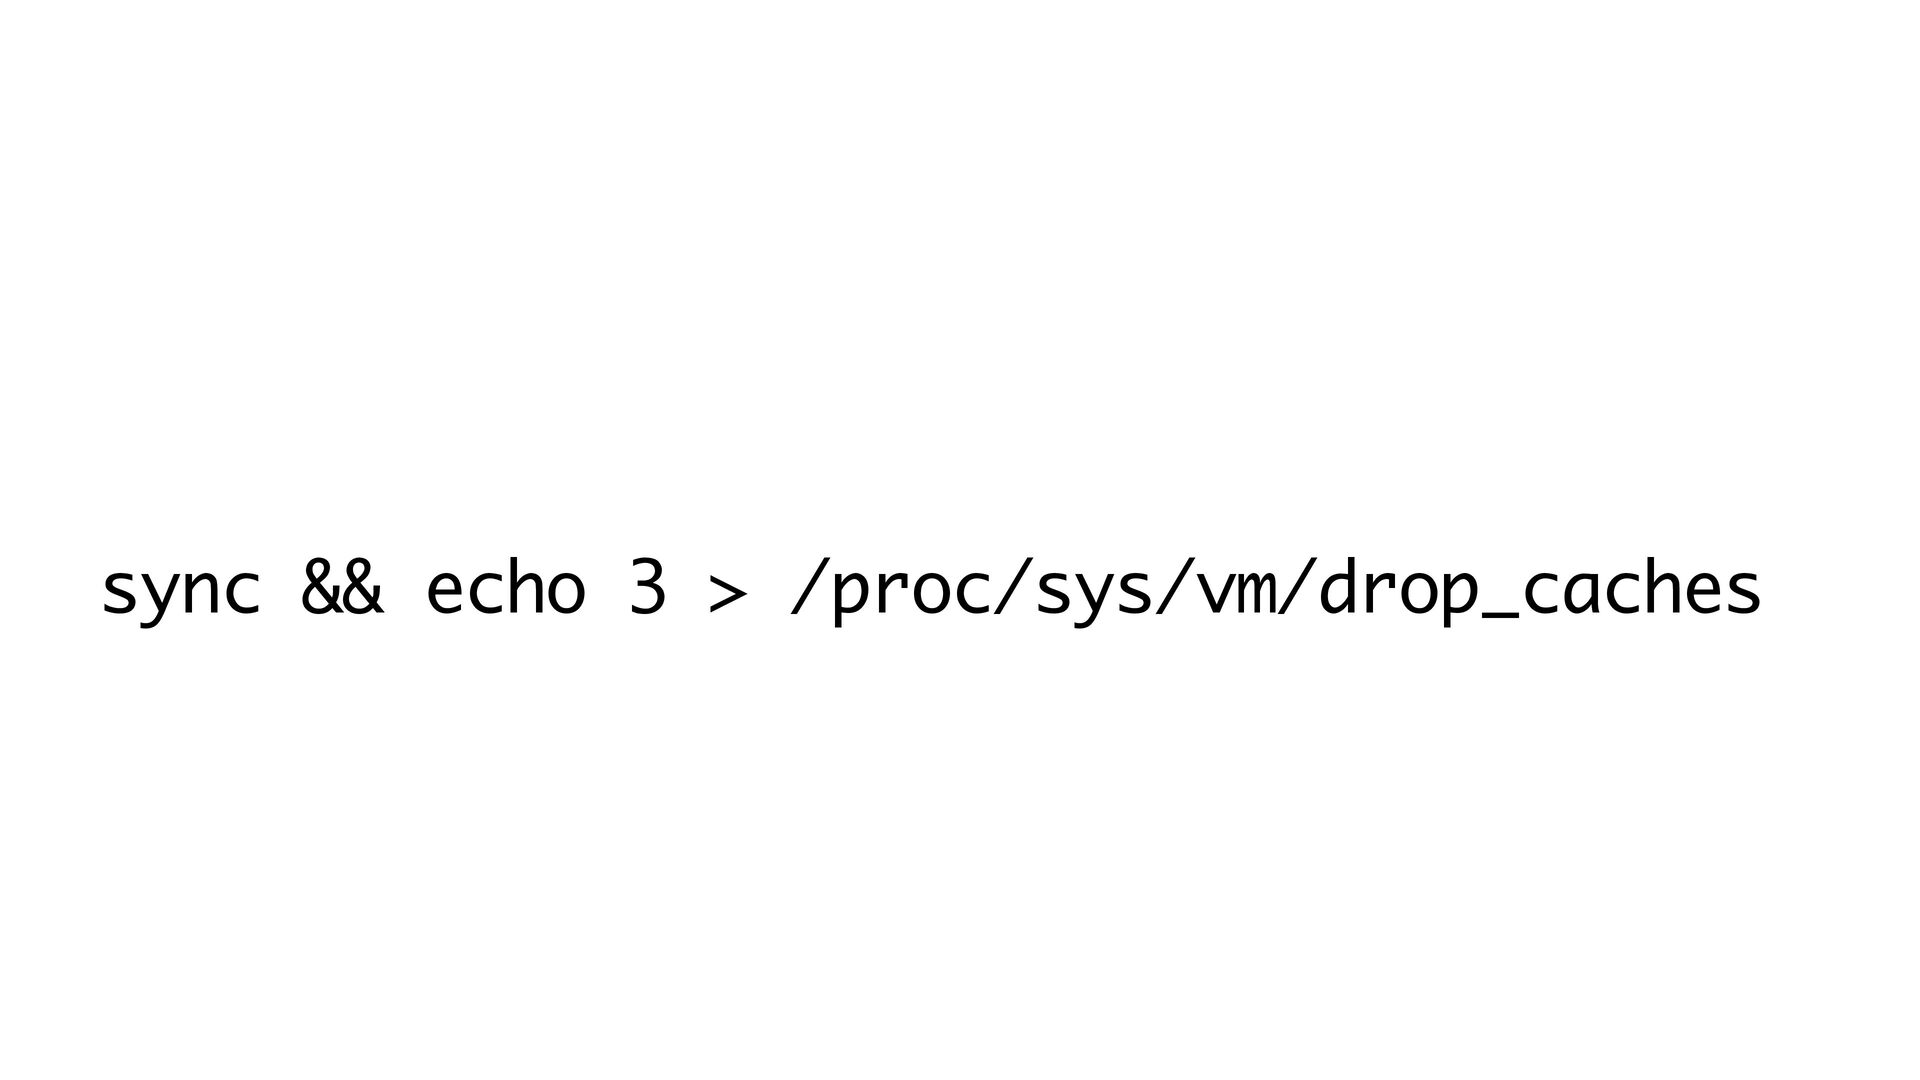
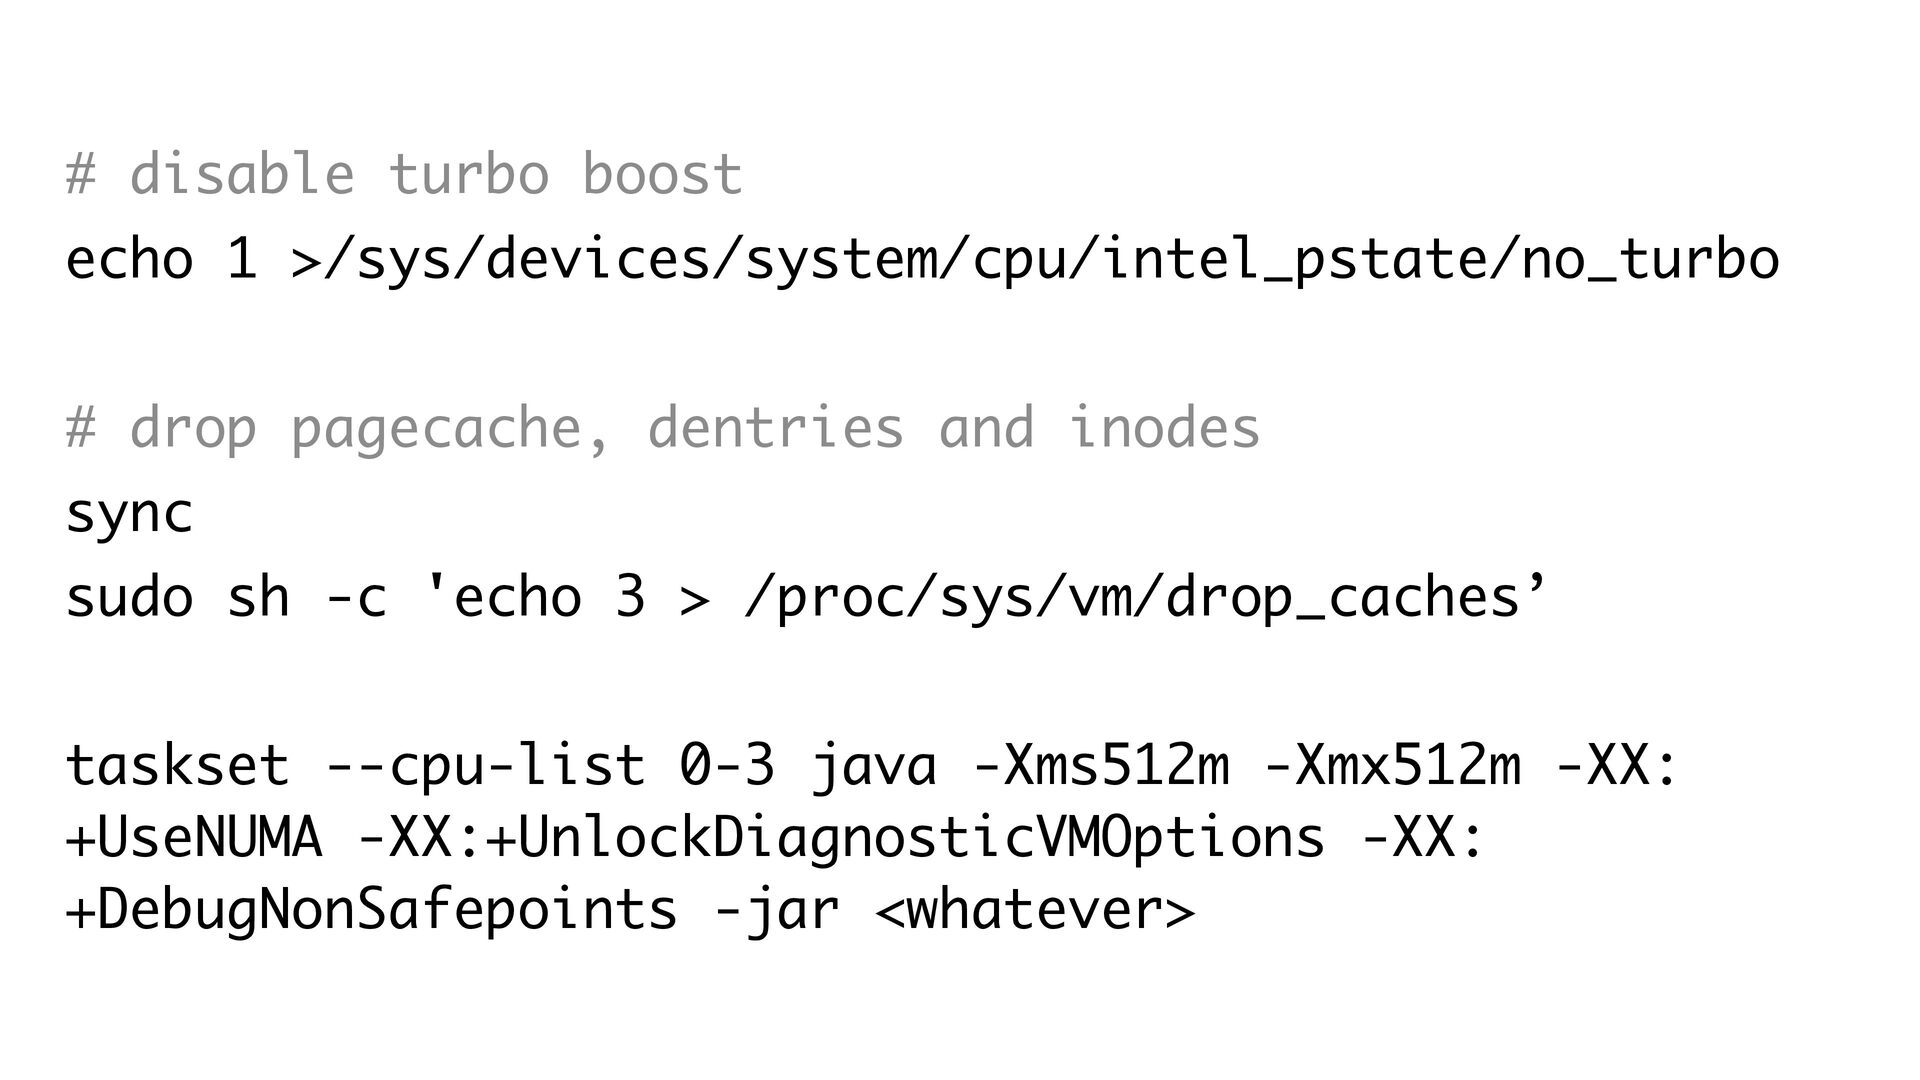
# disable turbo boost echo 1 >/sys/devices/system/cpu/intel_pstate/no_turbo # drop pagecache,
dentries and inodes sync sudo sh -c 'echo 3 > /proc/sys/vm/drop_caches’ taskset --cpu-list 0-3 java -Xms512m -Xmx512m -XX: +UseNUMA -XX:+UnlockDiagnosticVMOptions -XX: +DebugNonSafepoints -jar <whatever> -
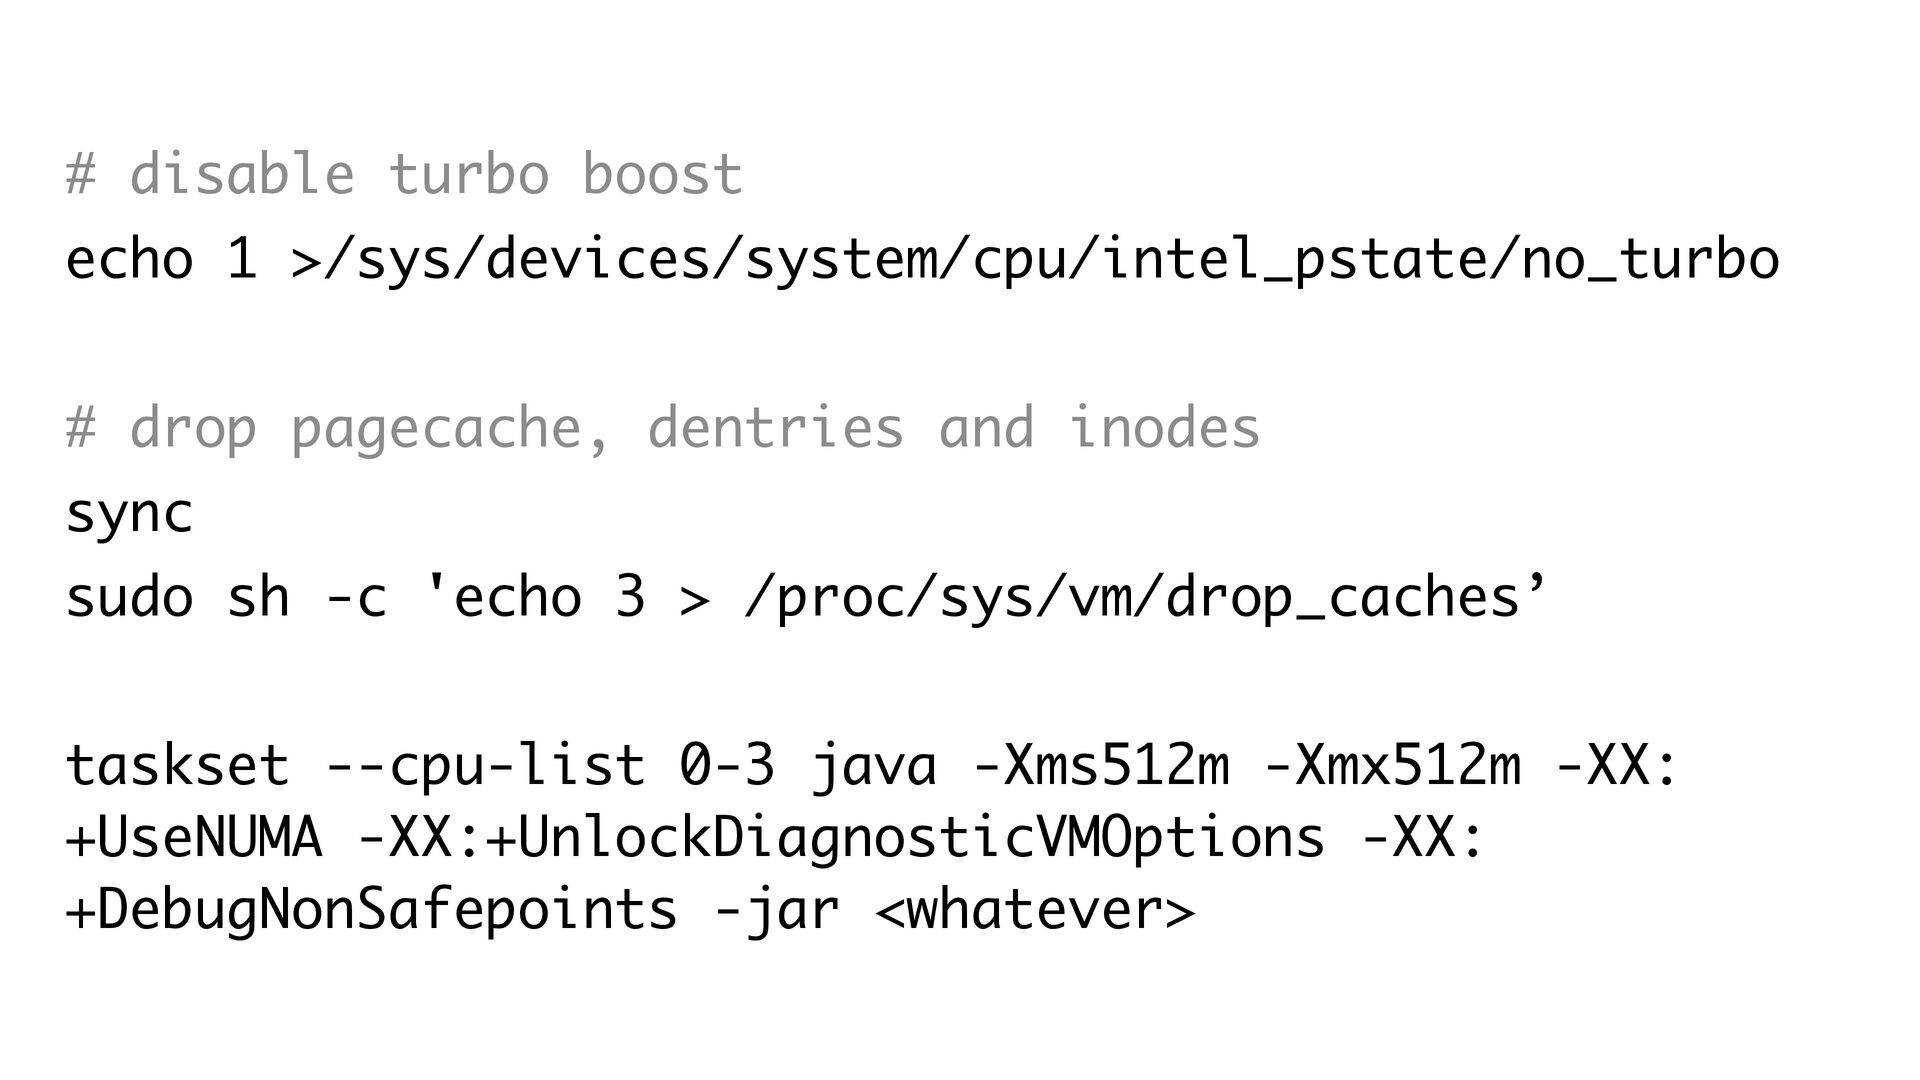
# disable turbo boost echo 1 >/sys/devices/system/cpu/intel_pstate/no_turbo # drop pagecache,
dentries and inodes sync sudo sh -c 'echo 3 > /proc/sys/vm/drop_caches’ taskset --cpu-list 0-3 java -Xms512m -Xmx512m -XX: +UseNUMA -XX:+UnlockDiagnosticVMOptions -XX: +DebugNonSafepoints -jar <whatever> -
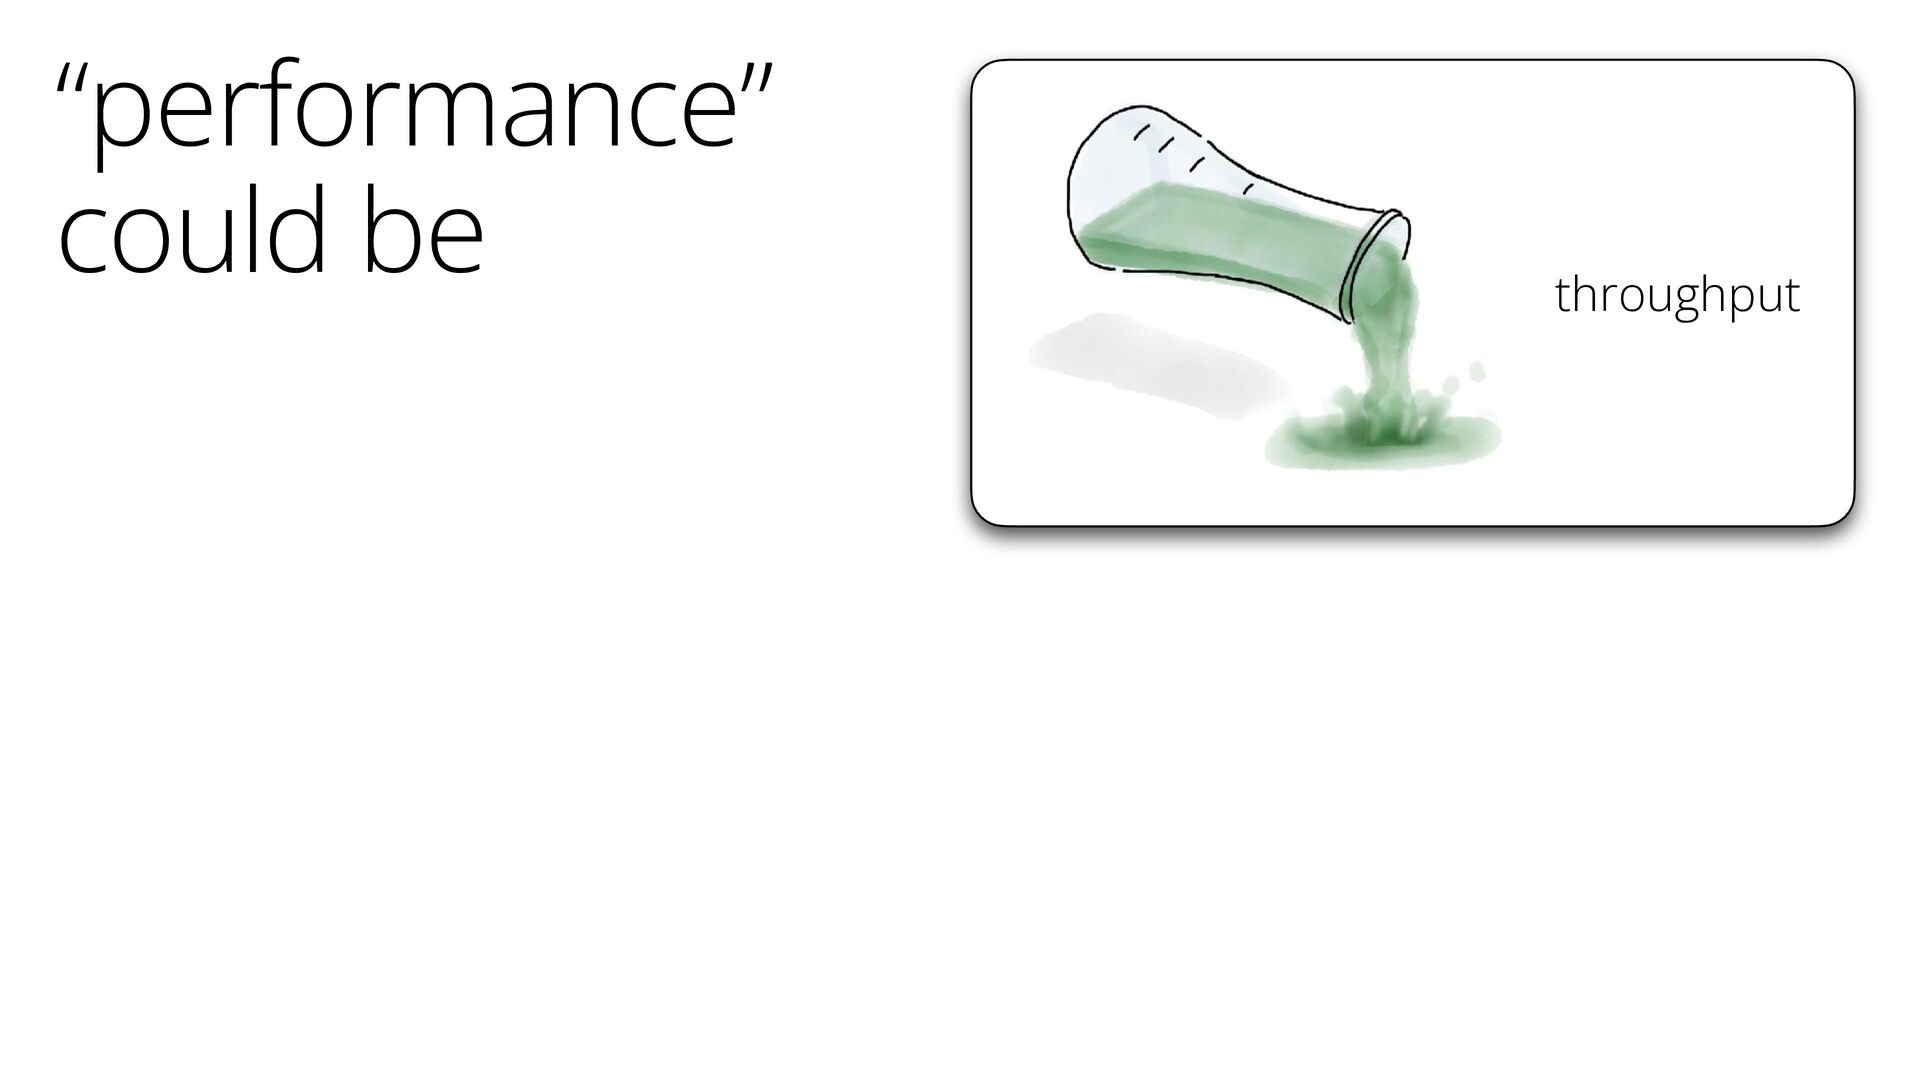
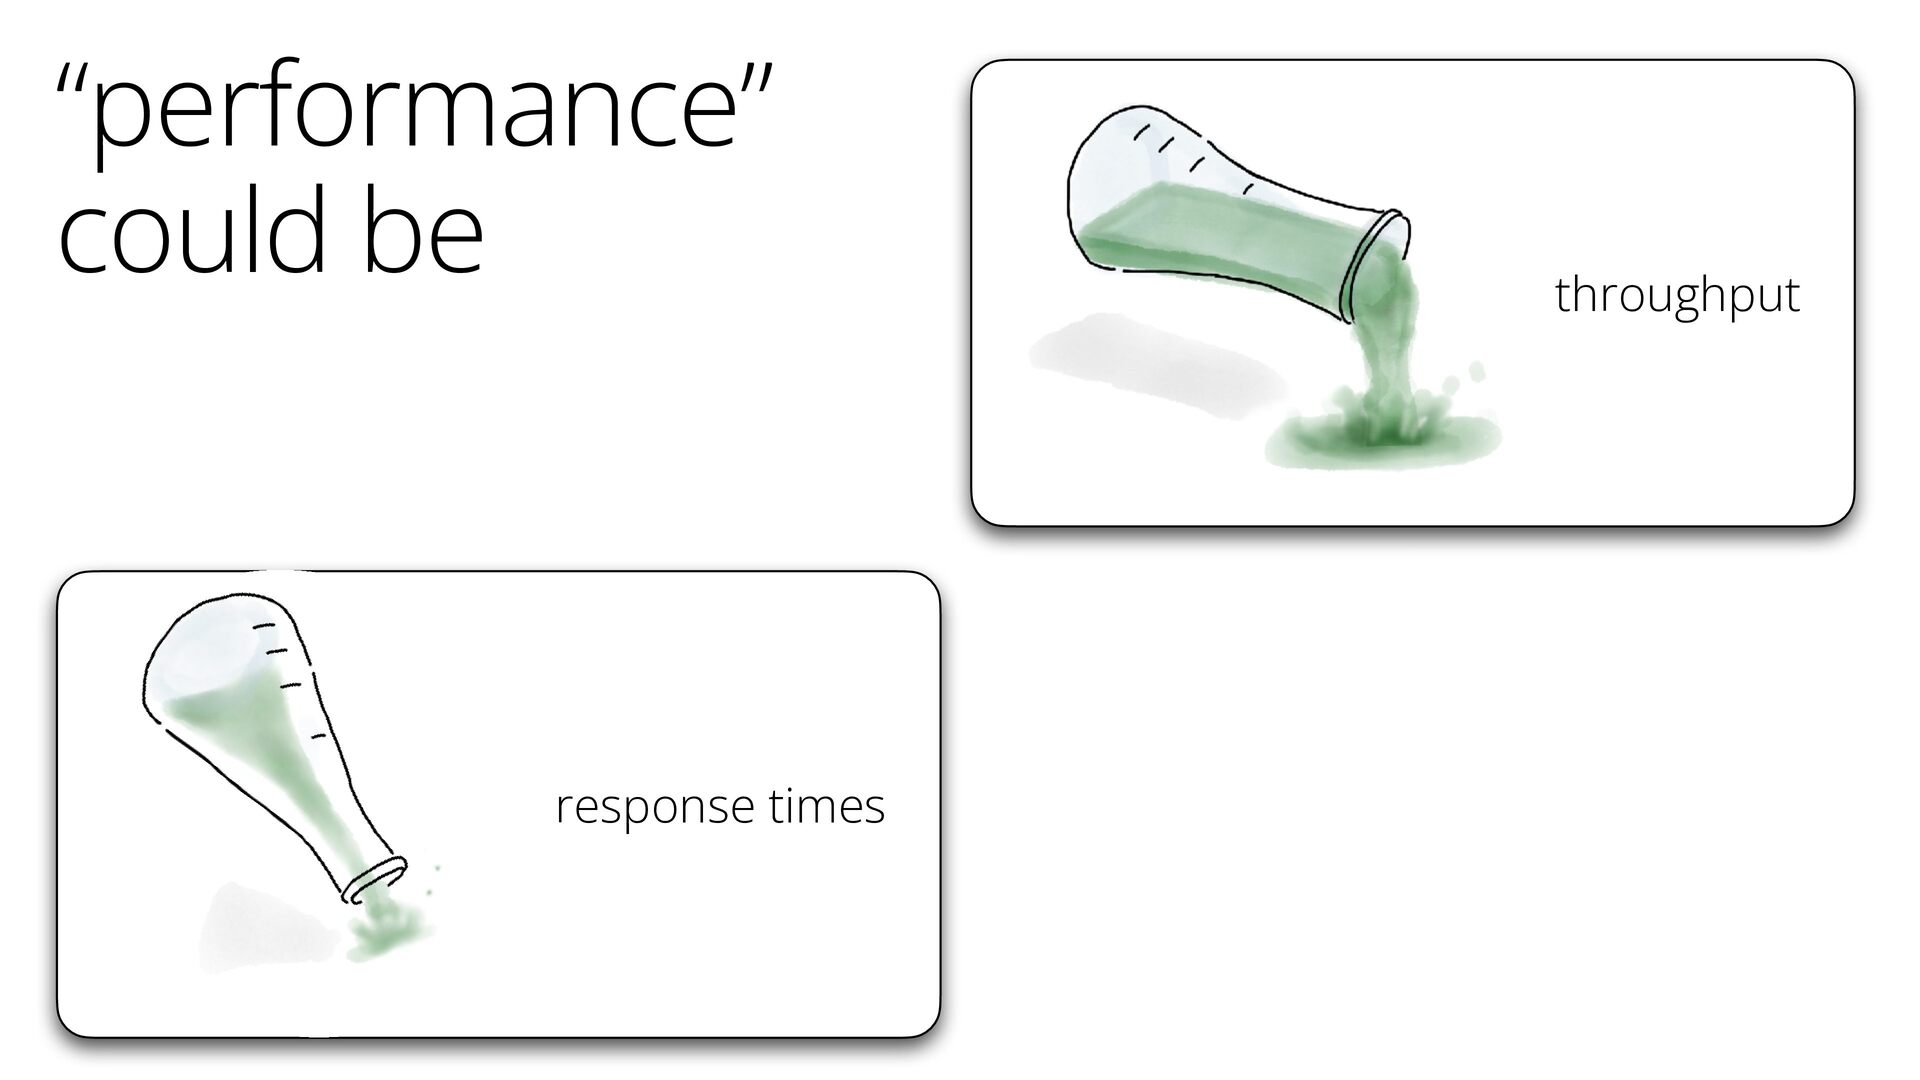
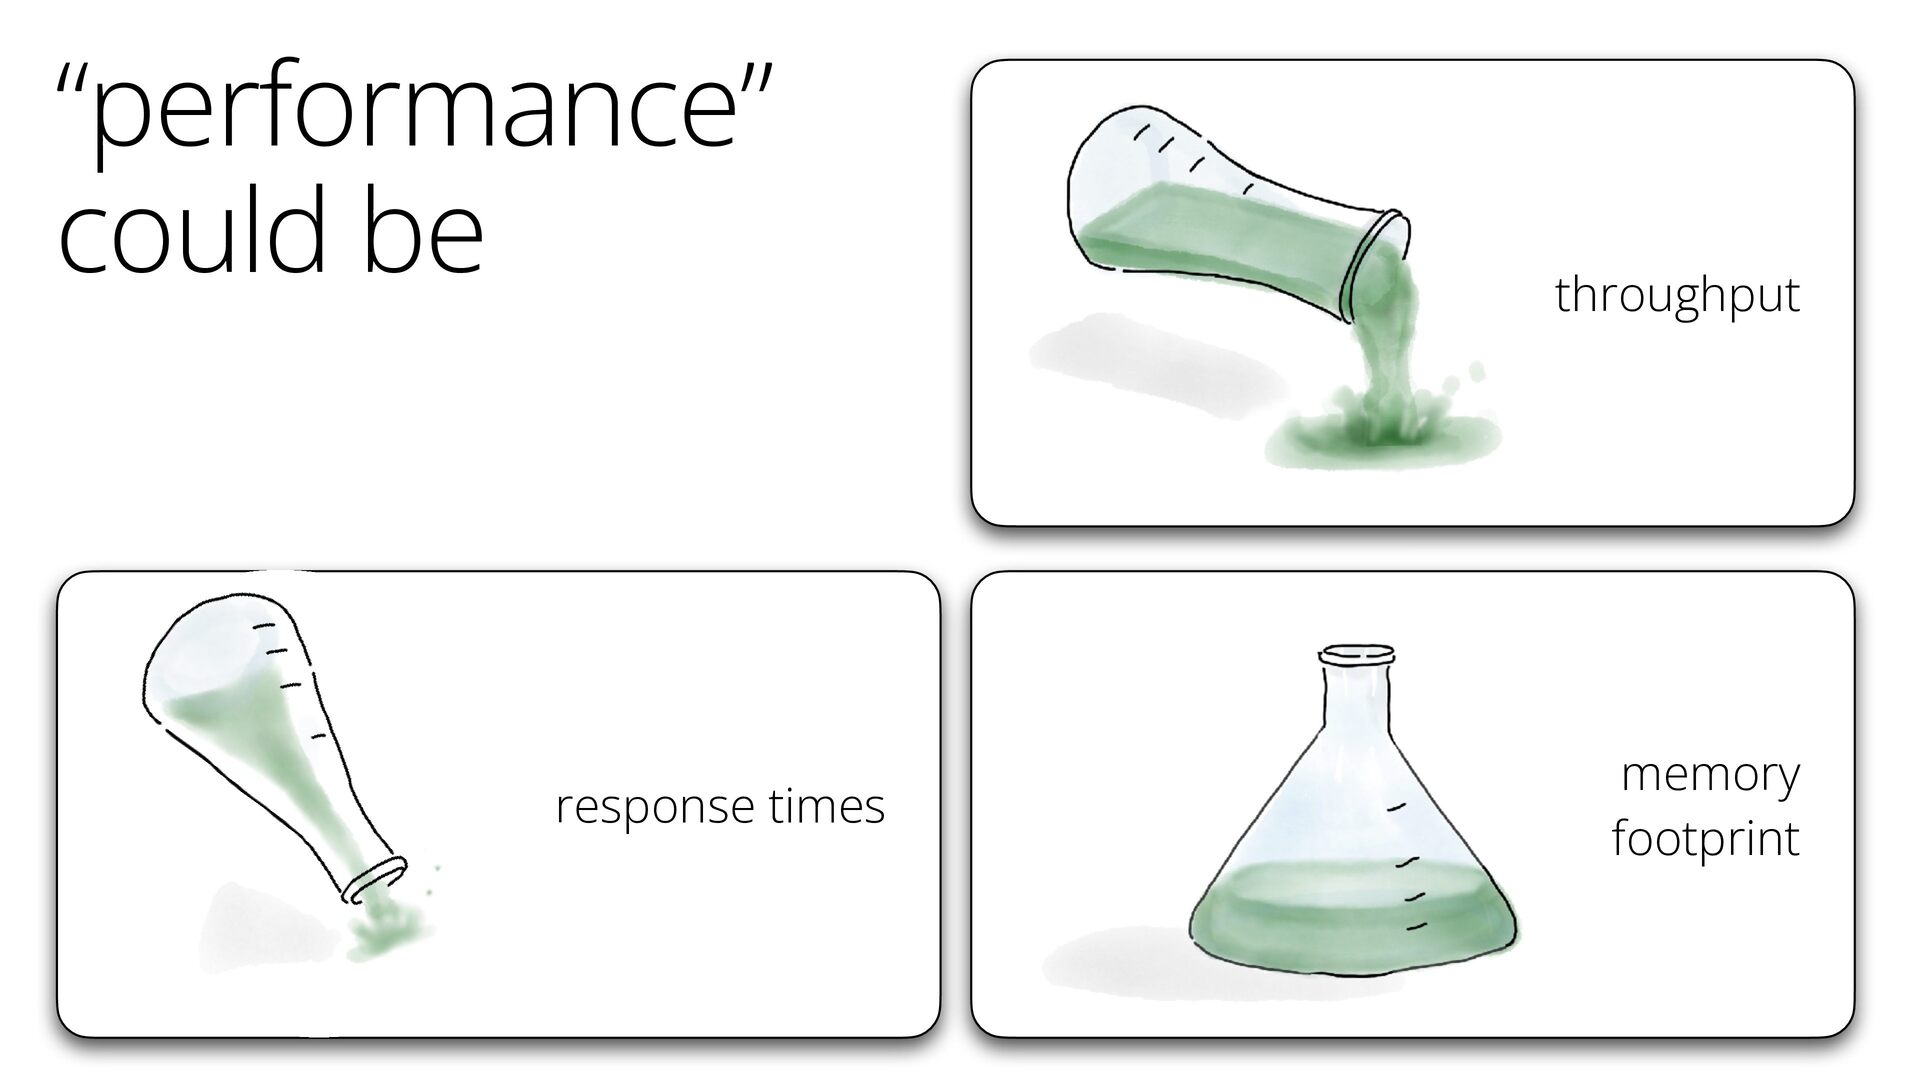
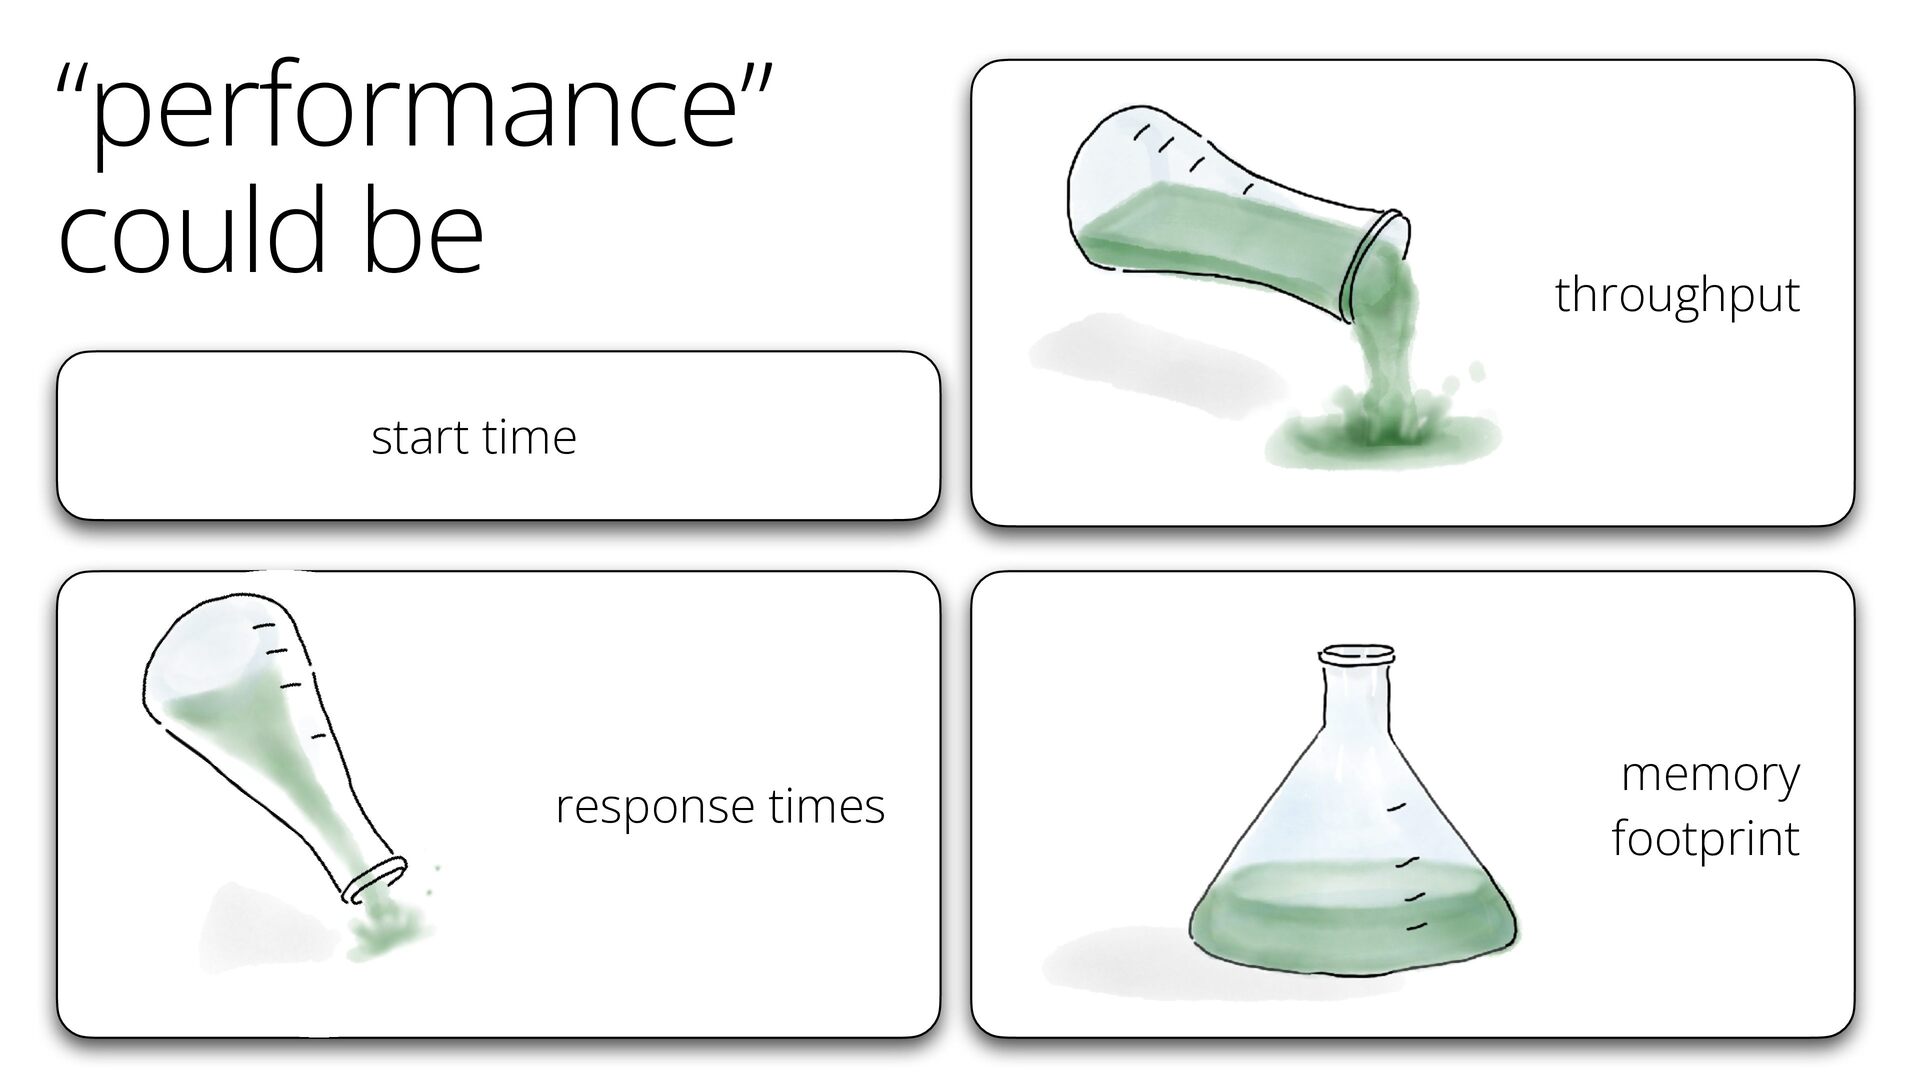
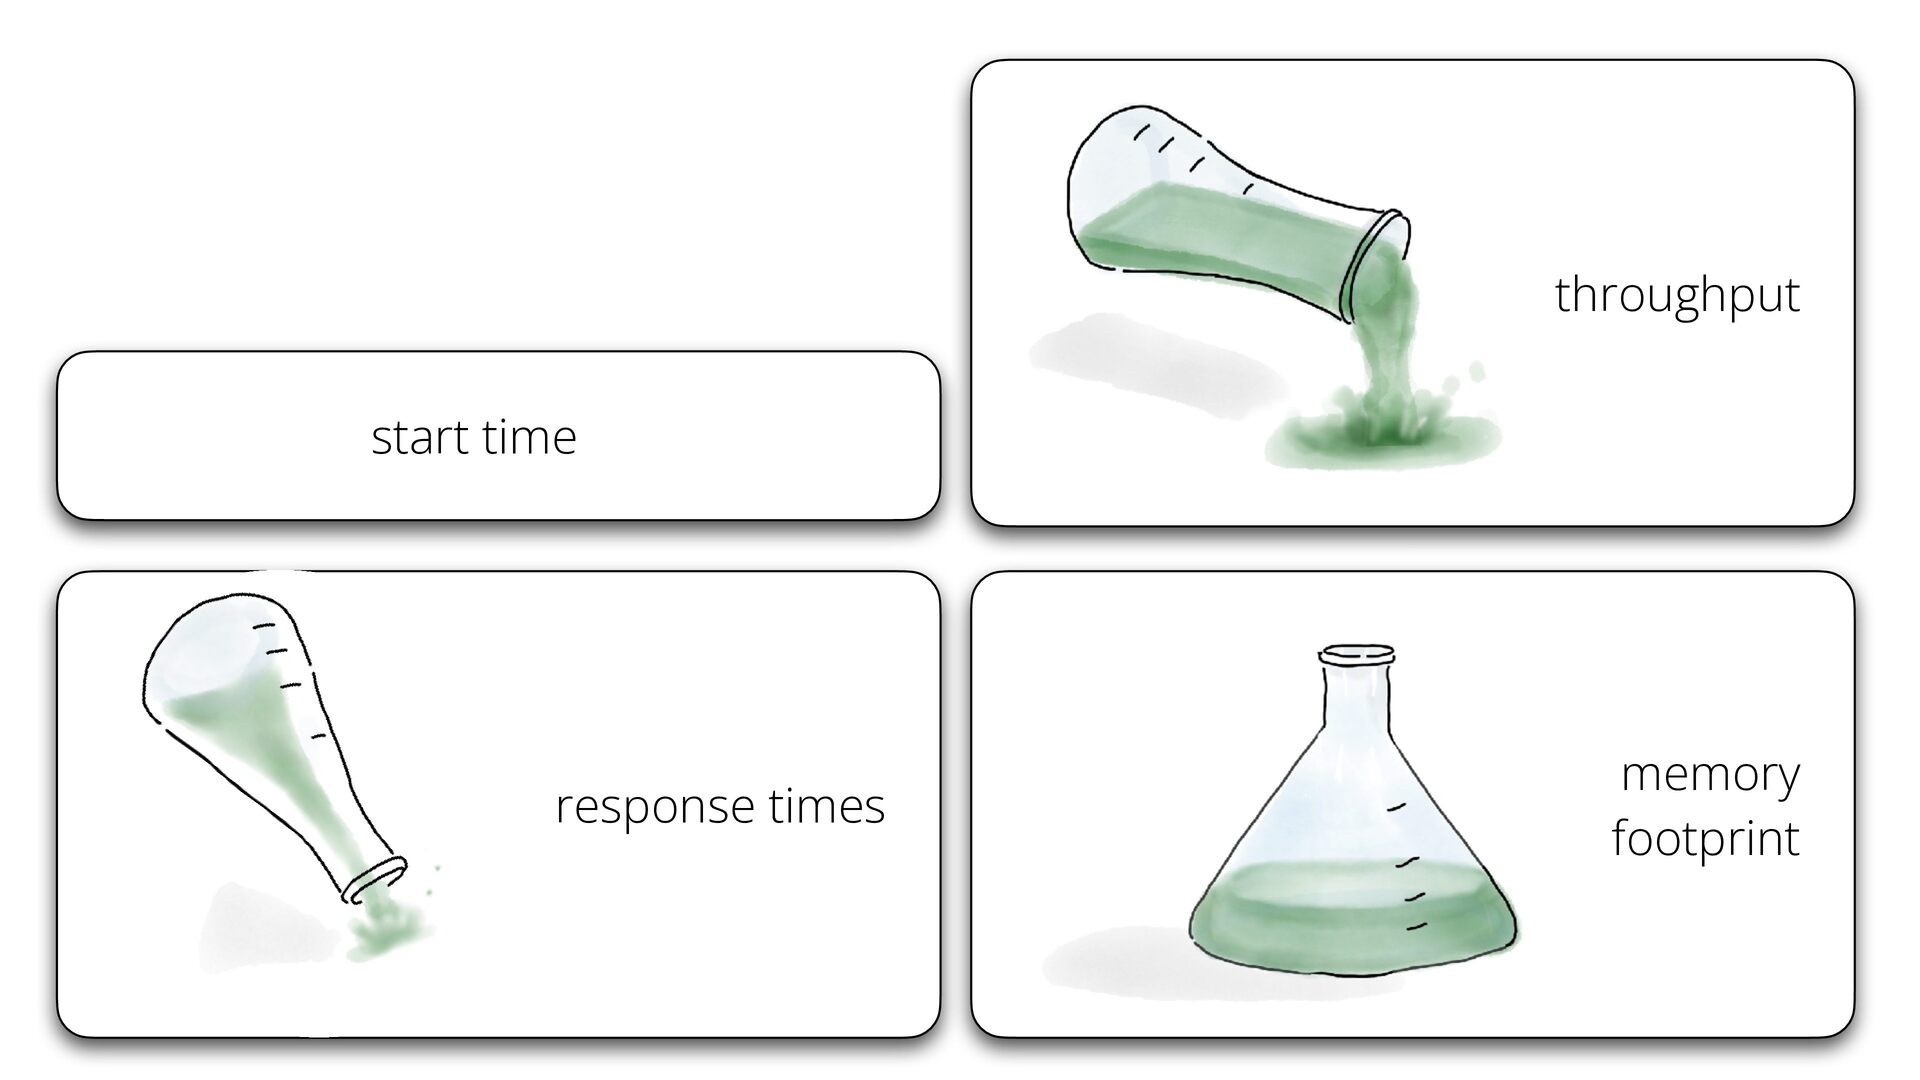
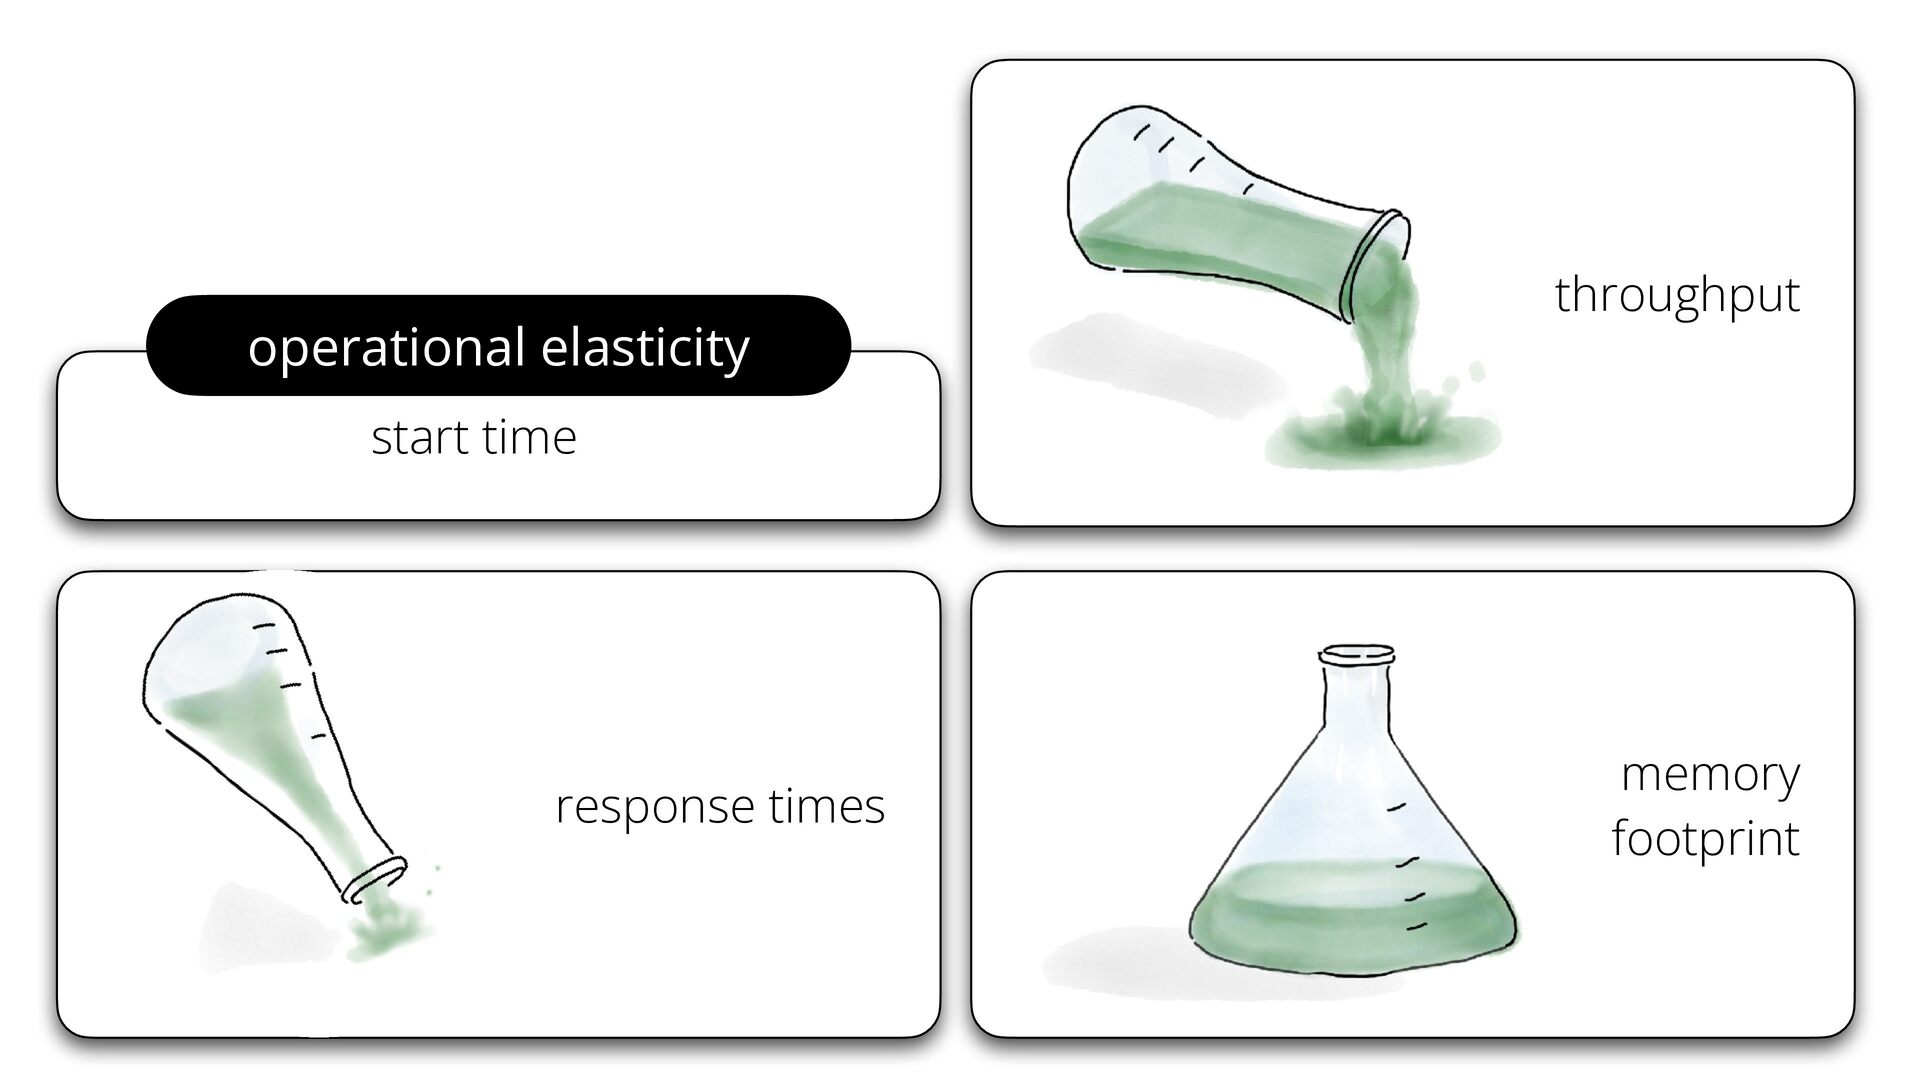
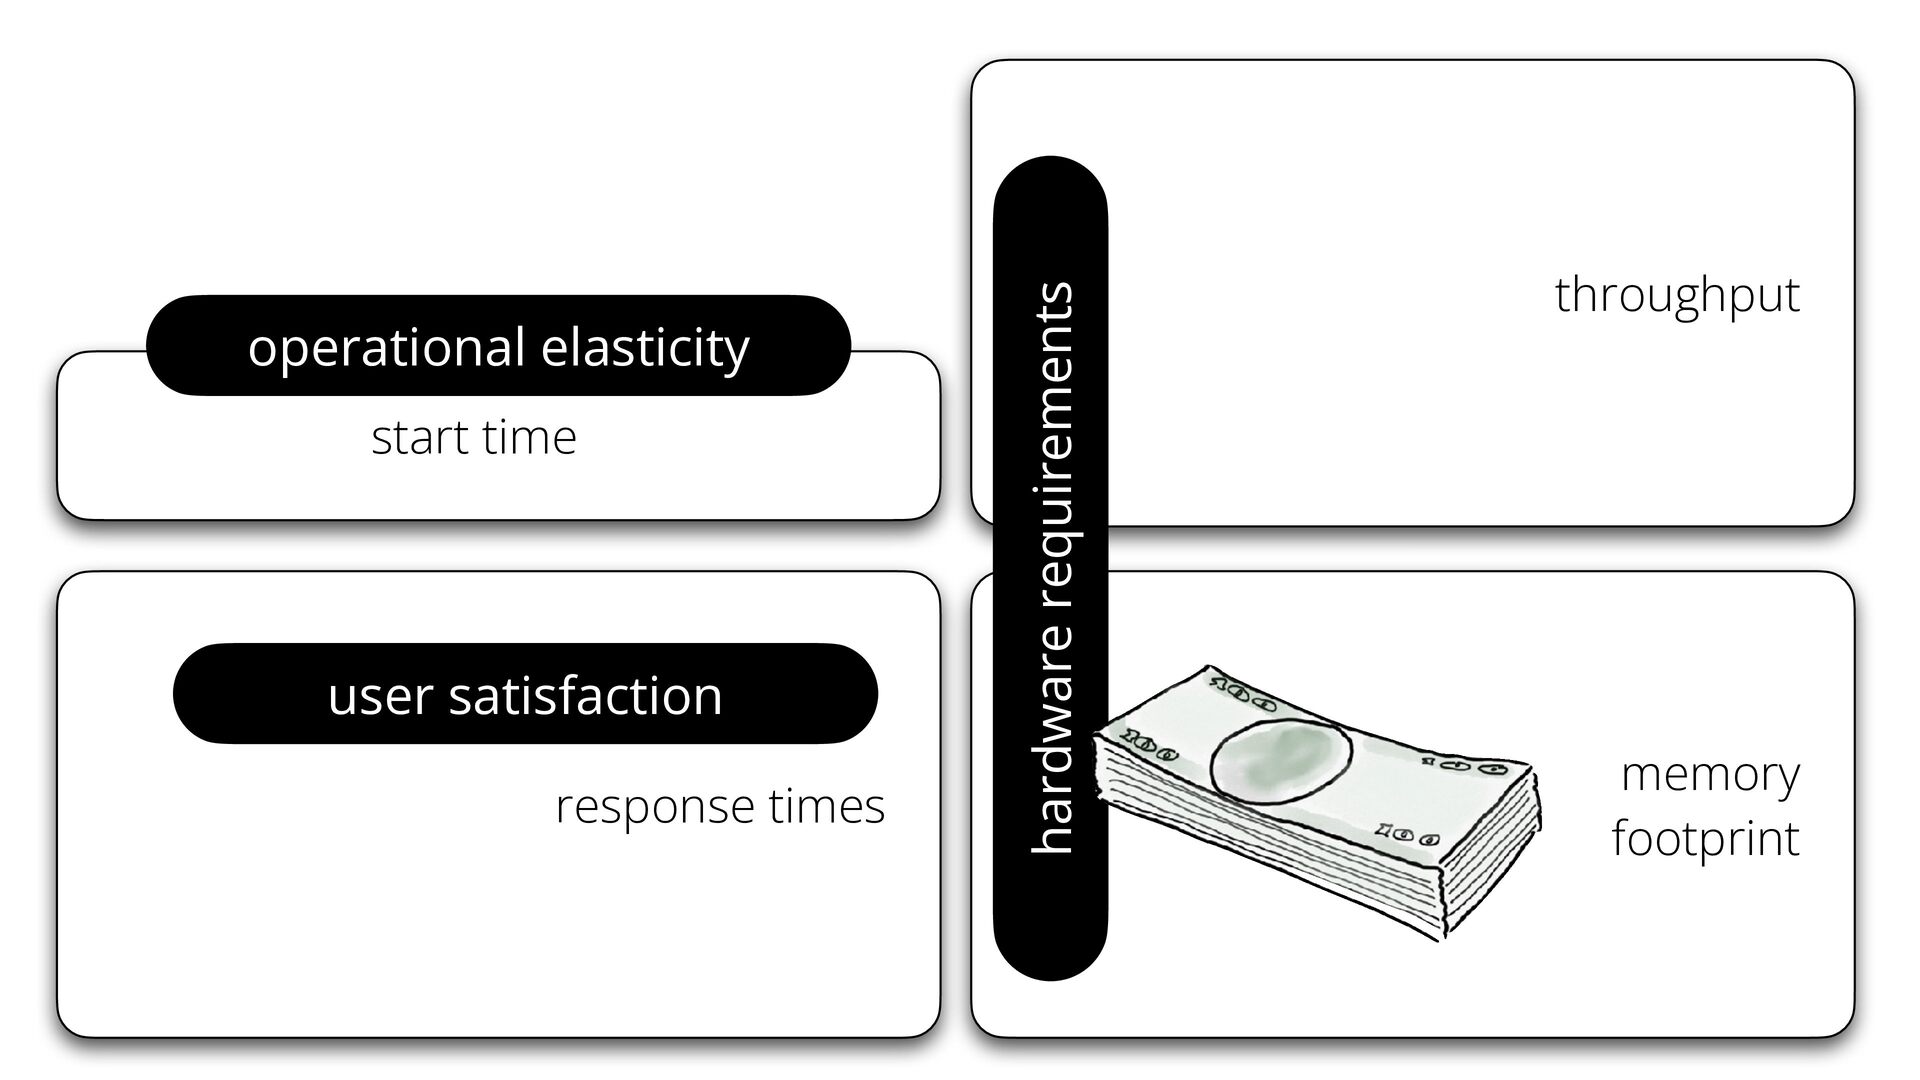
start time user satisfaction response times hardware requirements operational elasticity
throughput memory footprint -
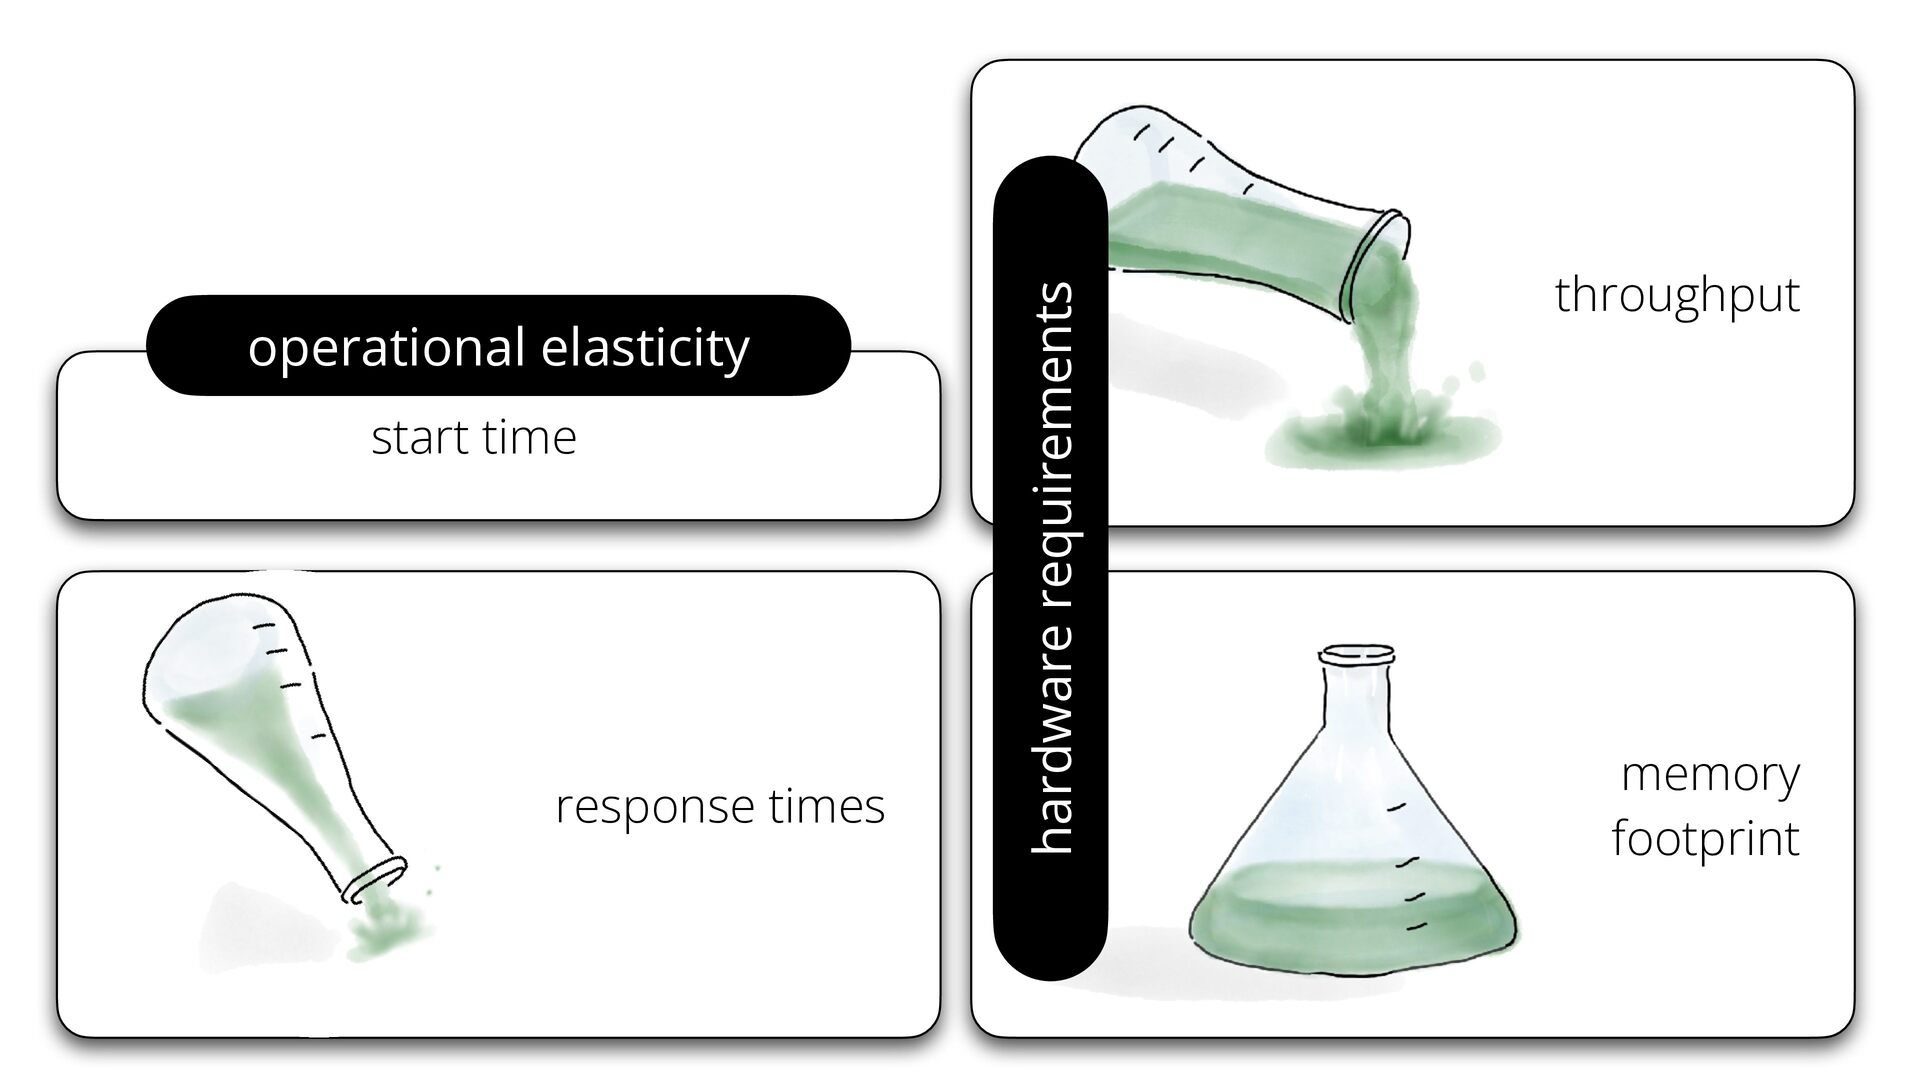
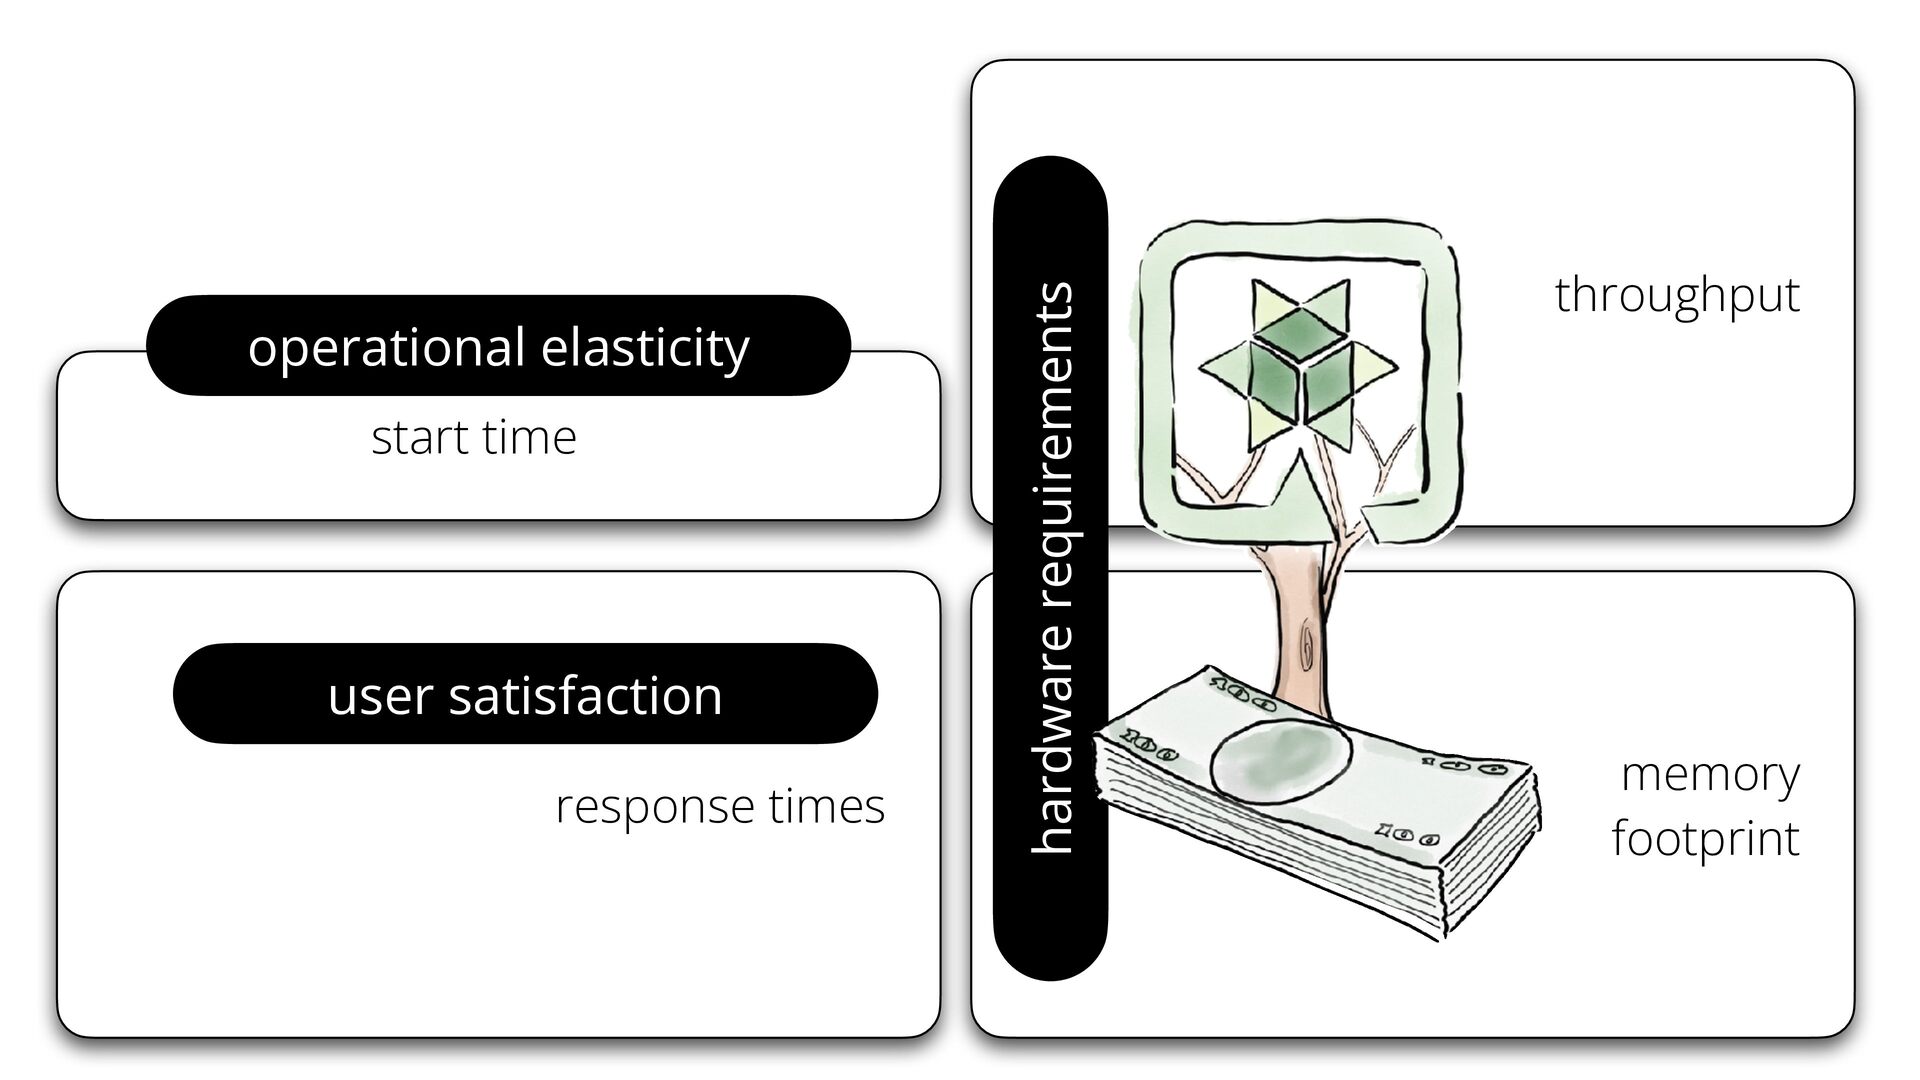
start time user satisfaction response times hardware requirements operational elasticity
throughput memory footprint -
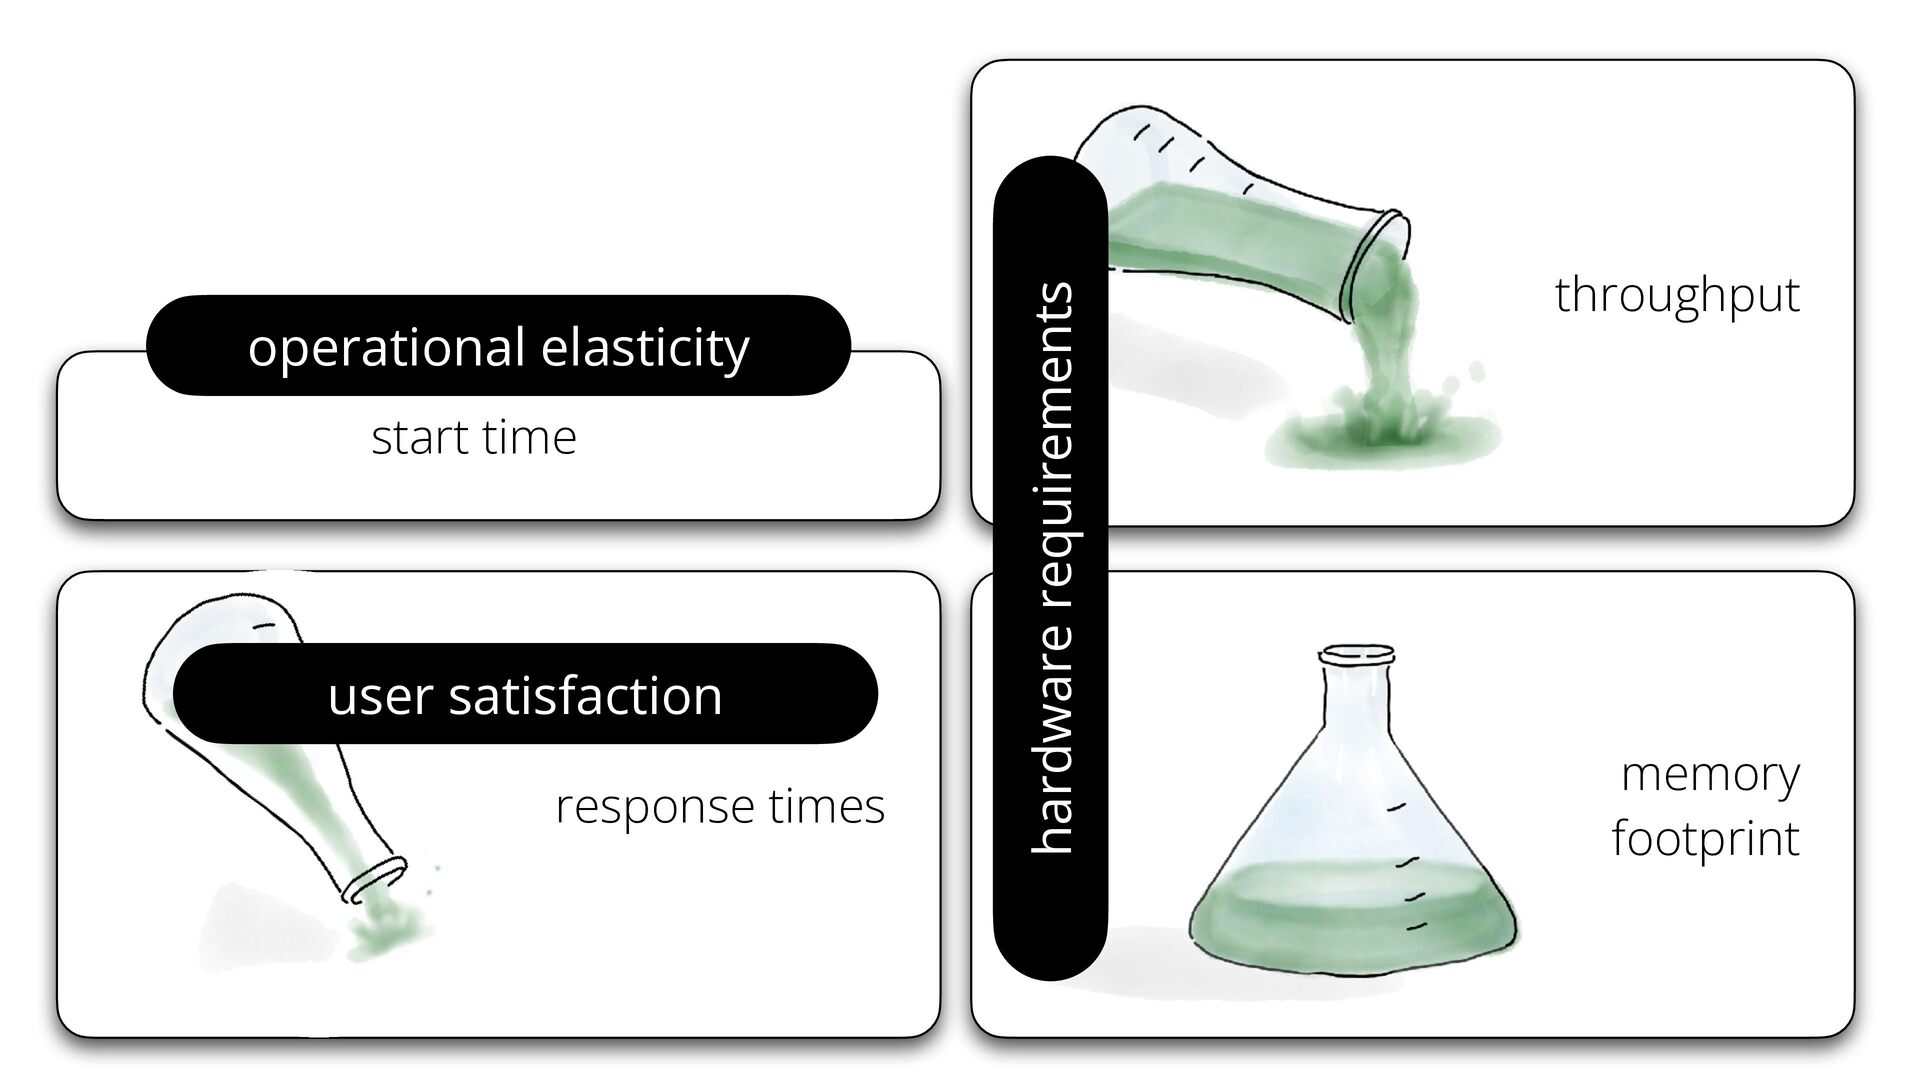
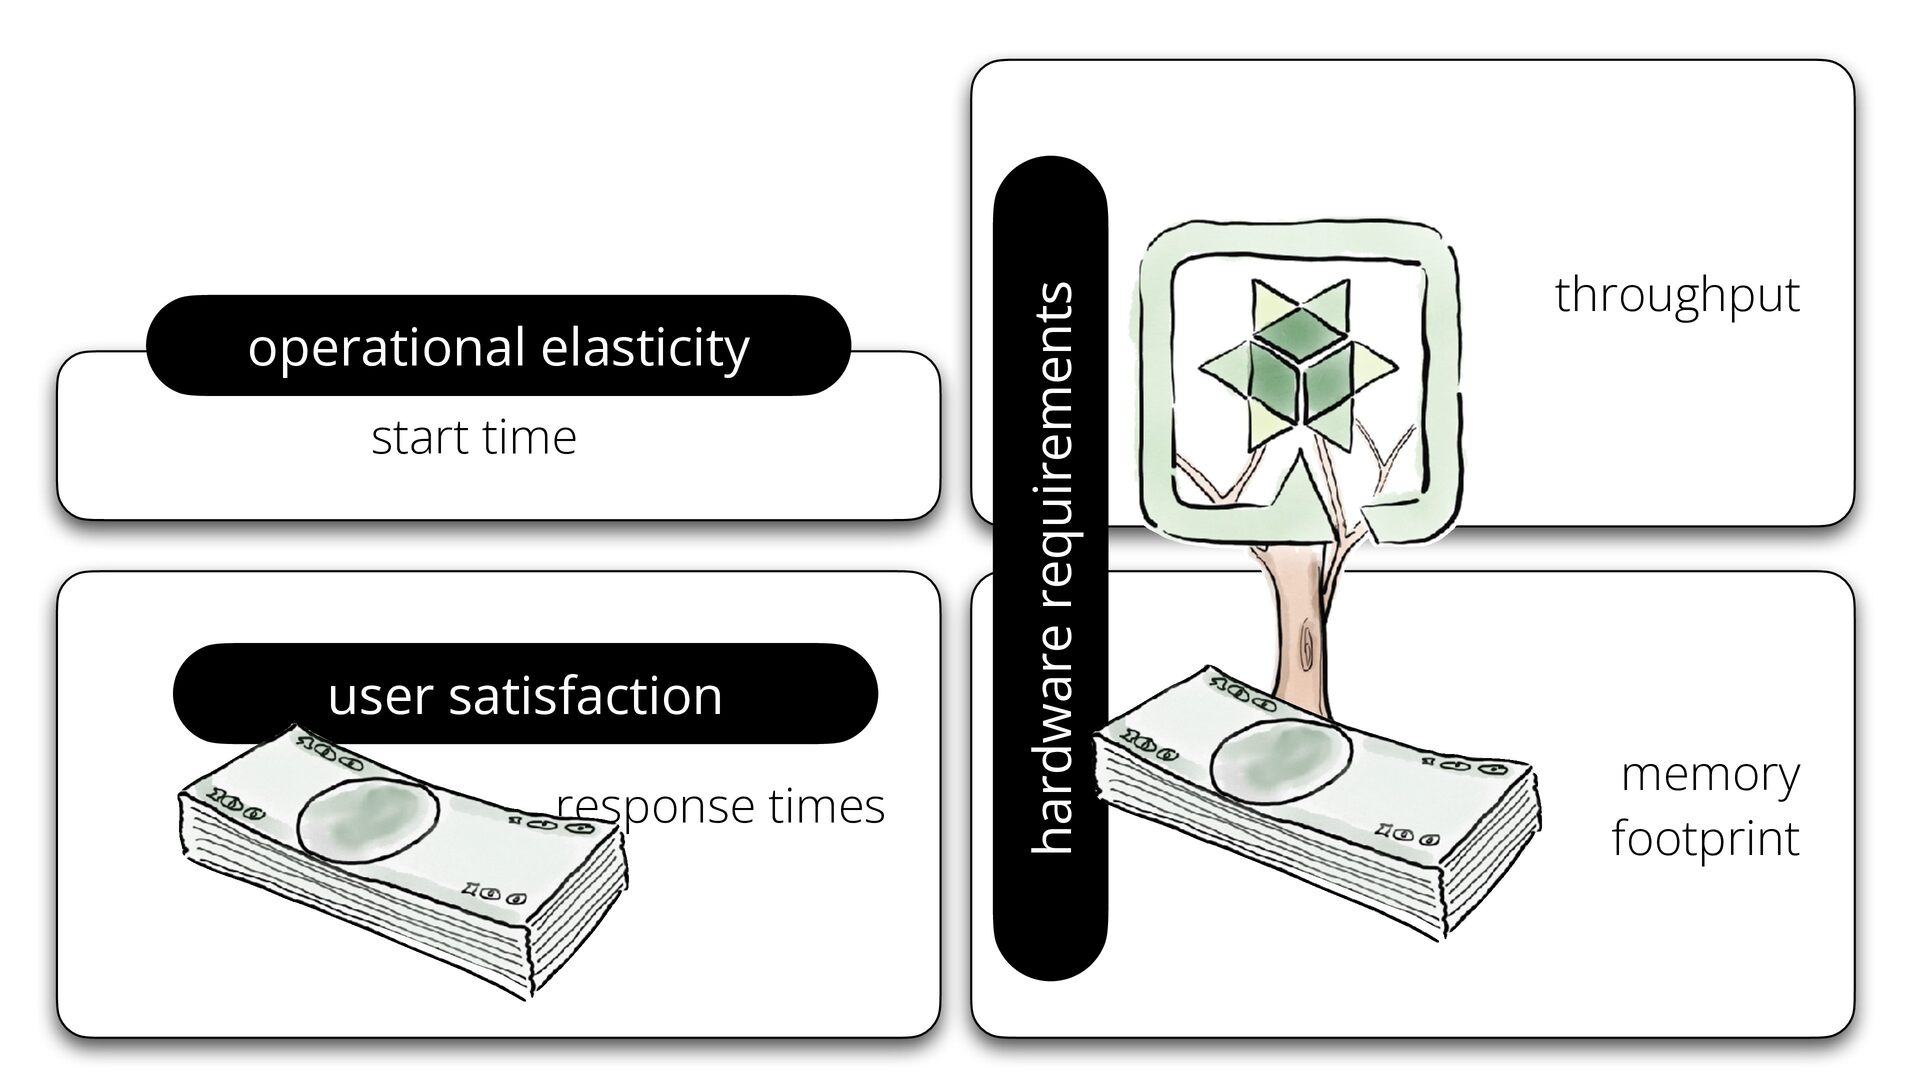
start time user satisfaction response times hardware requirements operational elasticity
throughput memory footprint -
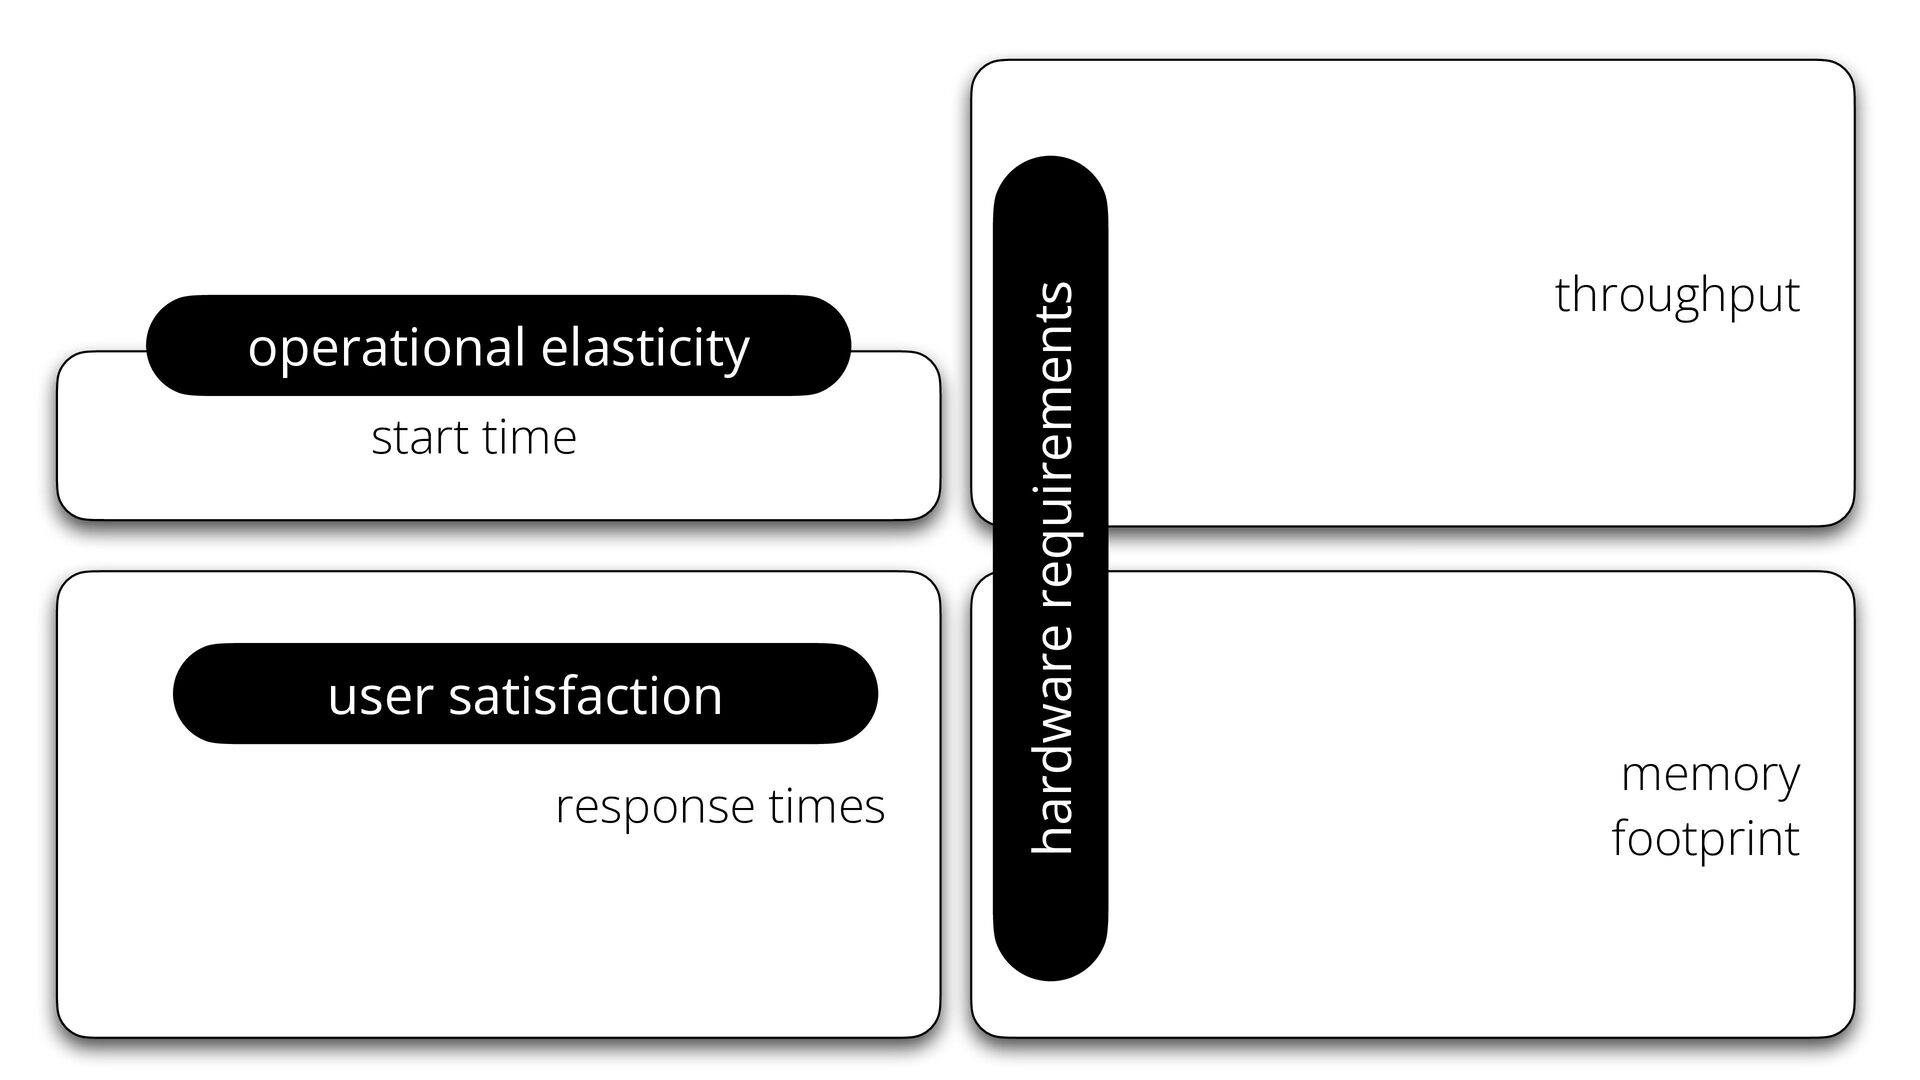
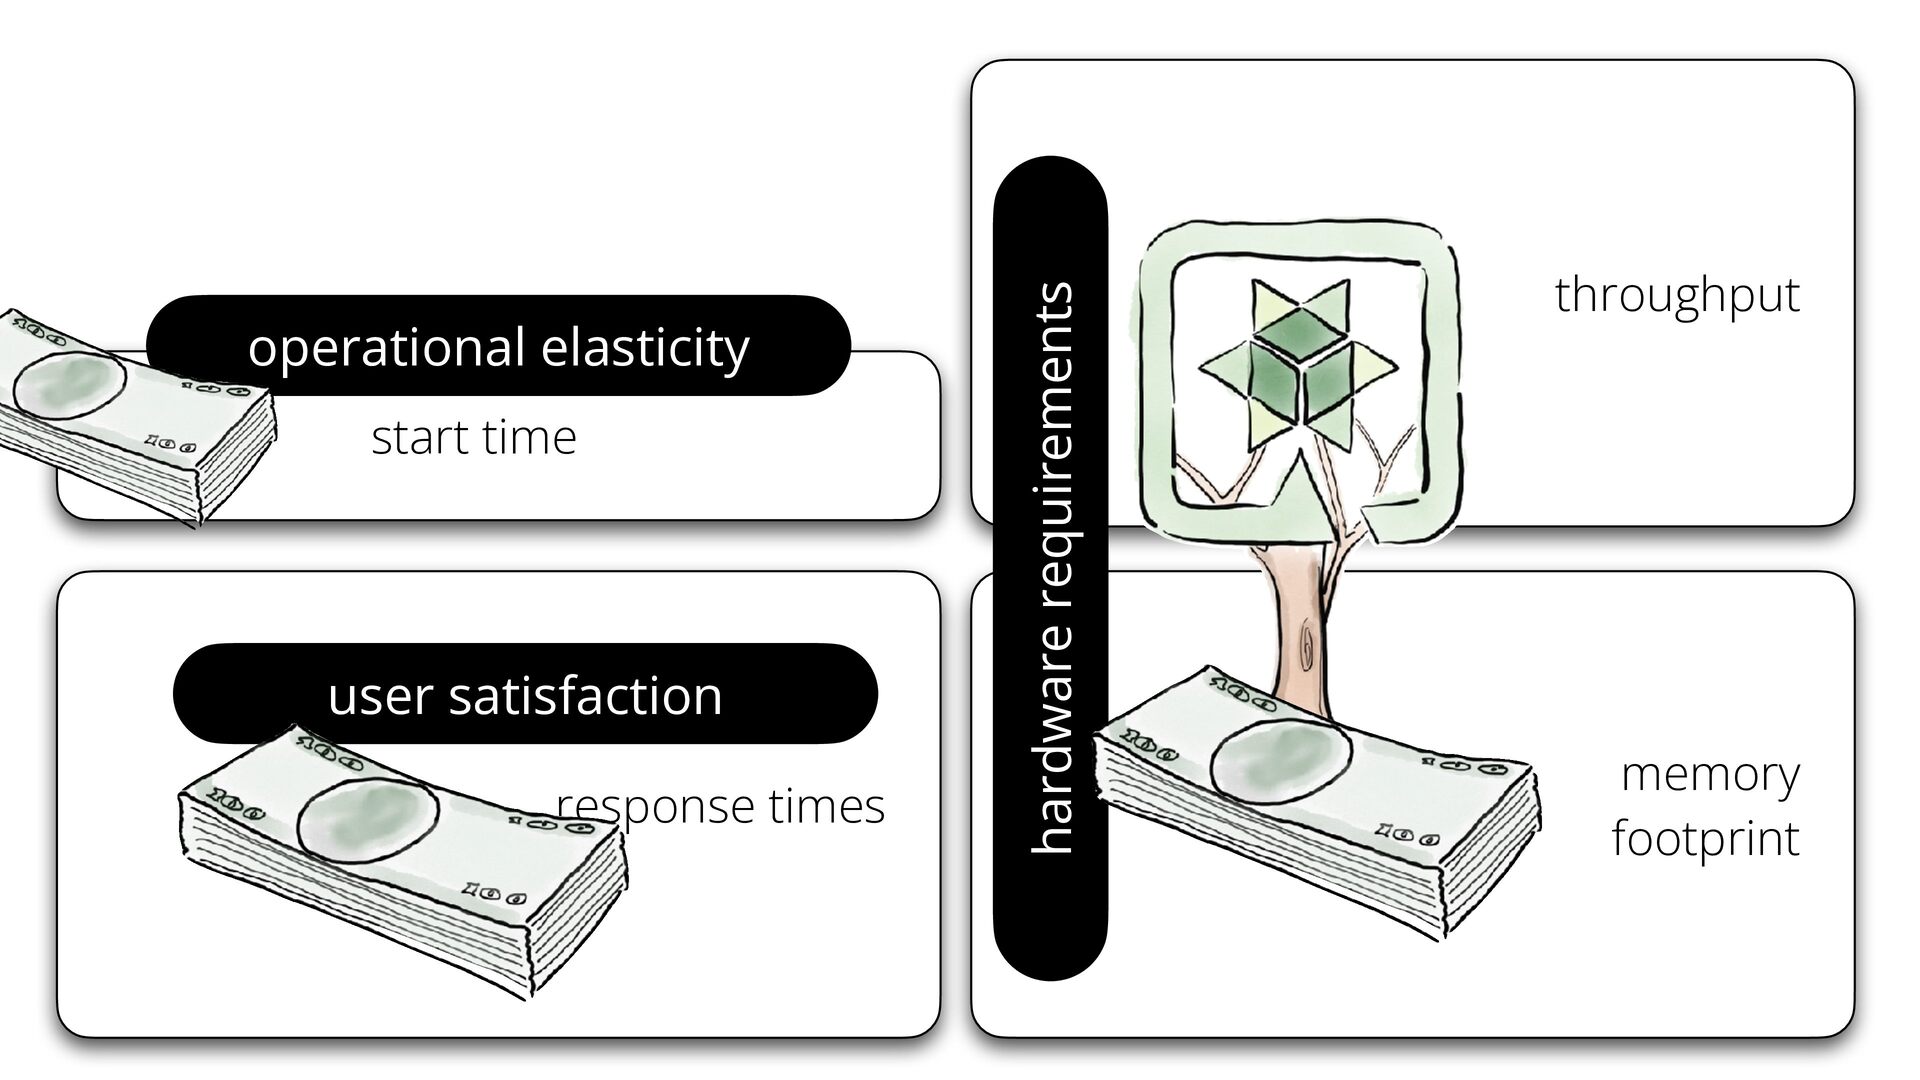
start time user satisfaction response times hardware requirements operational elasticity
throughput memory footprint -
start time user satisfaction response times hardware requirements operational elasticity
throughput memory footprint -
start time user satisfaction response times hardware requirements operational elasticity
throughput memory footprint -
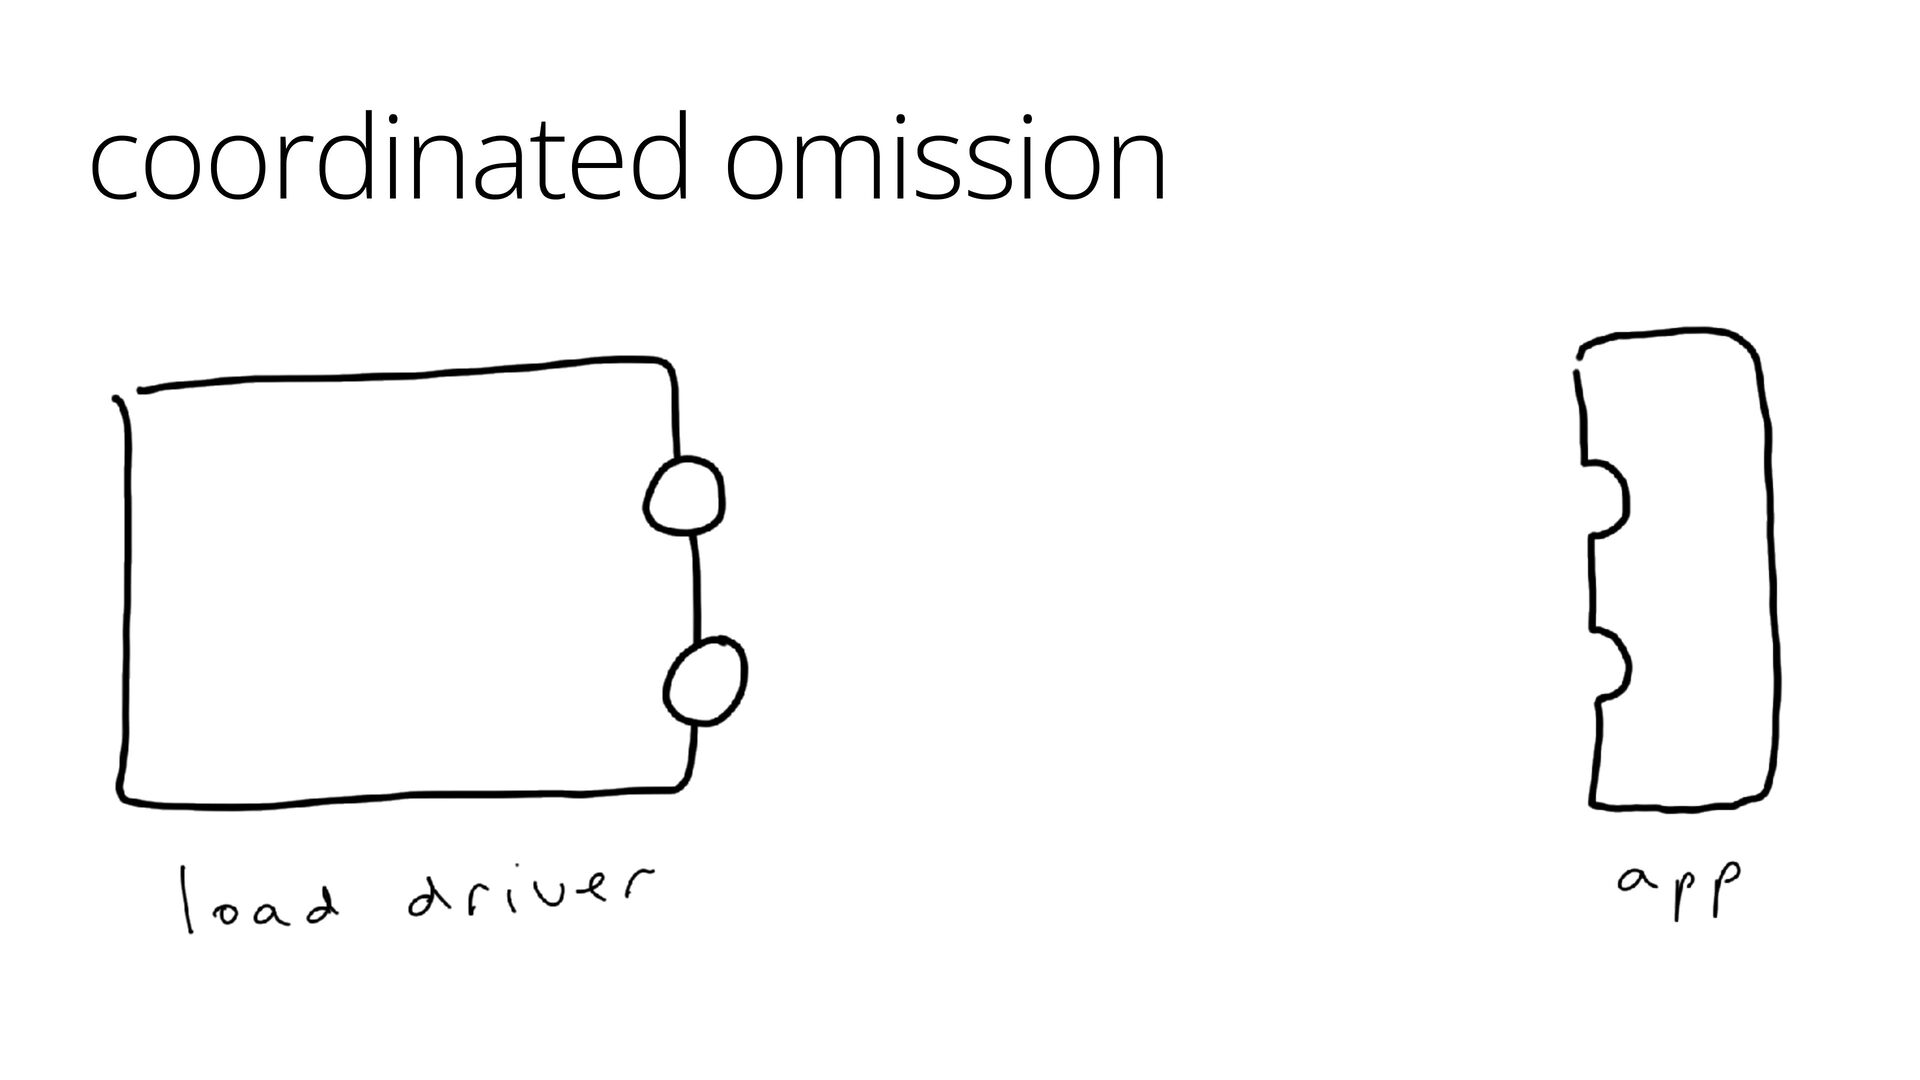
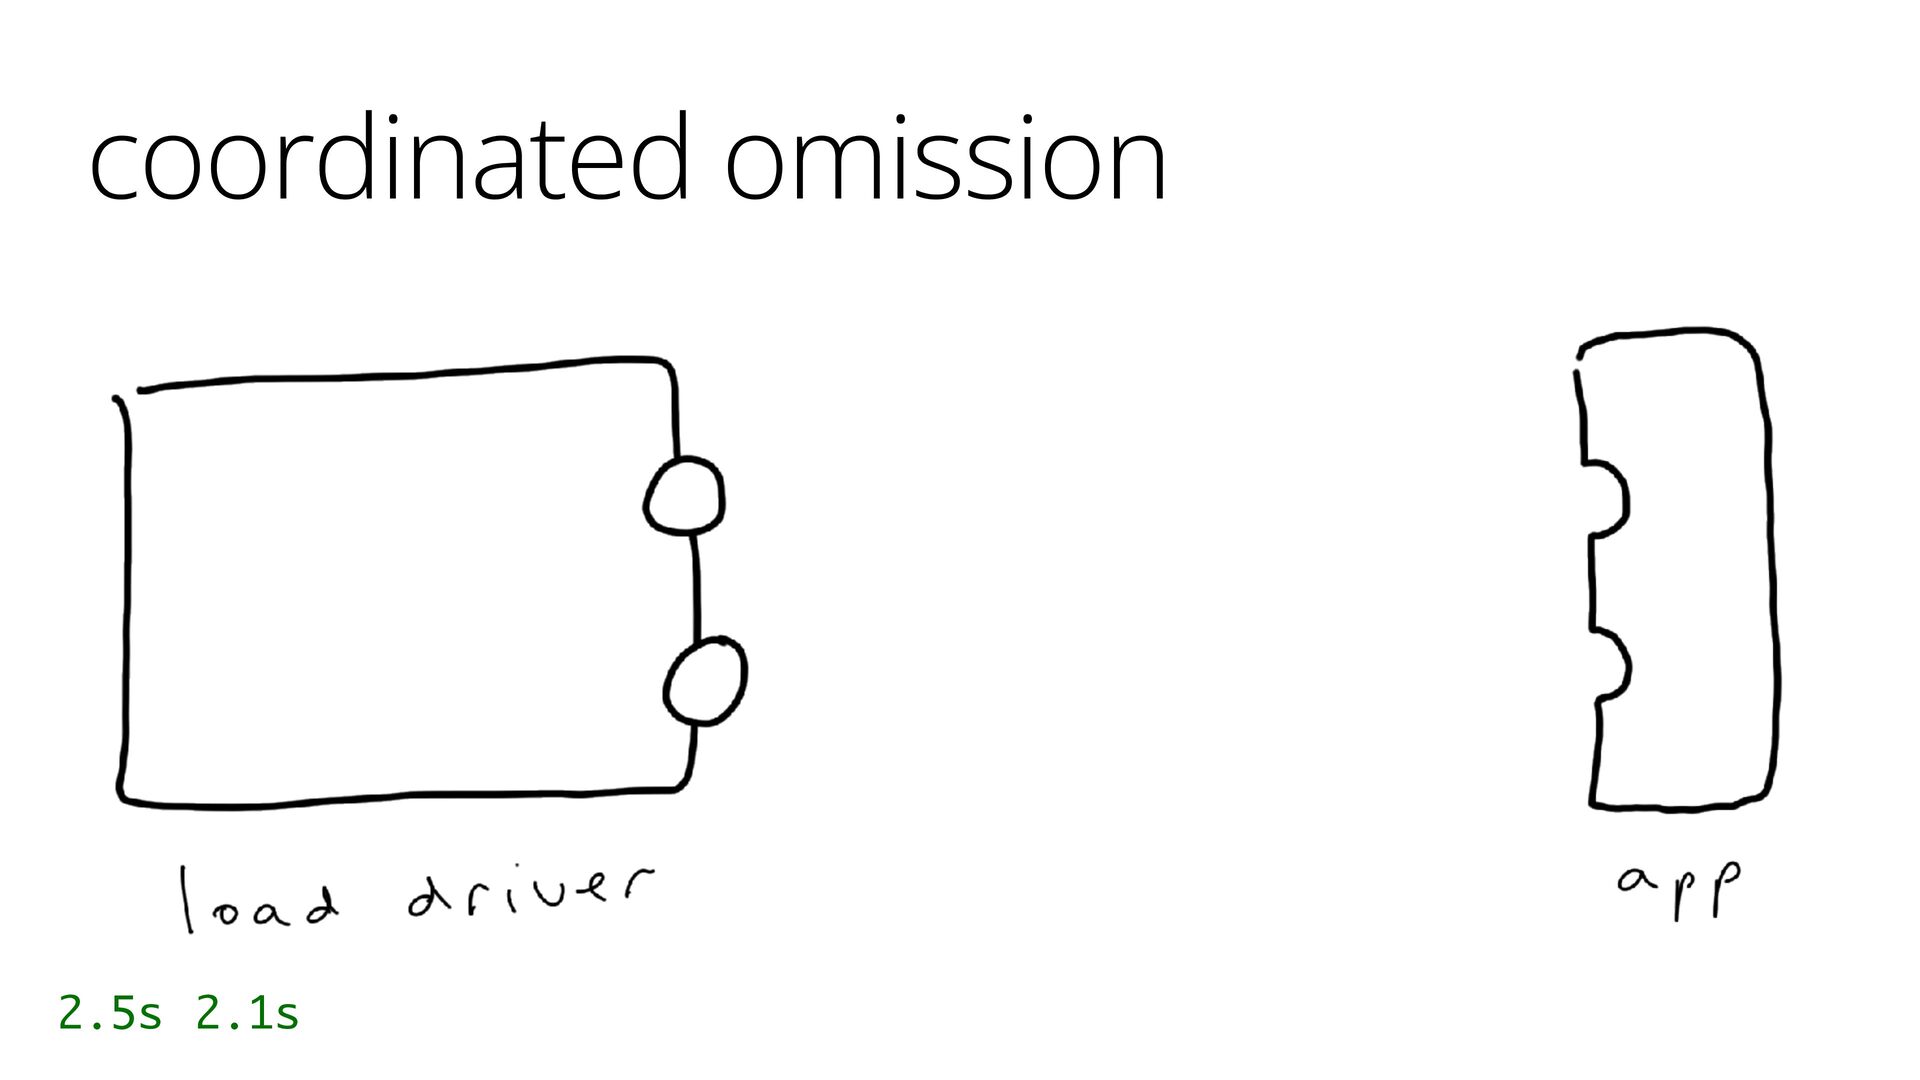
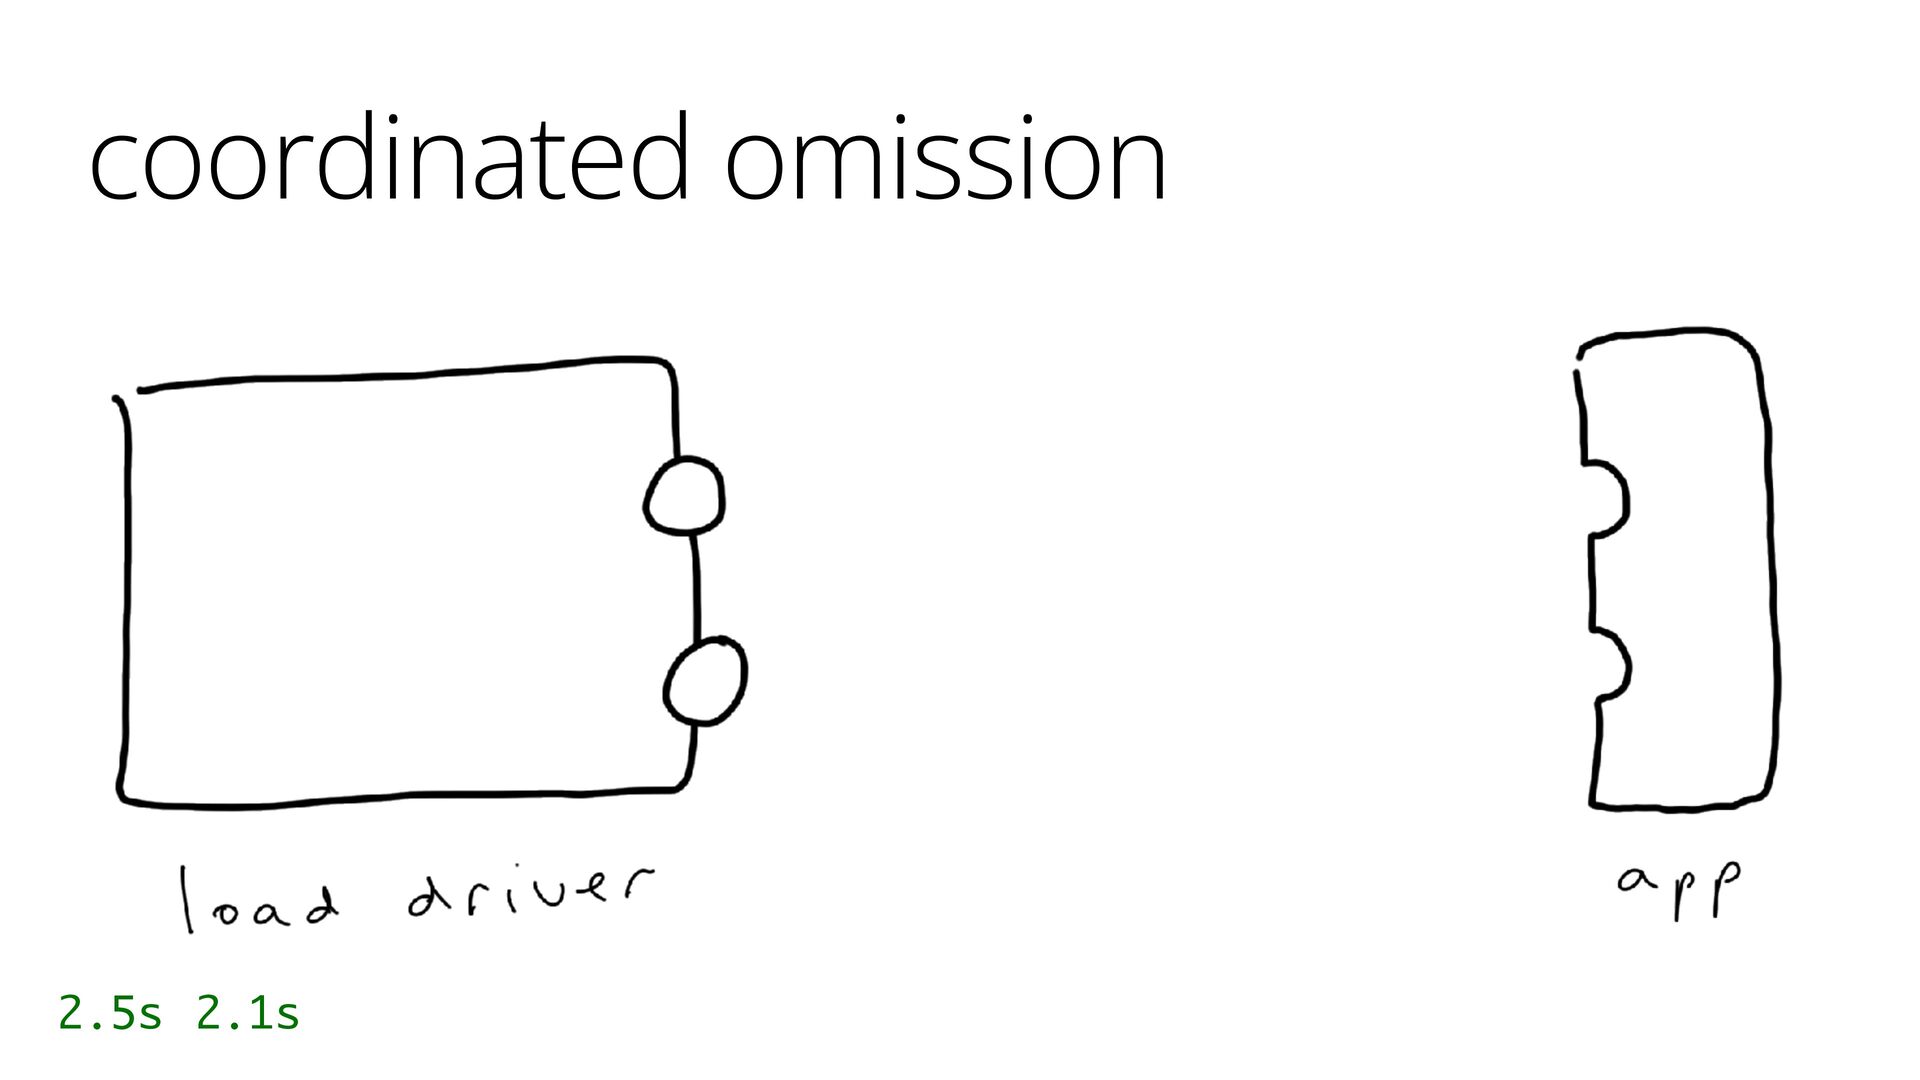
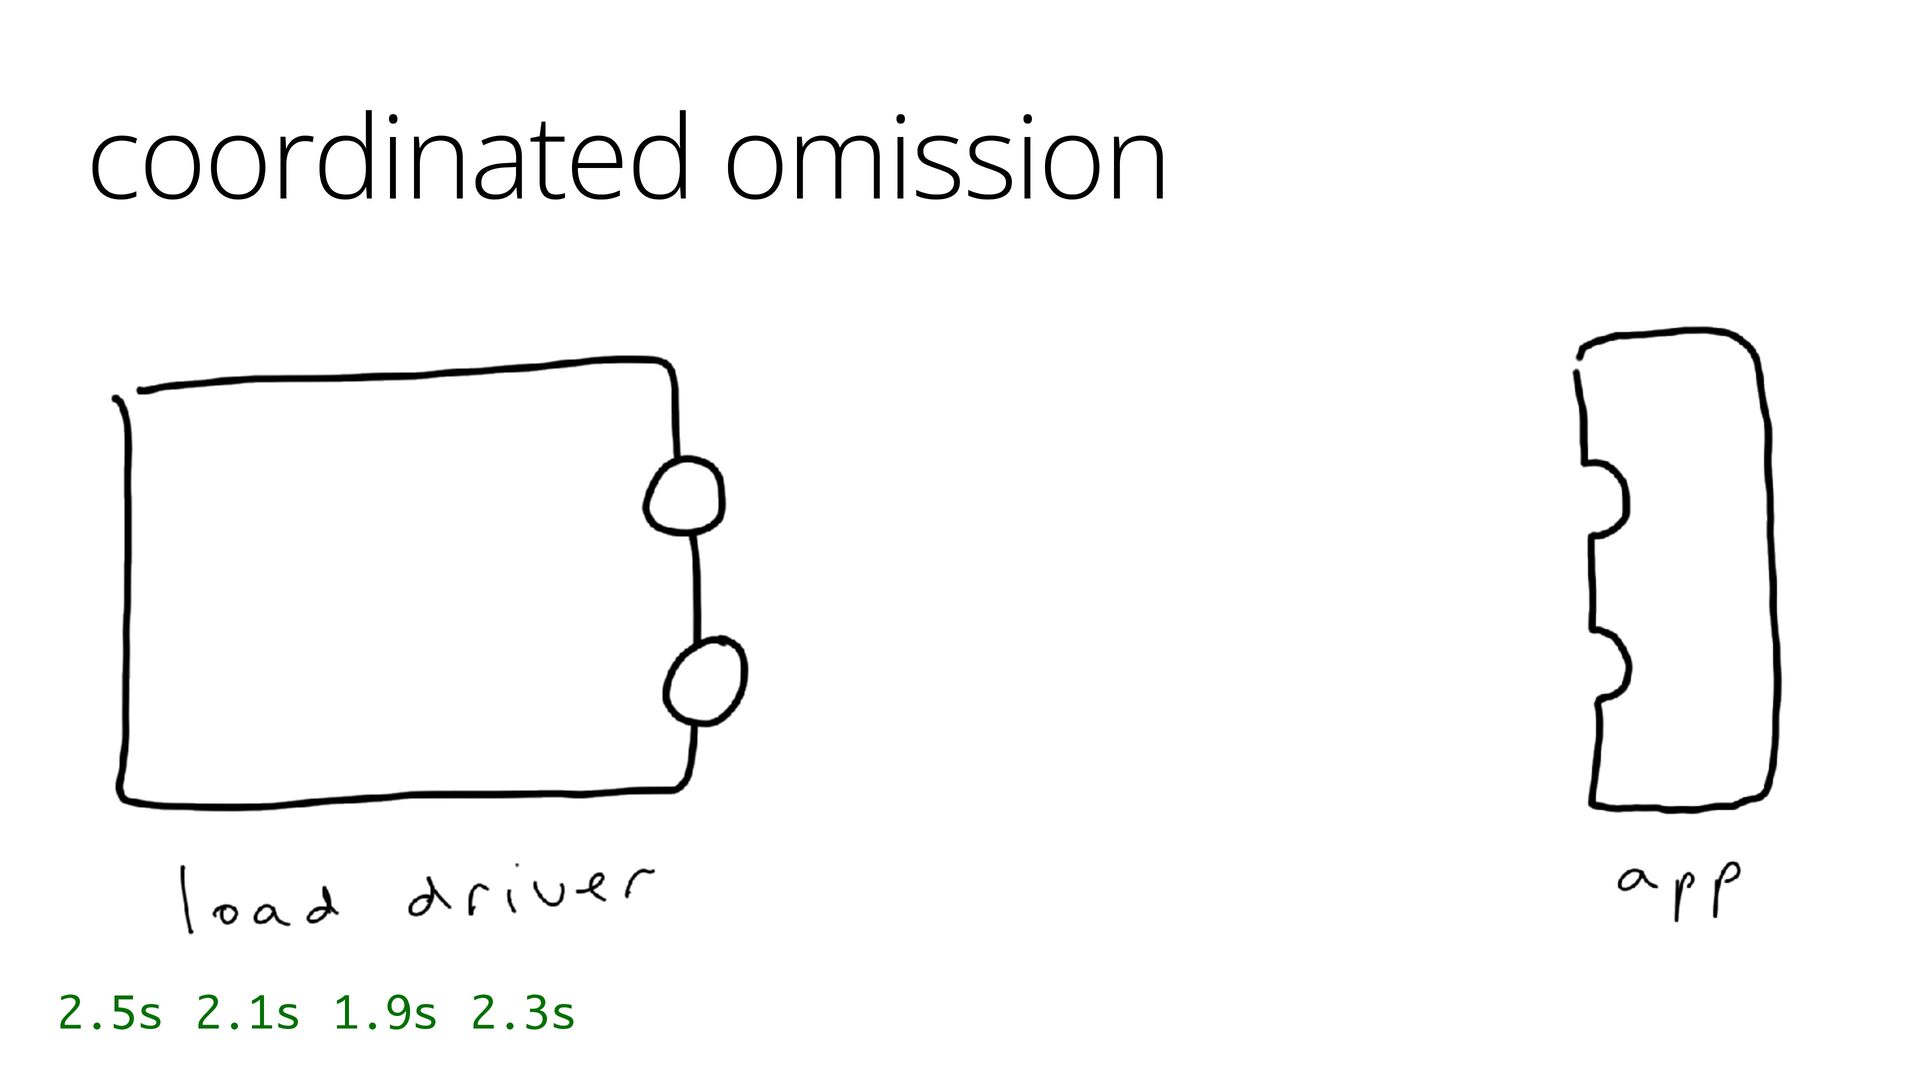
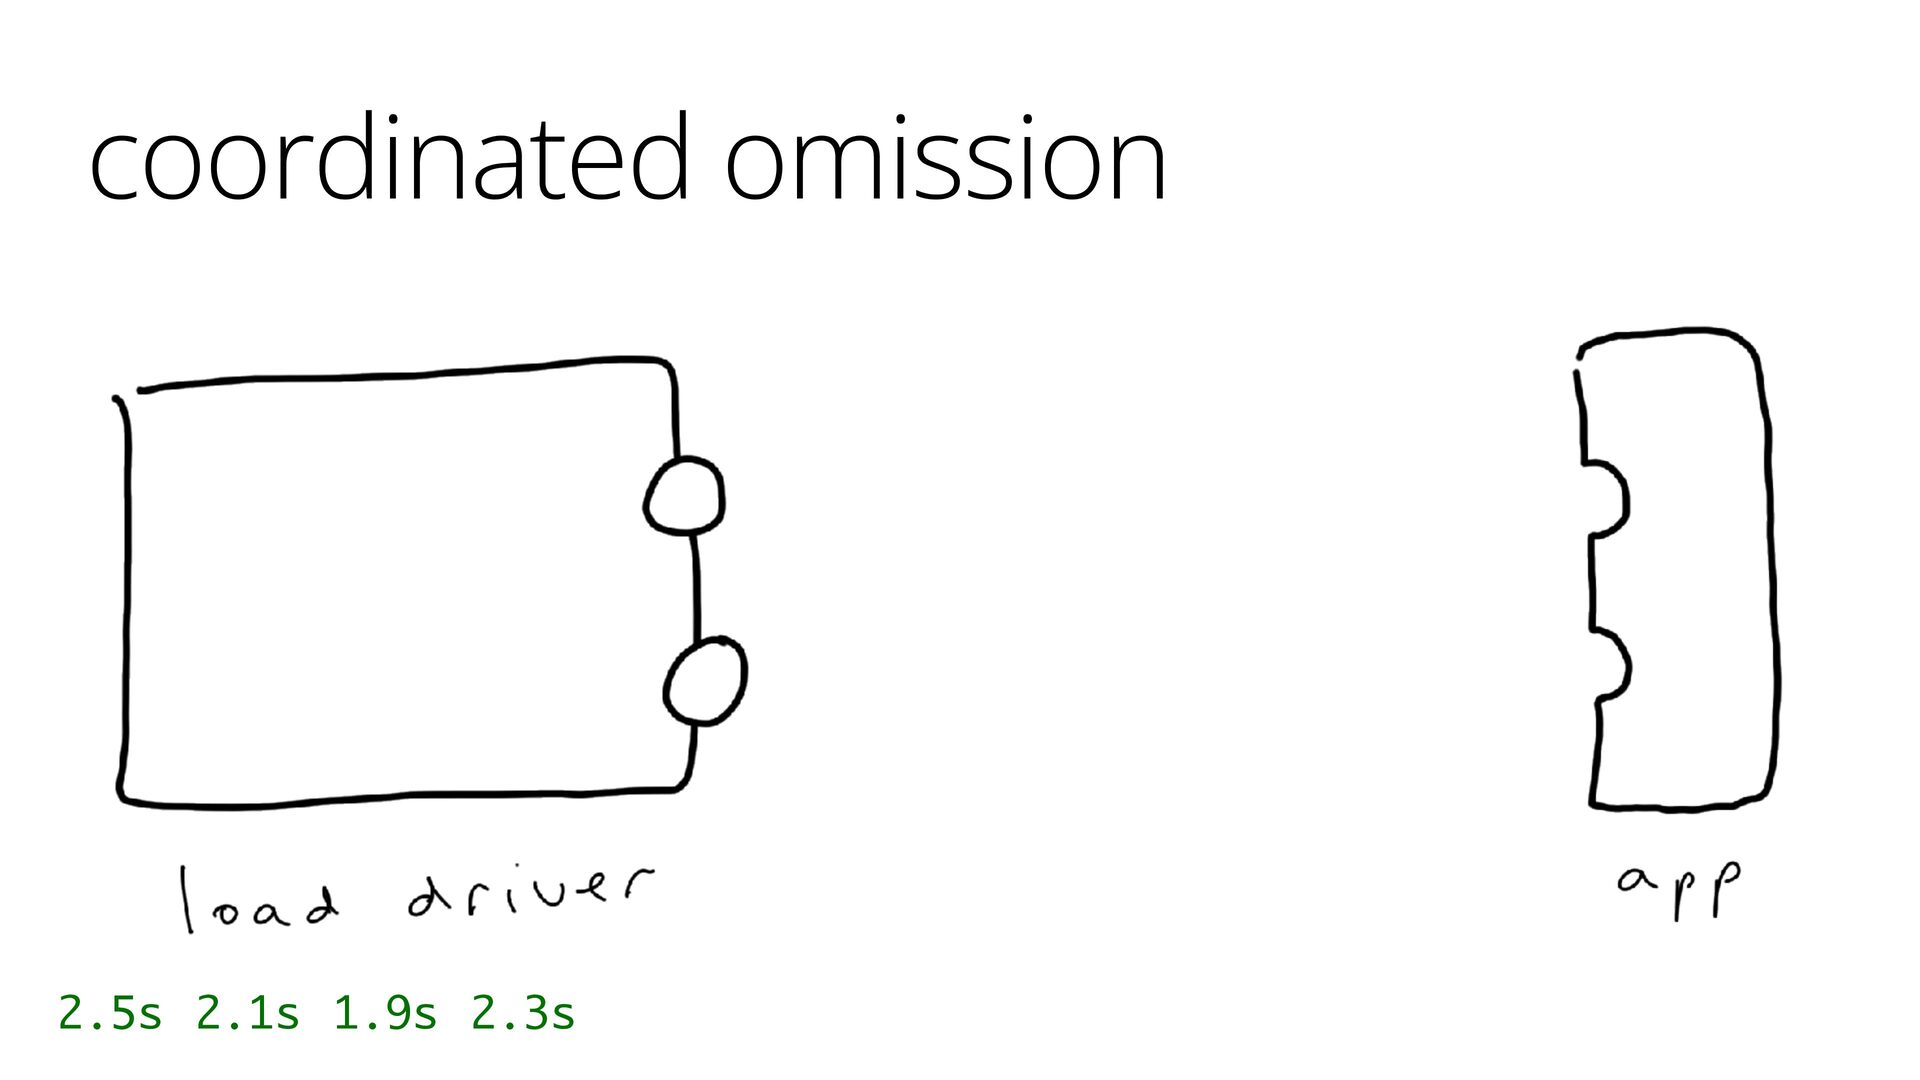
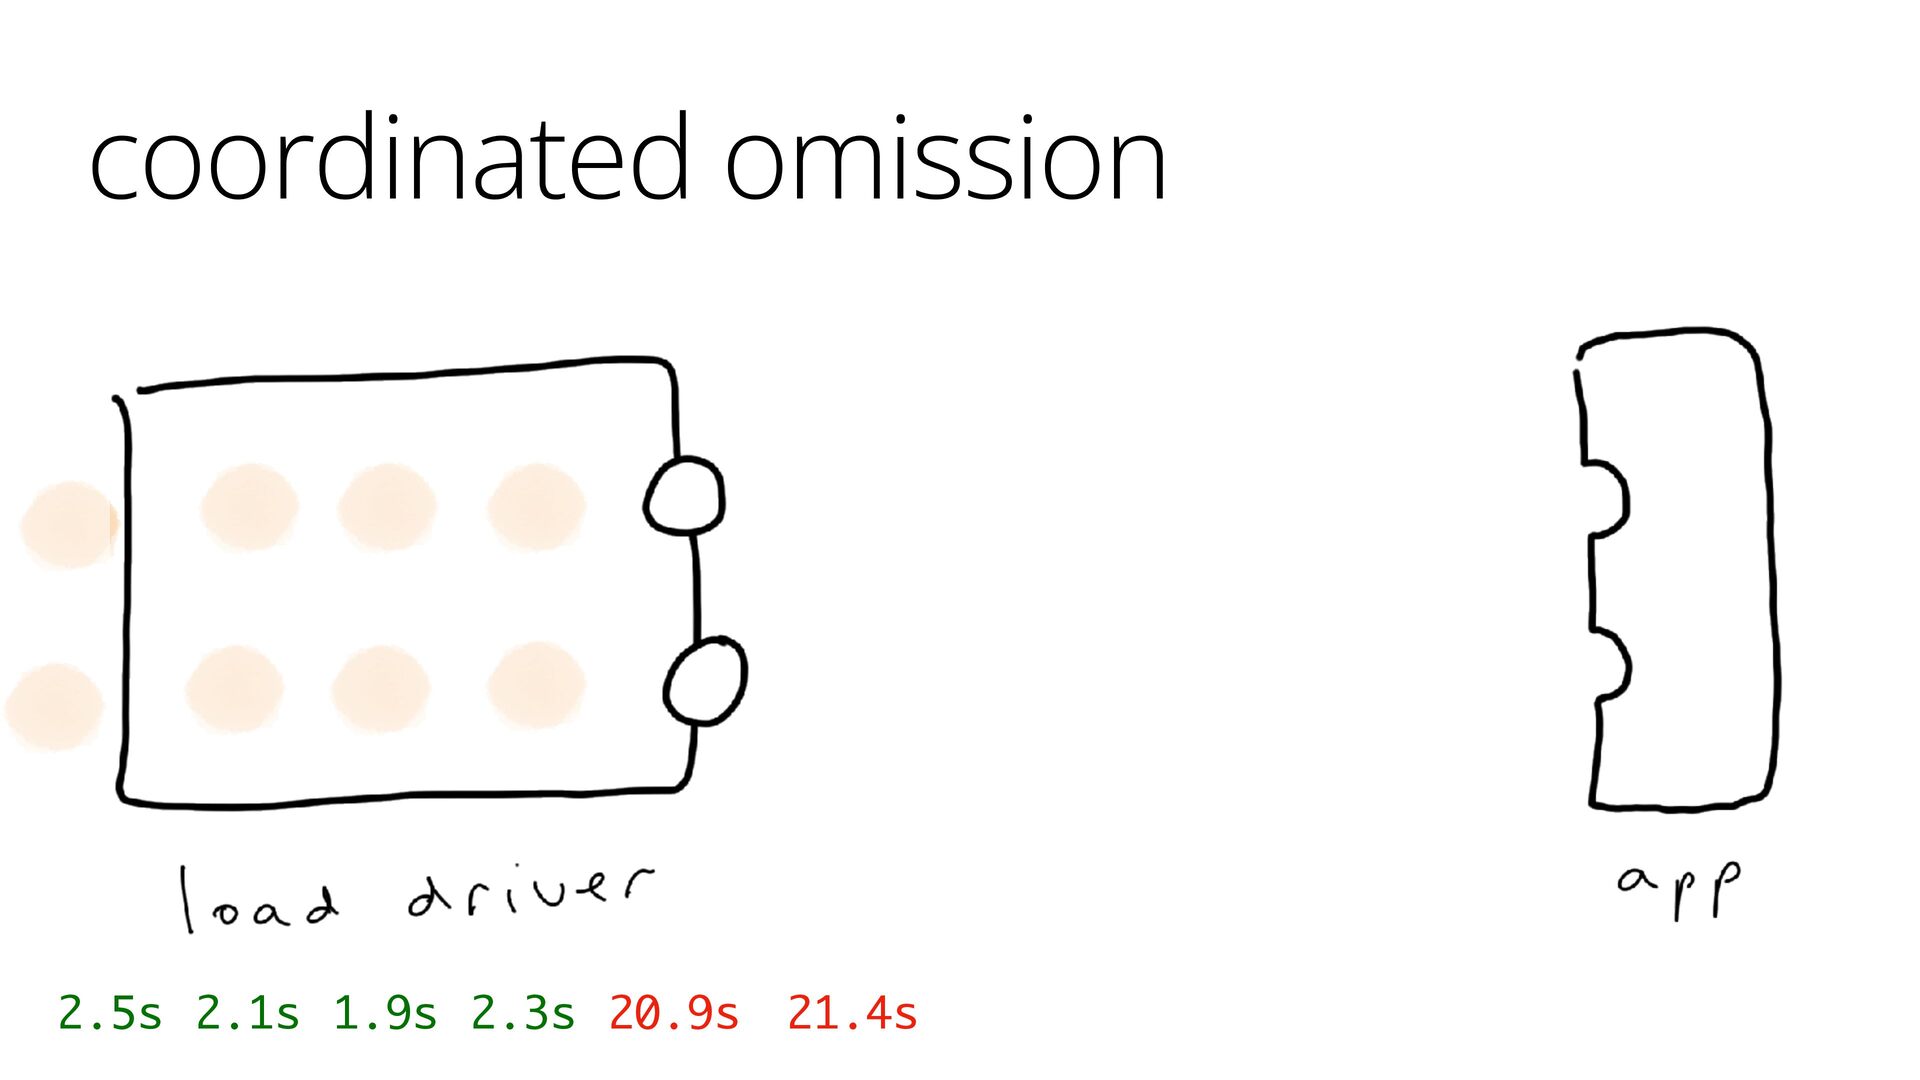
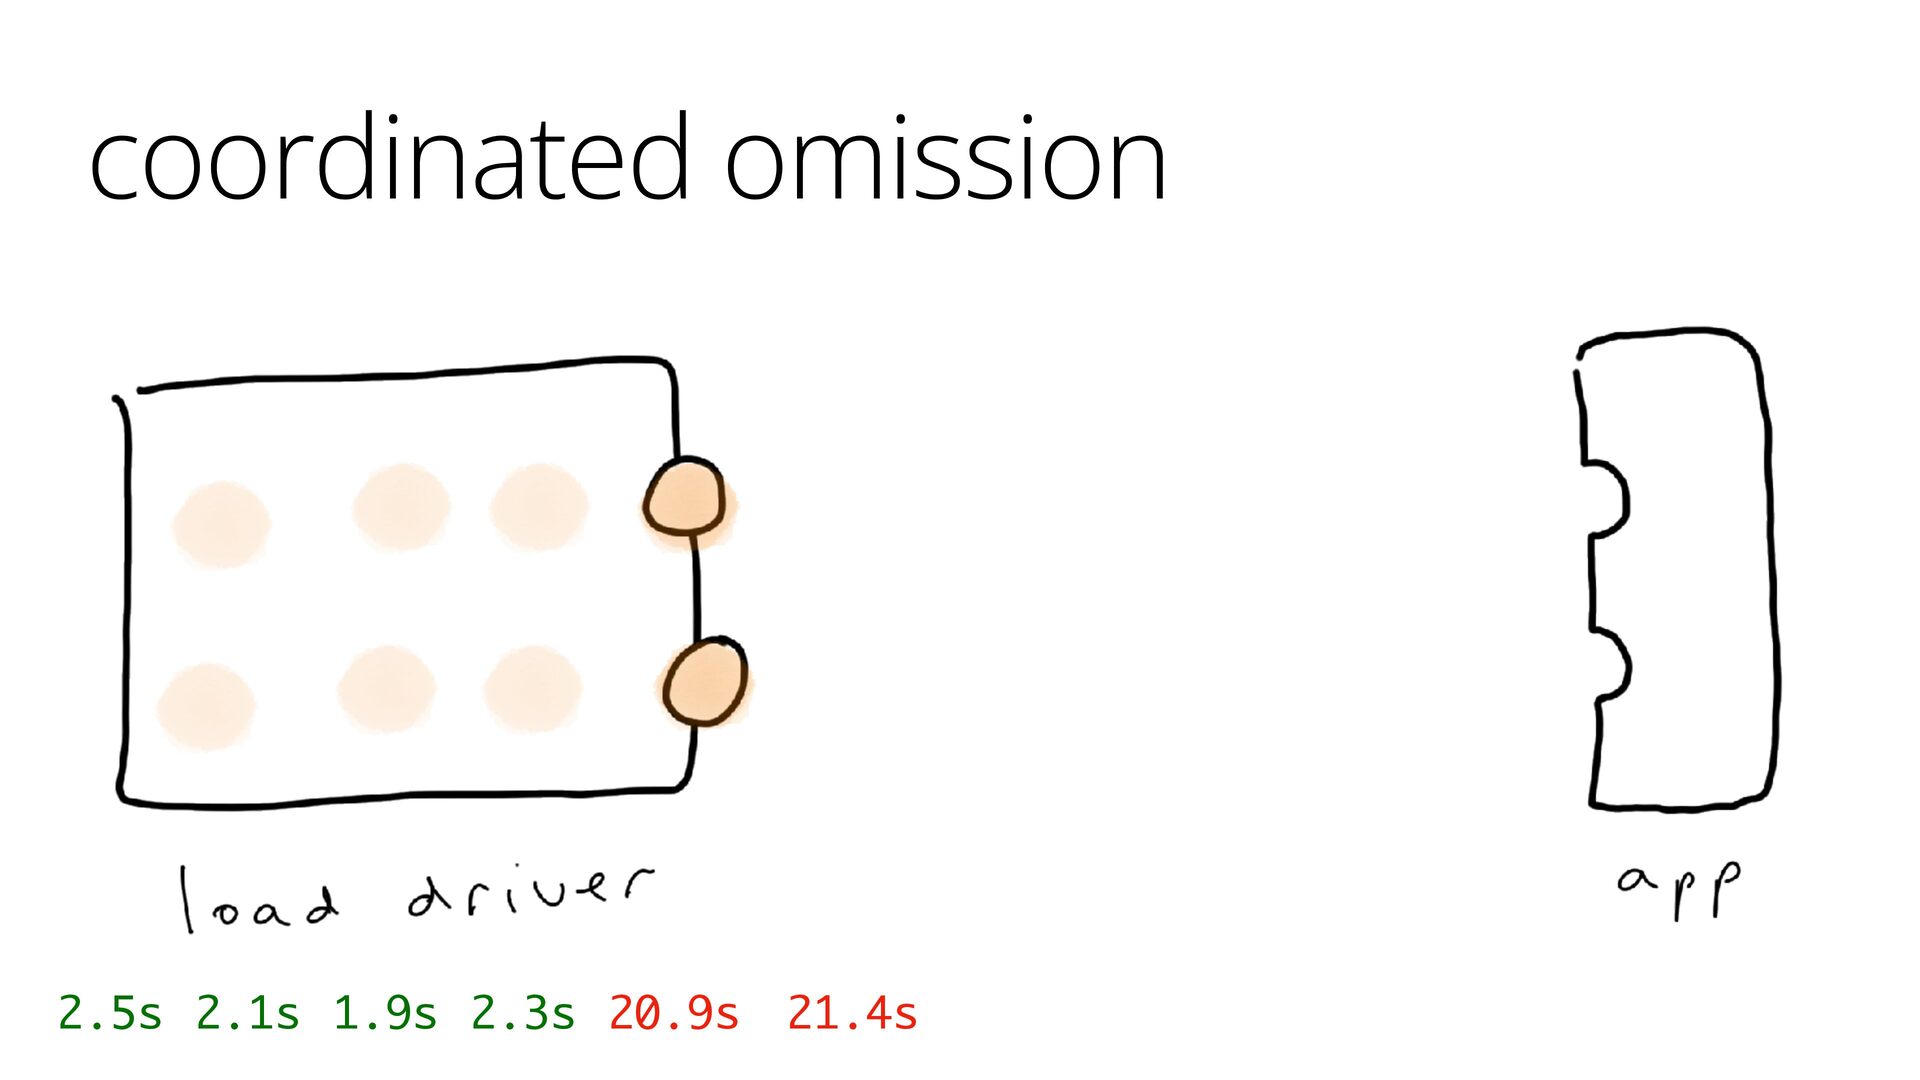
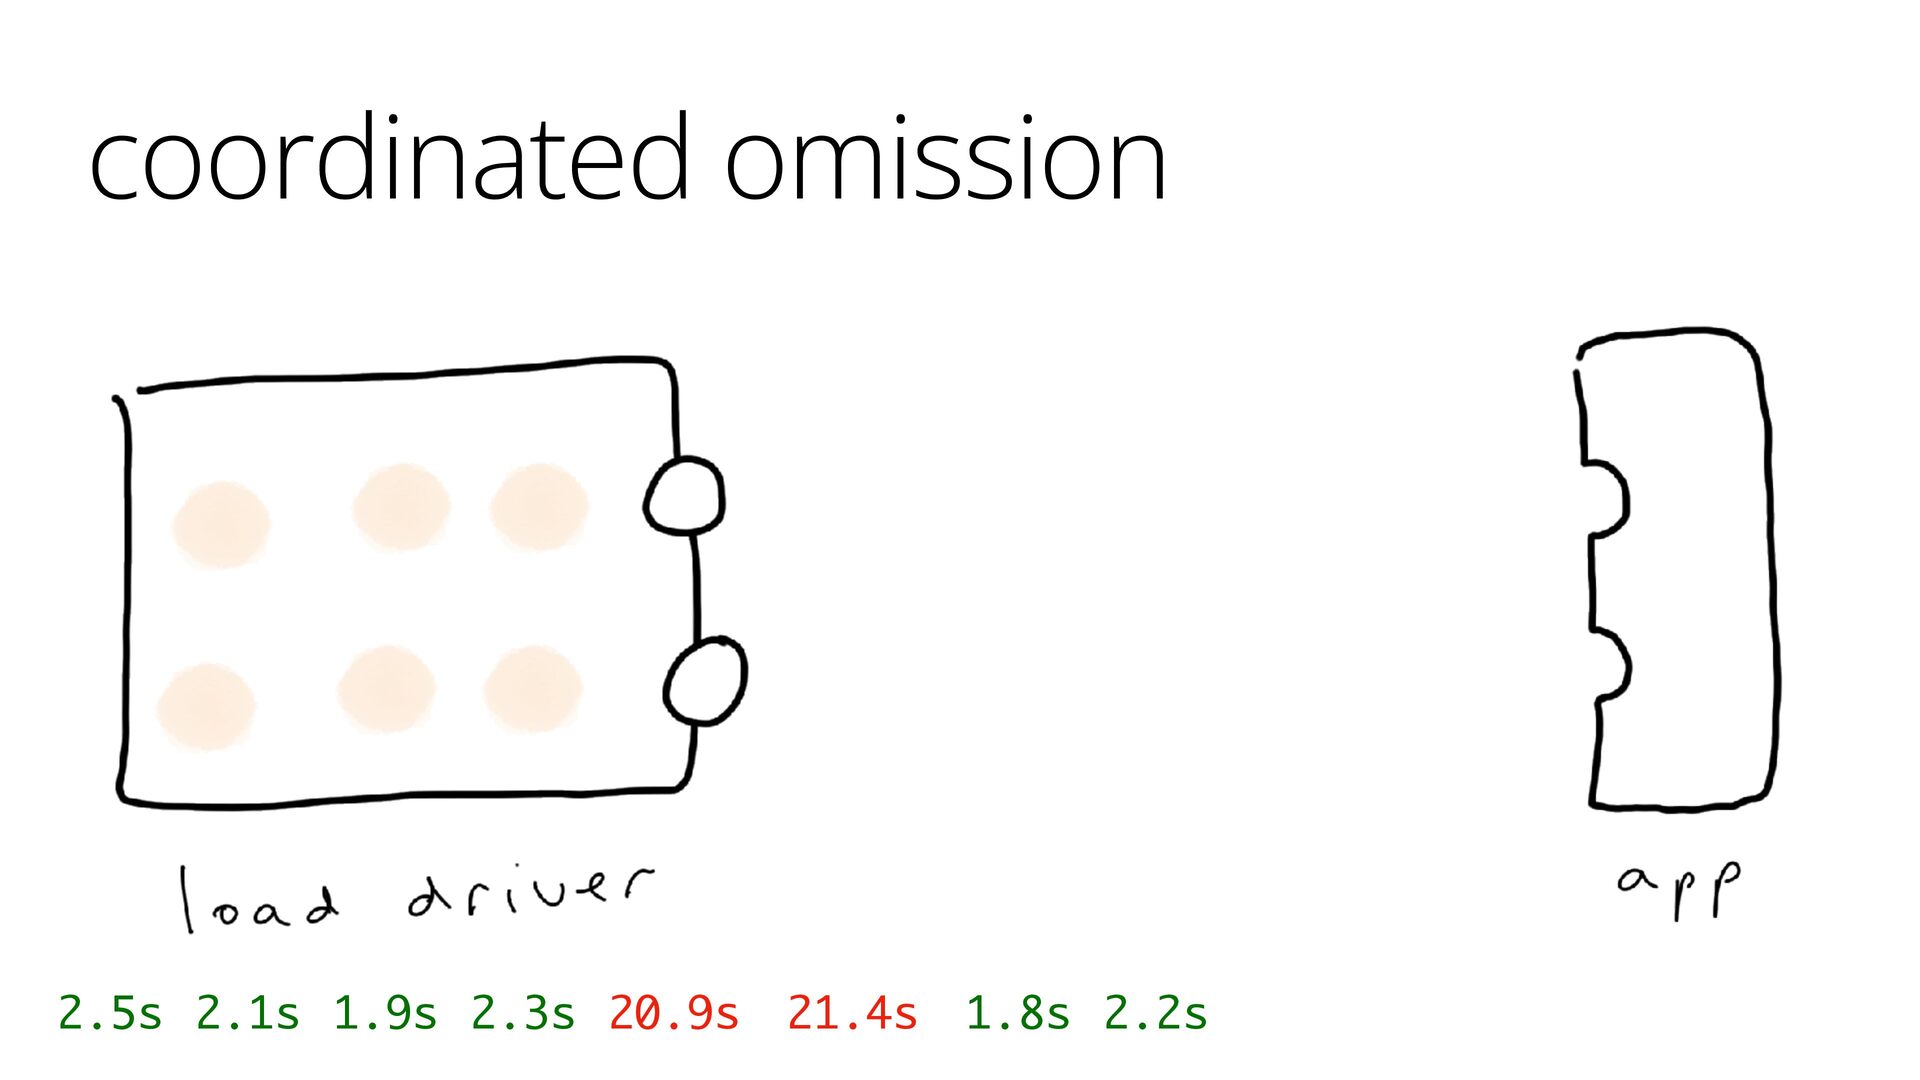
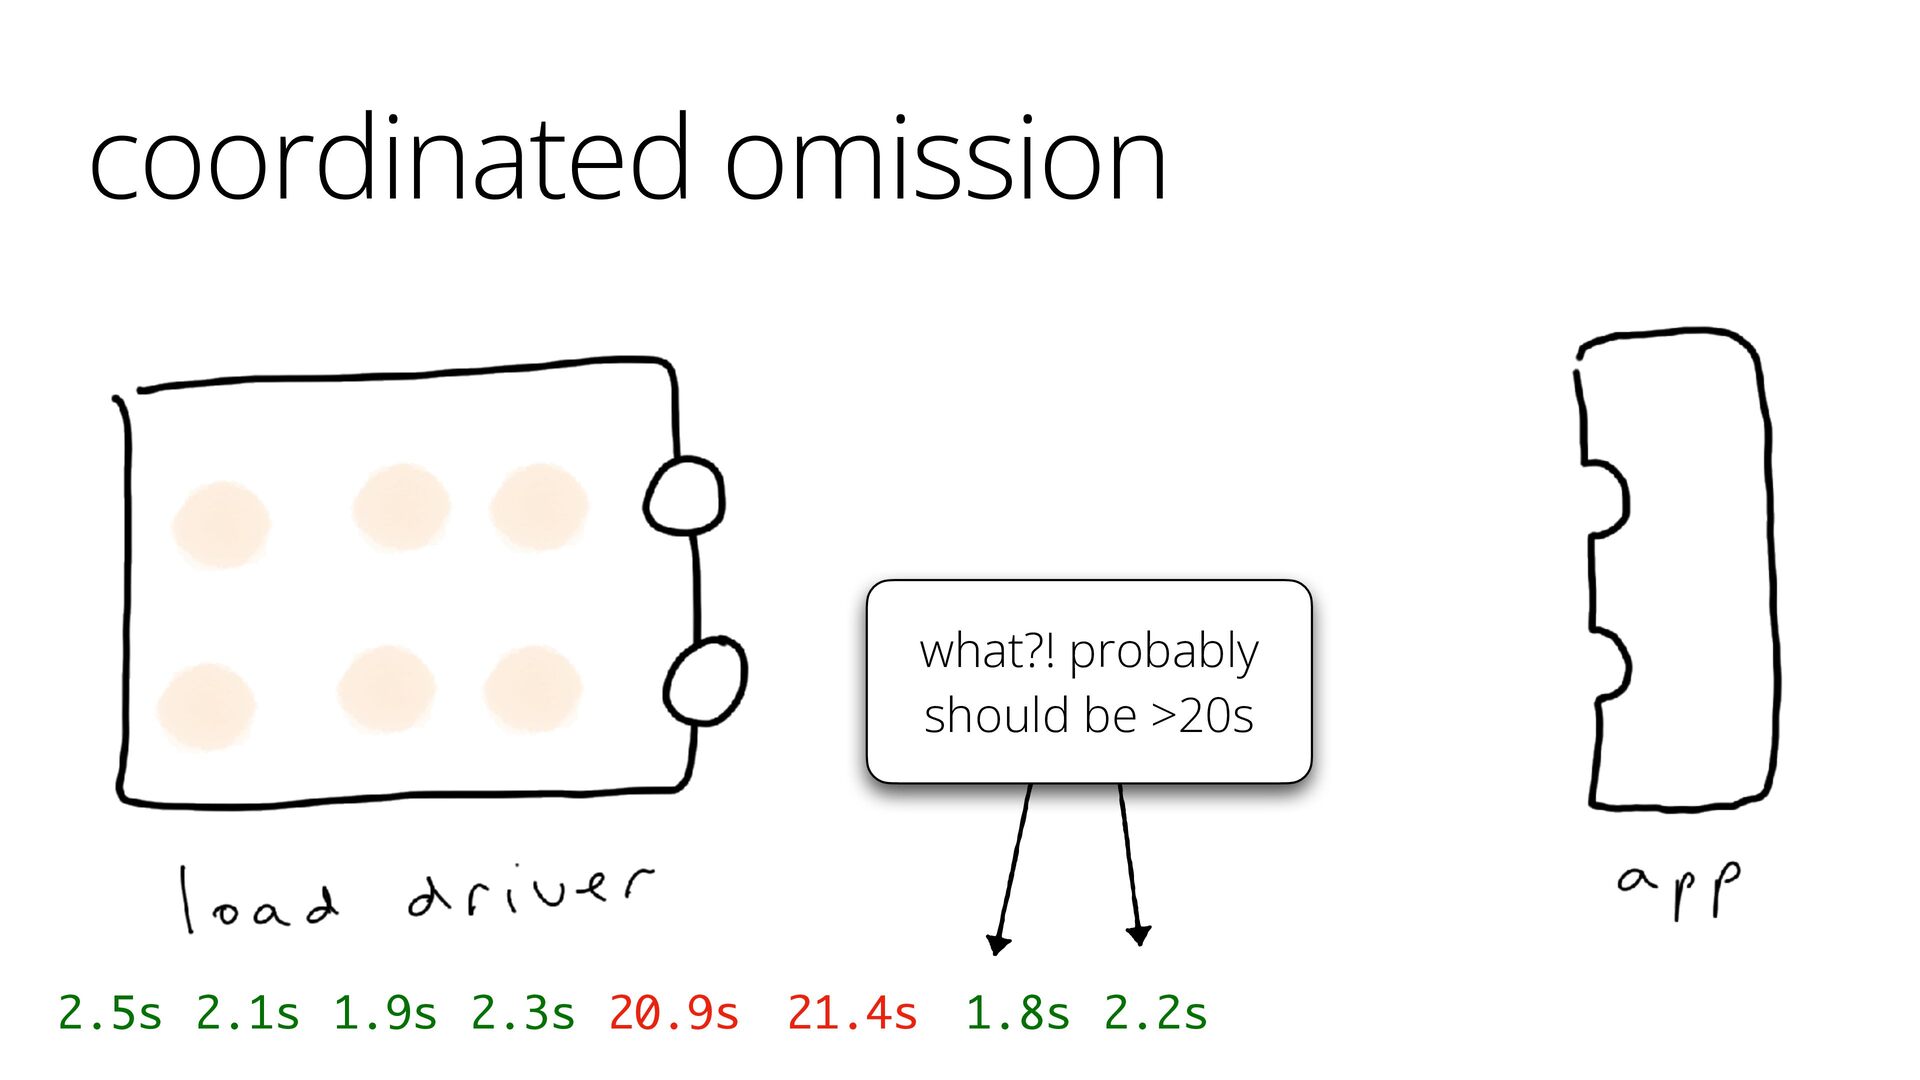
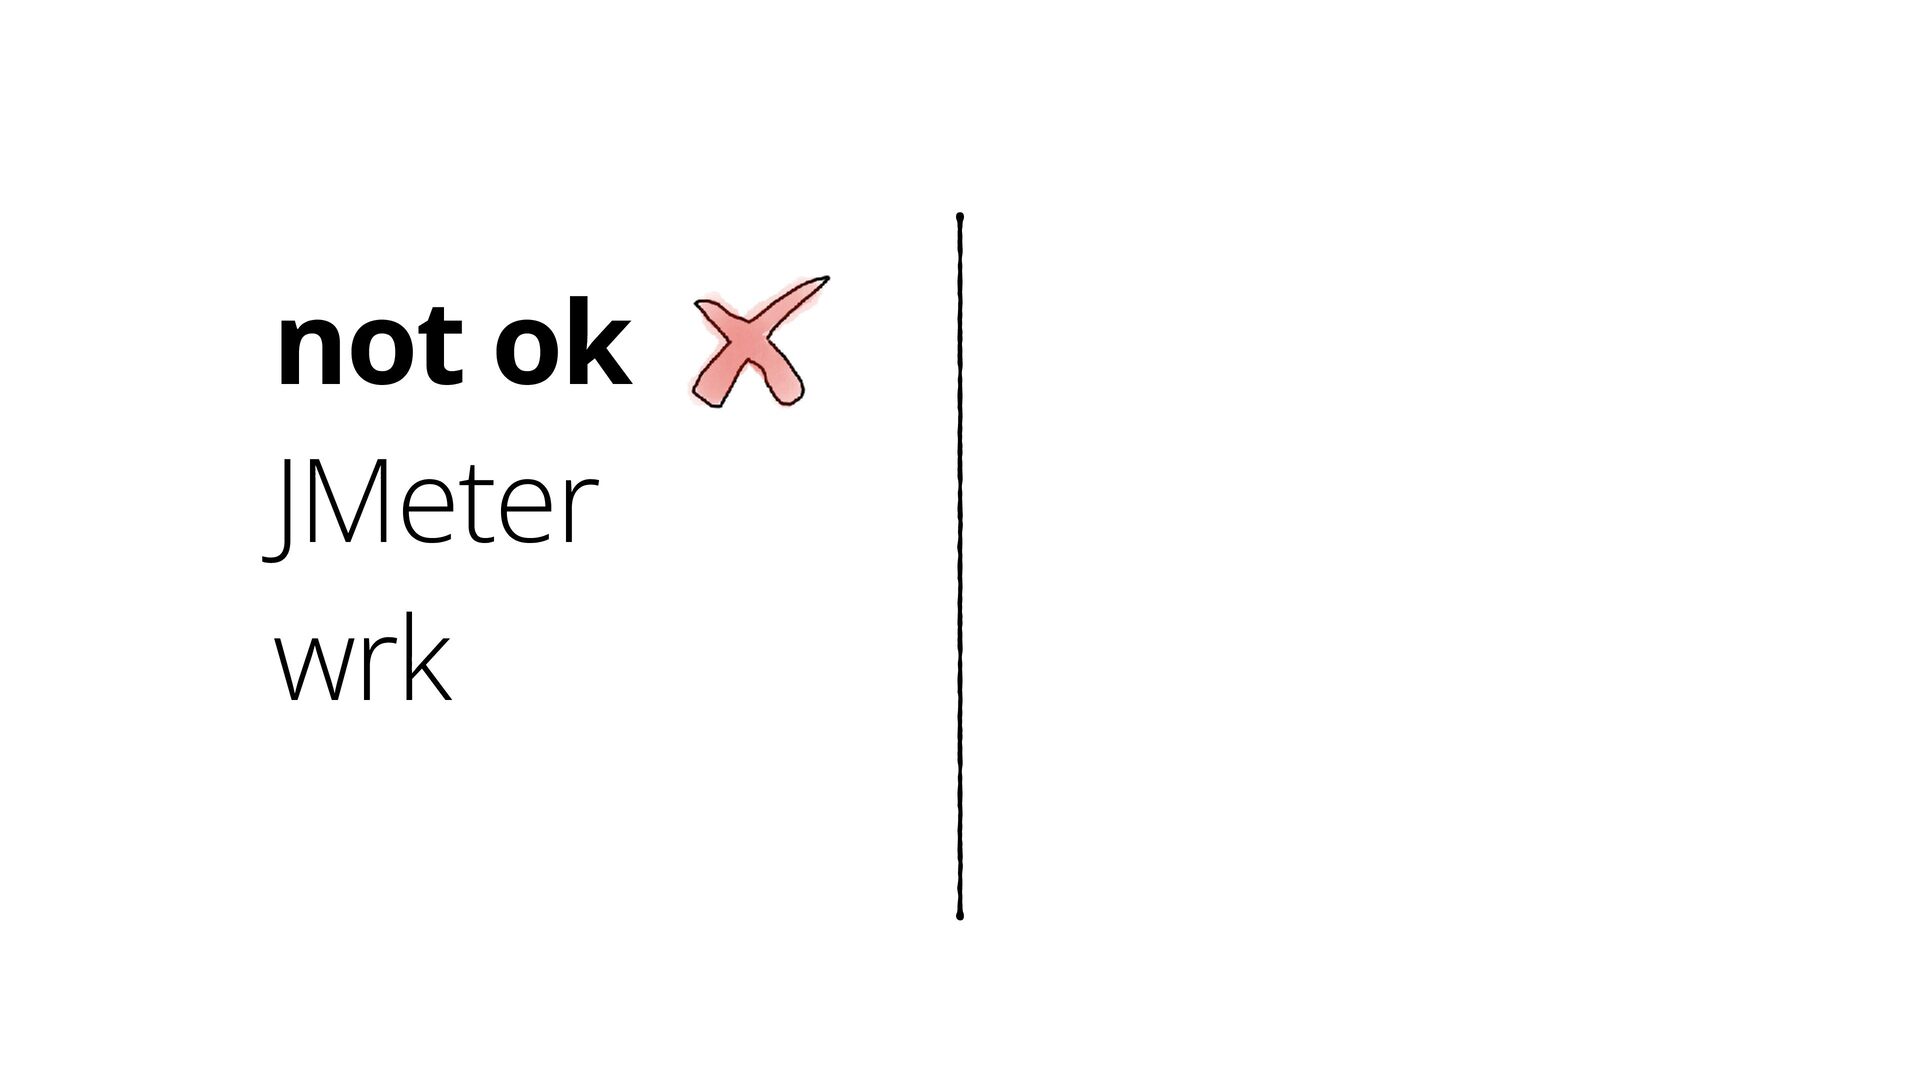
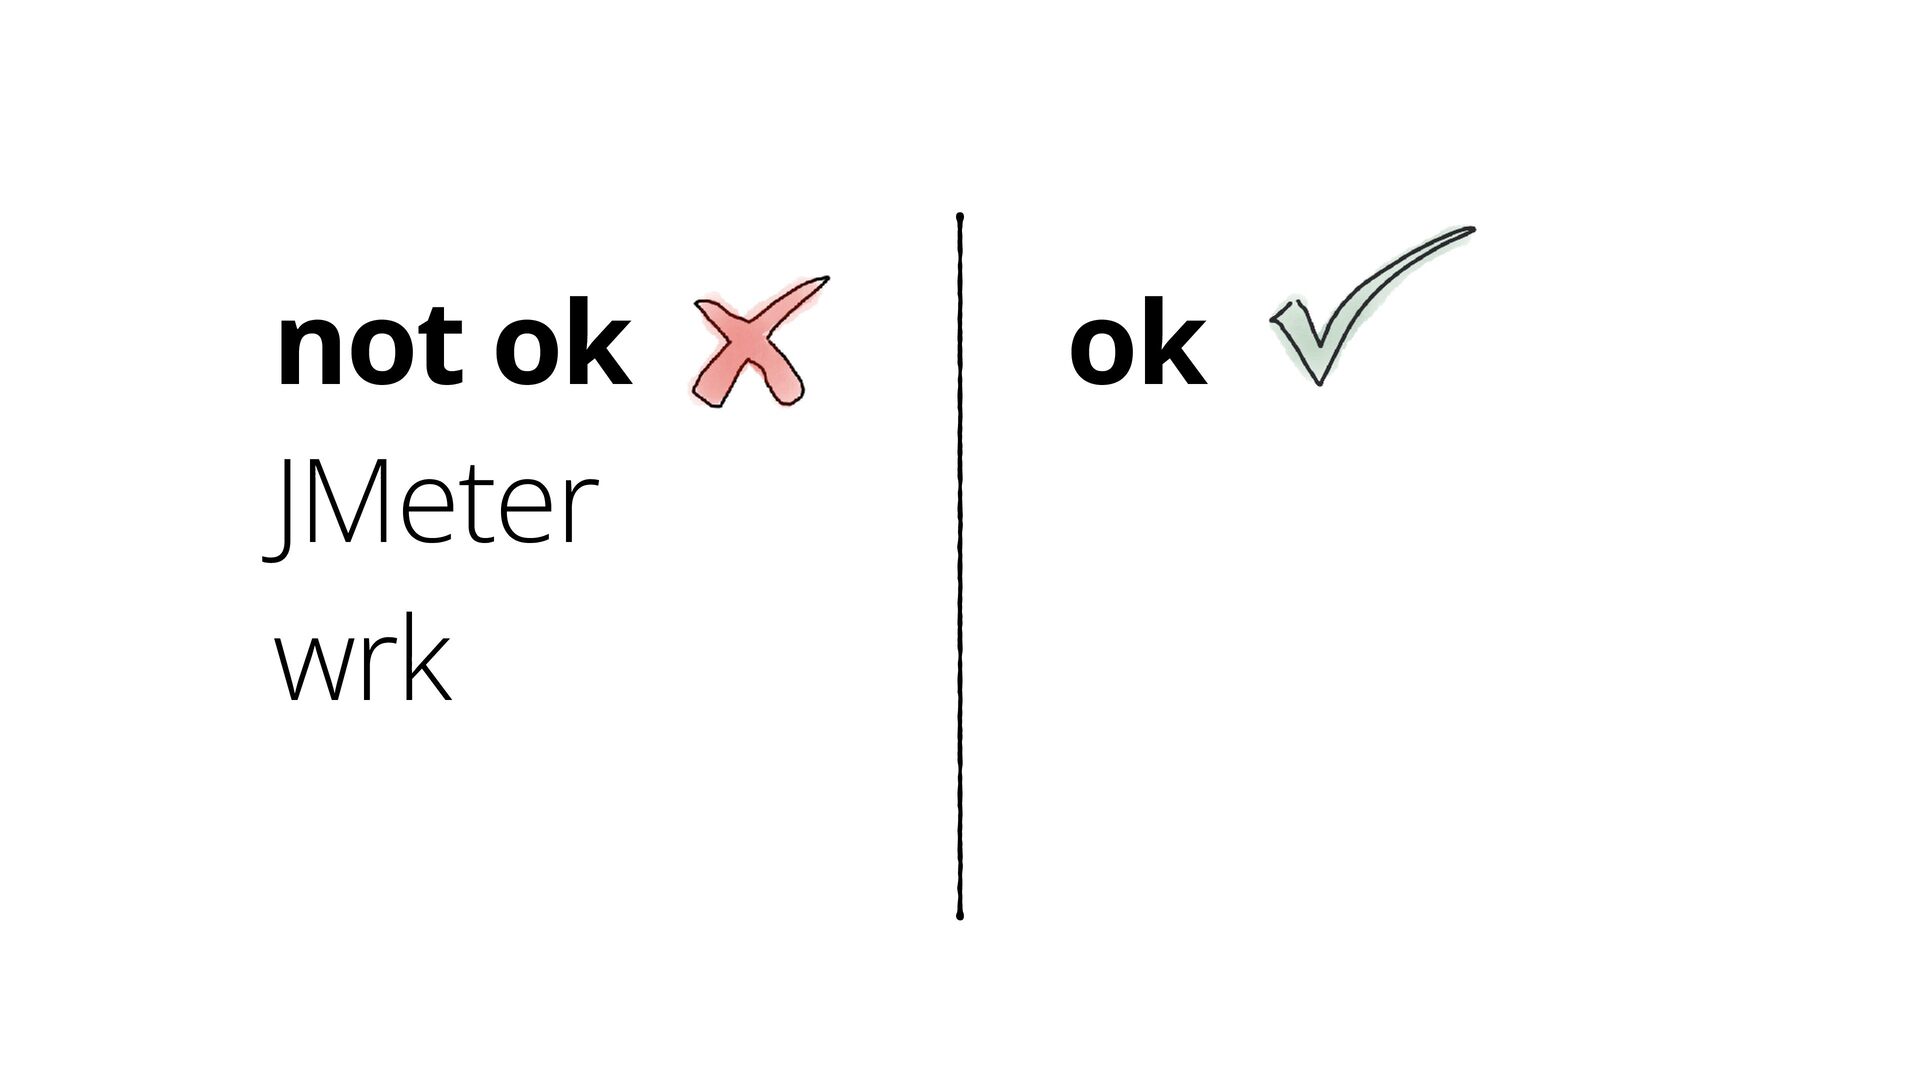
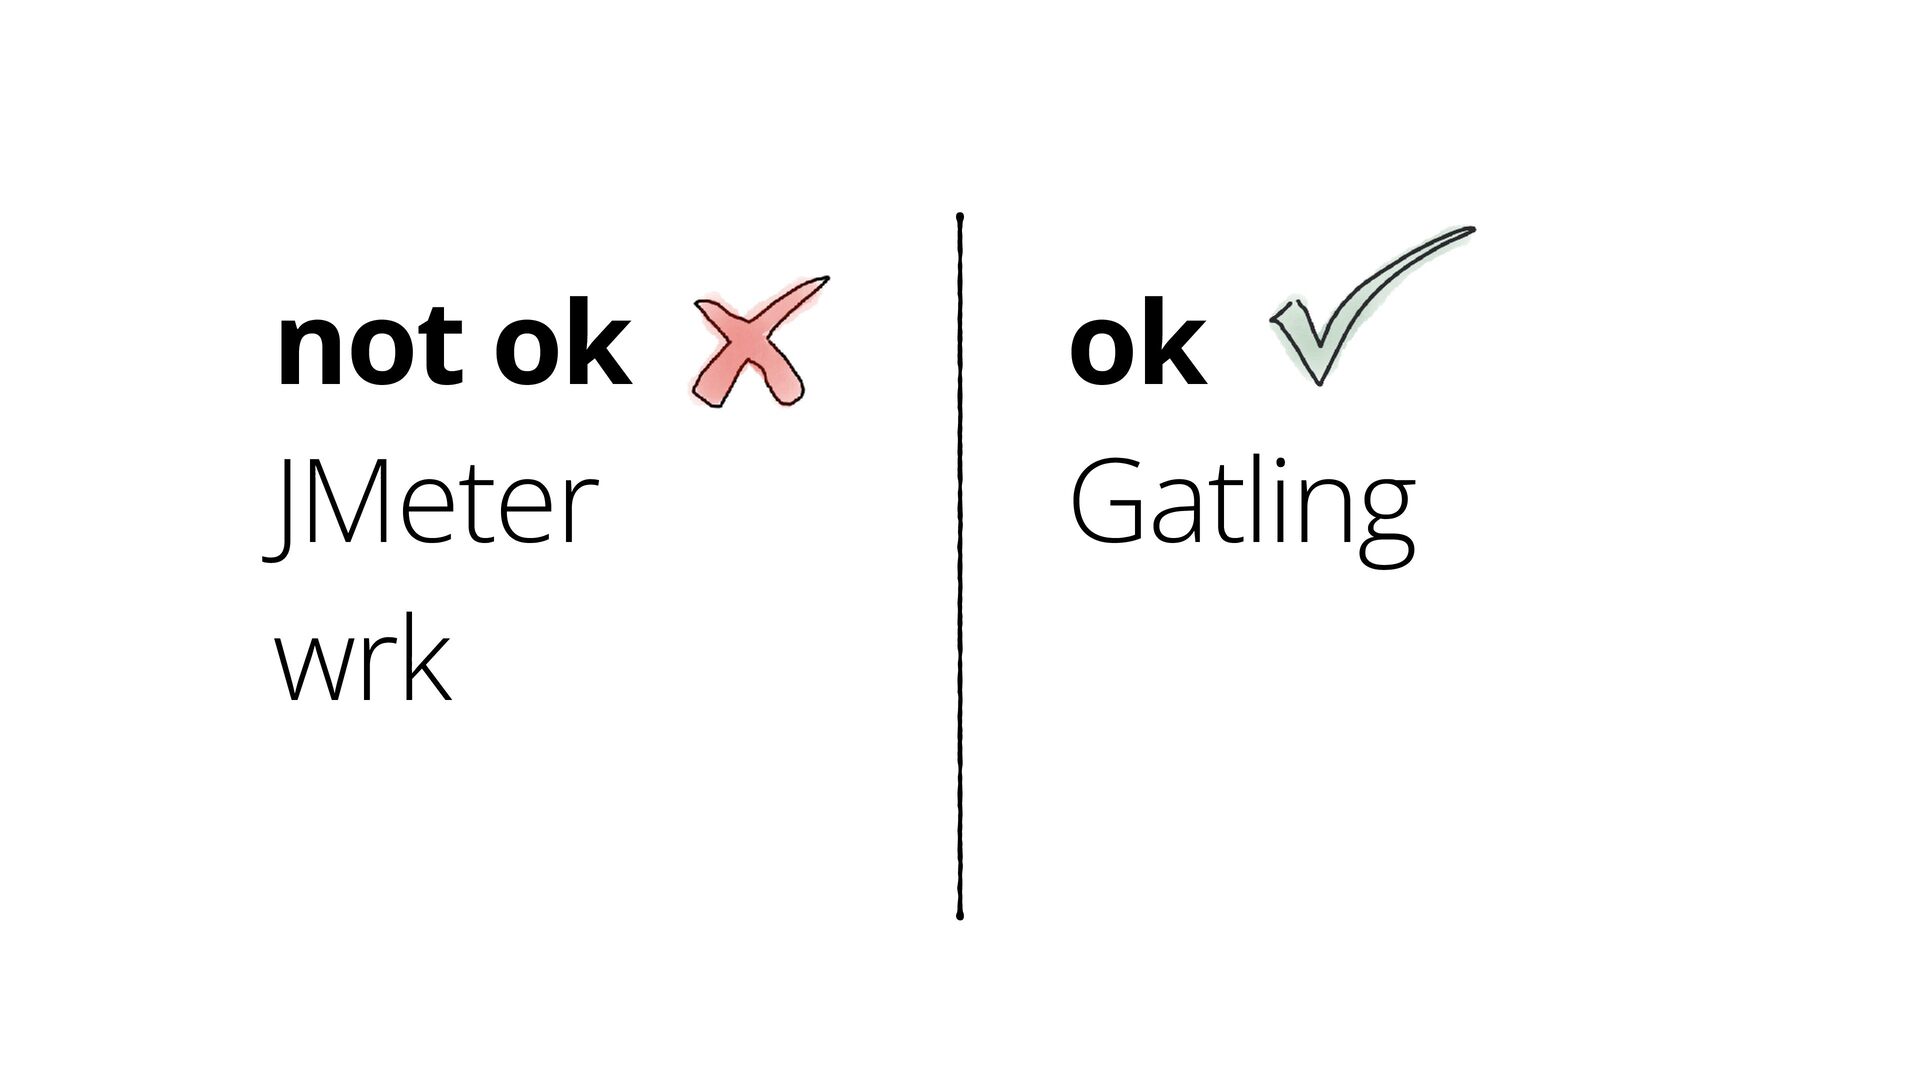
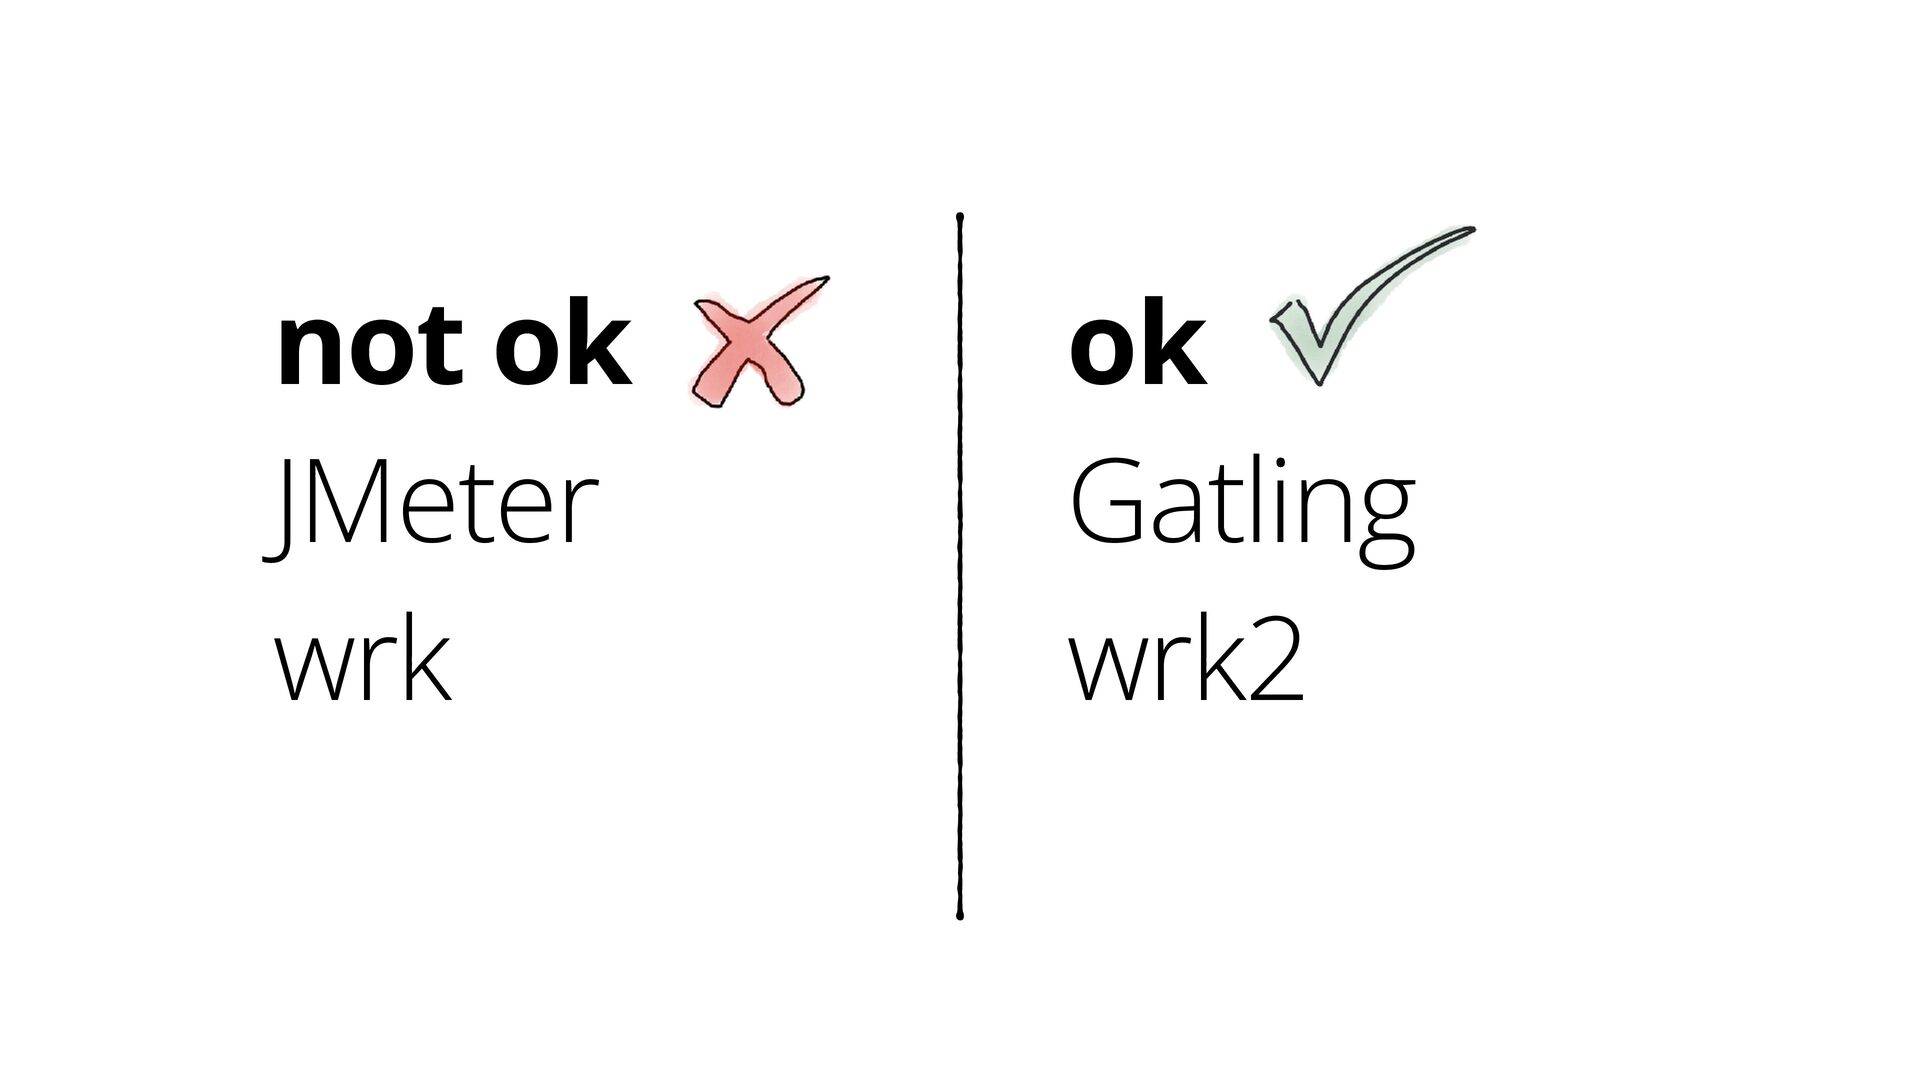
coordinated omission what?! probably should be >20s 2.5s 2.1s 1.9s
2.3s 20.9s 21.4s 1.8s 2.2s -
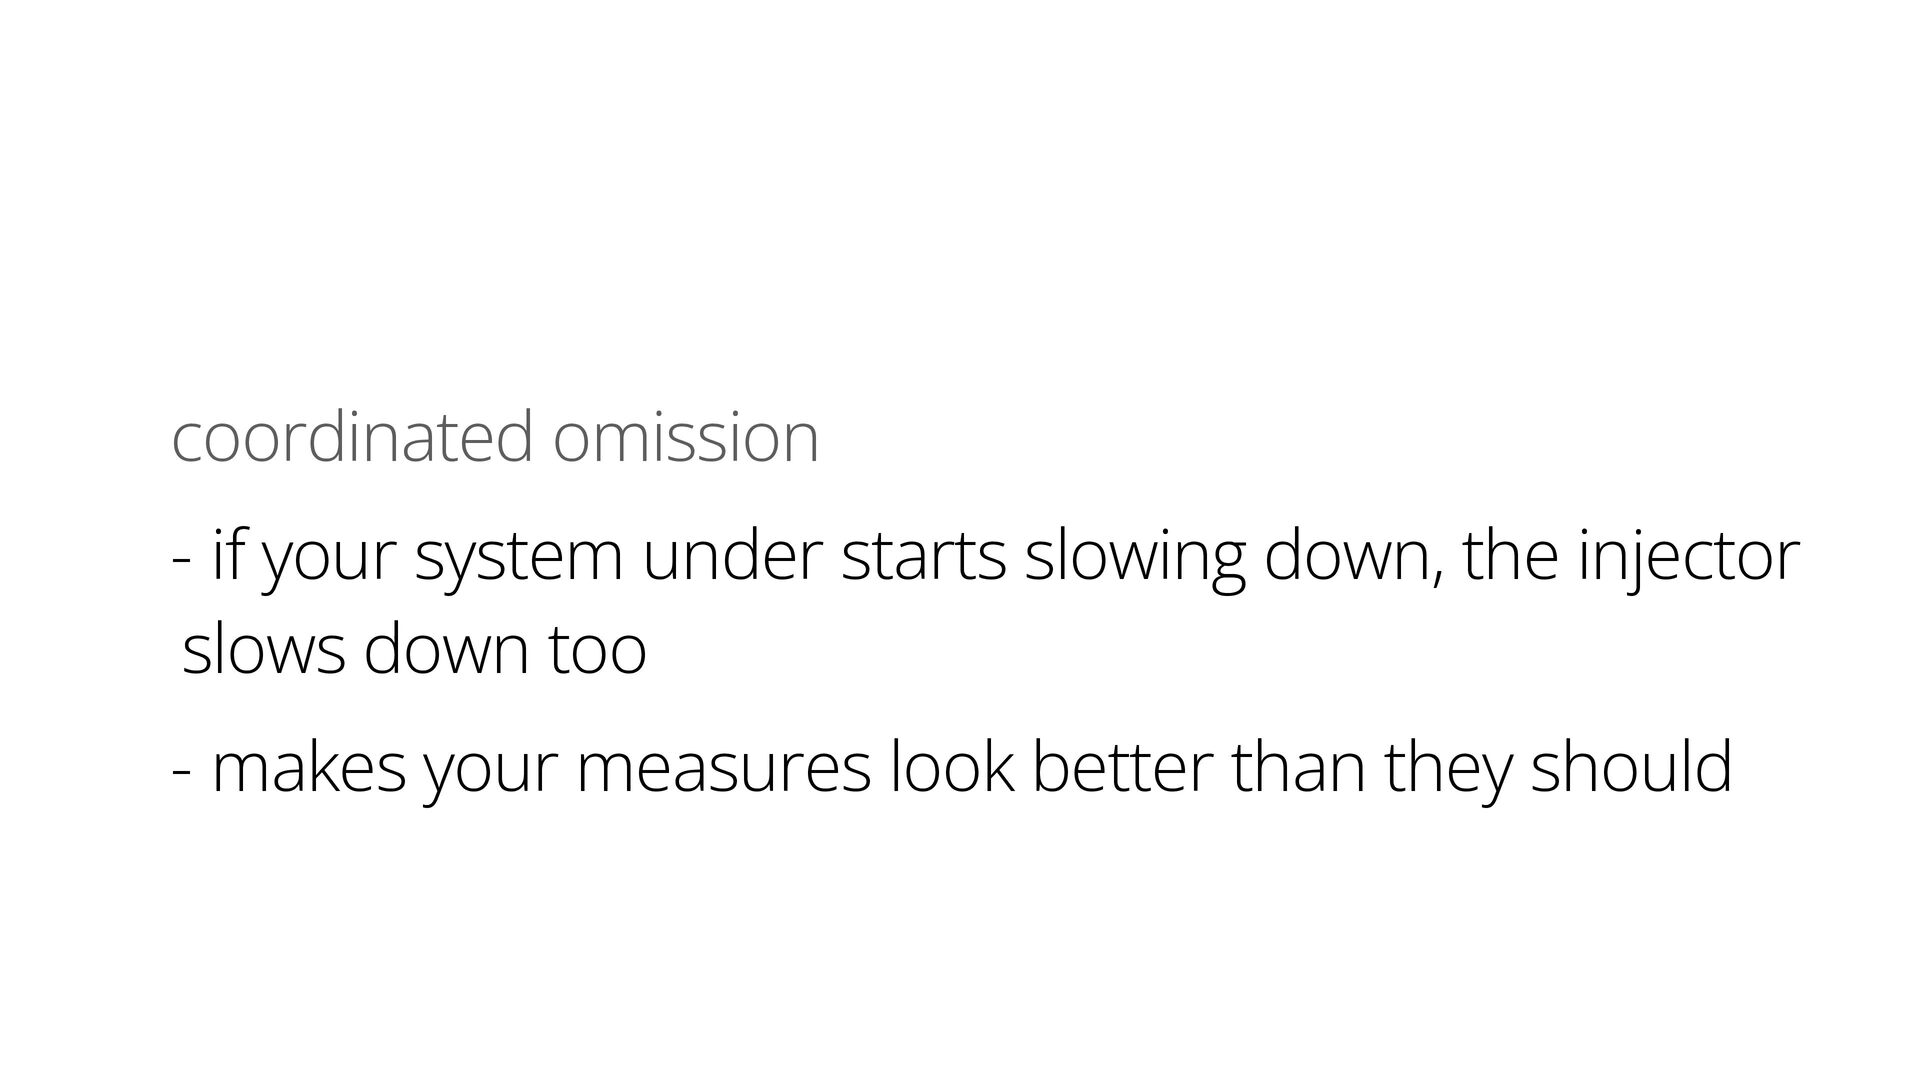
coordinated omission - if your system under starts slowing down,
the injector slows down too - makes your measures look better than they should -
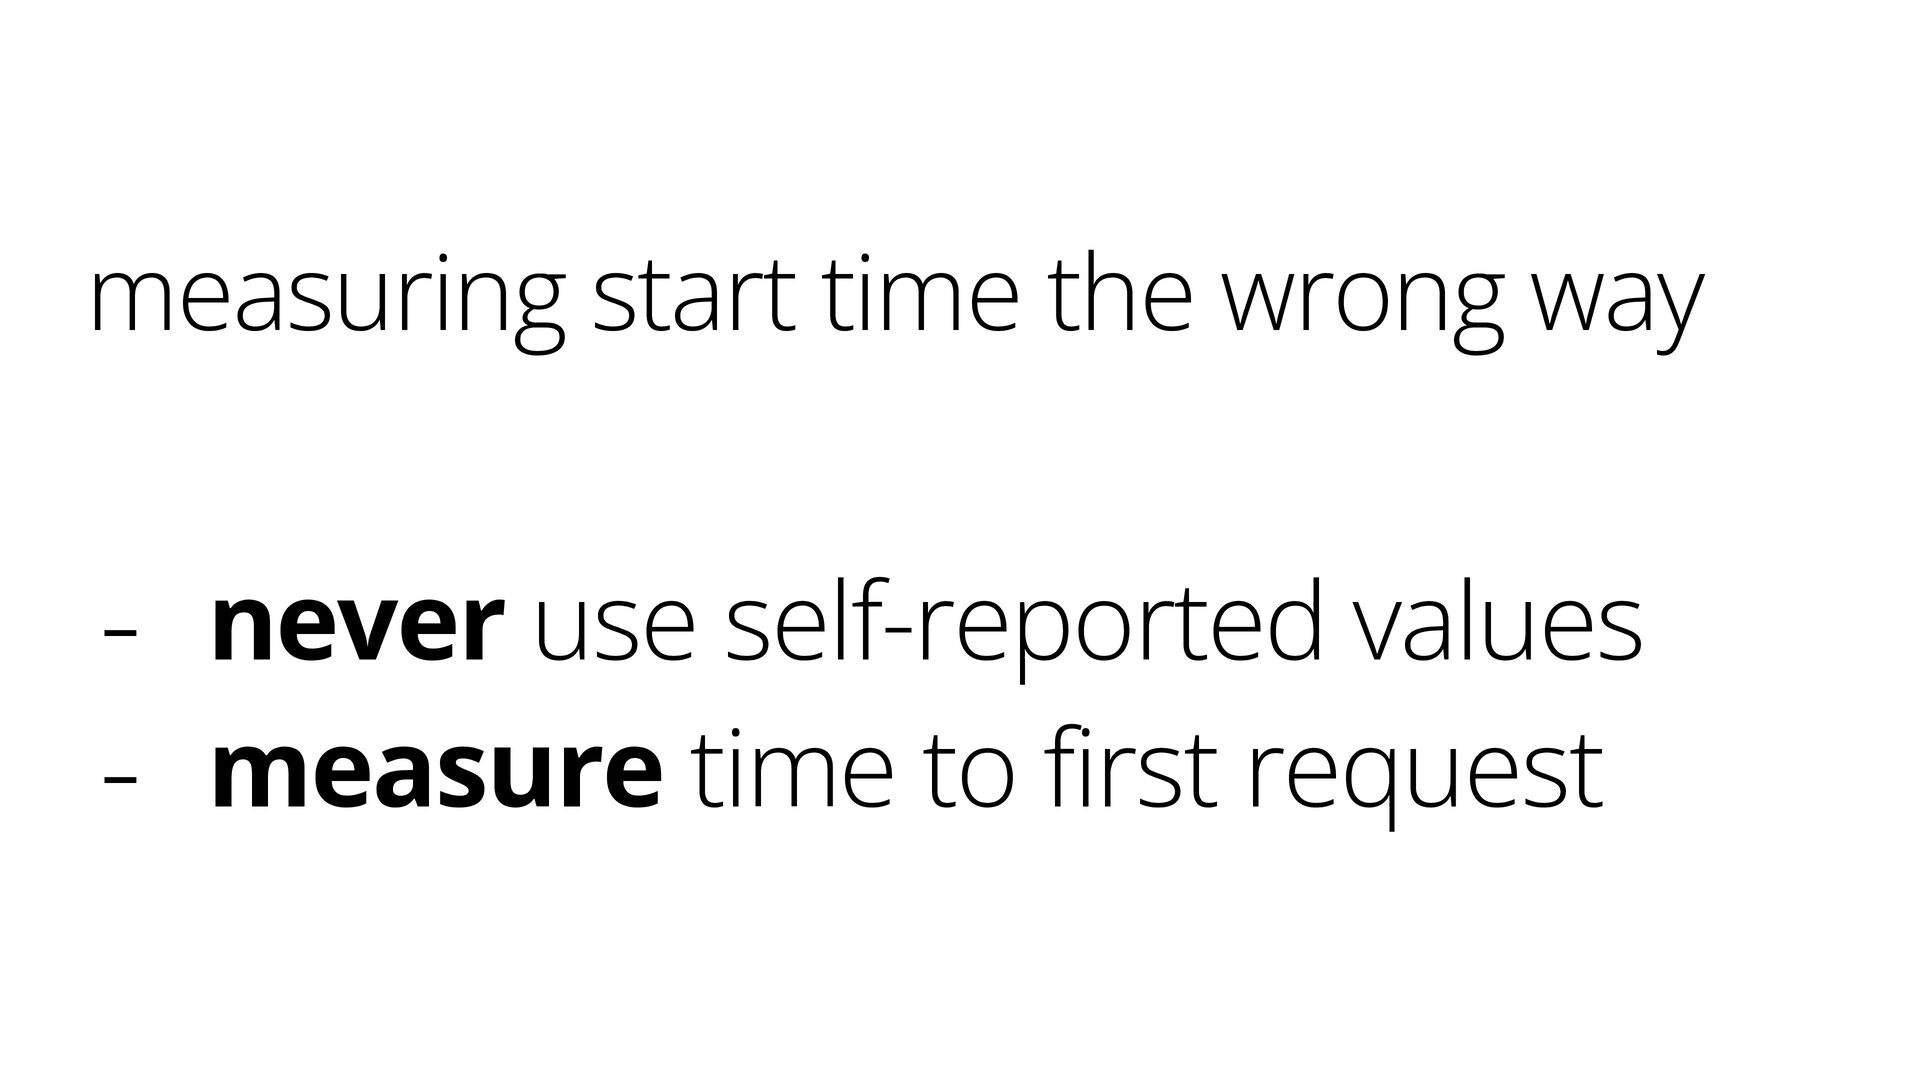
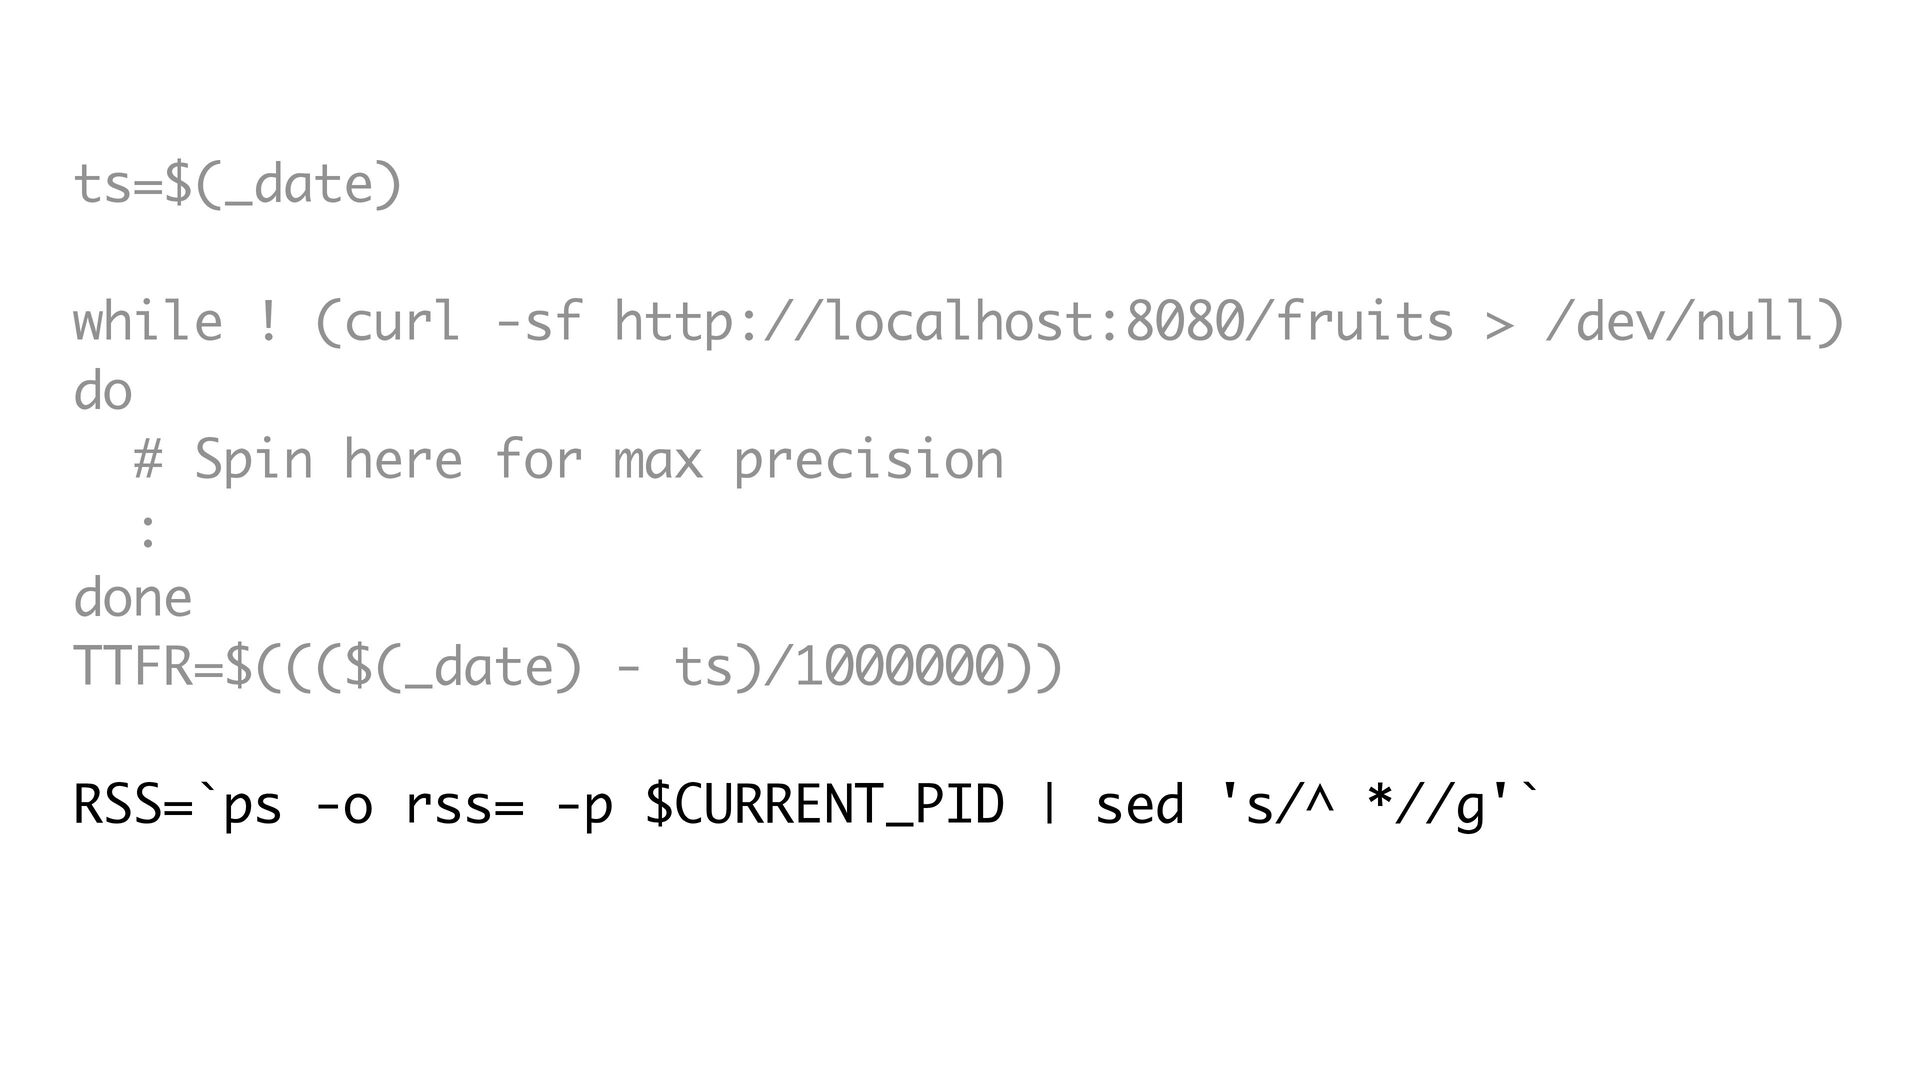
measuring start time the wrong way - never use self-reported
values - measure time to first request -
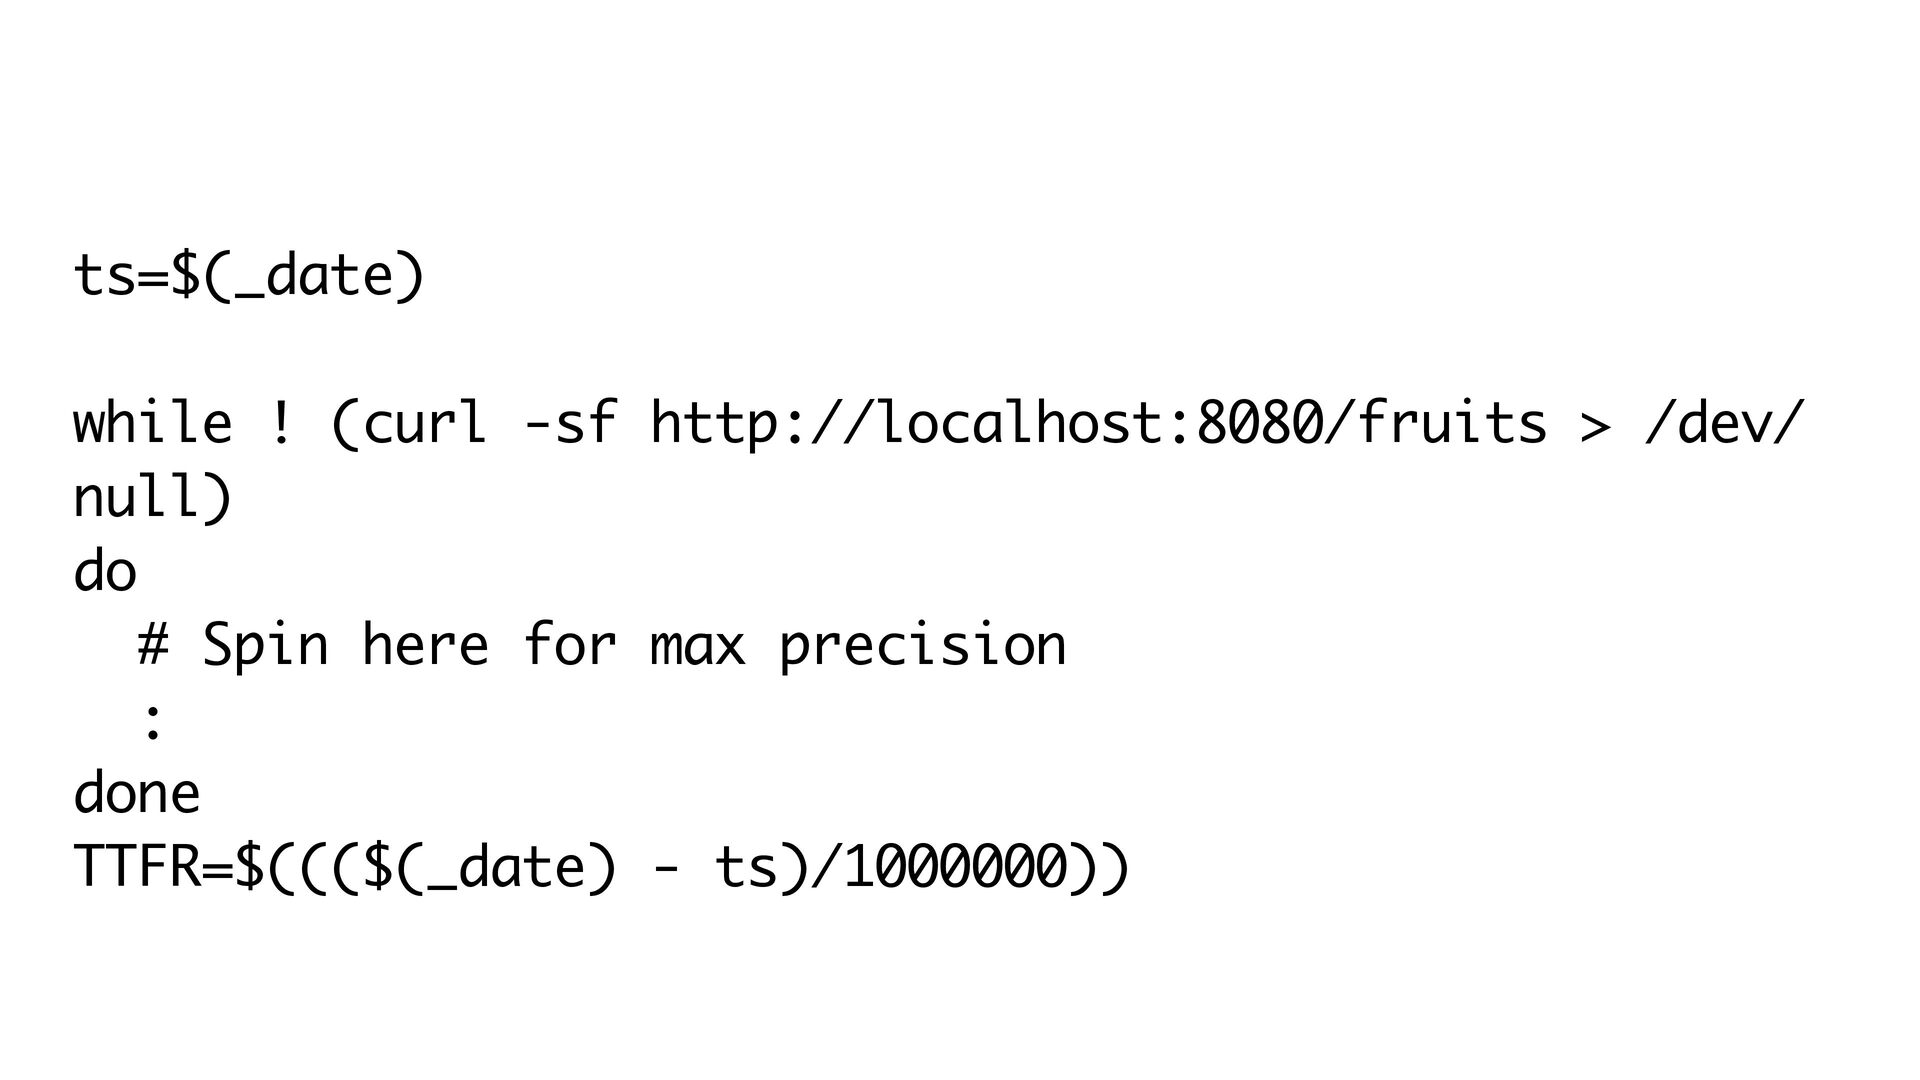
ts=$(_date) while ! (curl -sf http://localhost:8080/fruits > /dev/ null) do
# Spin here for max precision : done TTFR=$((($(_date) - ts)/1000000)) -
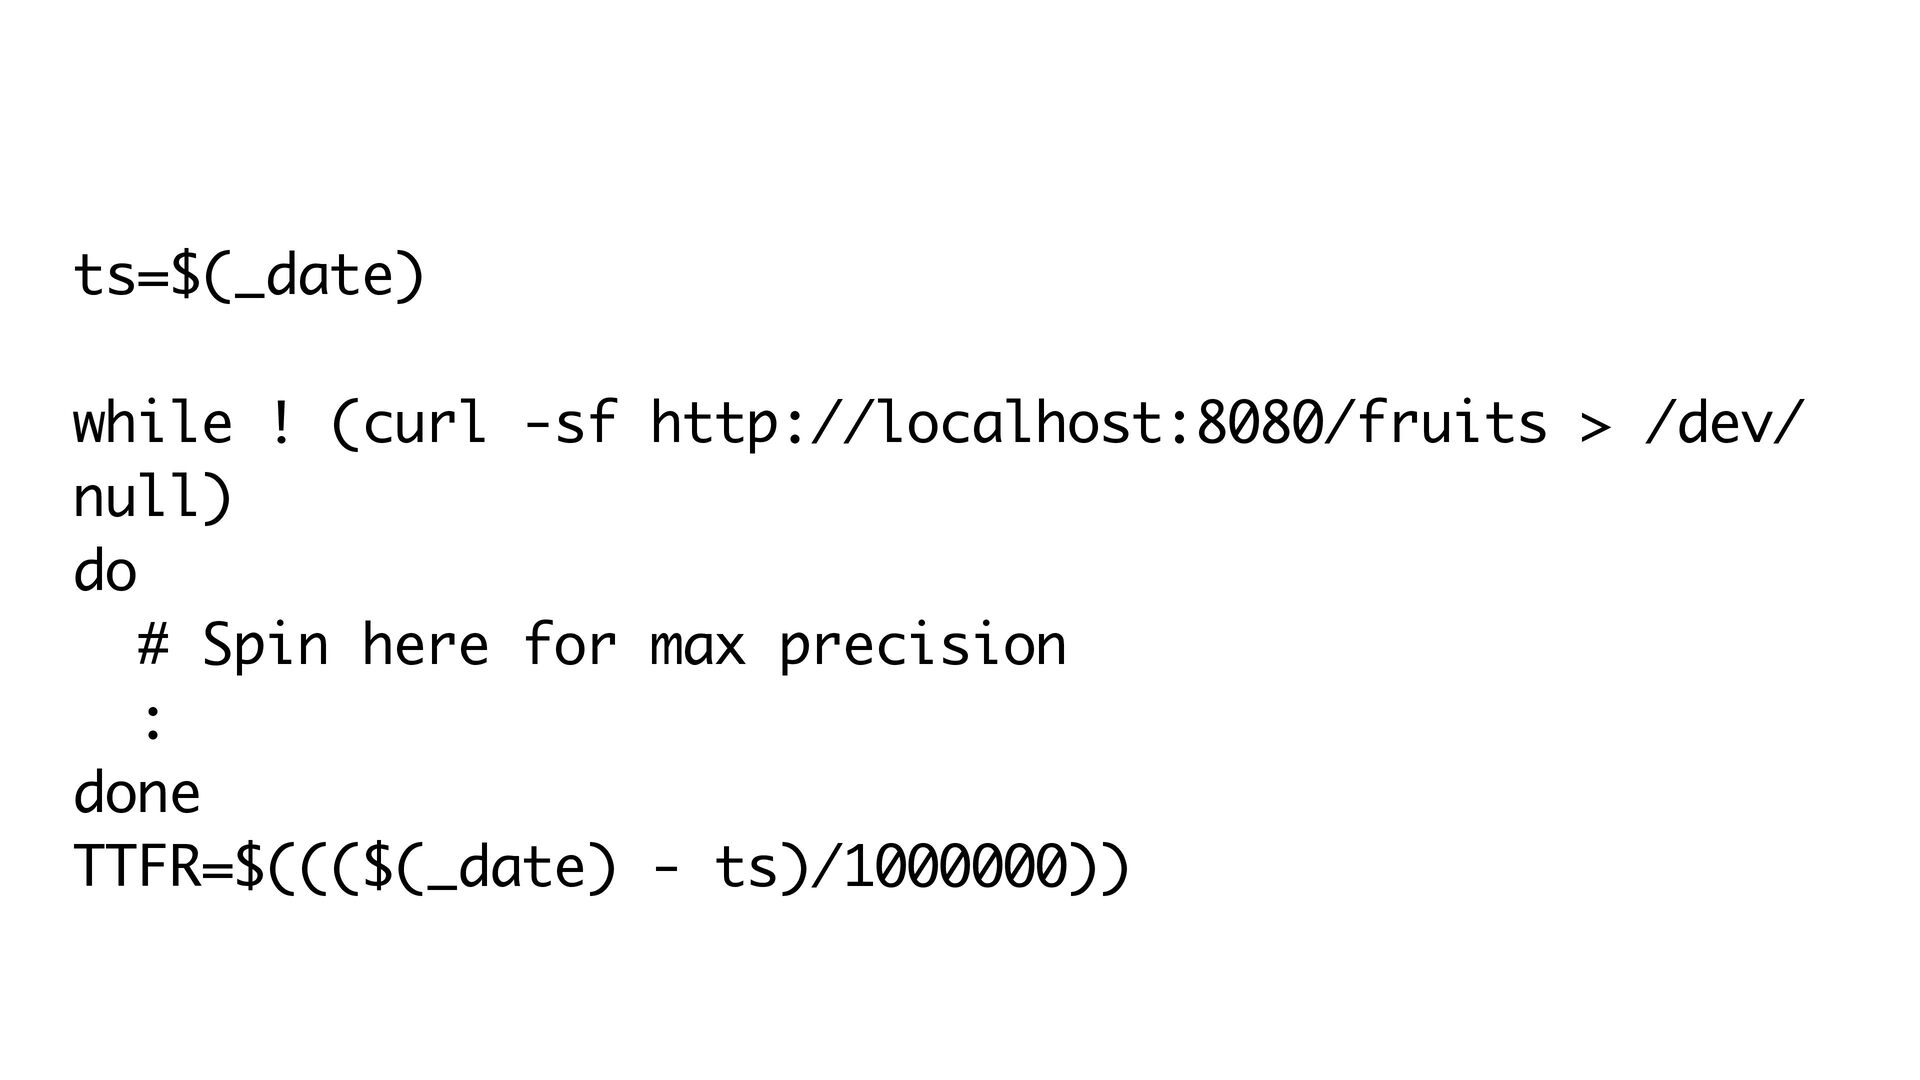
ts=$(_date) while ! (curl -sf http://localhost:8080/fruits > /dev/ null) do
# Spin here for max precision : done TTFR=$((($(_date) - ts)/1000000)) -
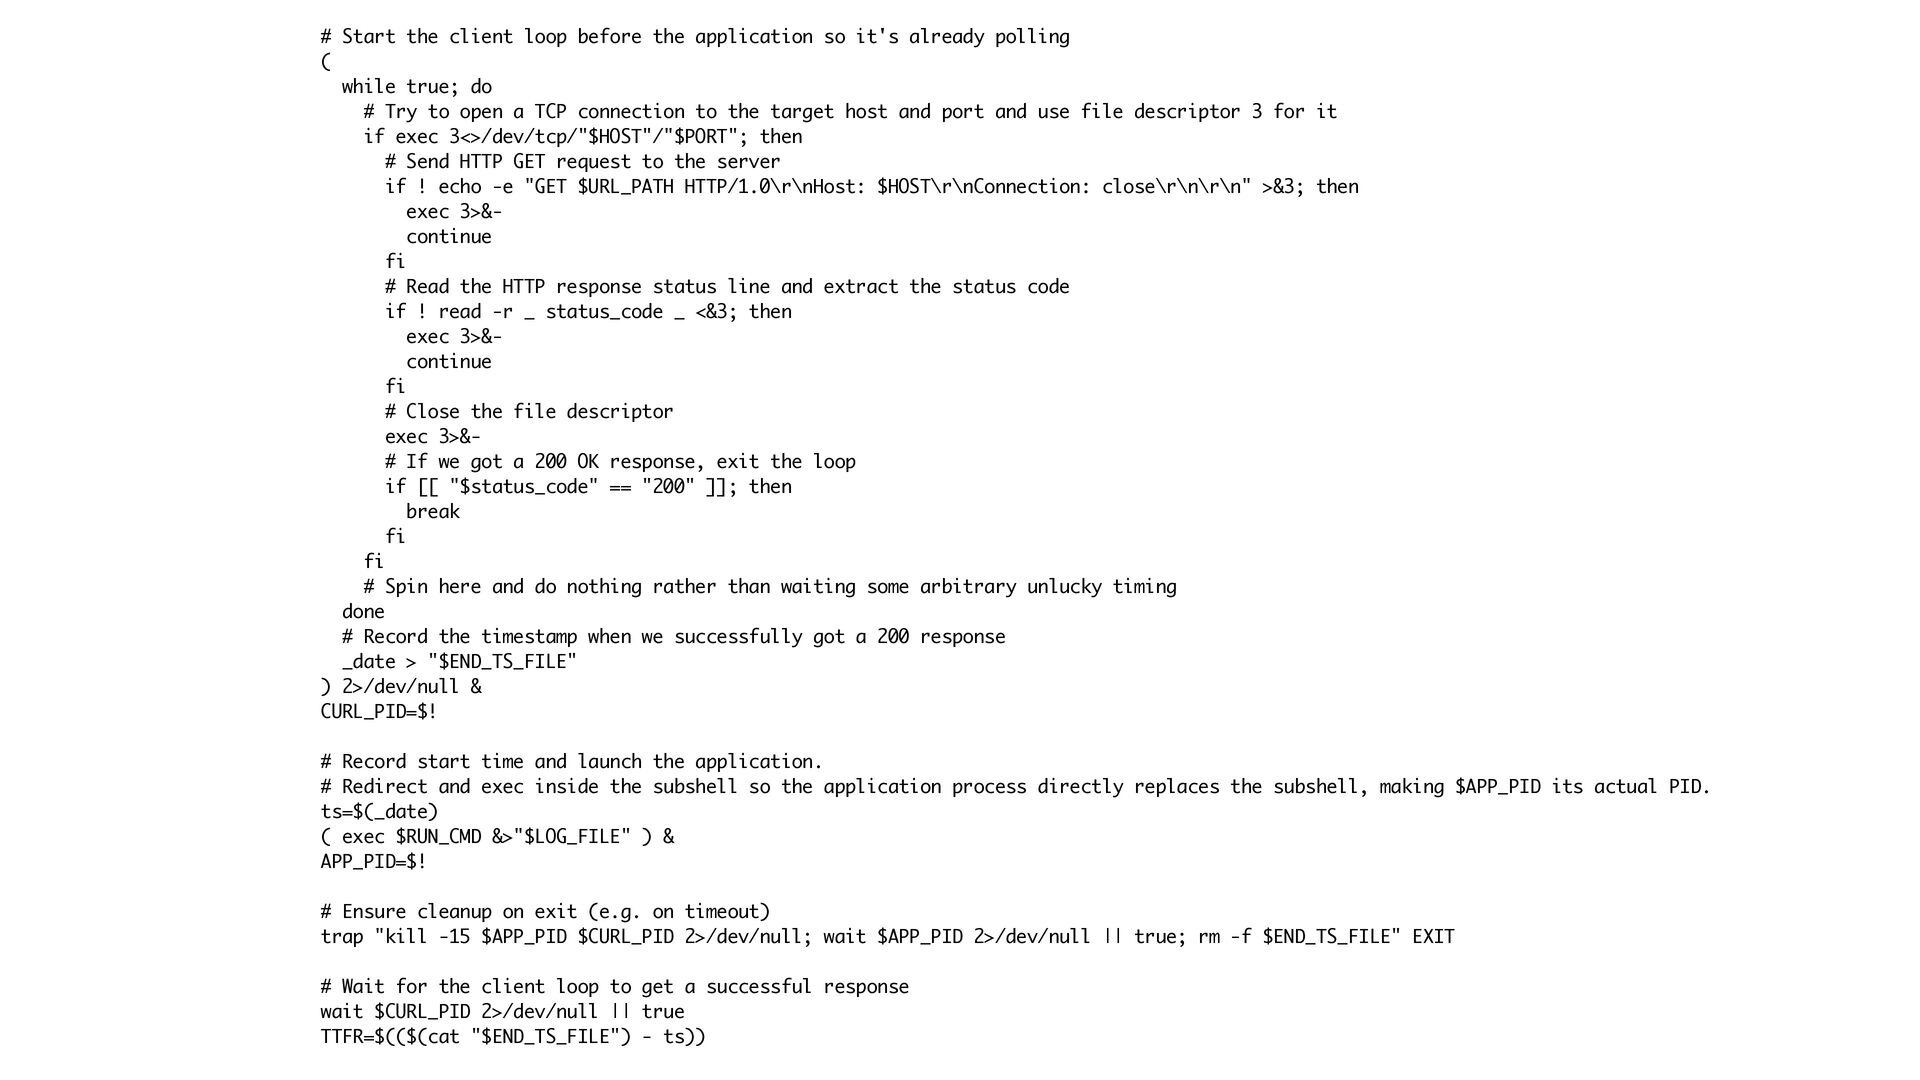
# Start the client loop before the application so it's
already polling ( while true; do # Try to open a TCP connection to the target host and port and use file descriptor 3 for it if exec 3<>/dev/tcp/"$HOST"/"$PORT"; then # Send HTTP GET request to the server if ! echo -e "GET $URL_PATH HTTP/1.0\r\nHost: $HOST\r\nConnection: close\r\n\r\n" >&3; then exec 3>&continue fi # Read the HTTP response status line and extract the status code if ! read -r _ status_code _ <&3; then exec 3>&continue fi # Close the file descriptor exec 3>&# If we got a 200 OK response, exit the loop if [[ "$status_code" == "200" ]]; then break fi fi # Spin here and do nothing rather than waiting some arbitrary unlucky timing done # Record the timestamp when we successfully got a 200 response _date > "$END_TS_FILE" ) 2>/dev/null & CURL_PID=$! # Record start time and launch the application. # Redirect and exec inside the subshell so the application process directly replaces the subshell, making $APP_PID its actual PID. ts=$(_date) ( exec $RUN_CMD &>"$LOG_FILE" ) & APP_PID=$! # Ensure cleanup on exit (e.g. on timeout) trap "kill -15 $APP_PID $CURL_PID 2>/dev/null; wait $APP_PID 2>/dev/null || true; rm -f $END_TS_FILE" EXIT # Wait for the client loop to get a successful response wait $CURL_PID 2>/dev/null || true TTFR=$(($(cat "$END_TS_FILE") - ts)) -
ts=$(_date) while ! (curl -sf http://localhost:8080/fruits > /dev/null) do #
Spin here for max precision : done TTFR=$((($(_date) - ts)/1000000)) RSS=`ps -o rss= -p $CURRENT_PID | sed 's/^ *//g'` -
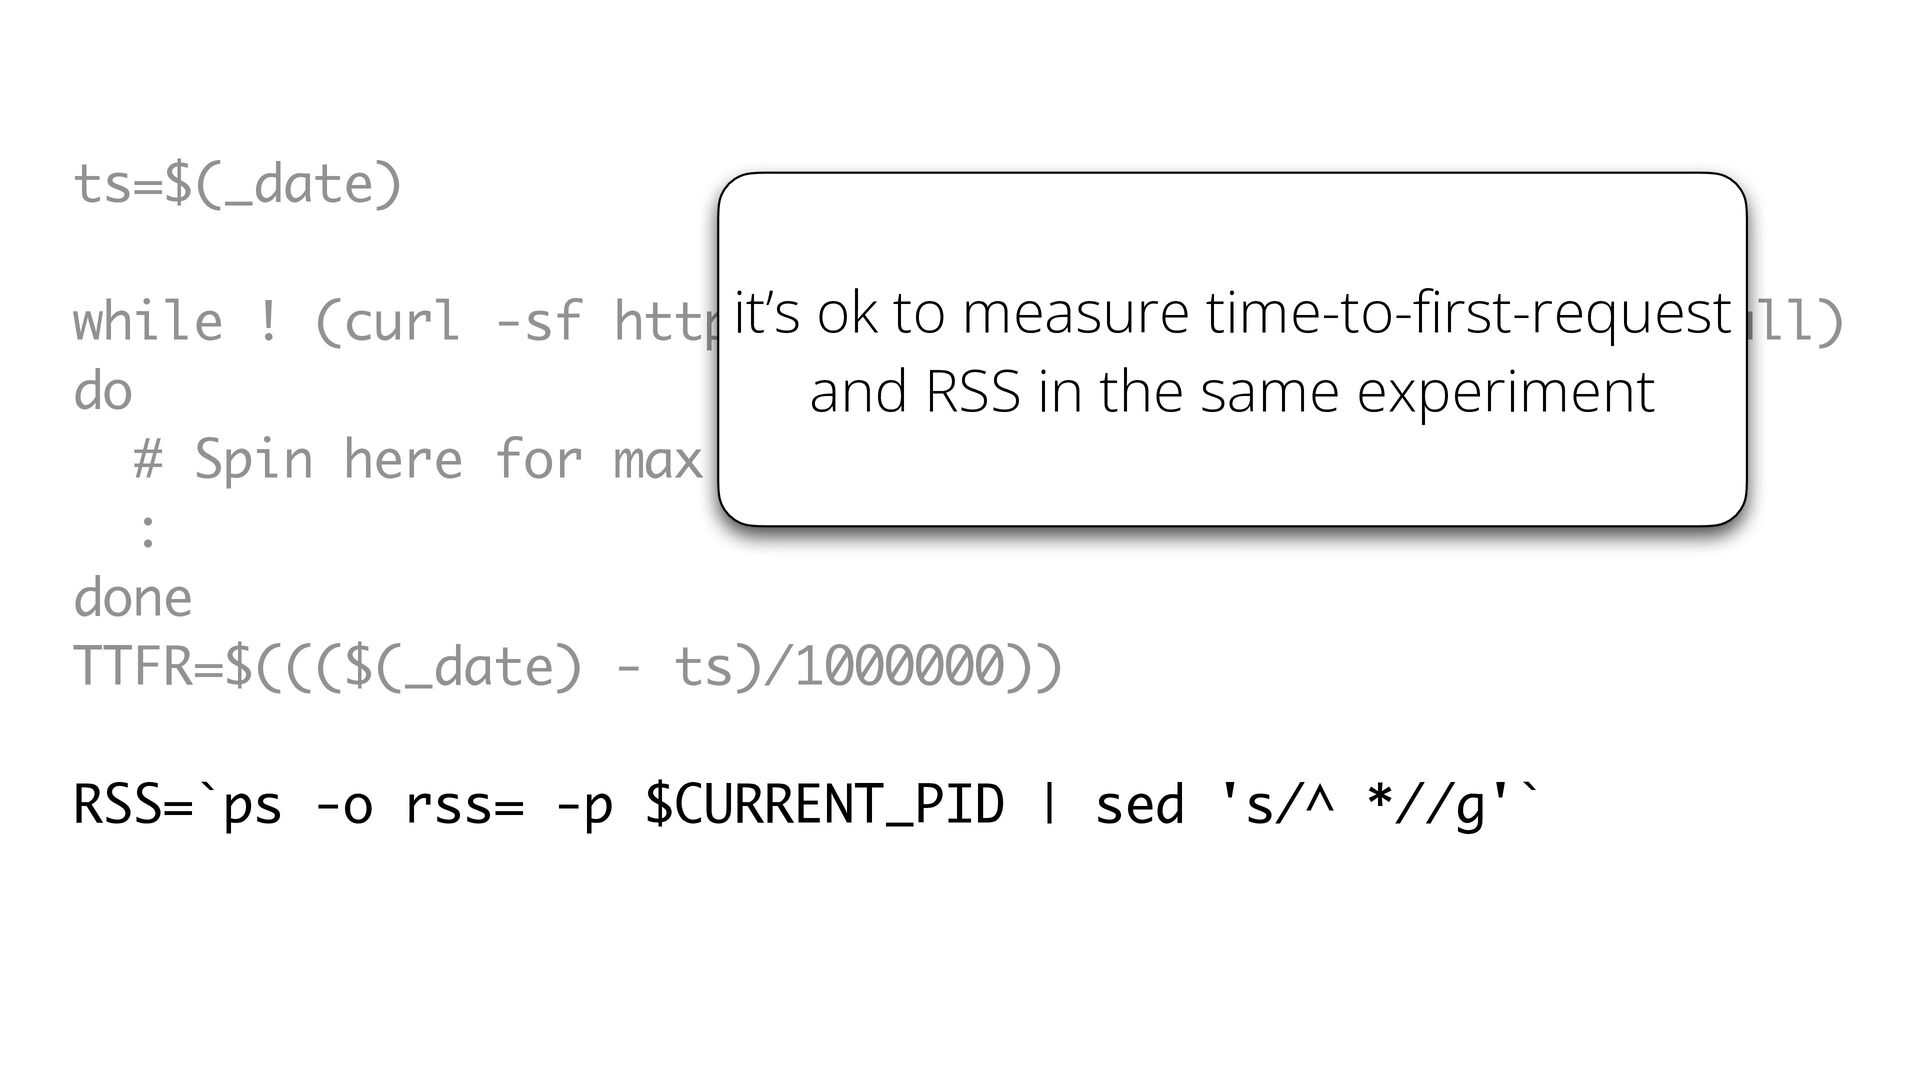
ts=$(_date) it’s ok to measure time-to- rst-request while ! (curl
-sf http://localhost:8080/fruits > /dev/null) do and RSS in the same experiment # Spin here for max precision : done TTFR=$((($(_date) - ts)/1000000)) fi RSS=`ps -o rss= -p $CURRENT_PID | sed 's/^ *//g'` -
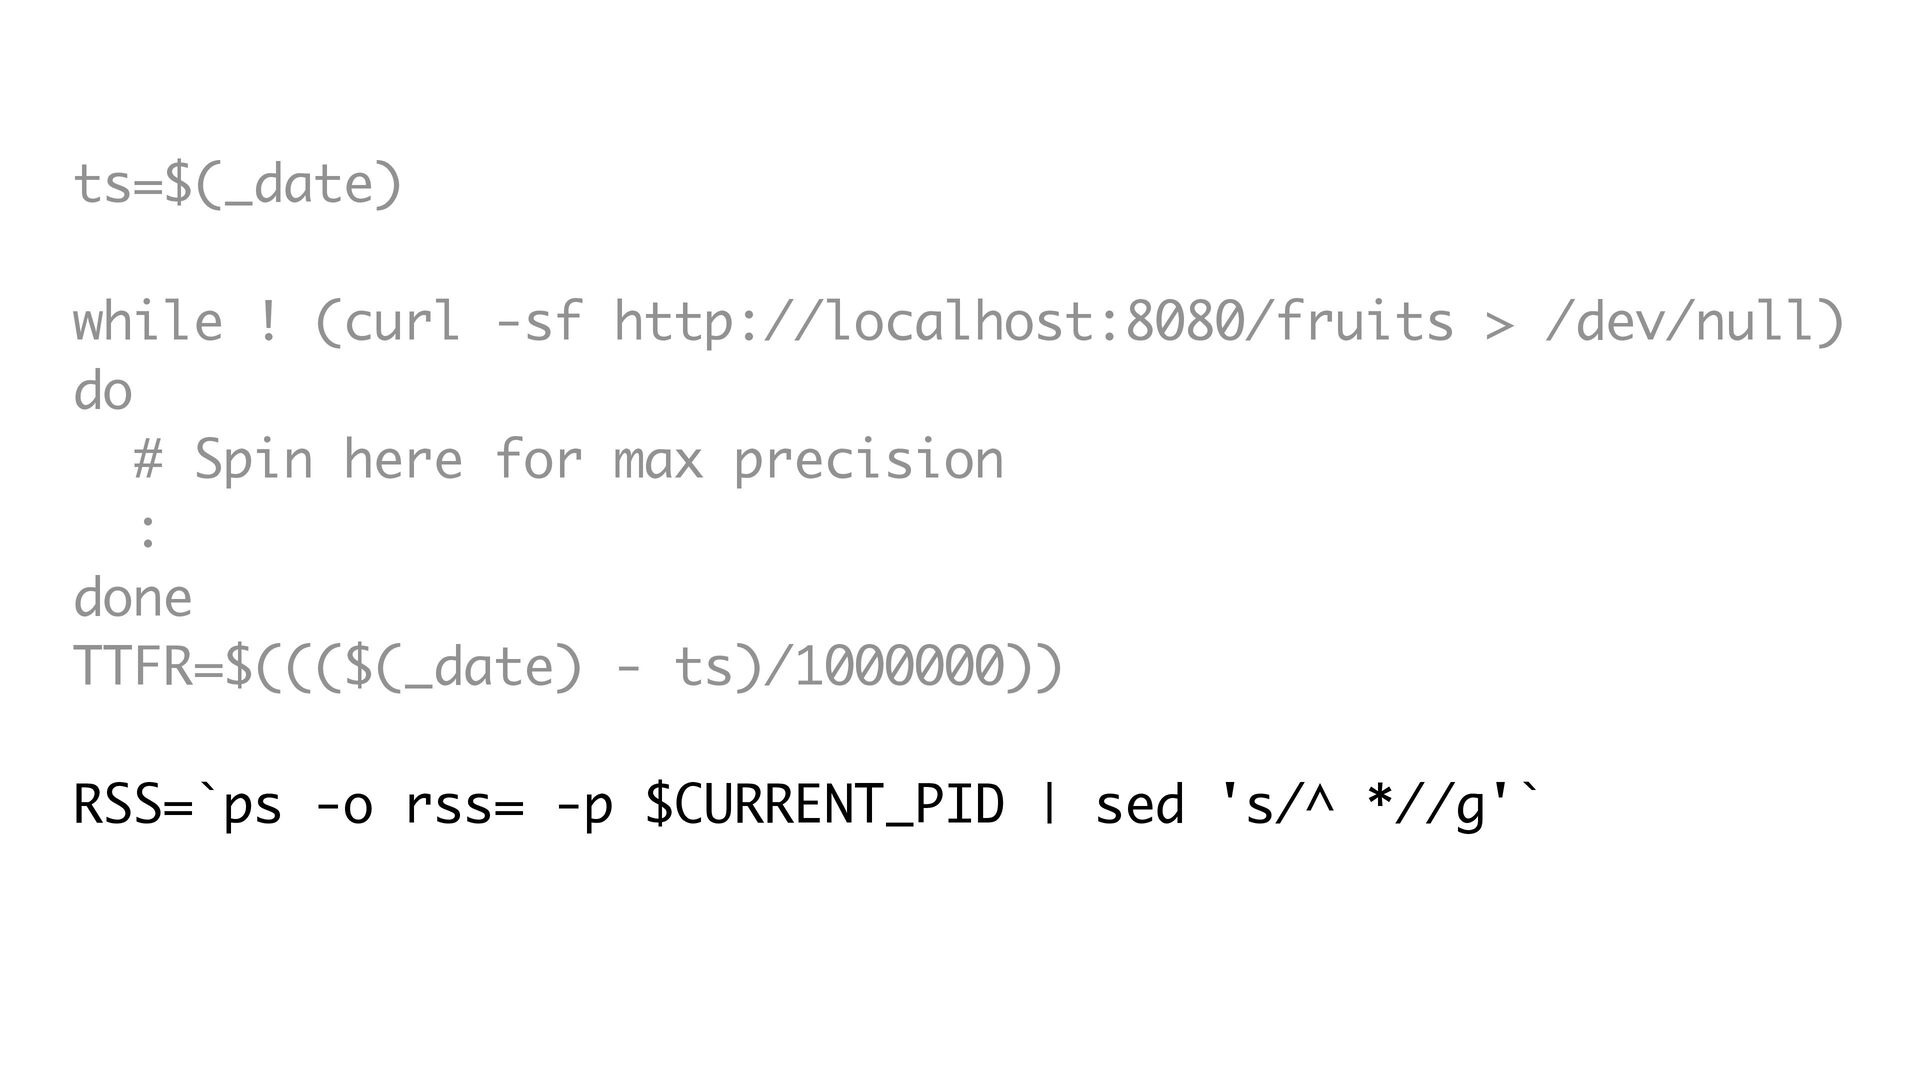
ts=$(_date) while ! (curl -sf http://localhost:8080/fruits > /dev/null) do #
Spin here for max precision : done TTFR=$((($(_date) - ts)/1000000)) RSS=`ps -o rss= -p $CURRENT_PID | sed 's/^ *//g'` -
do not try to measure RSS and max throughput in
the same experiment -
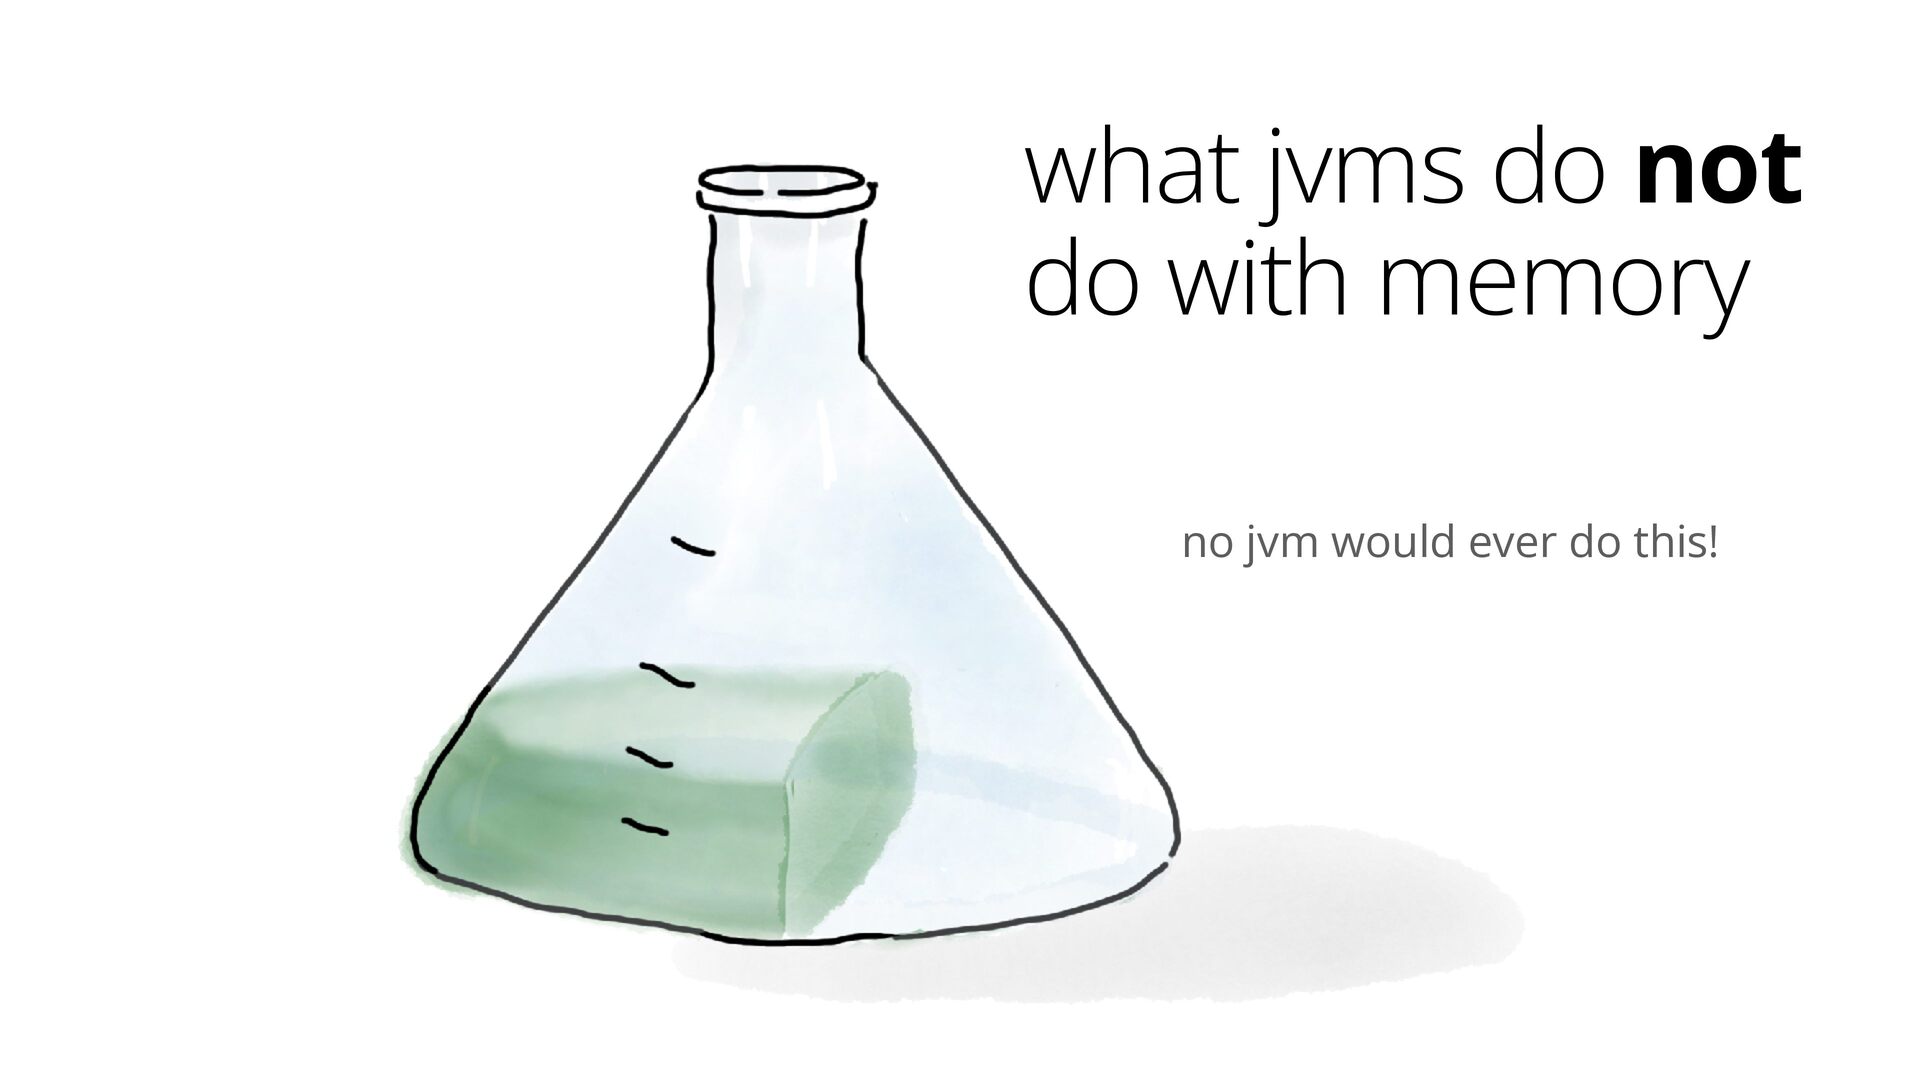
what jvms do not do with memory no jvm would
ever do this! -
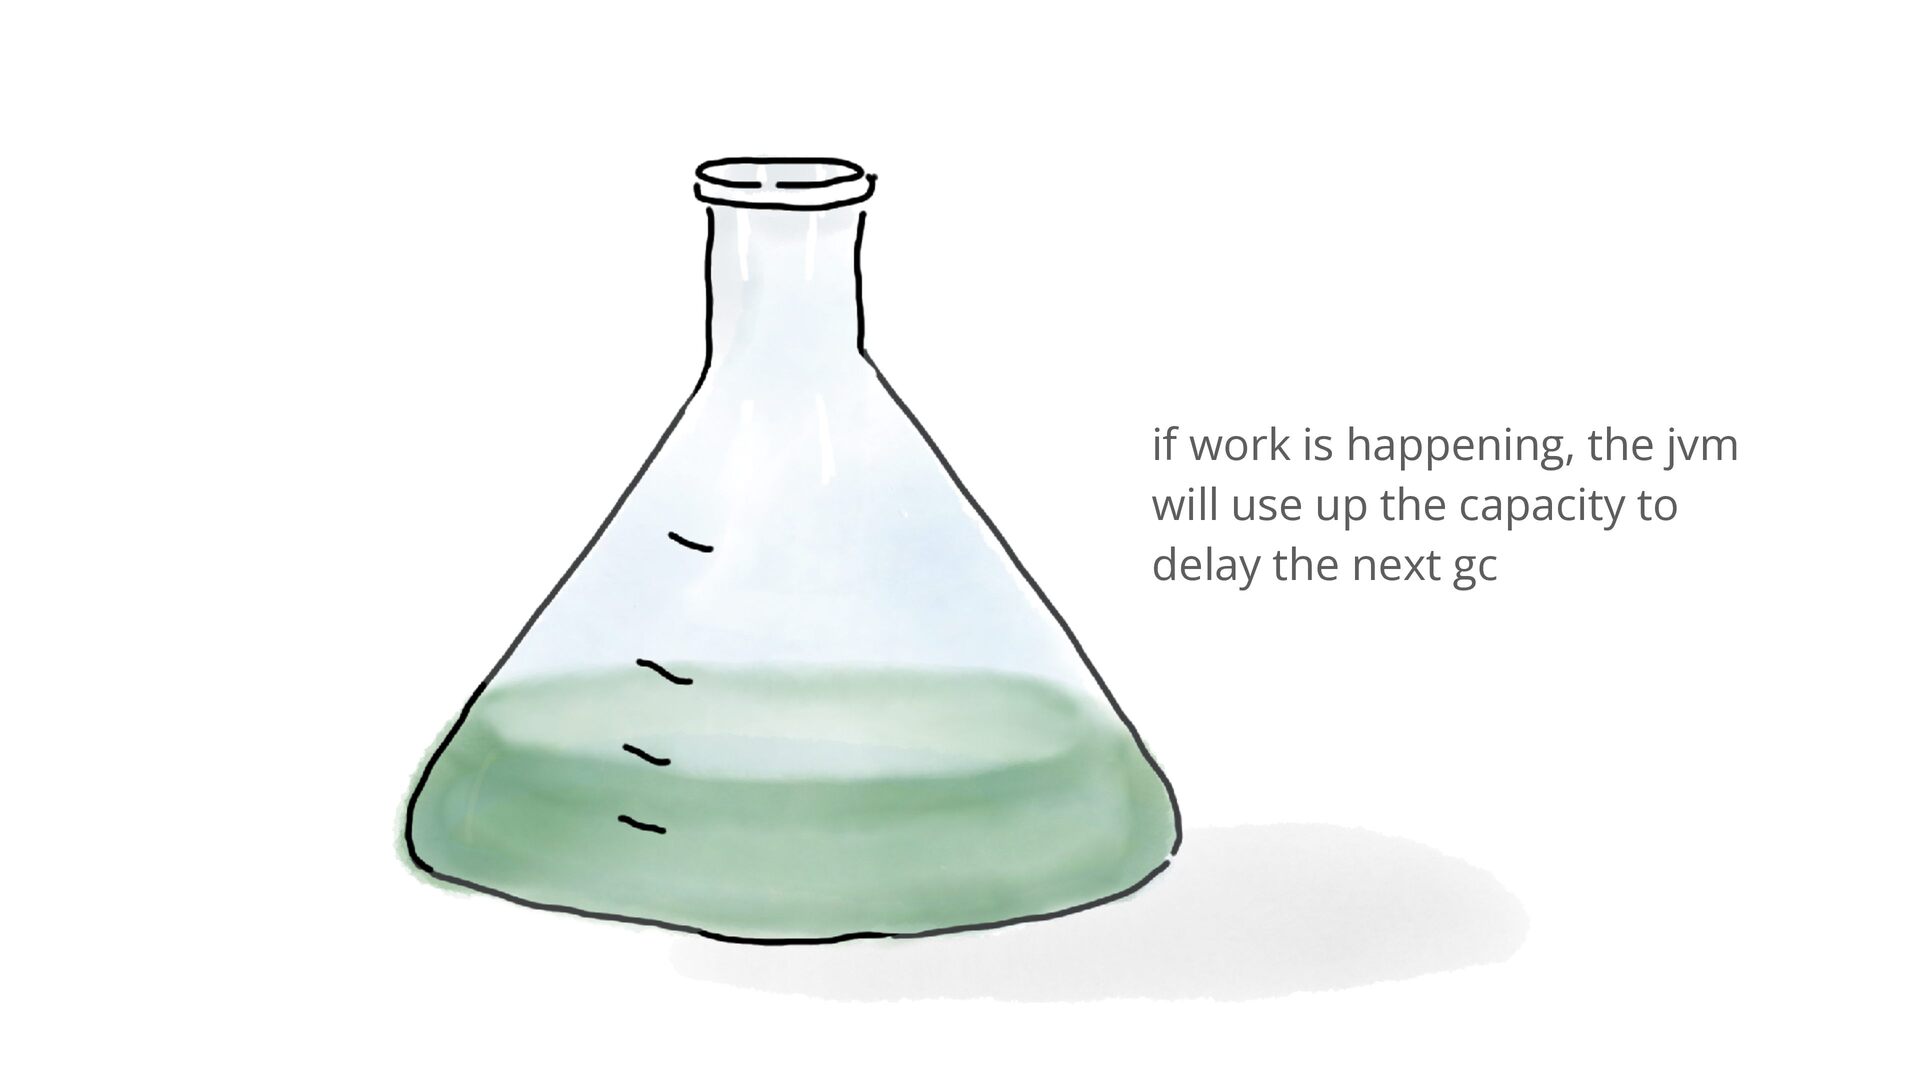
if work is happening, the jvm will use up the
capacity to delay the next gc -
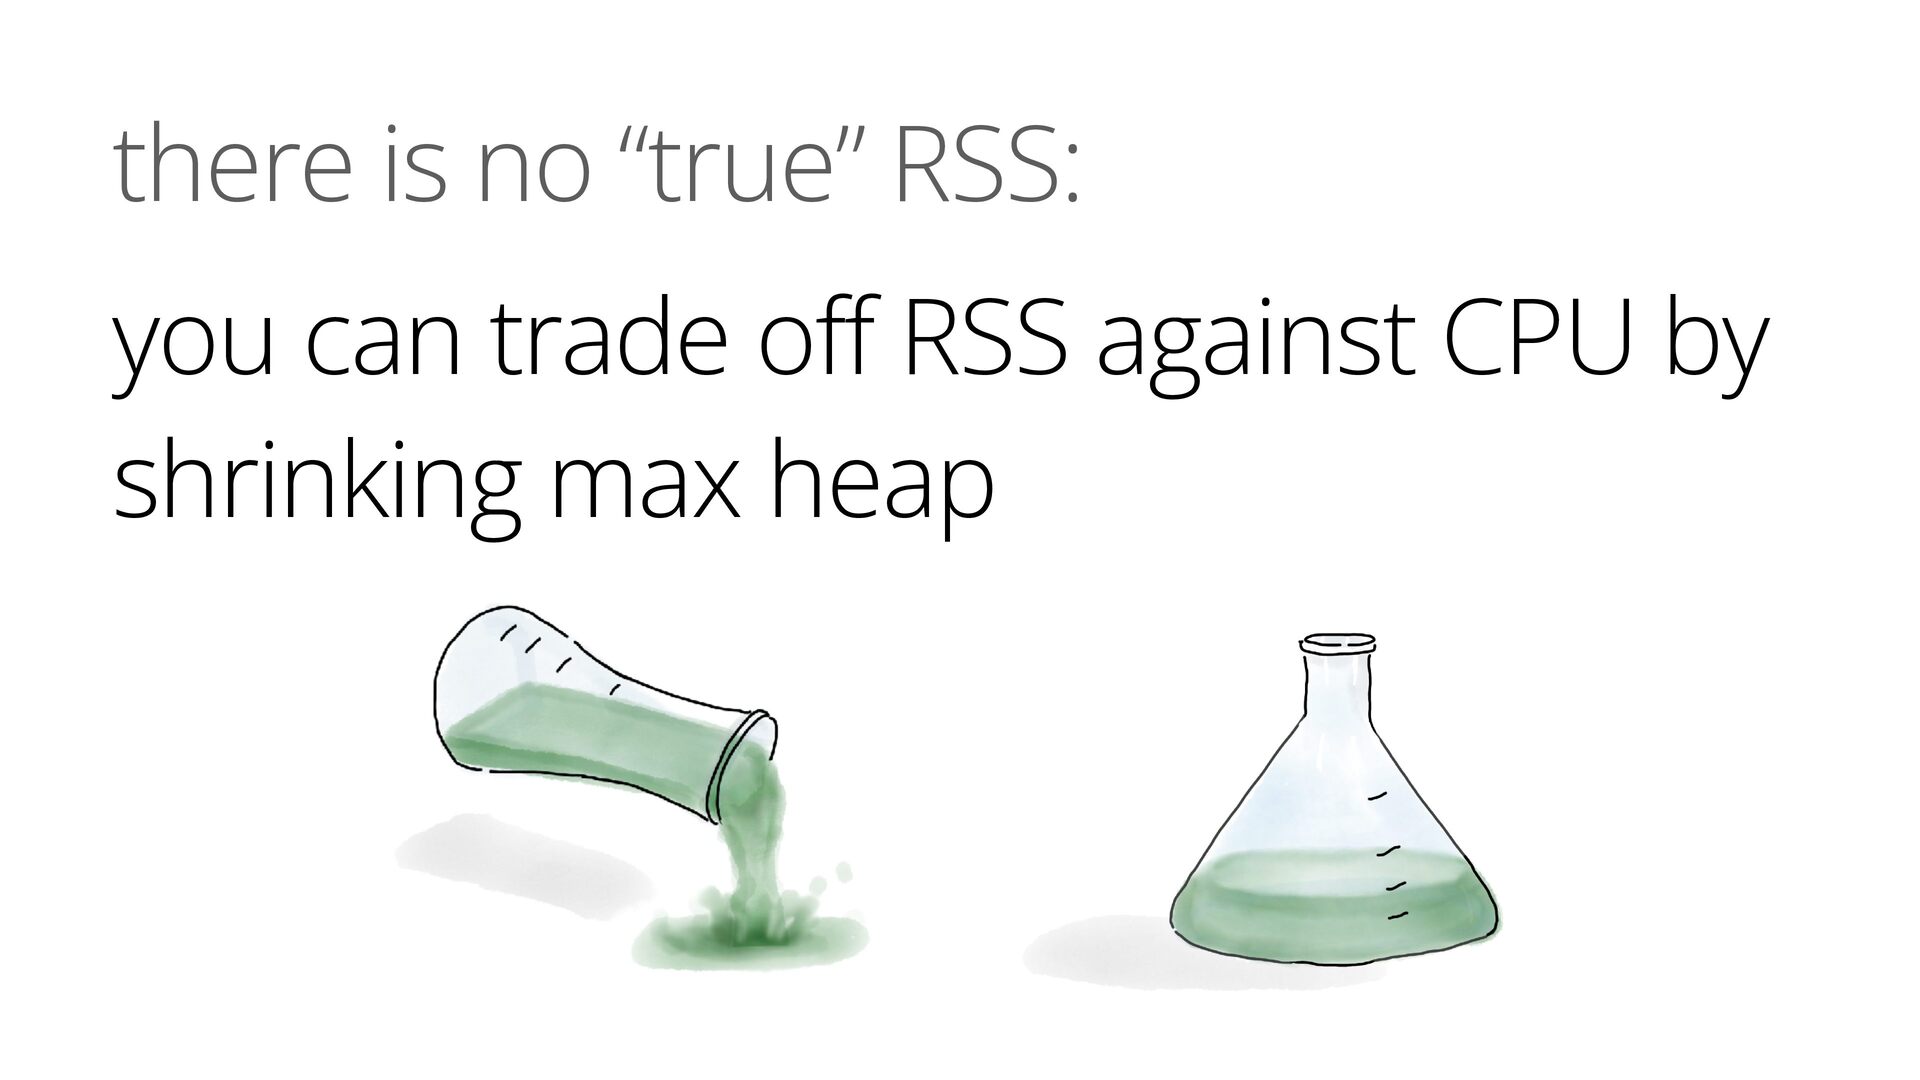
there is no “true” RSS: you can trade off RSS
against CPU by shrinking max heap -
you are not measuring what you think you are especially
if you’re measuring more than one thing -
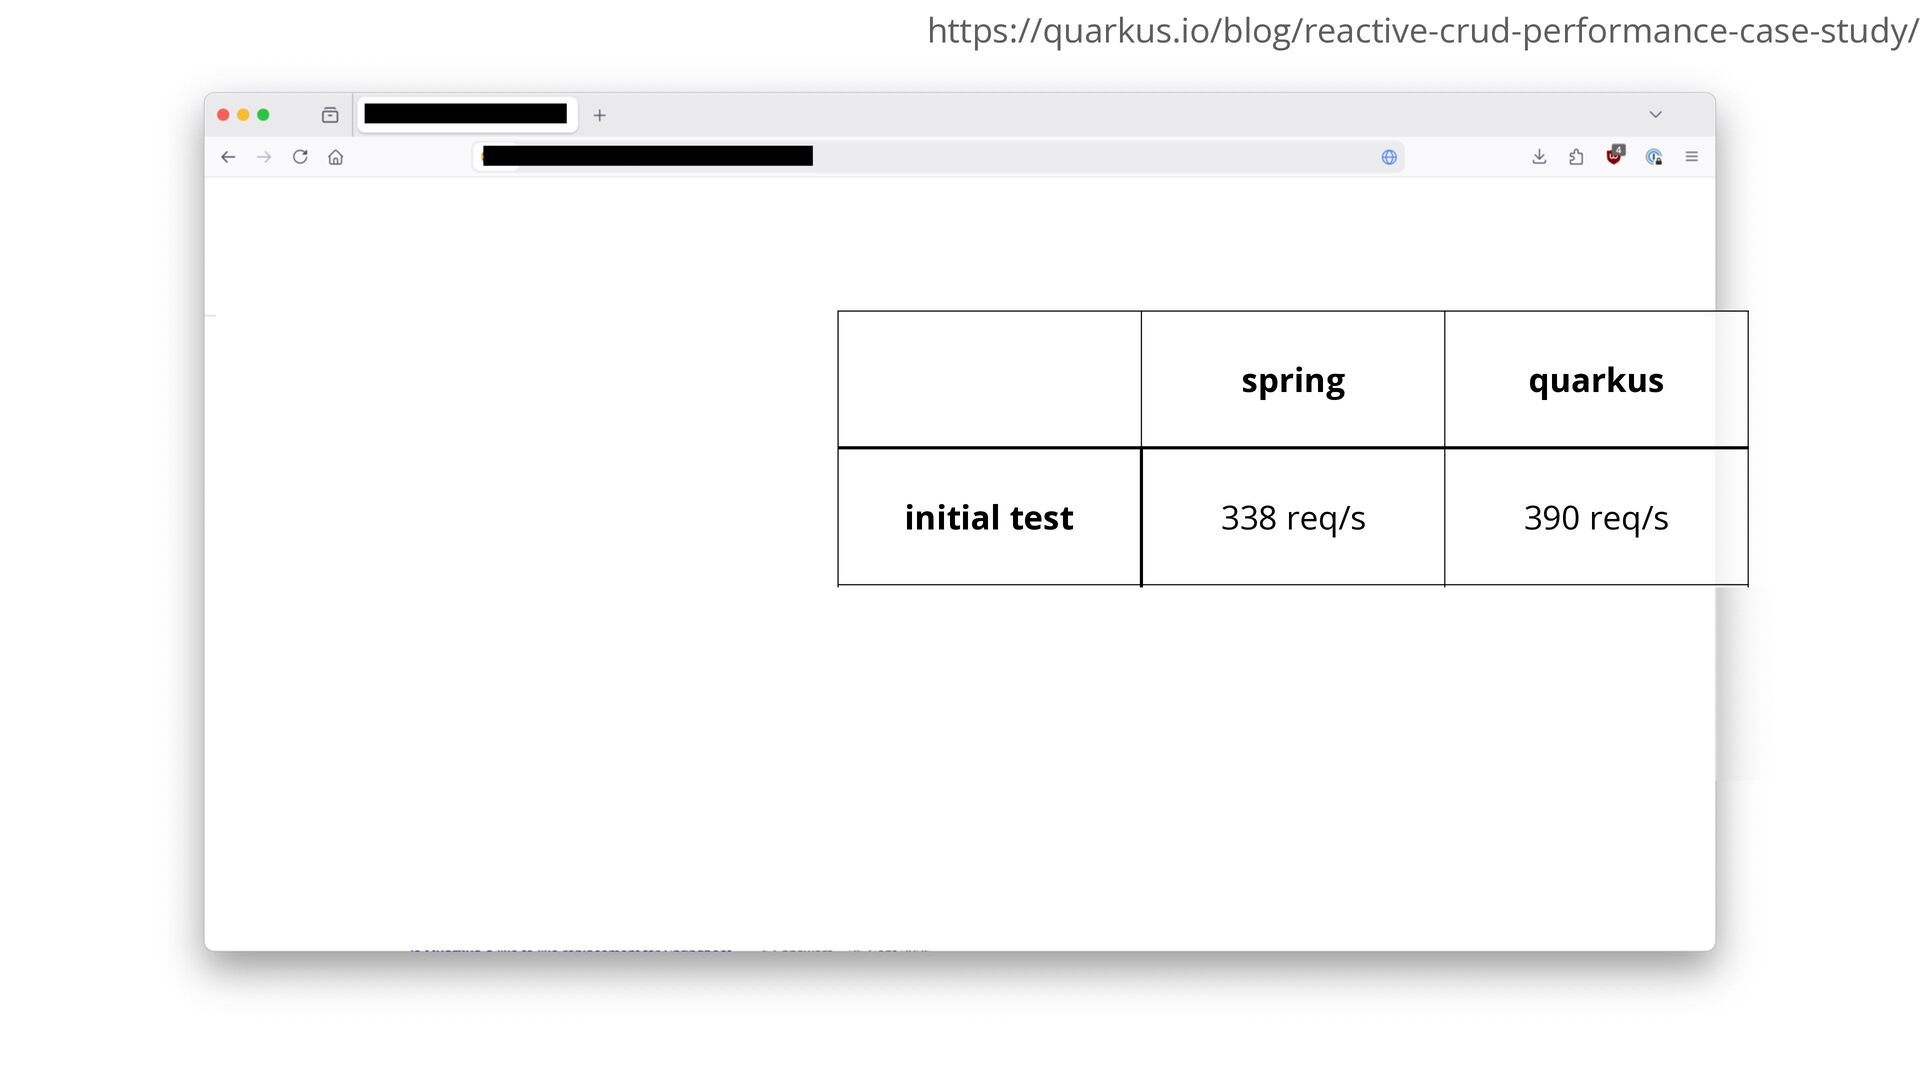
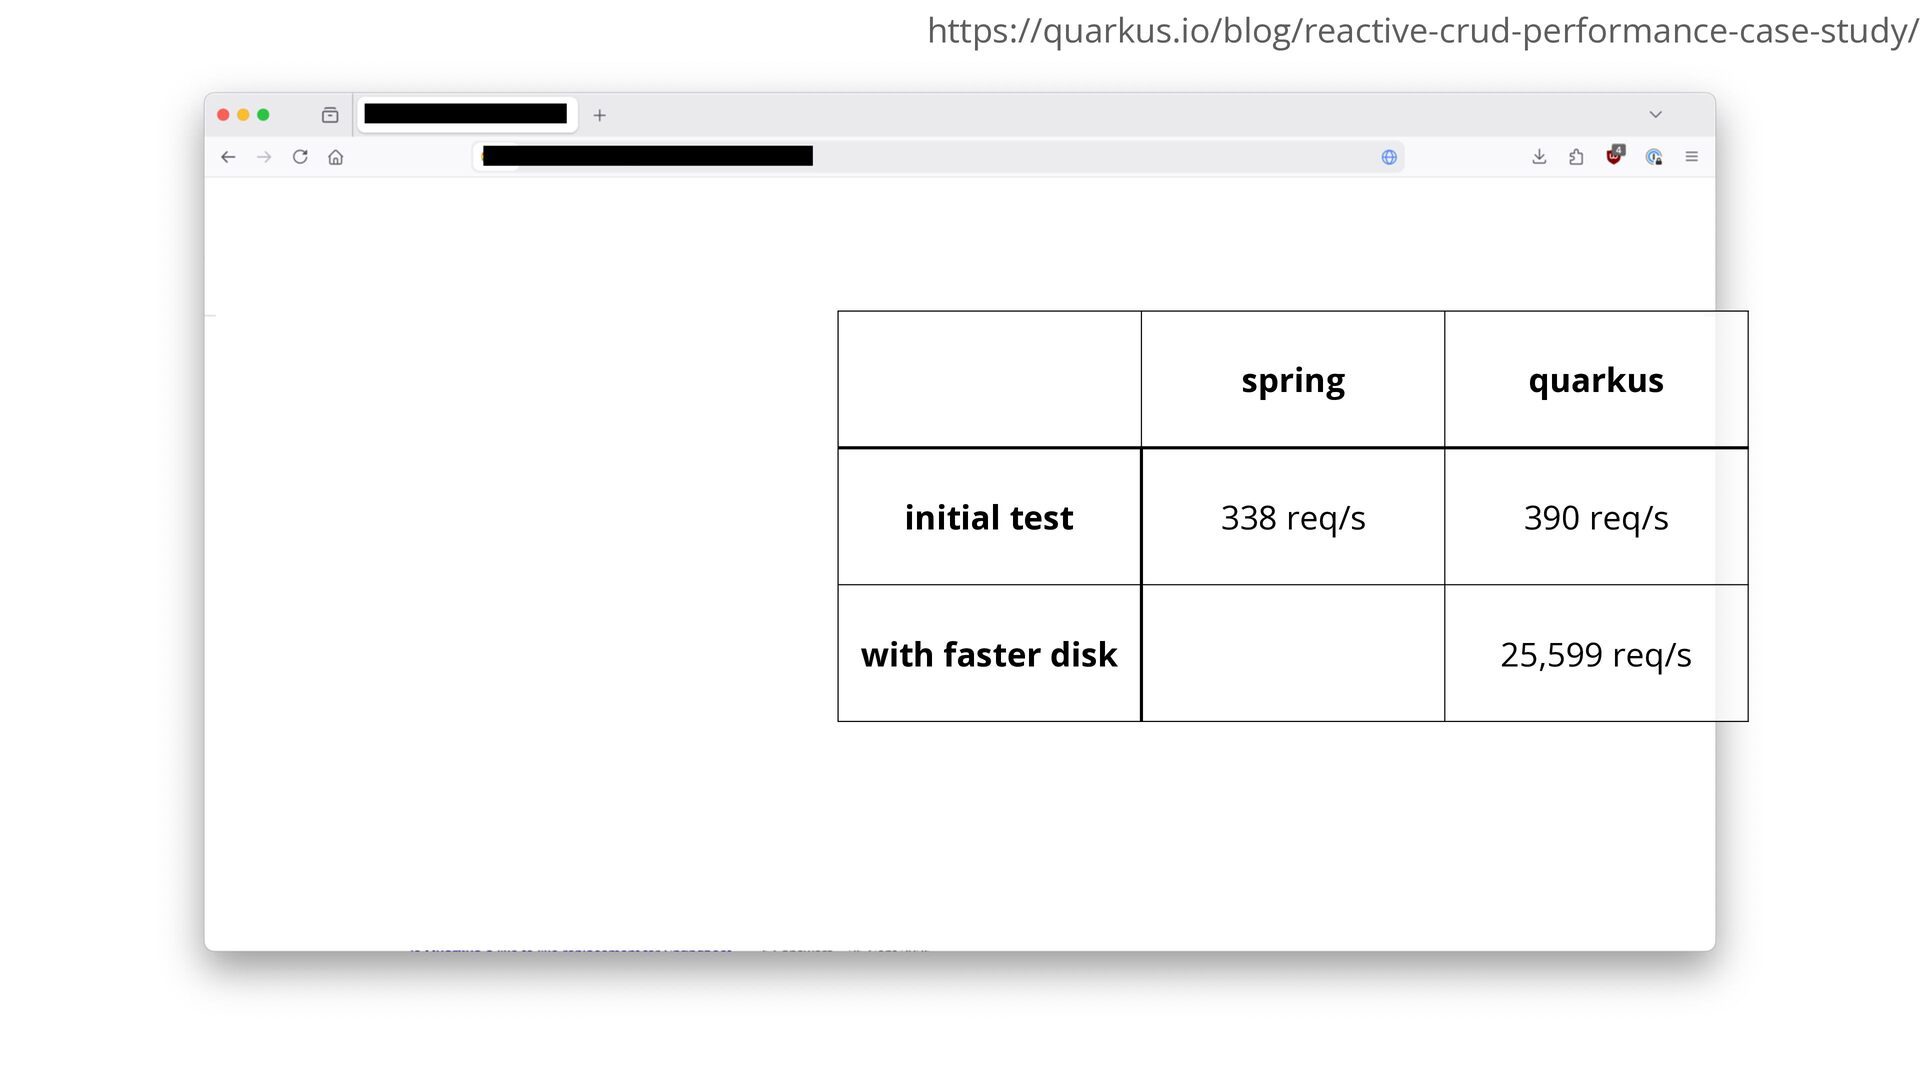
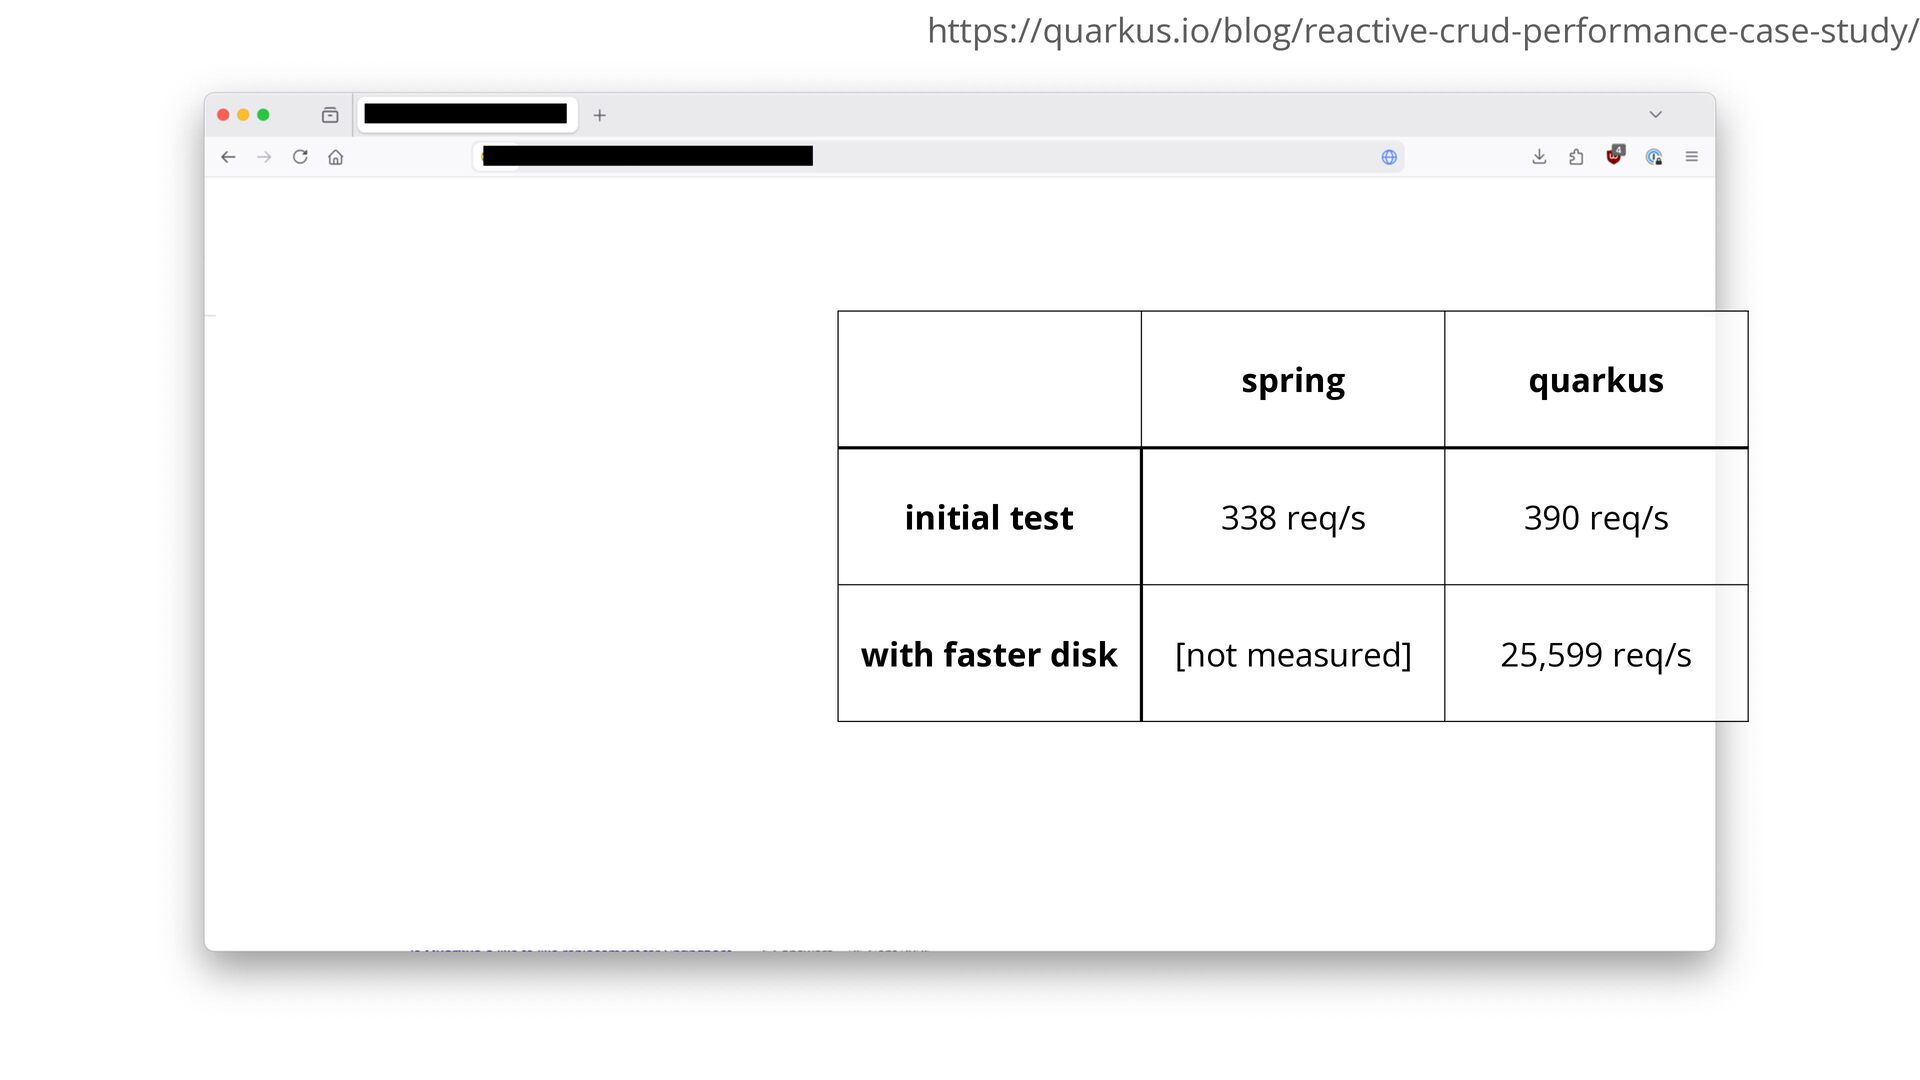
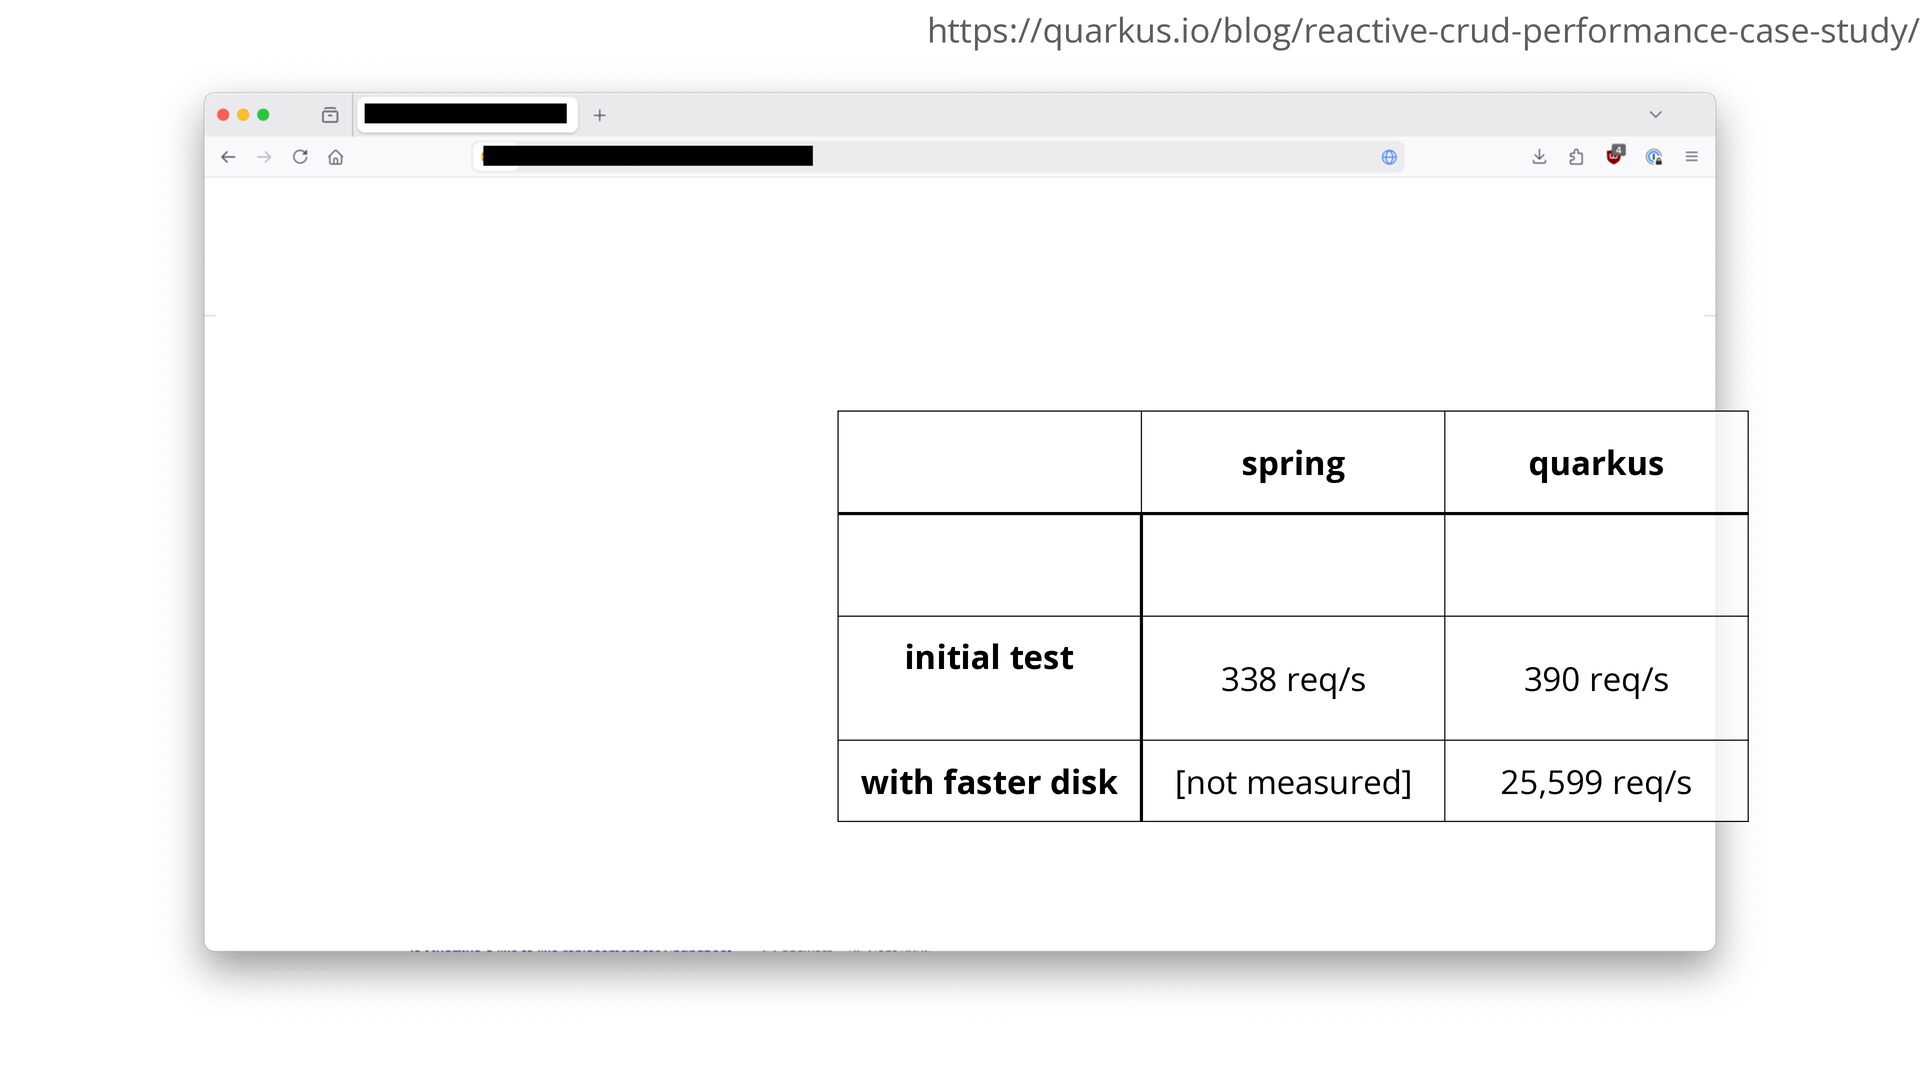
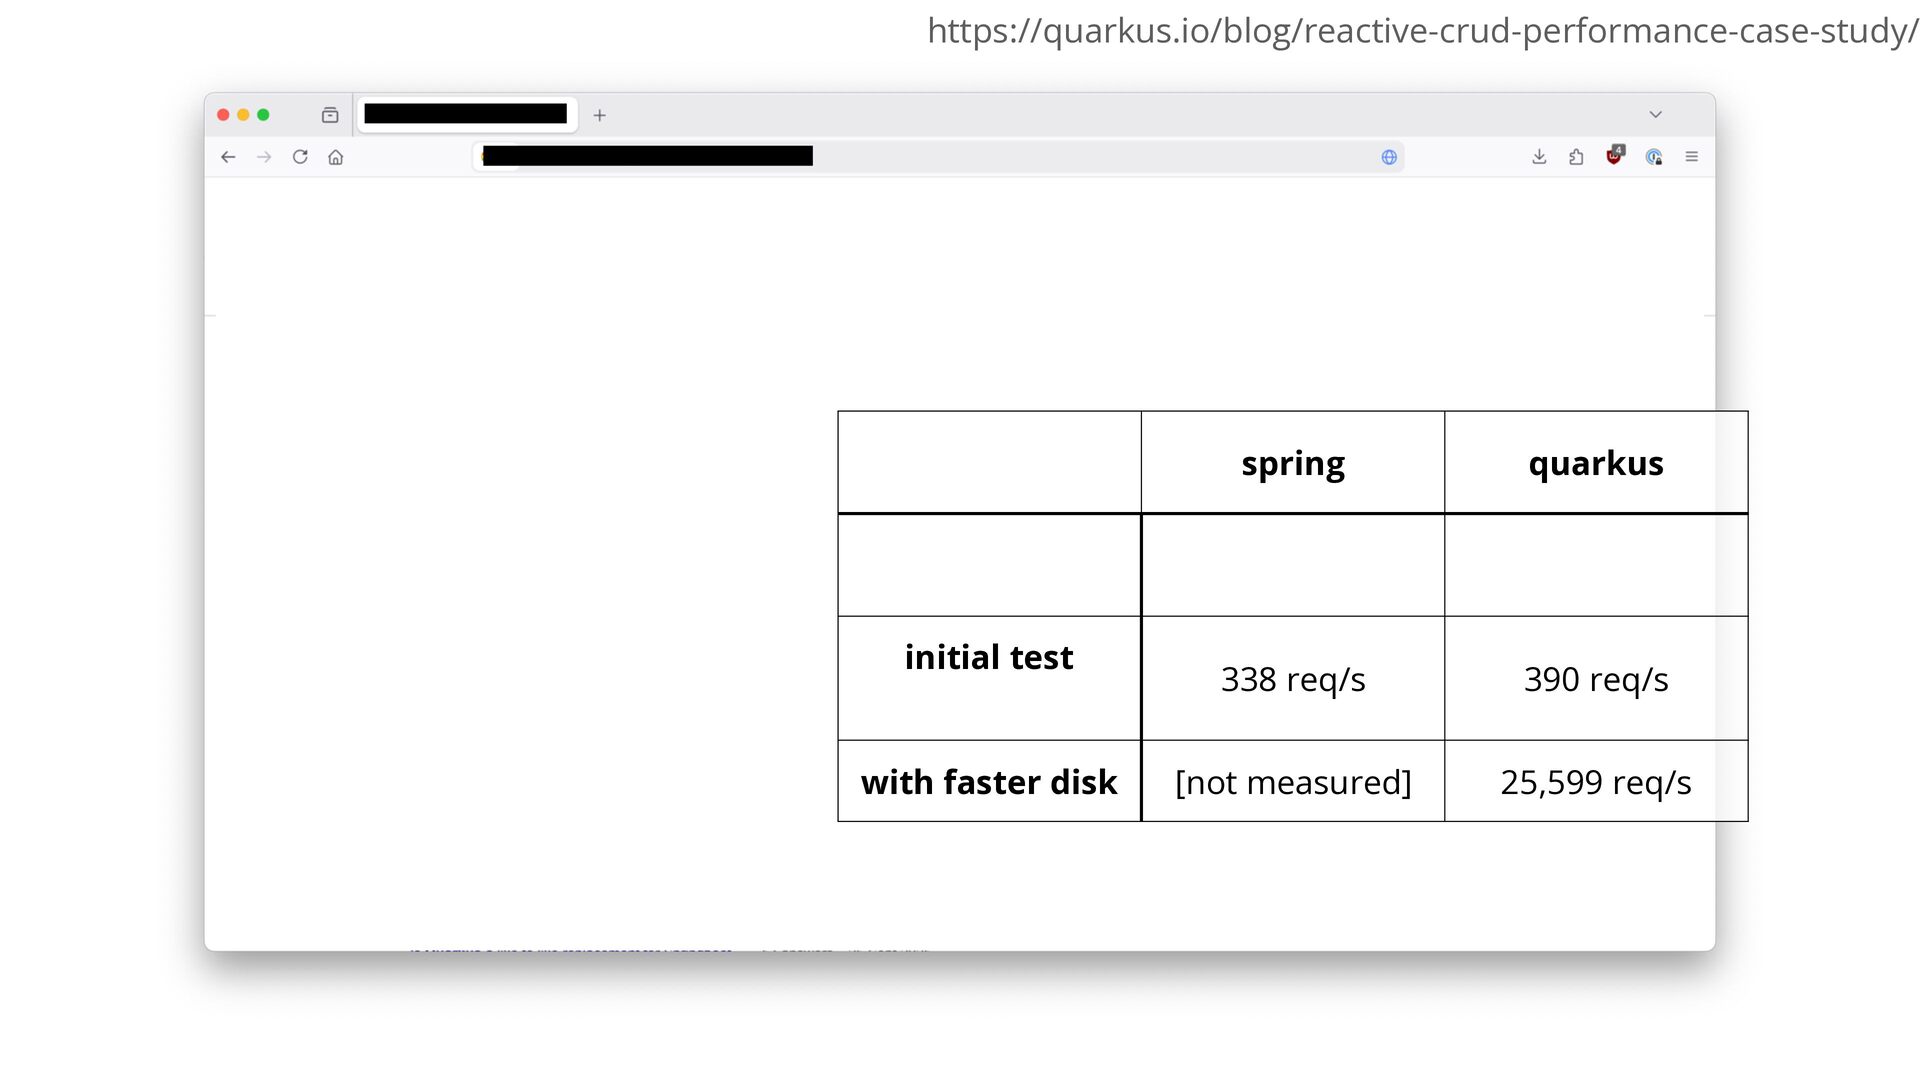
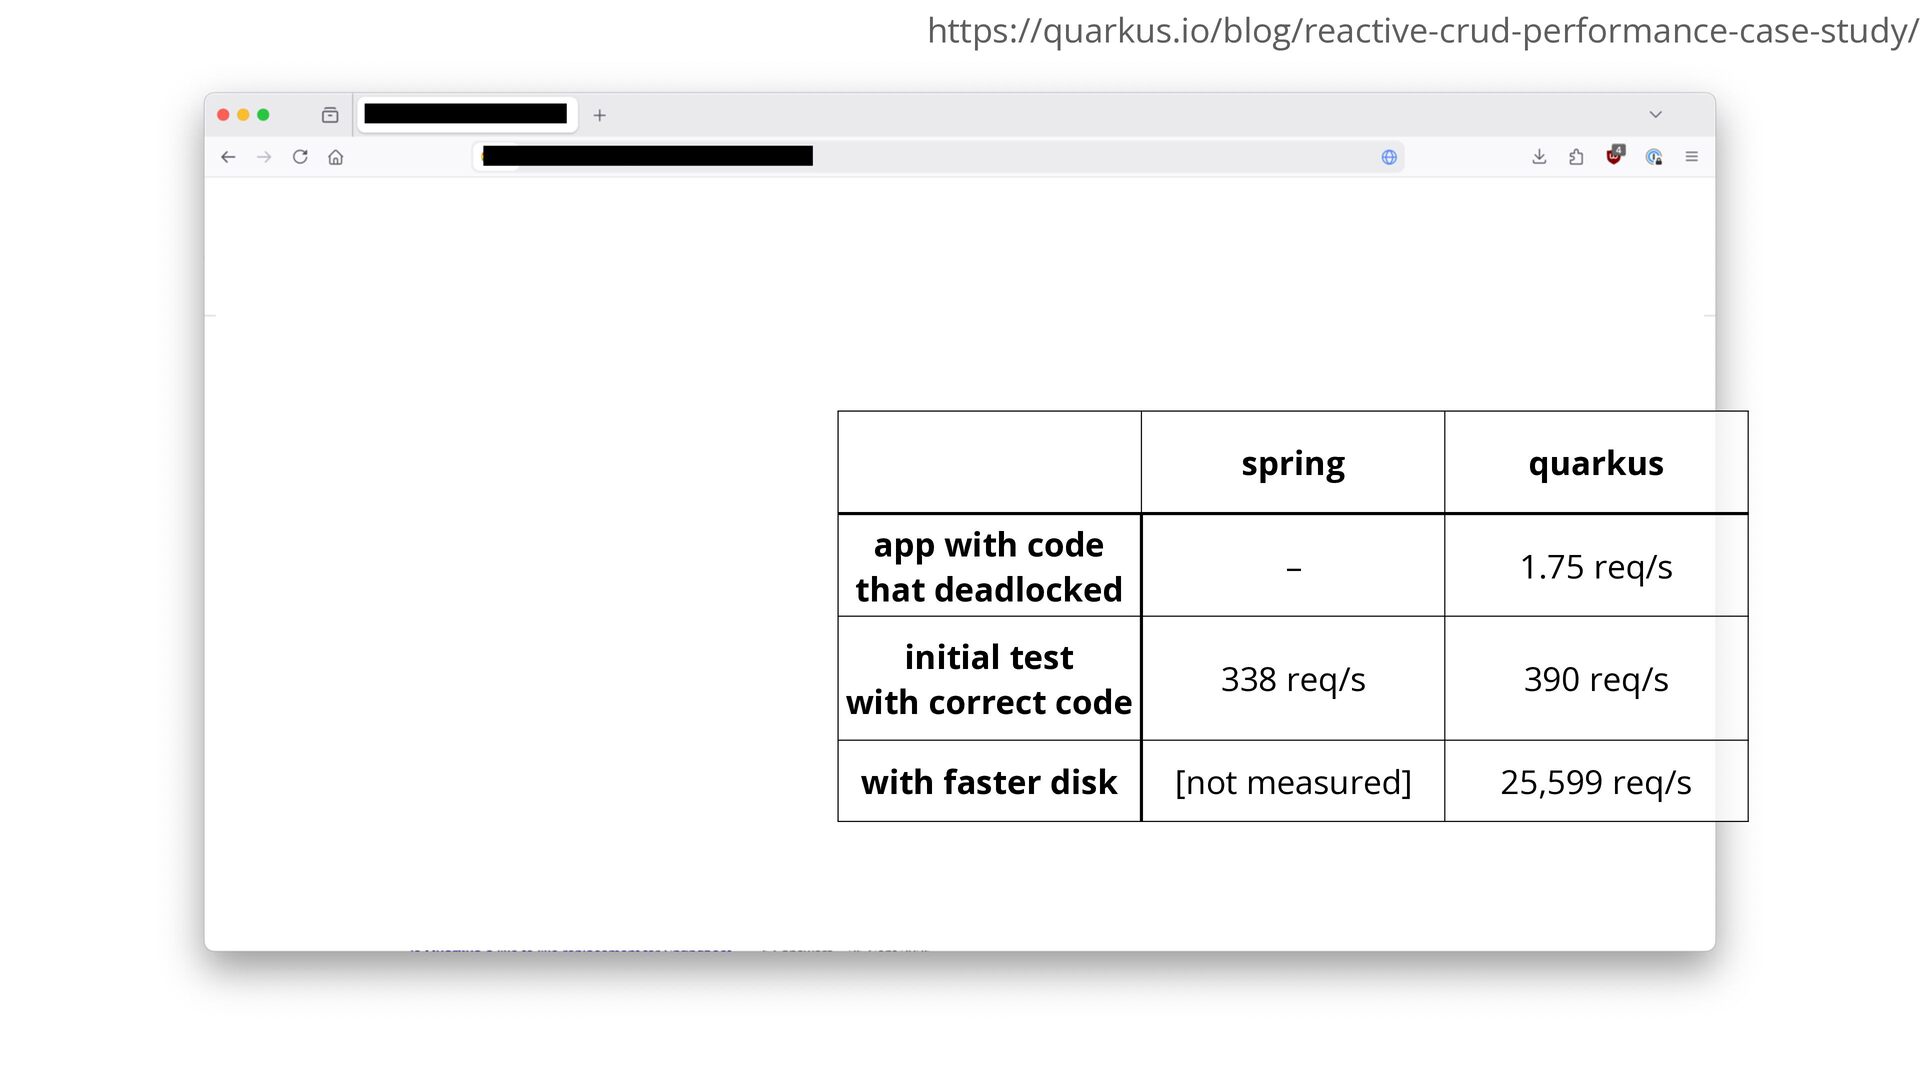
https://quarkus.io/blog/reactive-crud-performance-case-study/ spring quarkus initial test 338 req/s 390 req/s with
faster disk [not measured] 25,599 req/s -
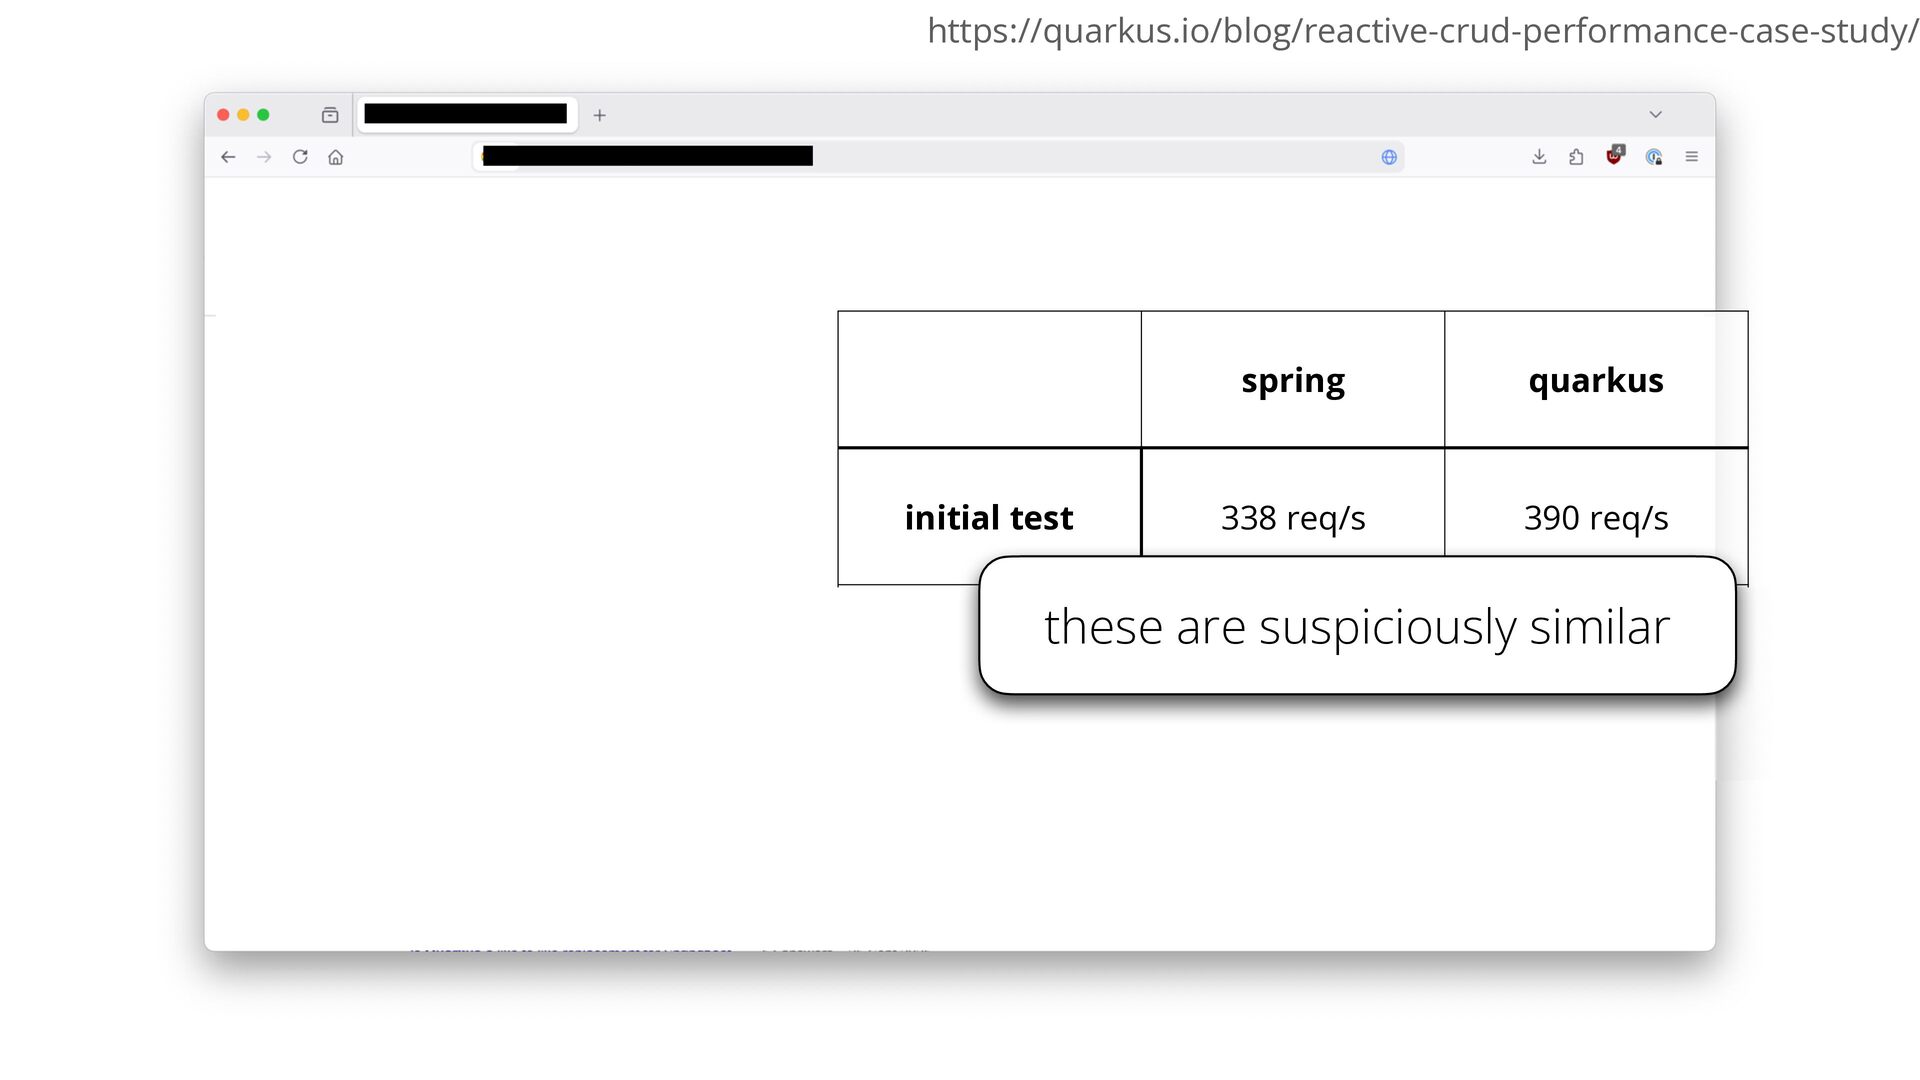
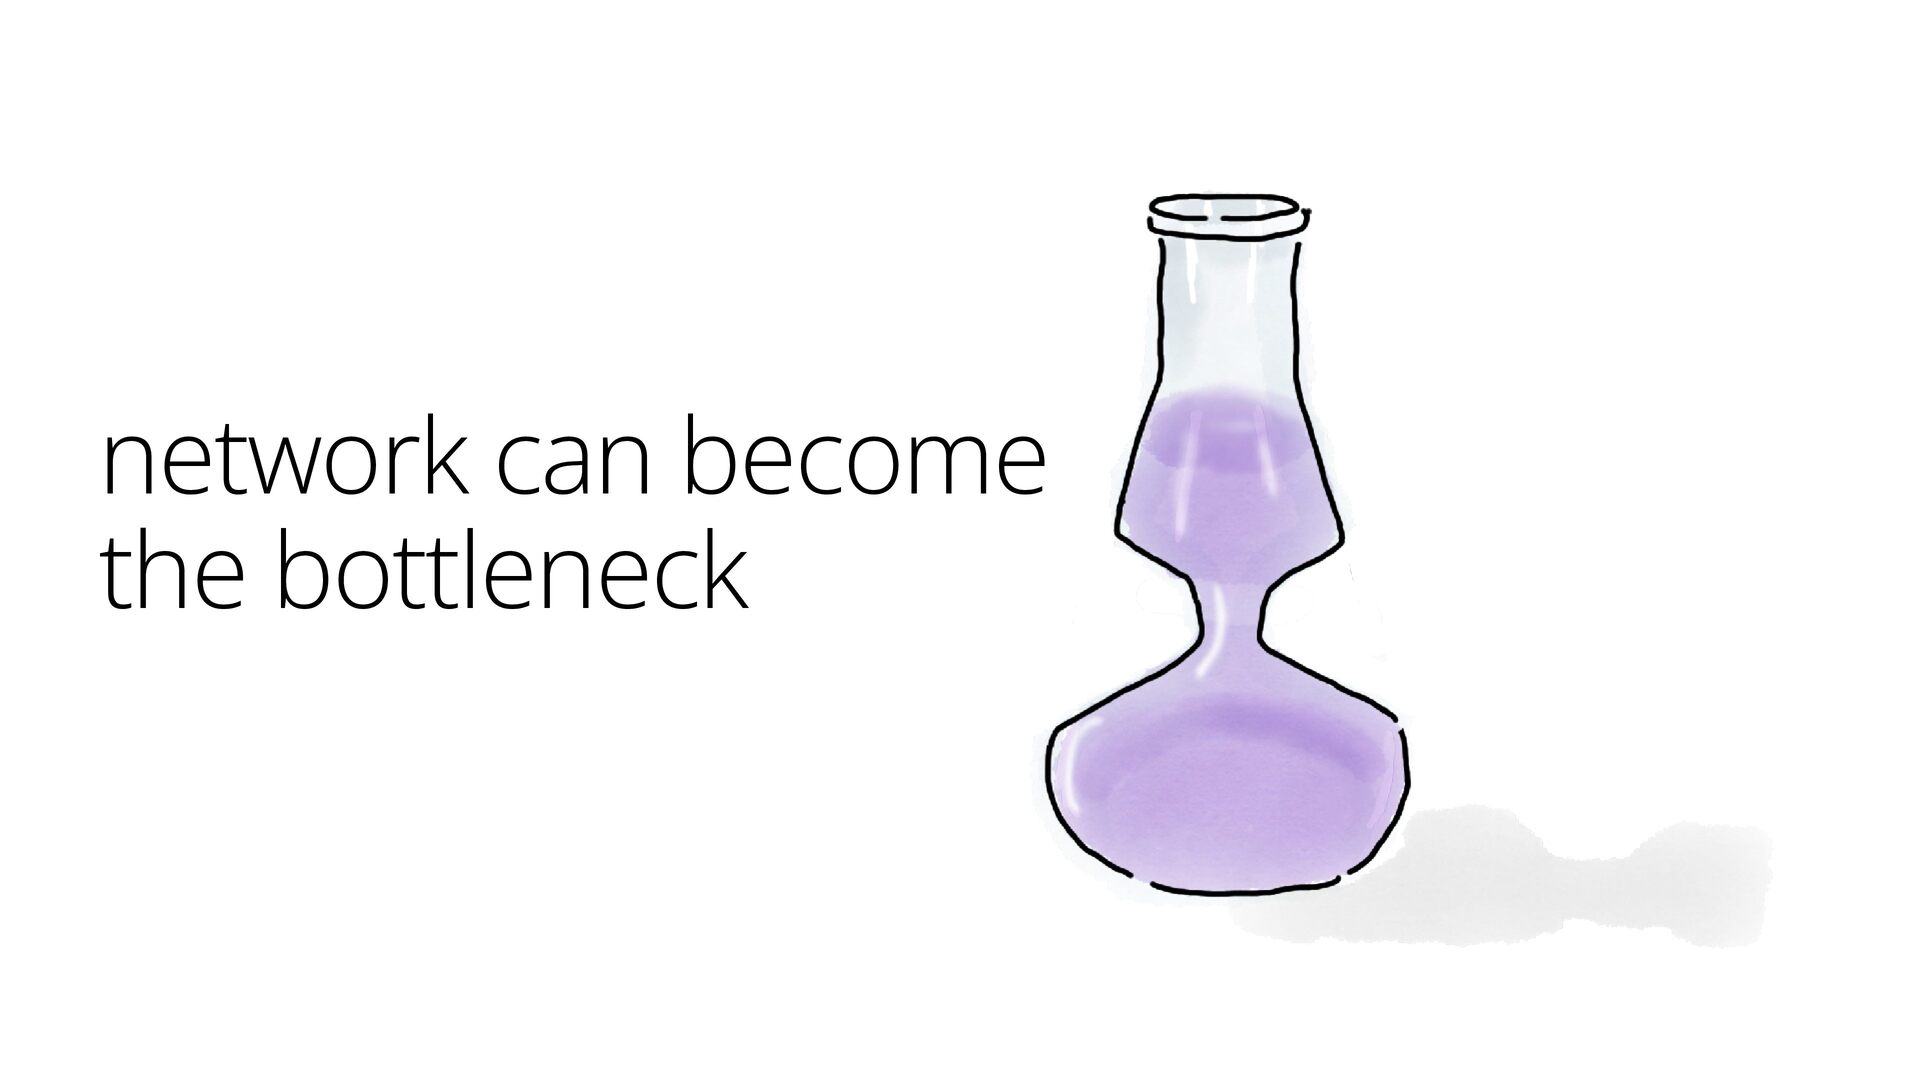
https://quarkus.io/blog/reactive-crud-performance-case-study/ initial test spring quarkus 338 req/s 390 req/s these
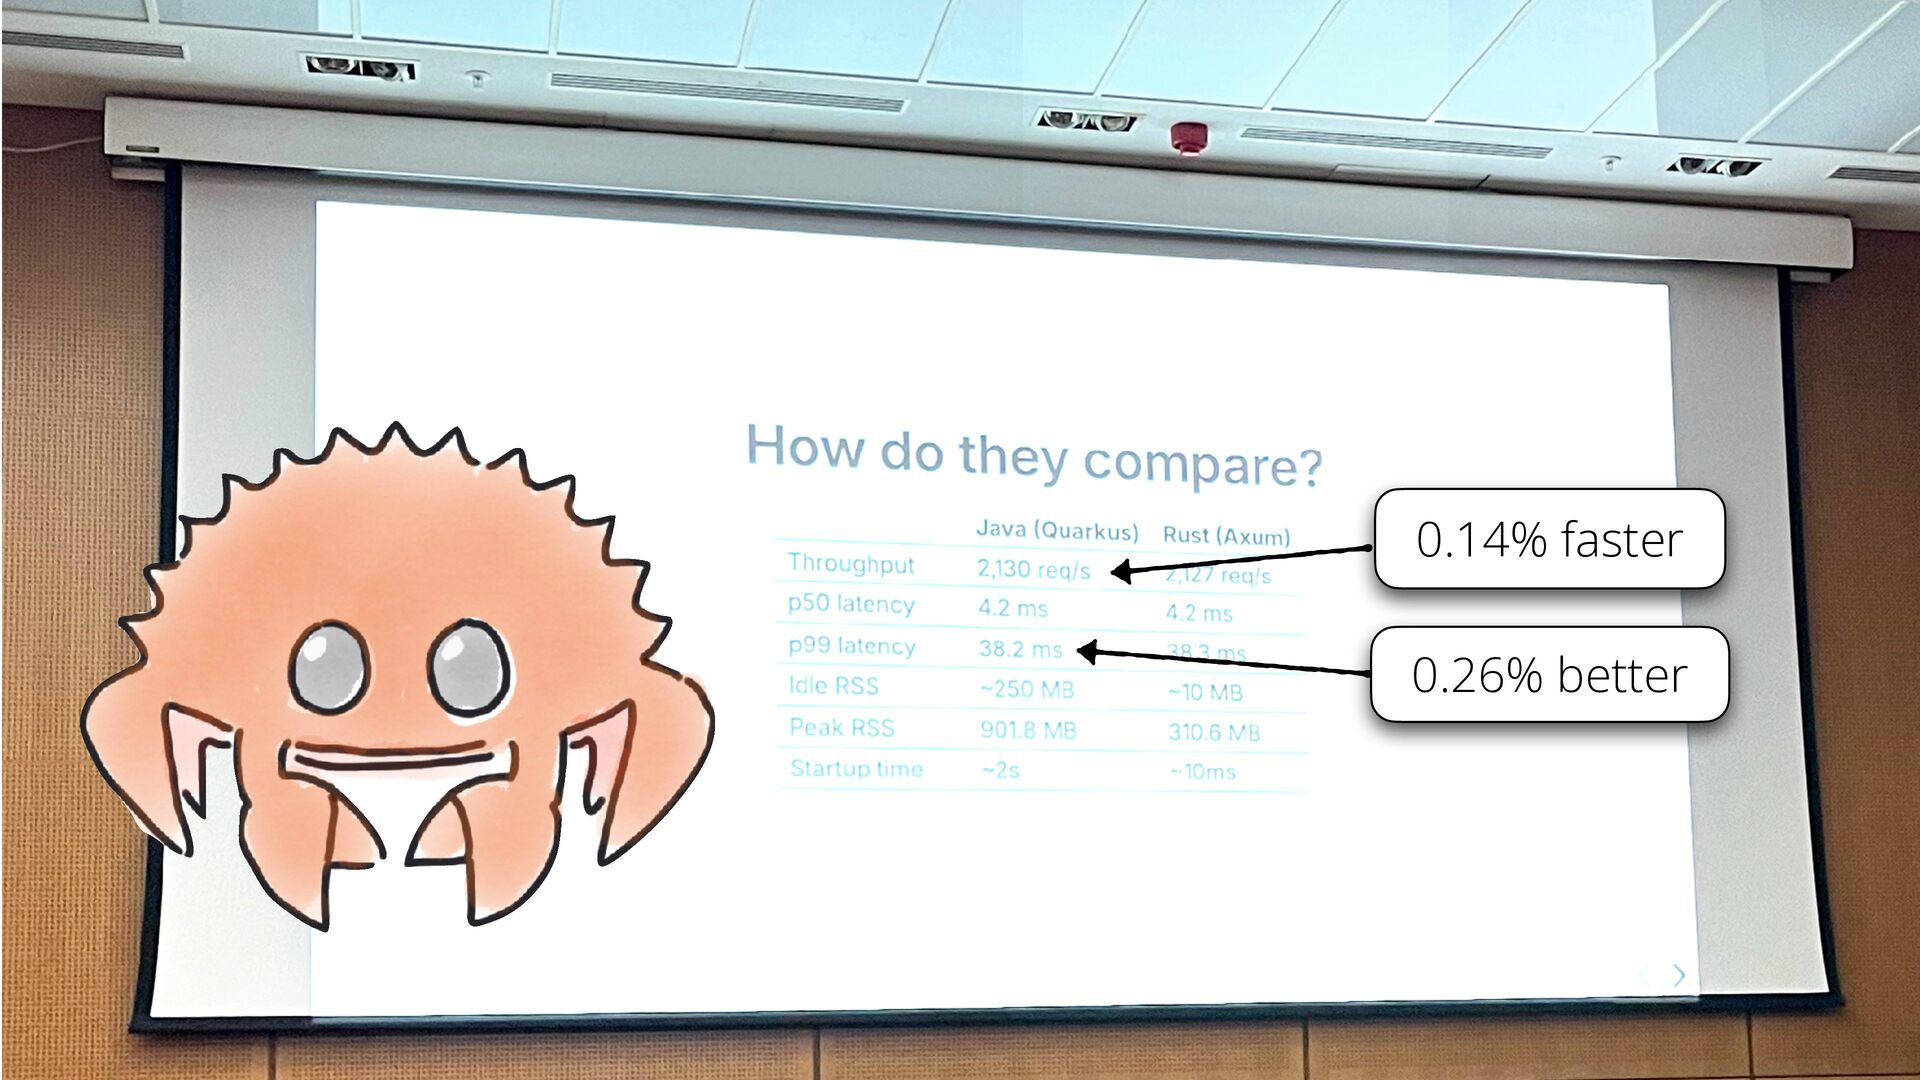
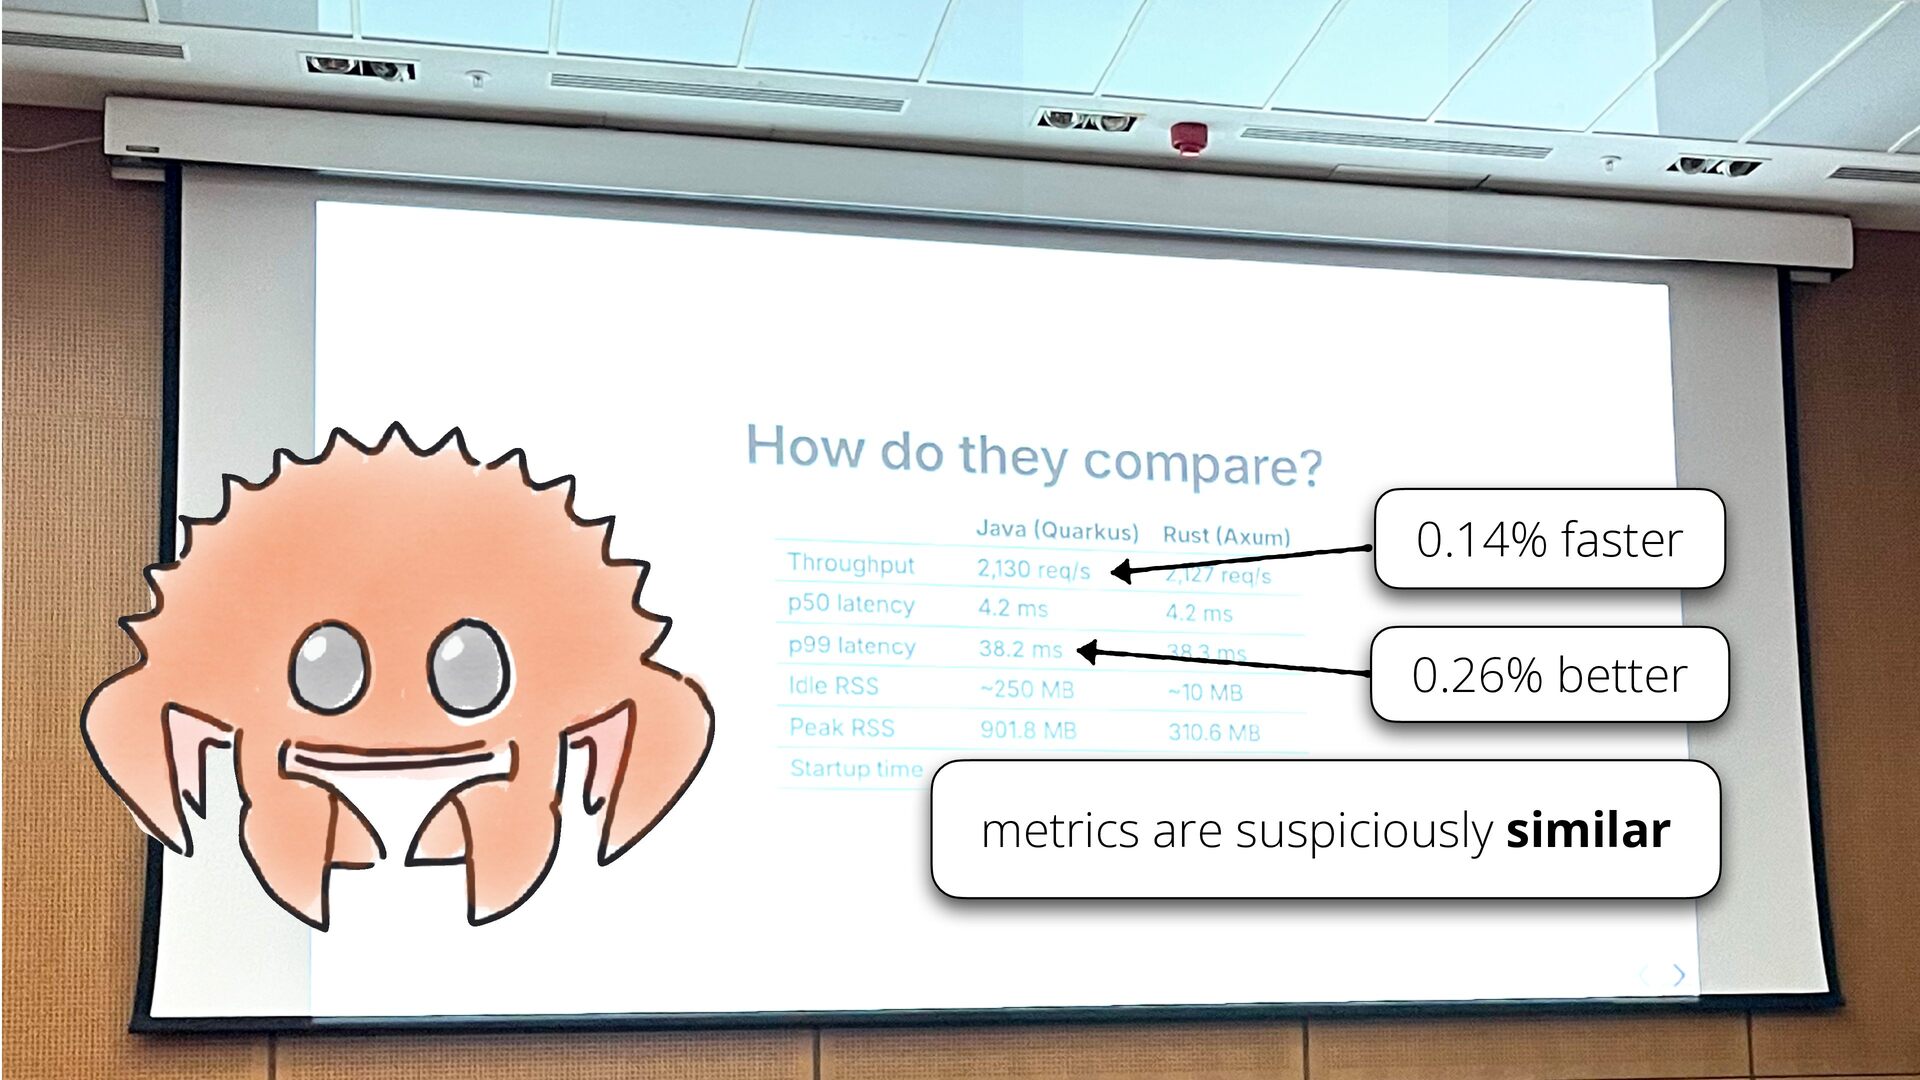
are suspiciously similar with faster disk [not measured] 25,599 req/s -
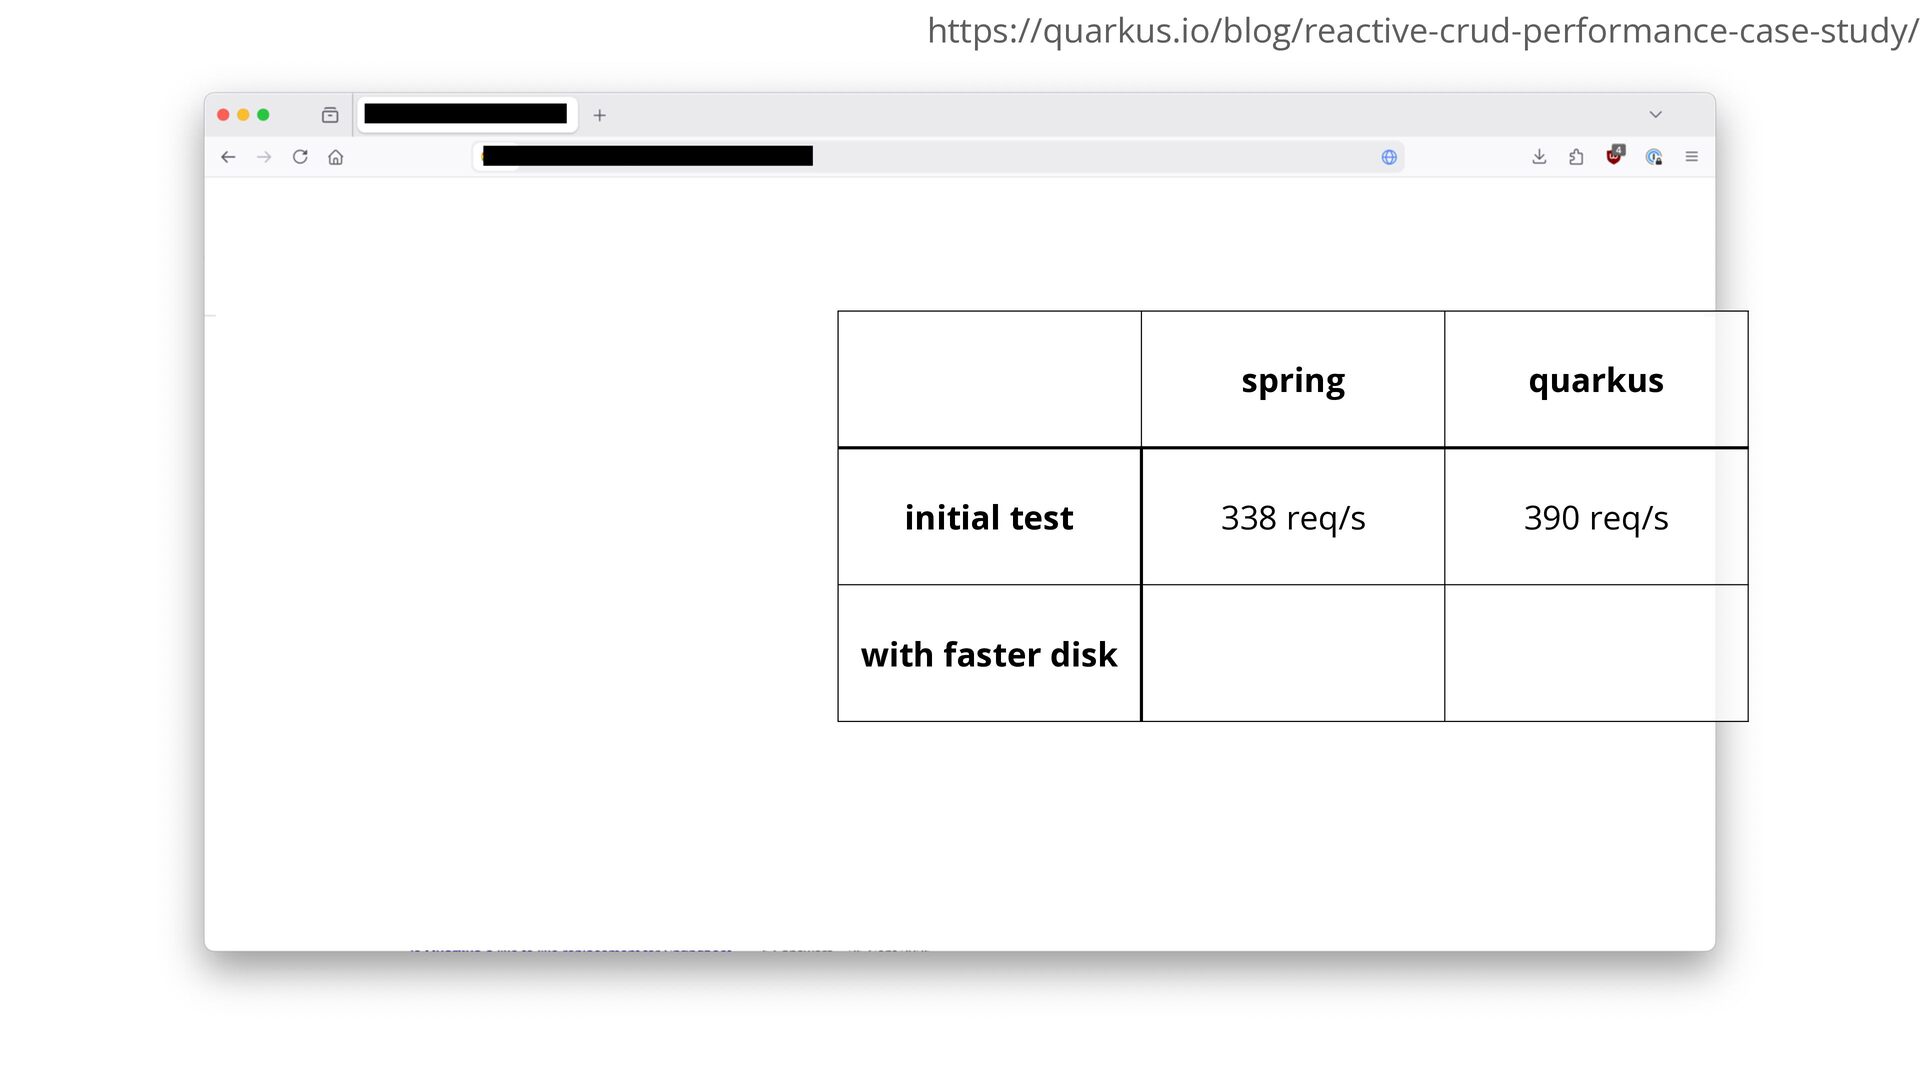
https://quarkus.io/blog/reactive-crud-performance-case-study/ spring quarkus initial test 338 req/s 390 req/s with
faster disk [not measured] 25,599 req/s -
https://quarkus.io/blog/reactive-crud-performance-case-study/ spring quarkus initial test 338 req/s 390 req/s with
faster disk [not measured] 25,599 req/s -
https://quarkus.io/blog/reactive-crud-performance-case-study/ spring quarkus initial test 338 req/s 390 req/s with
faster disk [not measured] 25,599 req/s -
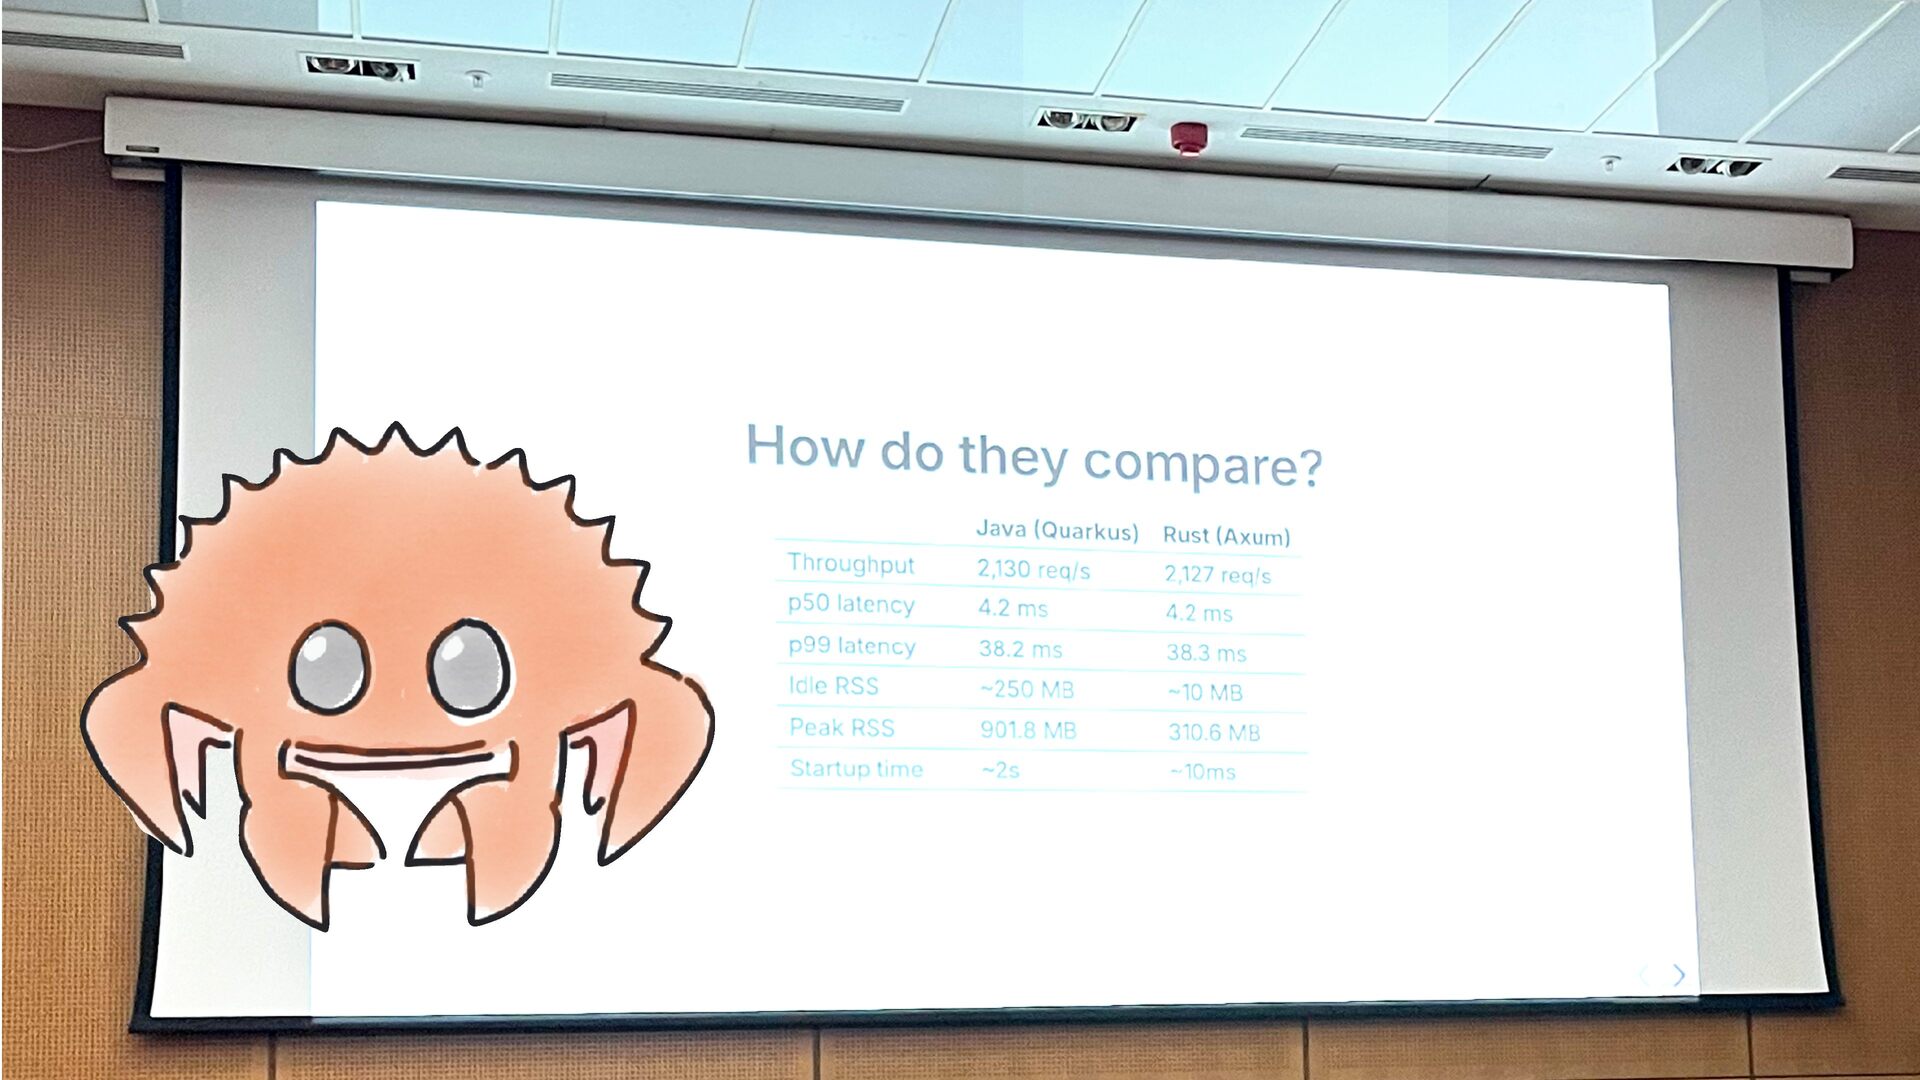
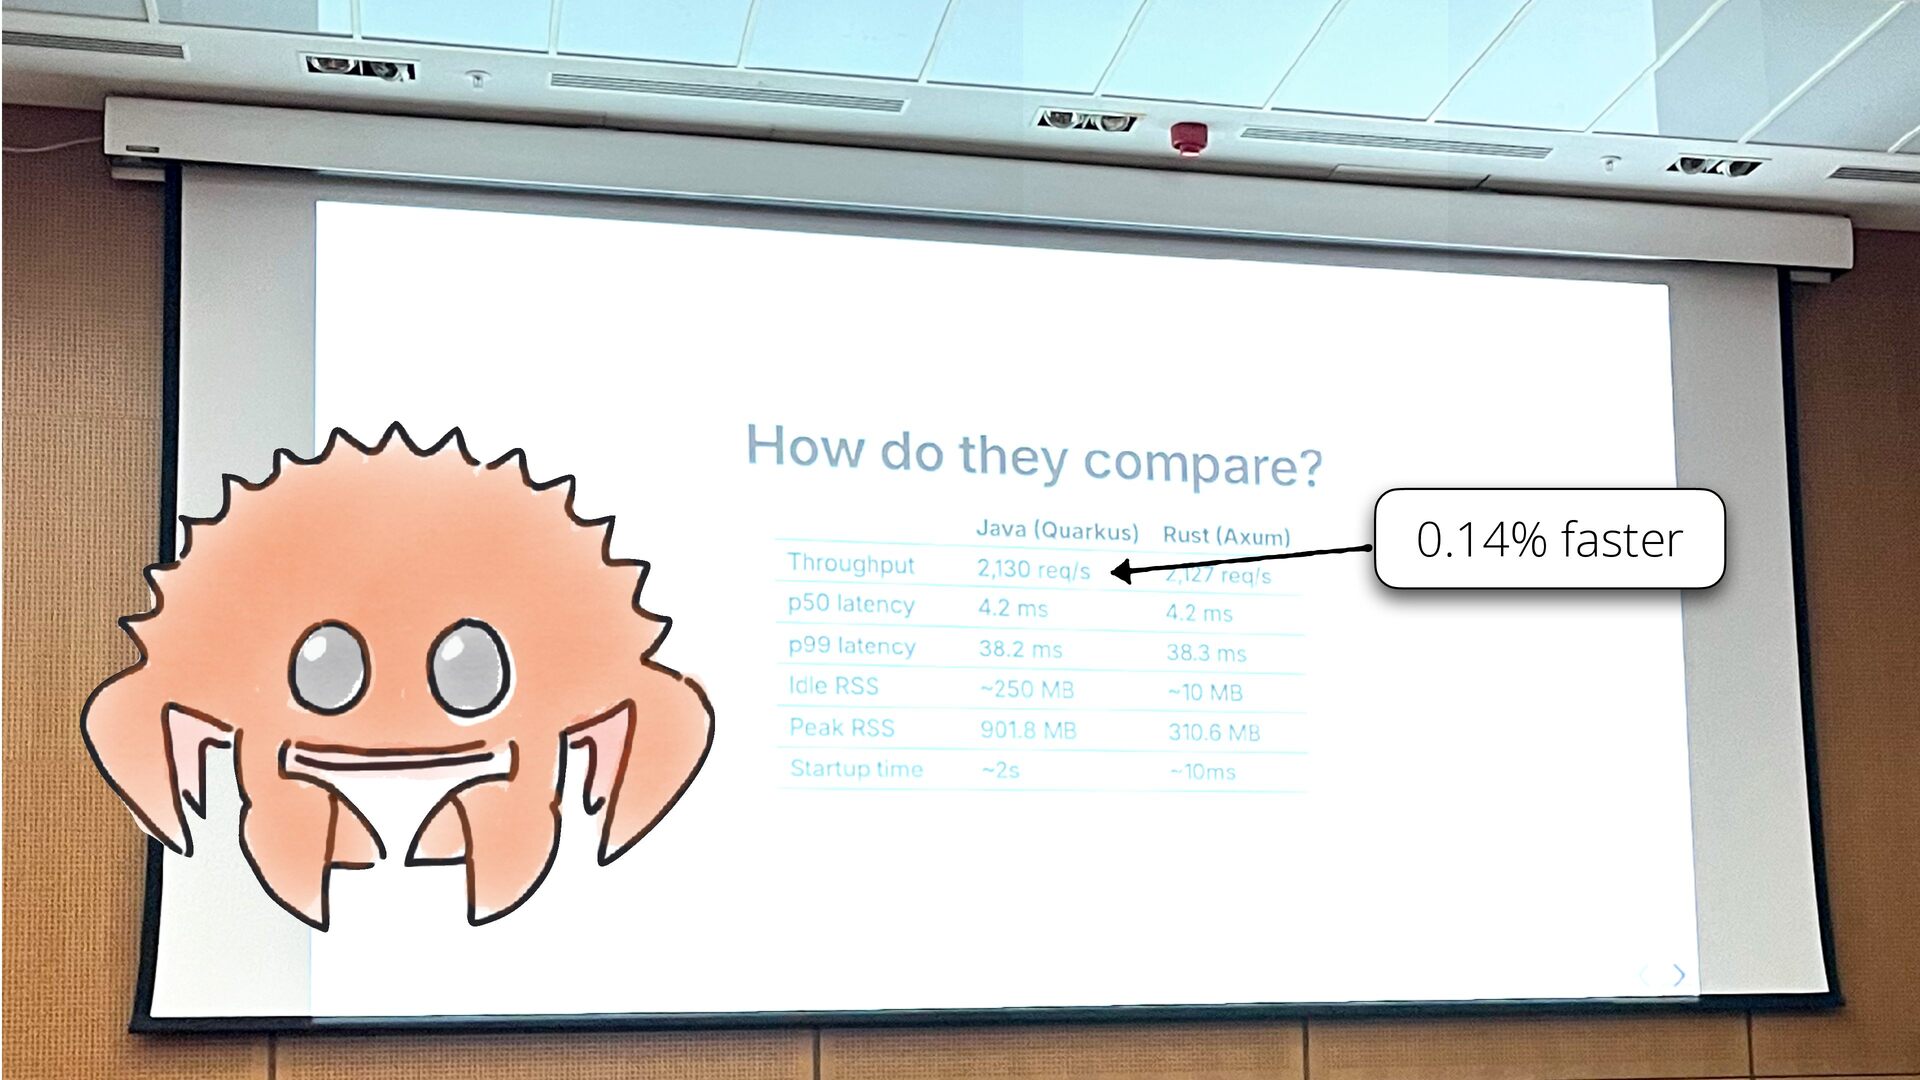
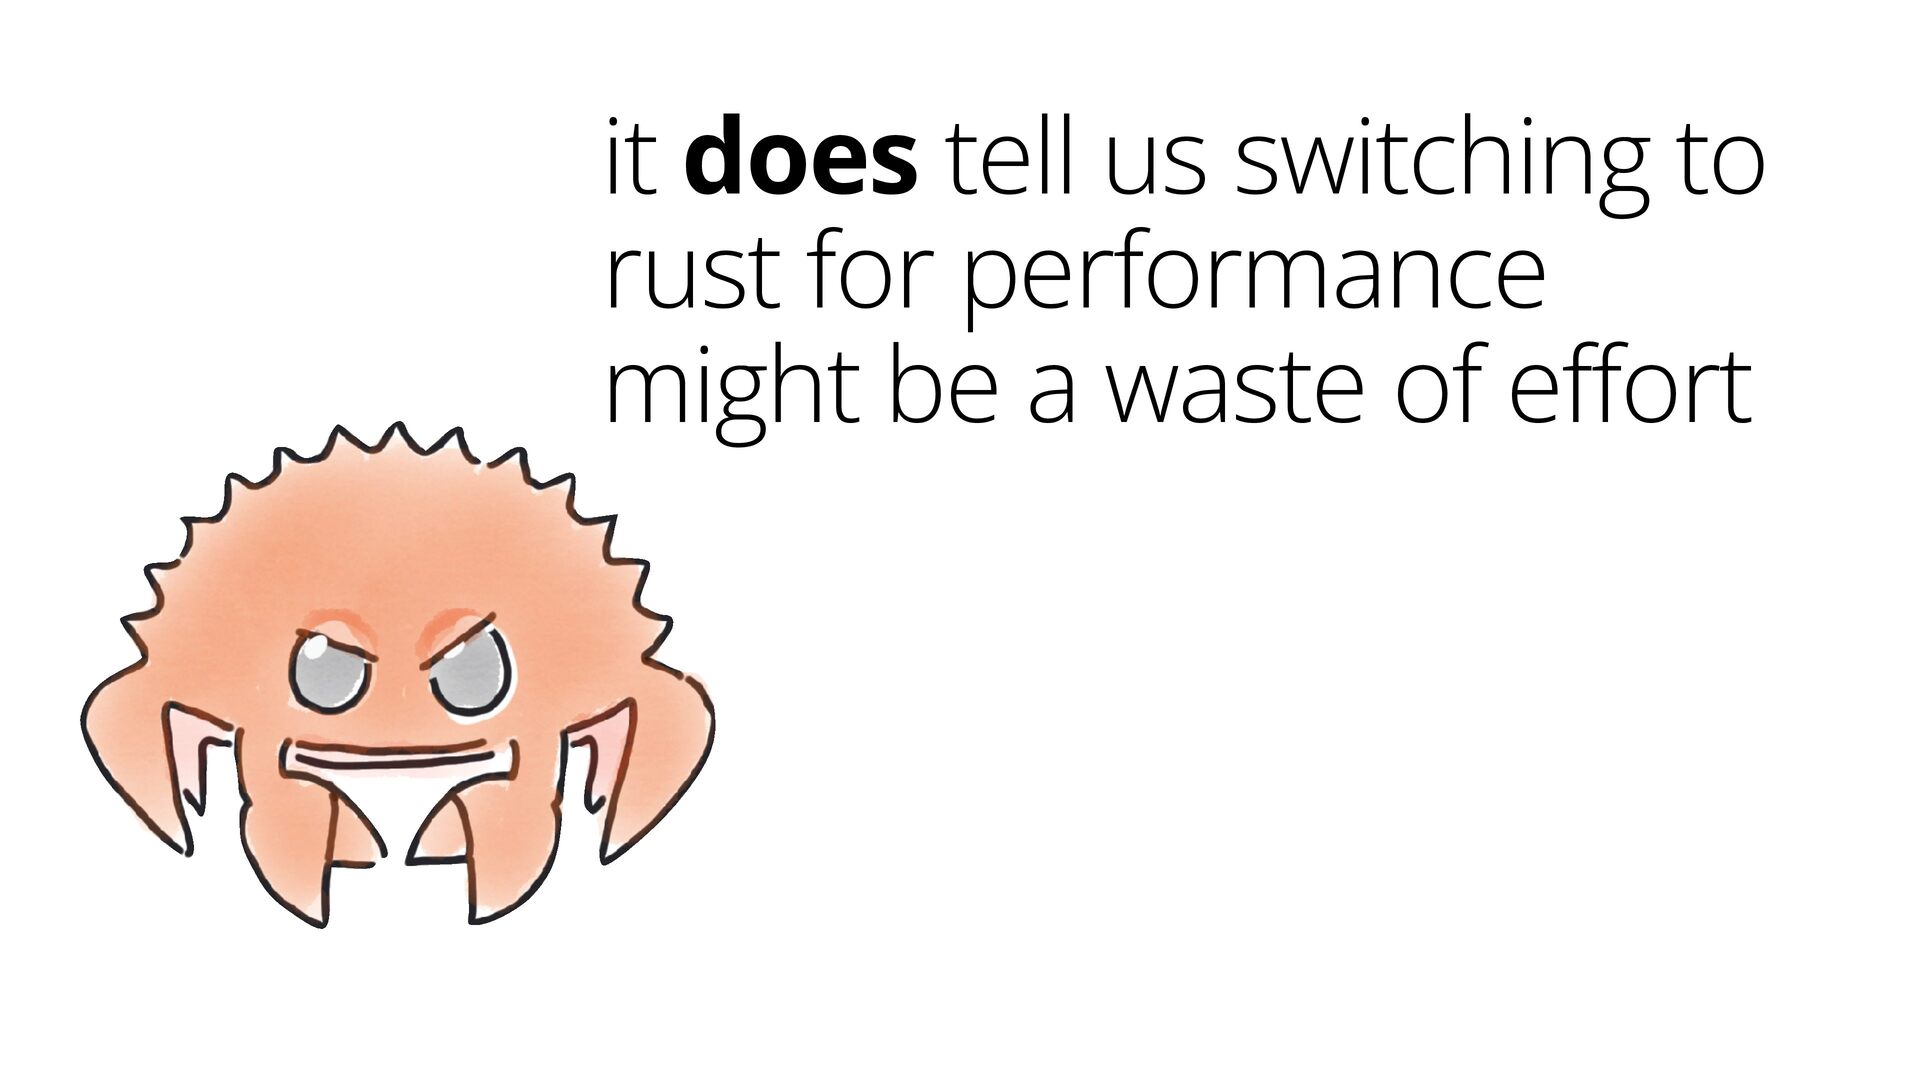
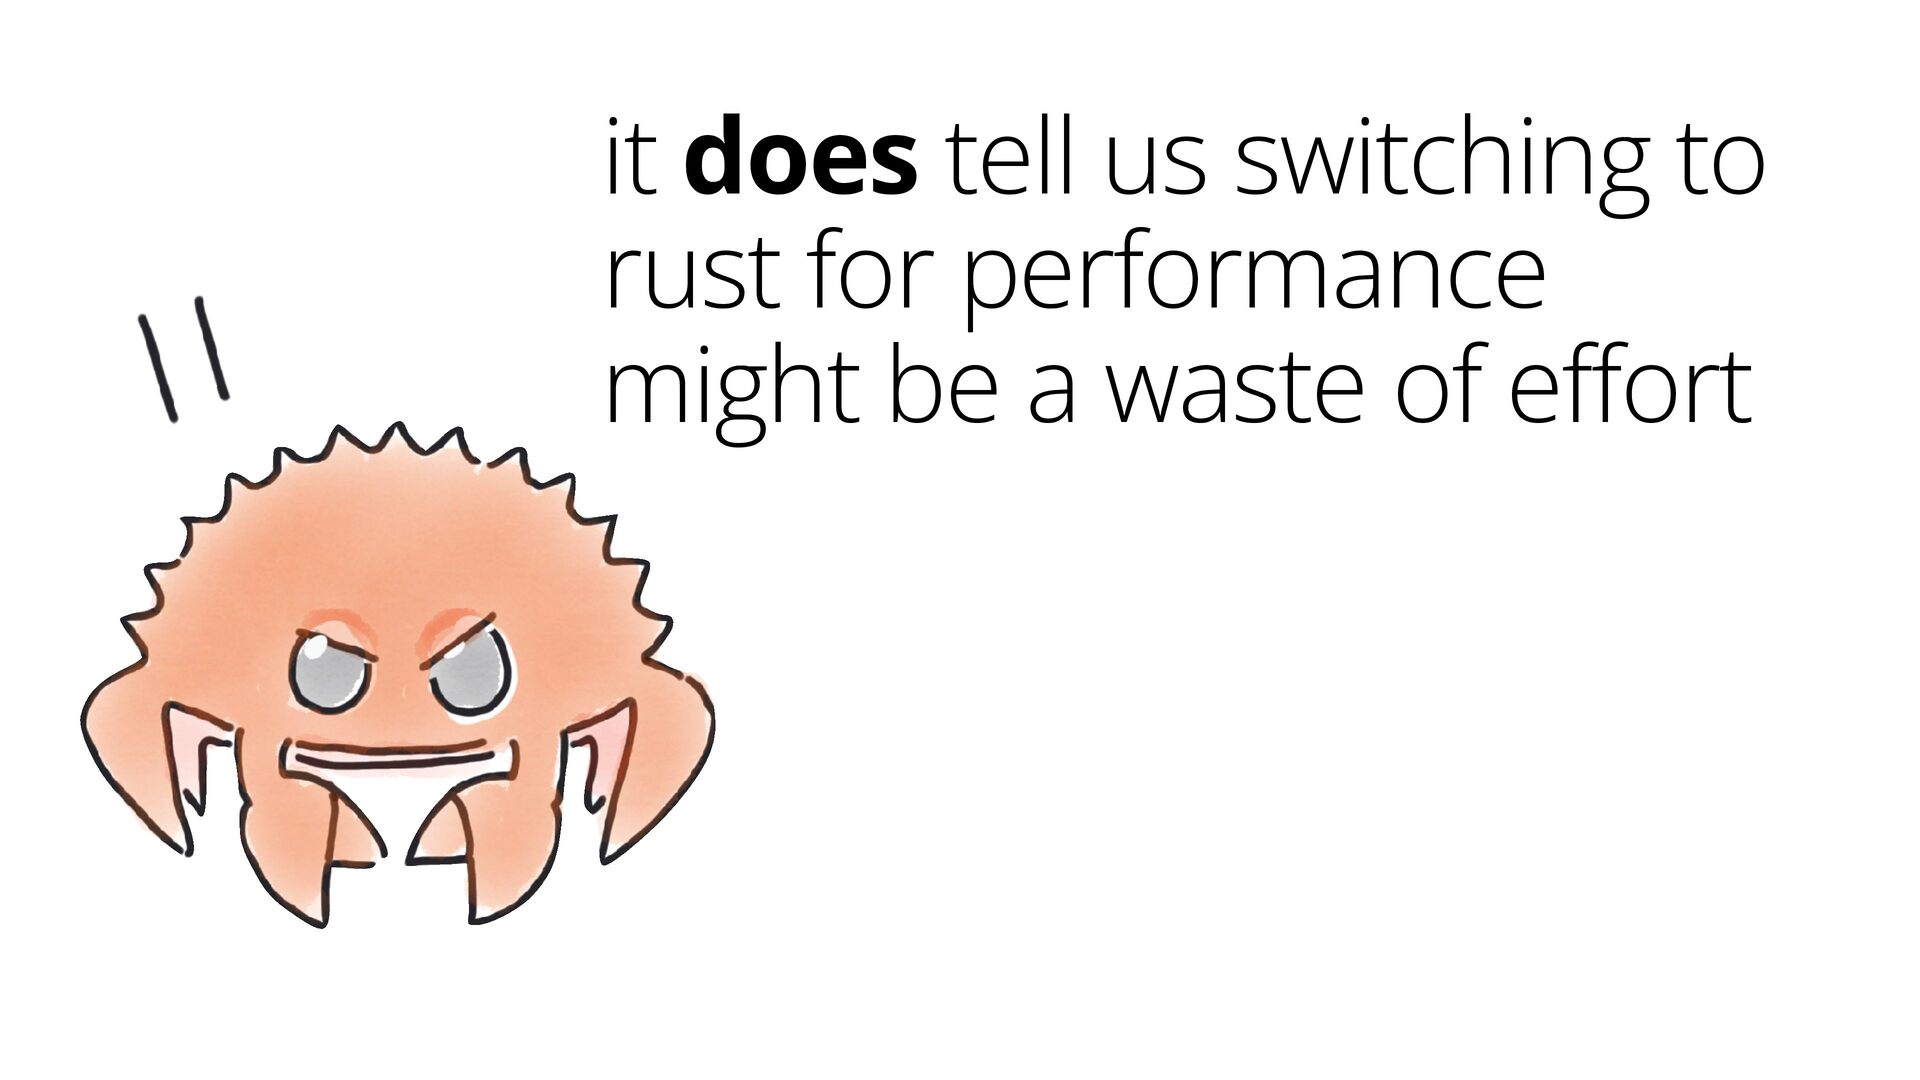
it does tell us switching to rust for performance might
be a waste of effort -
it does tell us switching to rust for performance might
be a waste of effort -
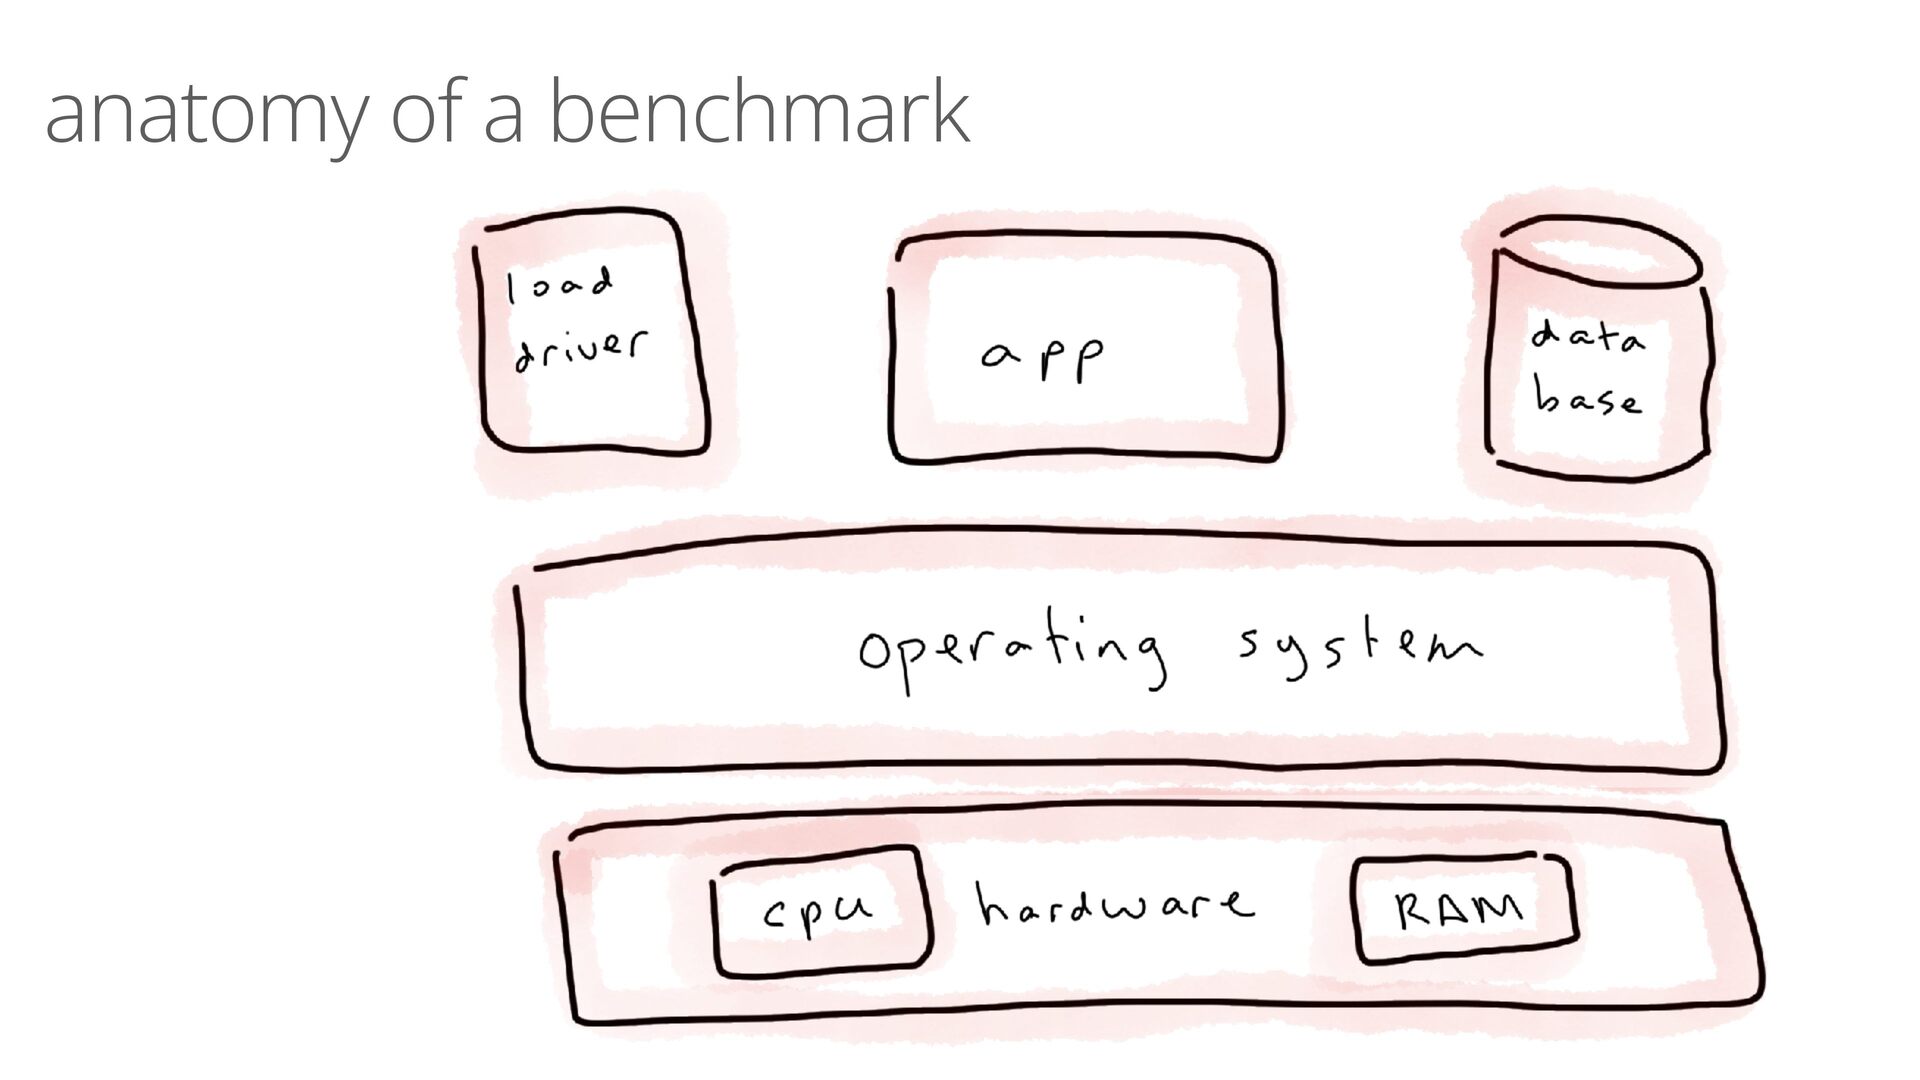
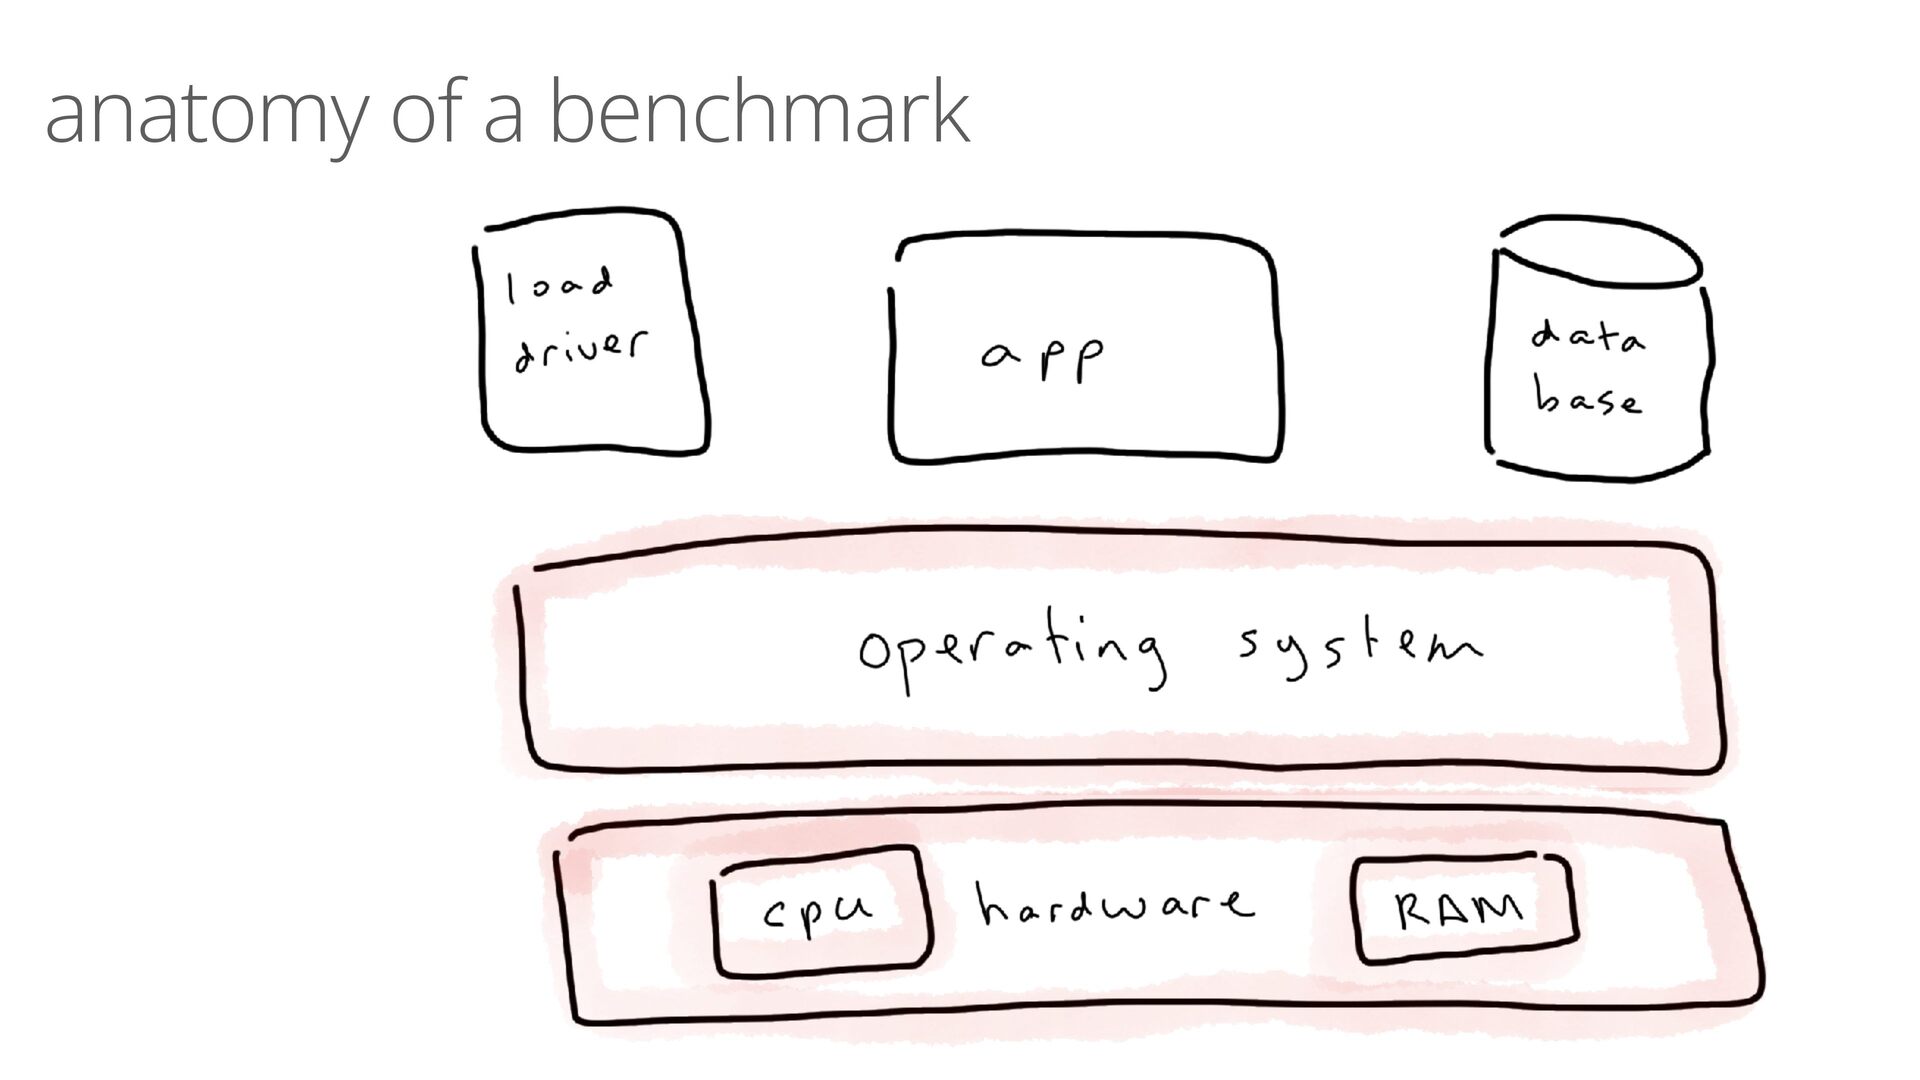
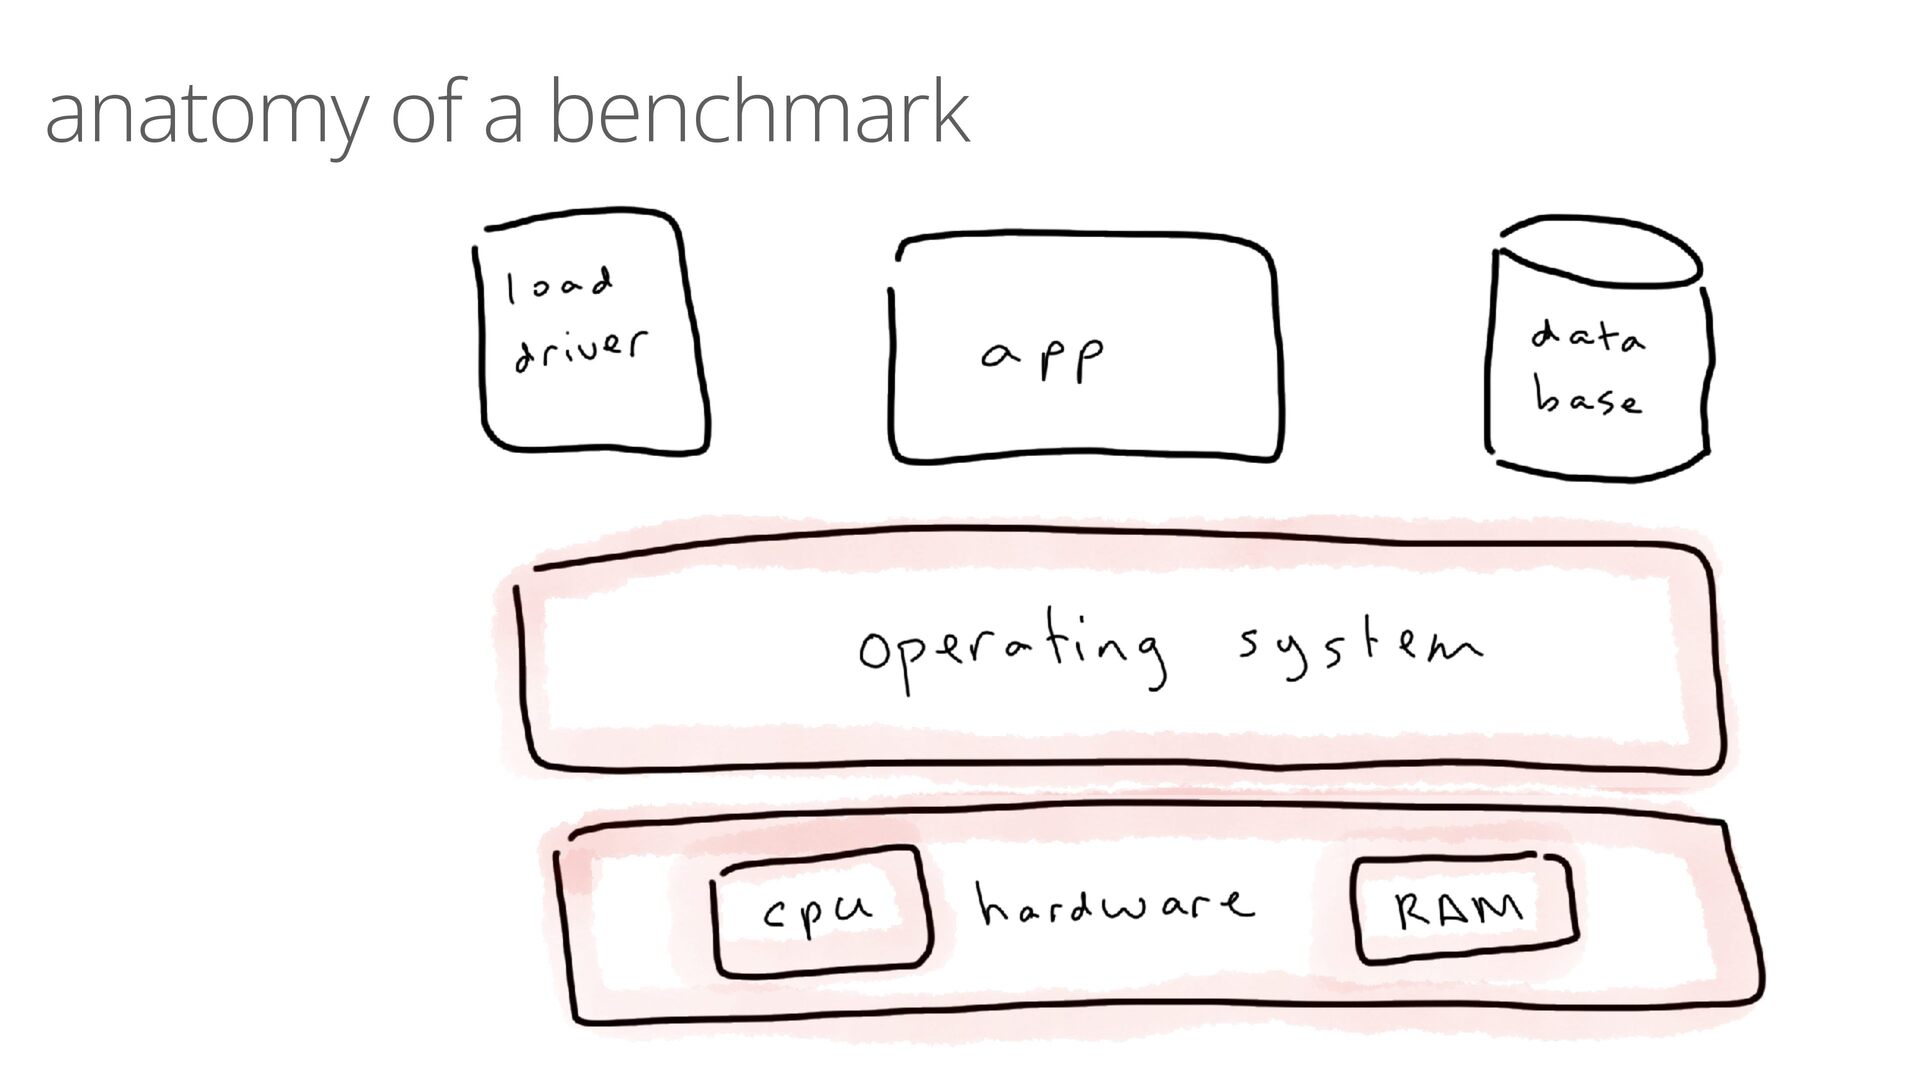
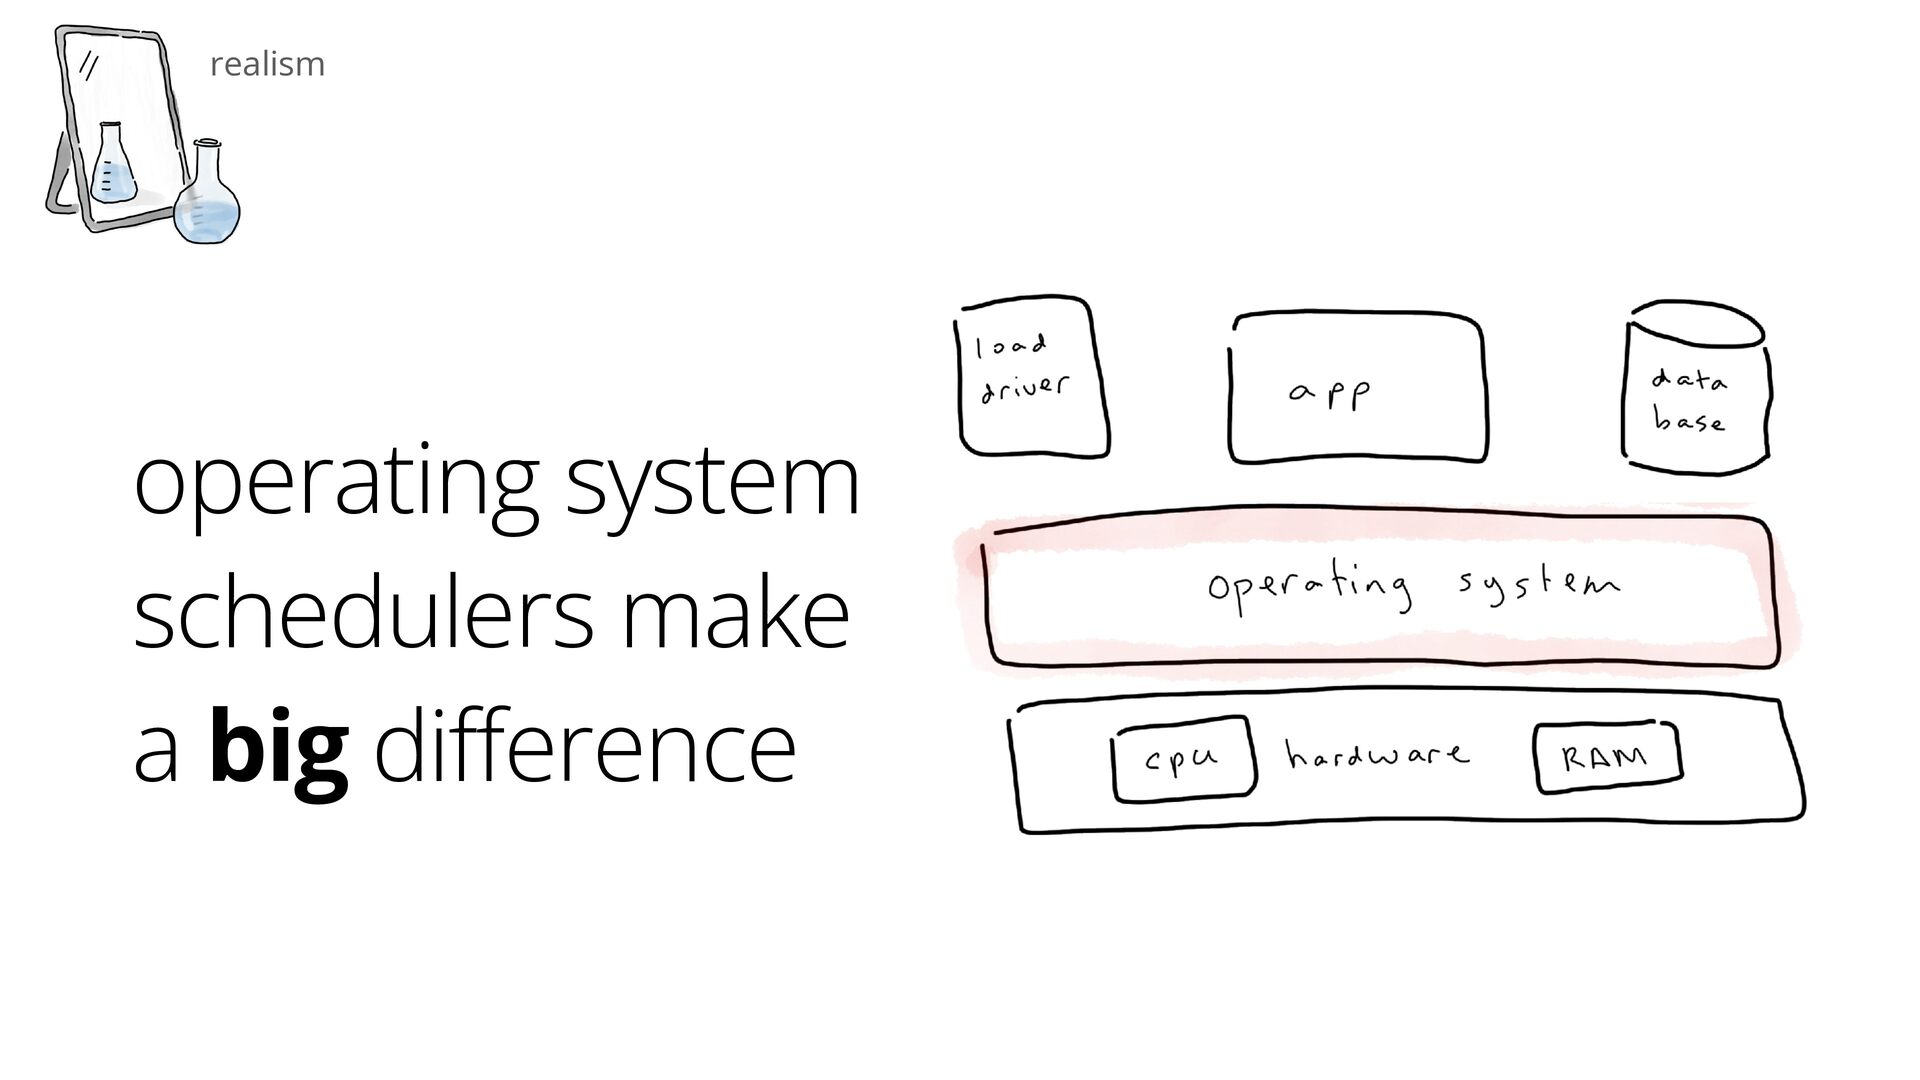
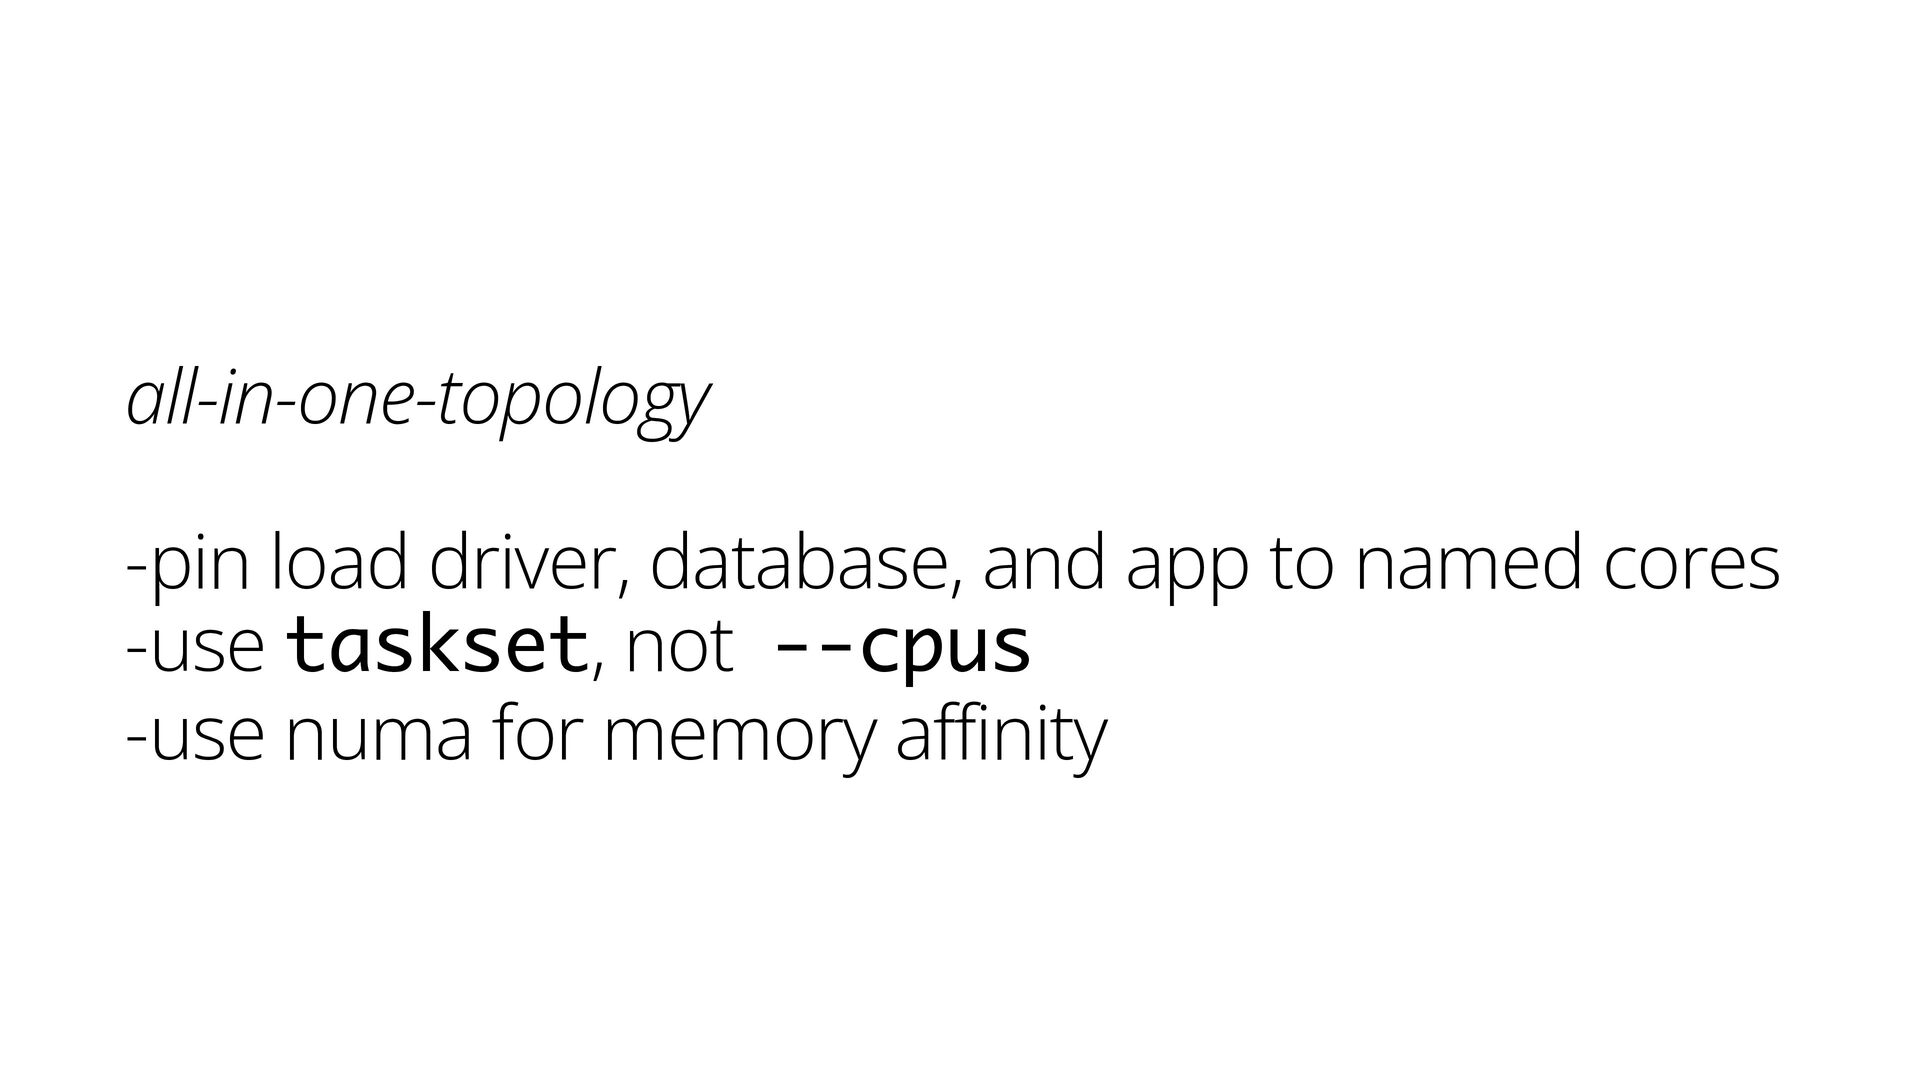
all-in-one-topology -pin load driver, database, and app to named cores
-use taskset, not --cpus -use numa for memory affinity -
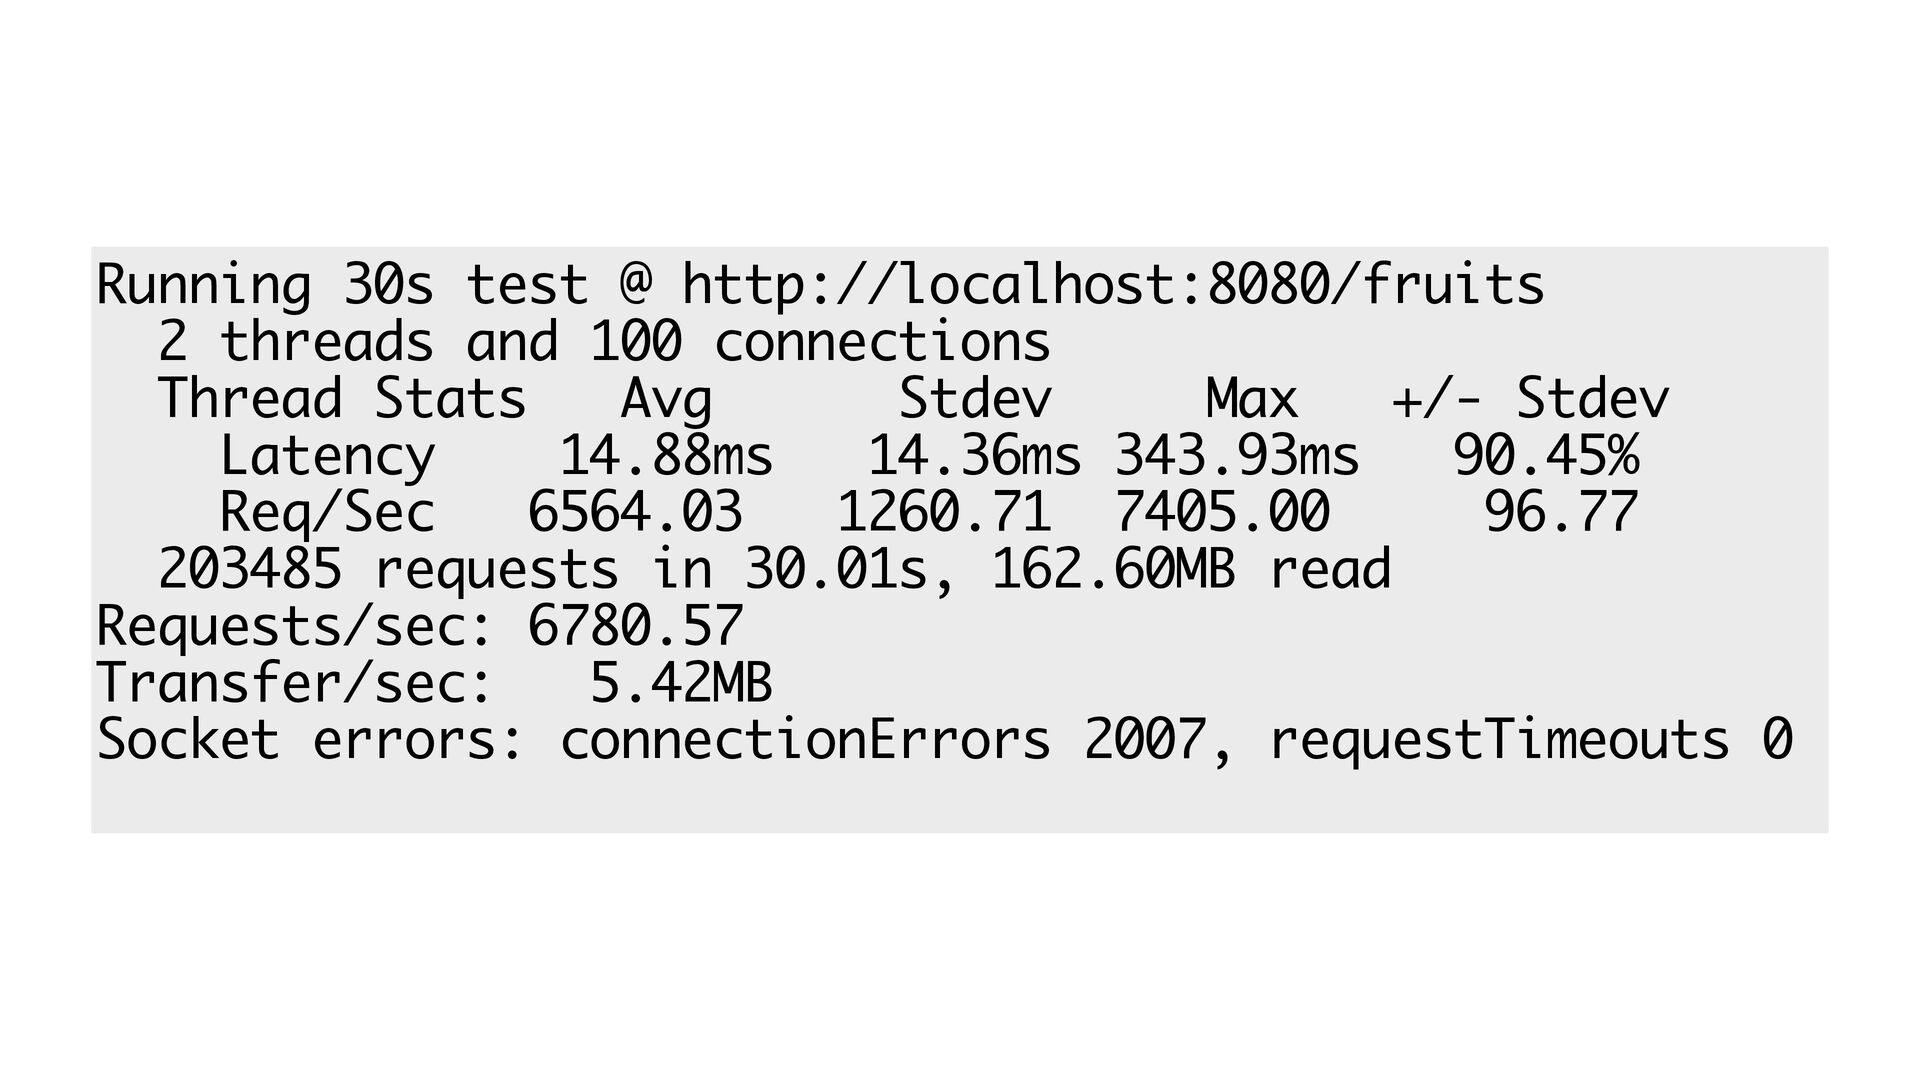
Running 30s test @ http://localhost:8080/fruits 2 threads and 100 connections
Thread Stats Avg Stdev Max +/- Stdev Latency 14.88ms 14.36ms 343.93ms 90.45% Req/Sec 6564.03 1260.71 7405.00 96.77 203485 requests in 30.01s, 162.60MB read Requests/sec: 6780.57 Transfer/sec: 5.42MB Socket errors: connectionErrors 2007, requestTimeouts 0 -
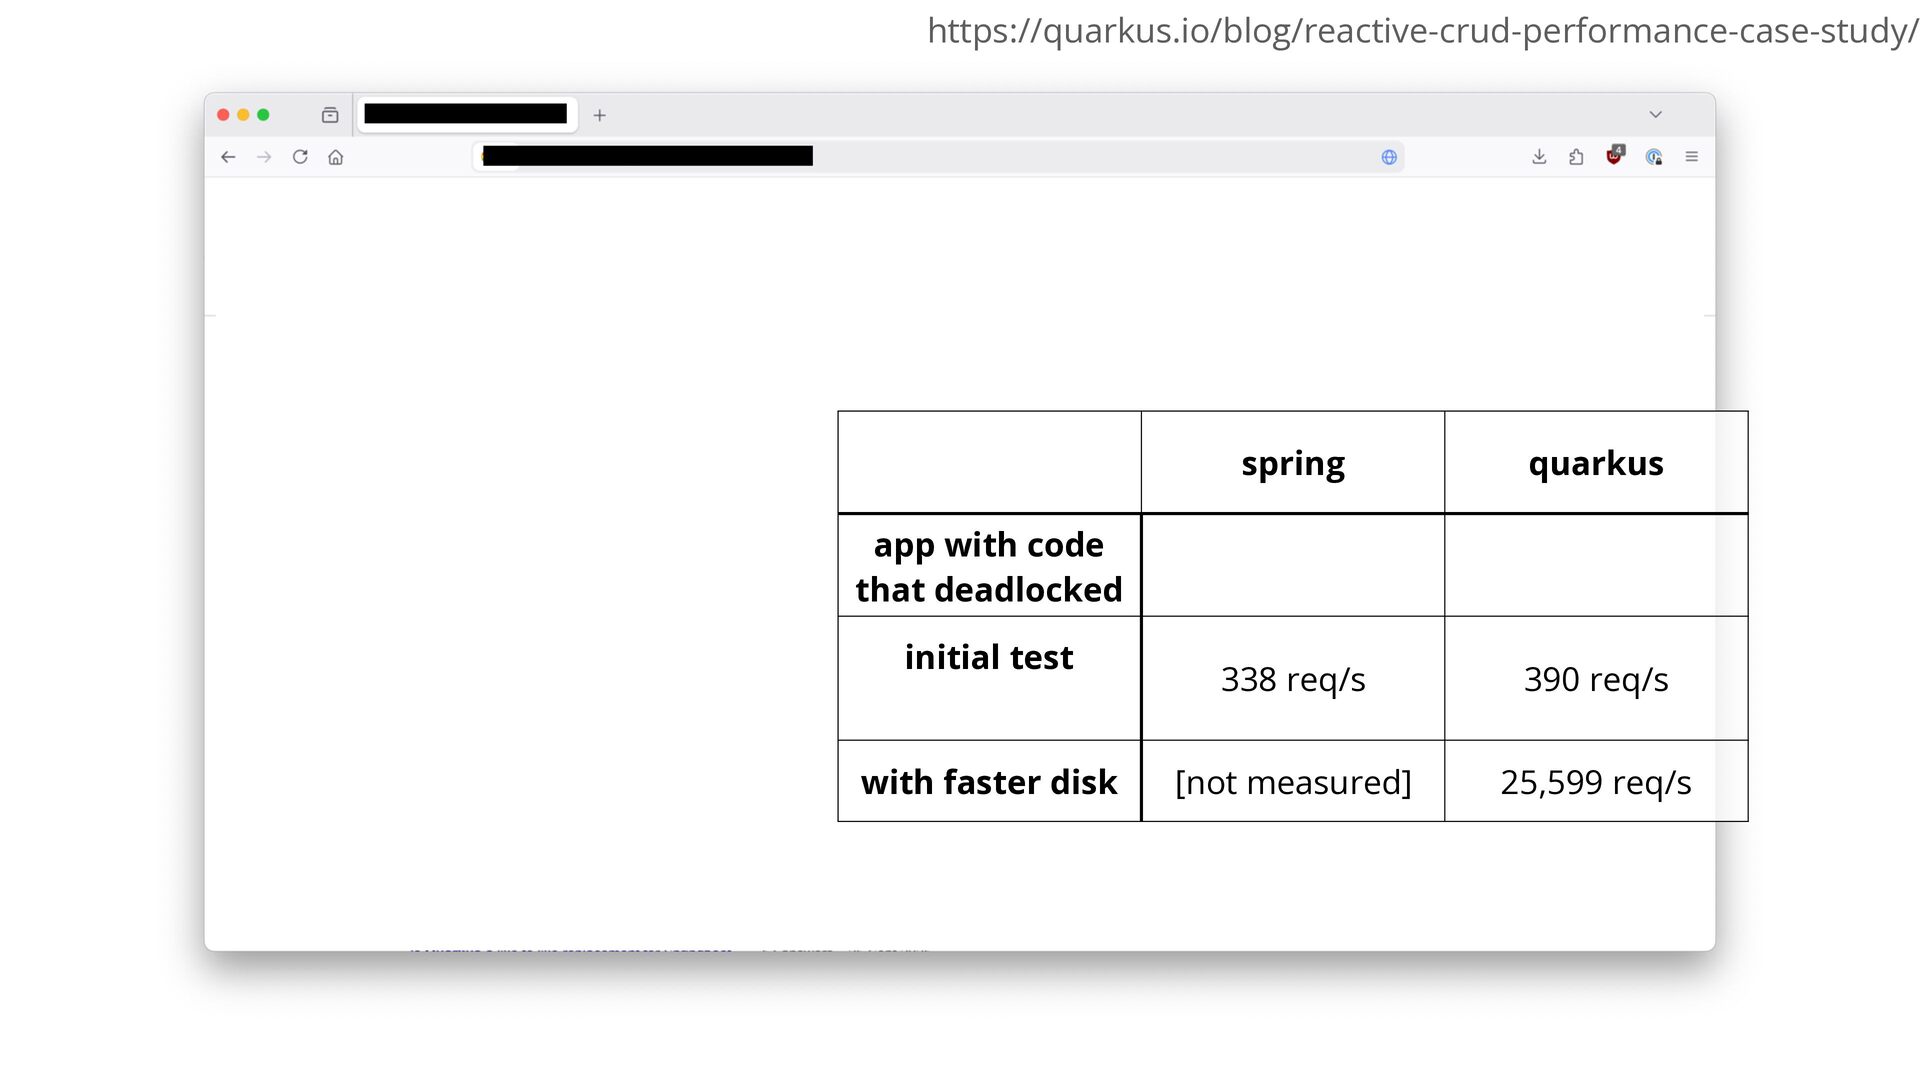
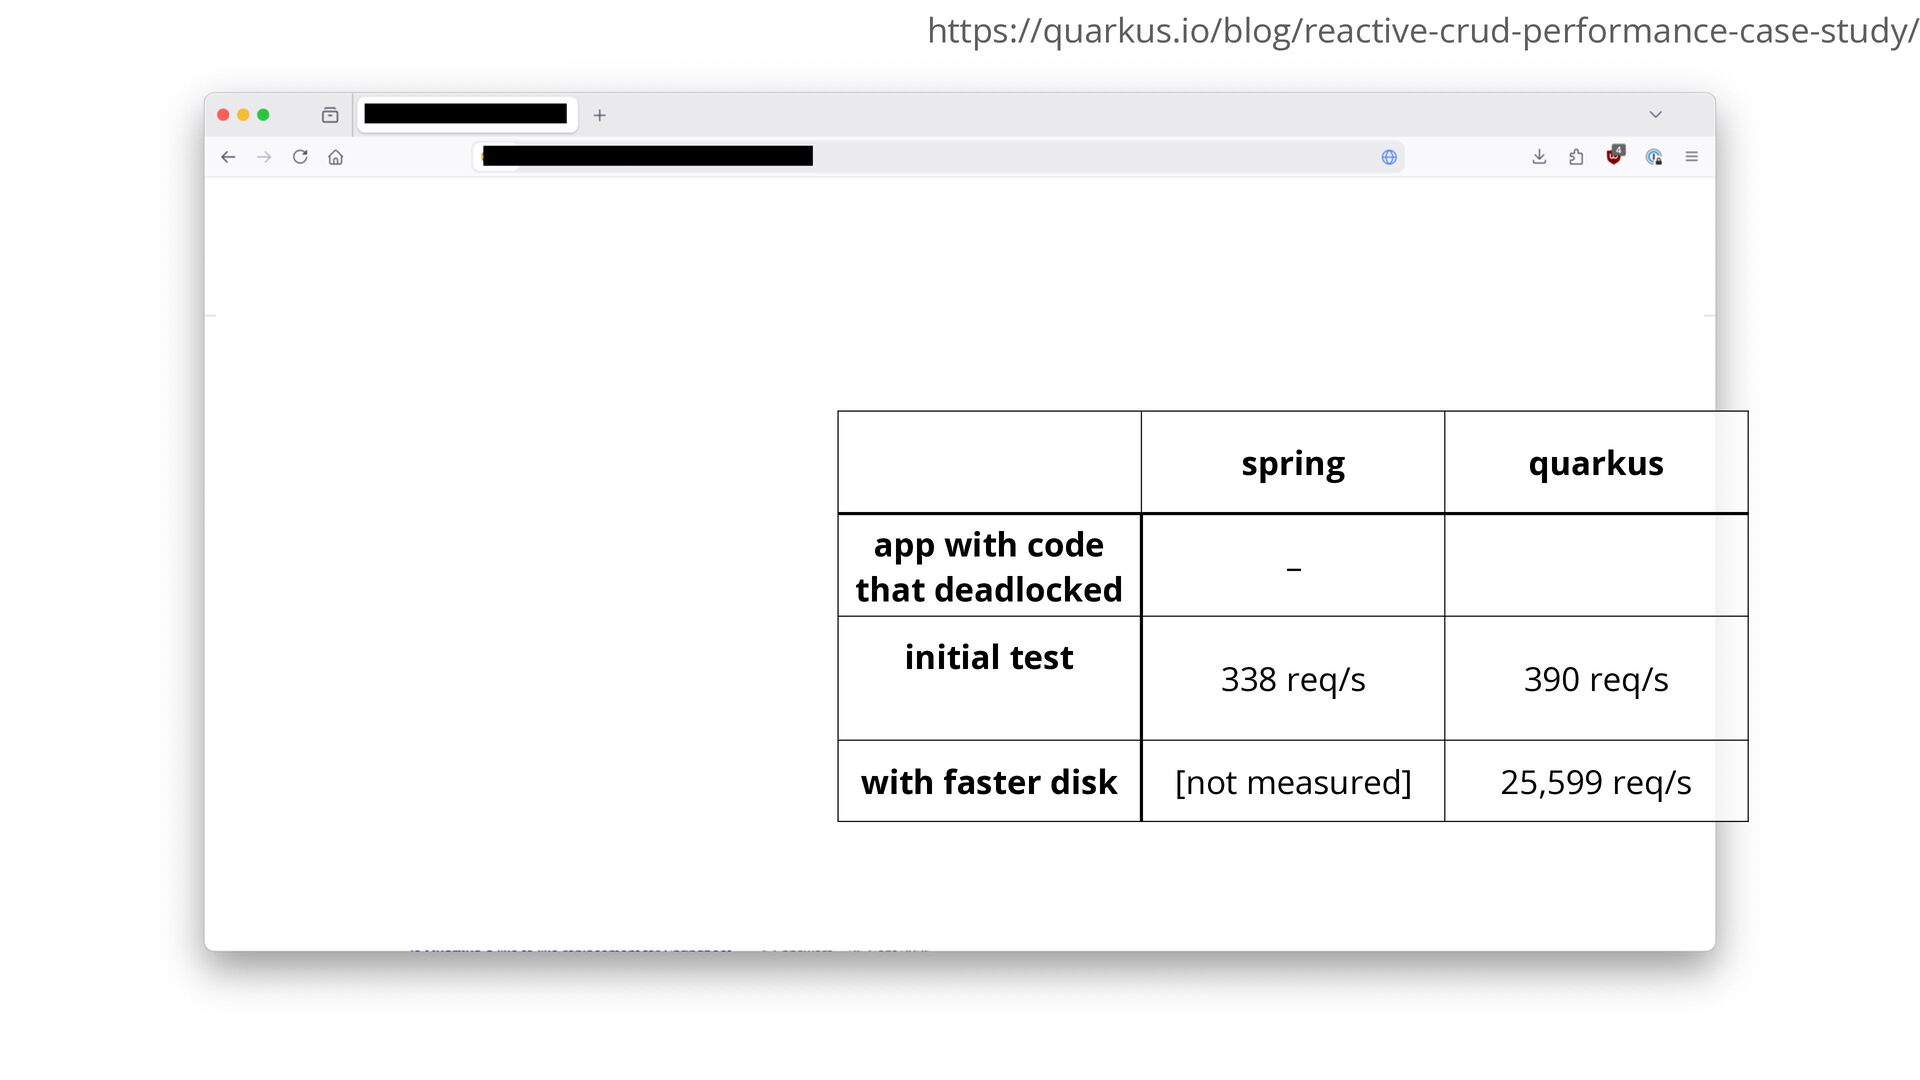
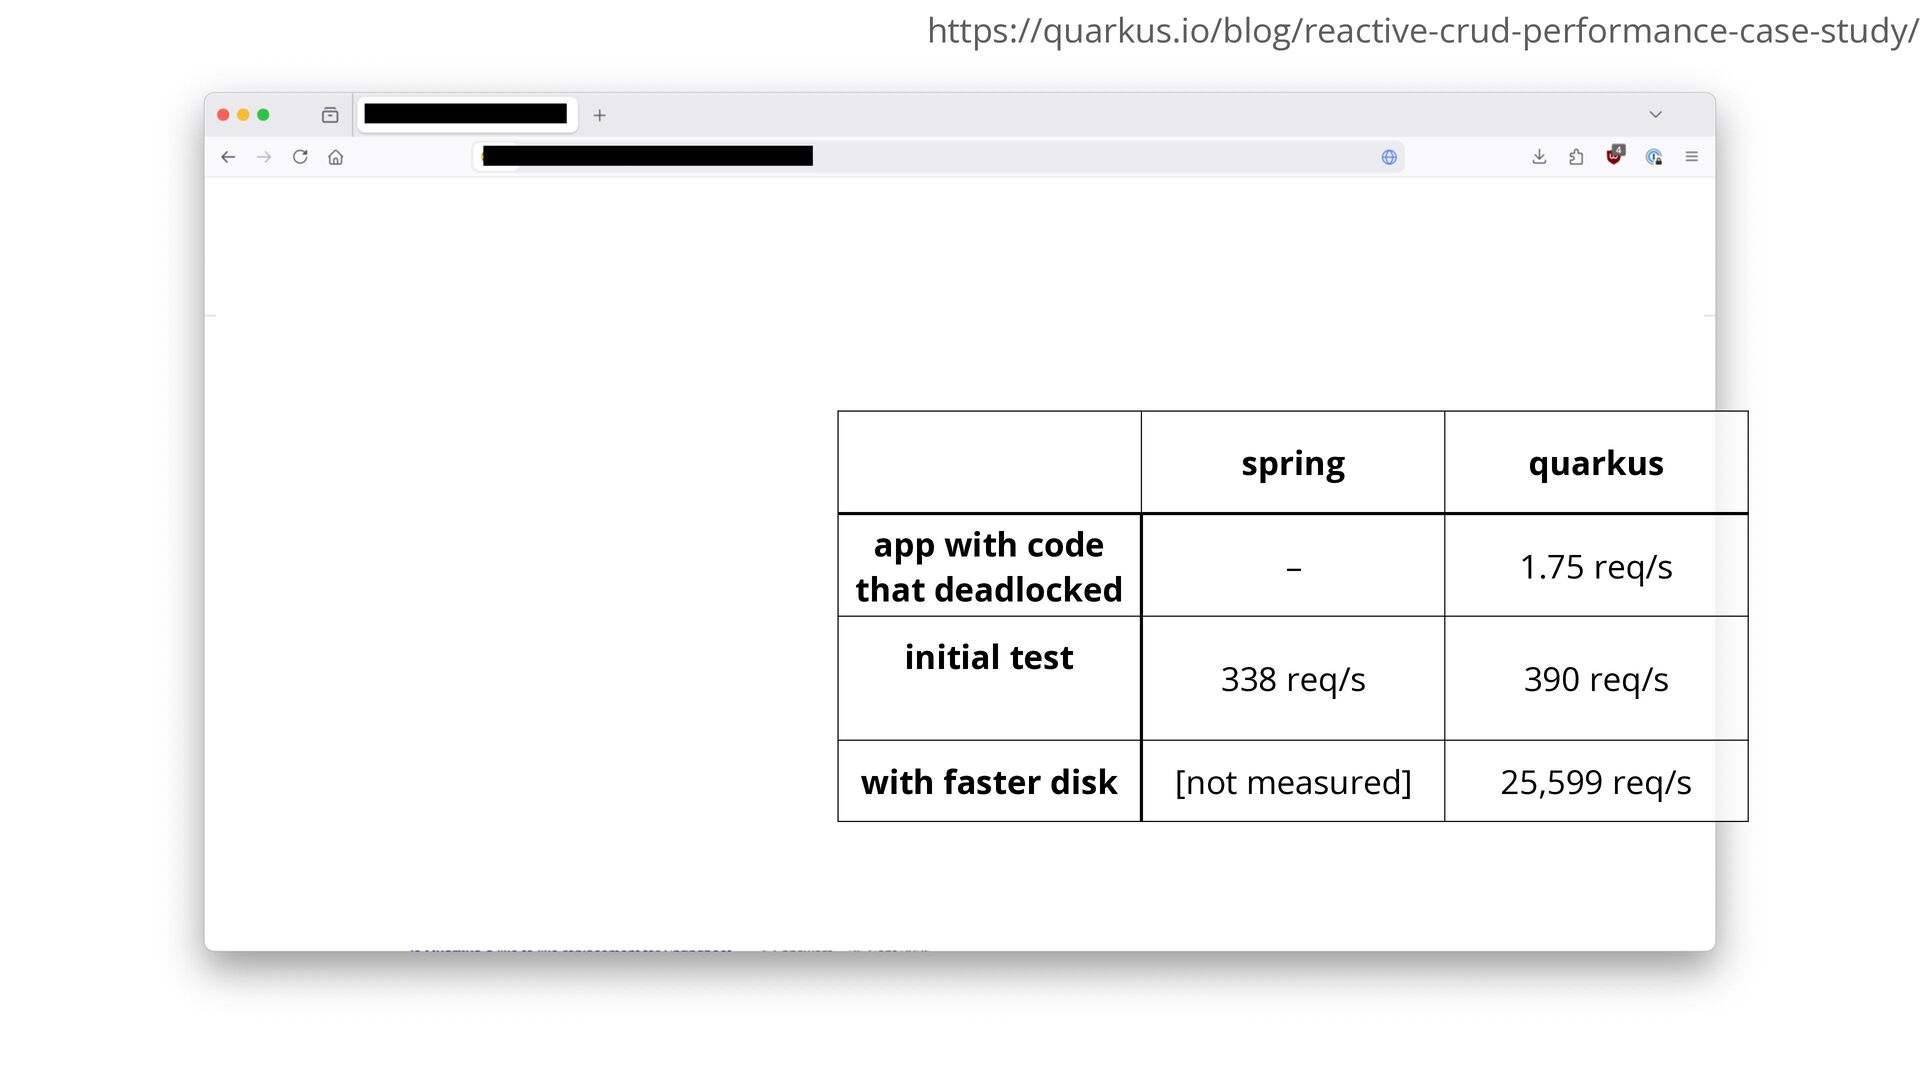
https://quarkus.io/blog/reactive-crud-performance-case-study/ spring quarkus app with code that deadlocked – 1.75
req/s initial test with correct code 338 req/s 390 req/s with faster disk [not measured] 25,599 req/s -
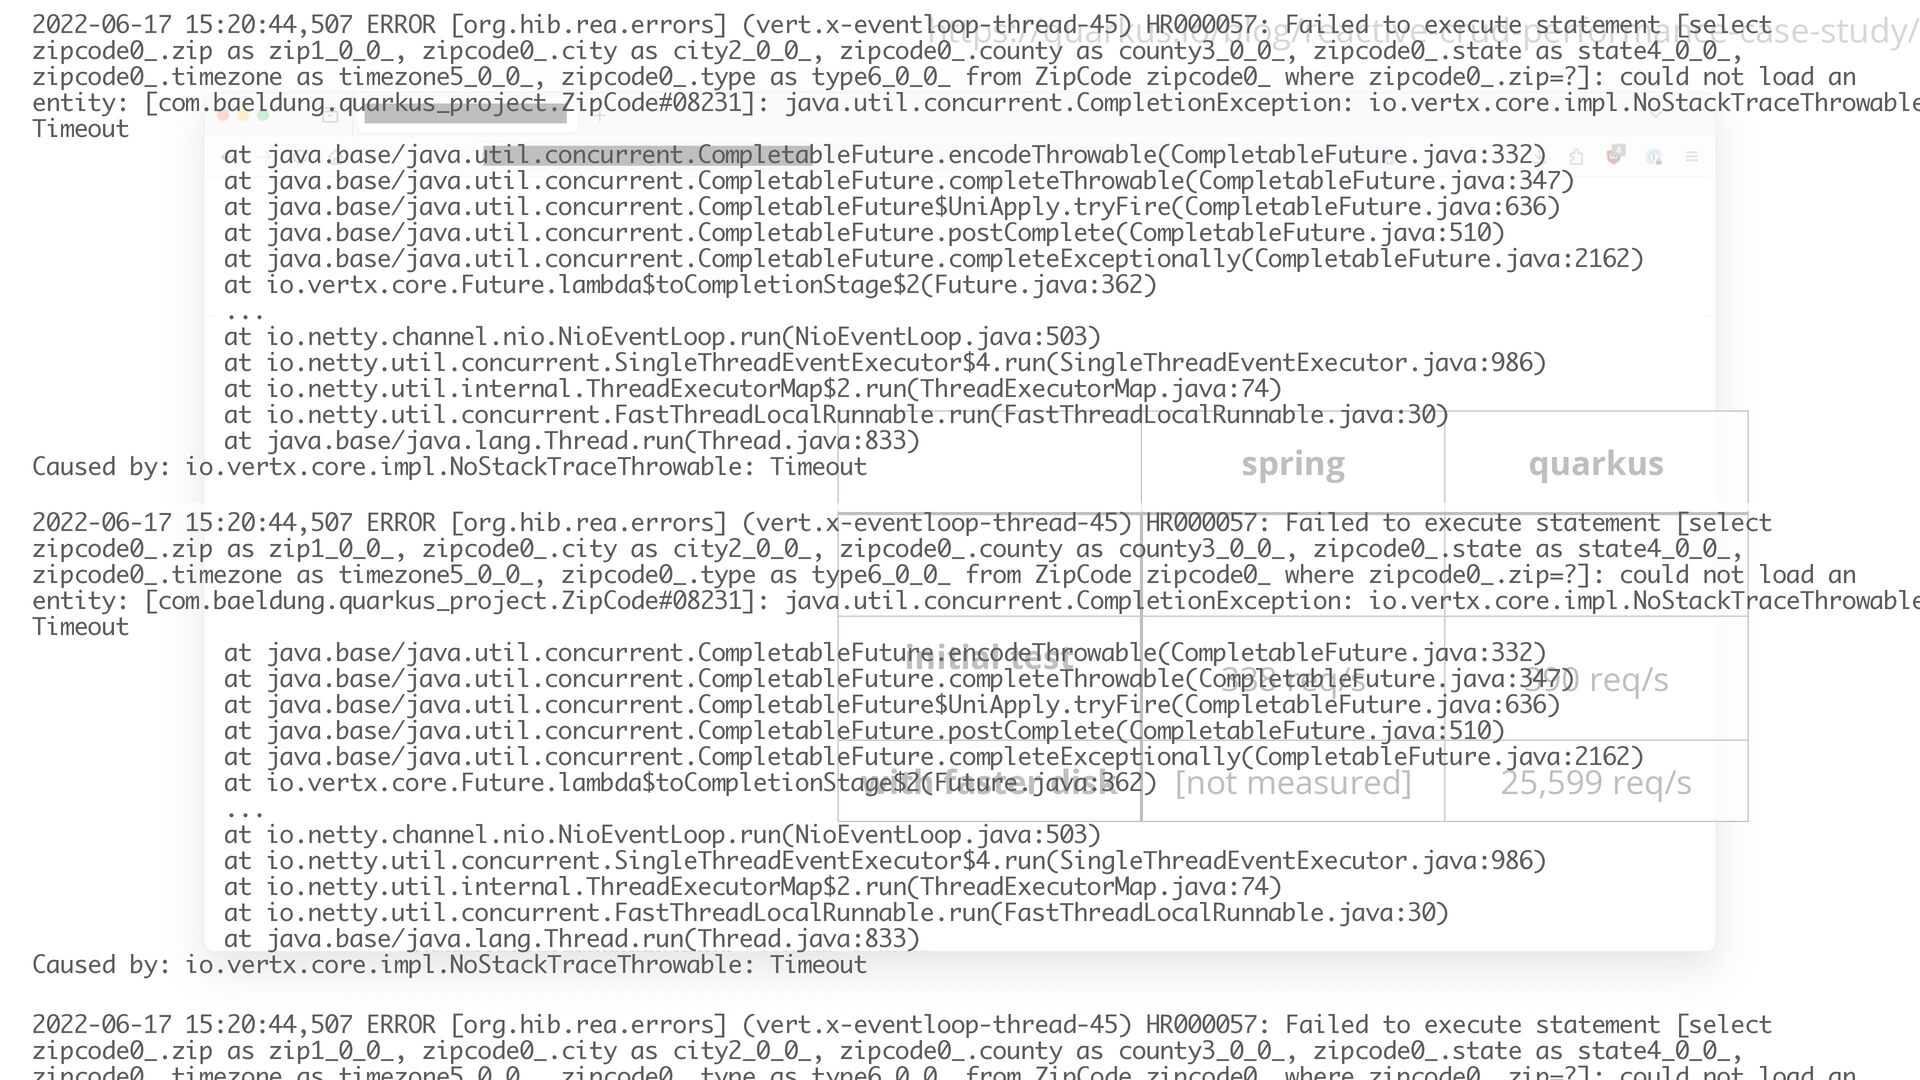
2022-06-17 15:20:44,507 ERROR [org.hib.rea.errors] (vert.x-eventloop-thread-45) HR000057: Failed to execute statement
[select https://quarkus.io/blog/reactive-crud-performance-case-study/ zipcode0_.zip as zip1_0_0_, zipcode0_.city as city2_0_0_, zipcode0_.county as county3_0_0_, zipcode0_.state as state4_0_0_, zipcode0_.timezone as timezone5_0_0_, zipcode0_.type as type6_0_0_ from ZipCode zipcode0_ where zipcode0_.zip=?]: could not load an entity: [com.baeldung.quarkus_project.ZipCode#08231]: java.util.concurrent.CompletionException: io.vertx.core.impl.NoStackTraceThrowable Timeout at java.base/java.util.concurrent.CompletableFuture.encodeThrowable(CompletableFuture.java:332) at java.base/java.util.concurrent.CompletableFuture.completeThrowable(CompletableFuture.java:347) at java.base/java.util.concurrent.CompletableFuture$UniApply.tryFire(CompletableFuture.java:636) at java.base/java.util.concurrent.CompletableFuture.postComplete(CompletableFuture.java:510) at java.base/java.util.concurrent.CompletableFuture.completeExceptionally(CompletableFuture.java:2162) at io.vertx.core.Future.lambda$toCompletionStage$2(Future.java:362) ... at io.netty.channel.nio.NioEventLoop.run(NioEventLoop.java:503) at io.netty.util.concurrent.SingleThreadEventExecutor$4.run(SingleThreadEventExecutor.java:986) at io.netty.util.internal.ThreadExecutorMap$2.run(ThreadExecutorMap.java:74) at io.netty.util.concurrent.FastThreadLocalRunnable.run(FastThreadLocalRunnable.java:30) at java.base/java.lang.Thread.run(Thread.java:833) spring quarkus Caused by: io.vertx.core.impl.NoStackTraceThrowable: Timeout 2022-06-17 15:20:44,507 ERROR [org.hib.rea.errors] (vert.x-eventloop-thread-45) HR000057: Failed to execute statement [select app with code zipcode0_.zip as zip1_0_0_, zipcode0_.city as city2_0_0_, zipcode0_.county as county3_0_0_, zipcode0_.state as state4_0_0_, – 1.75 req/s zipcode0_.timezone as timezone5_0_0_, zipcode0_.type as type6_0_0_ from ZipCode zipcode0_ where zipcode0_.zip=?]: could not load an that deadlocked entity: [com.baeldung.quarkus_project.ZipCode#08231]: java.util.concurrent.CompletionException: io.vertx.core.impl.NoStackTraceThrowable Timeout at java.base/java.util.concurrent.CompletableFuture.encodeThrowable(CompletableFuture.java:332) initial test at java.base/java.util.concurrent.CompletableFuture.completeThrowable(CompletableFuture.java:347) 338 req/s 390 req/s at java.base/java.util.concurrent.CompletableFuture$UniApply.tryFire(CompletableFuture.java:636) with correct code at java.base/java.util.concurrent.CompletableFuture.postComplete(CompletableFuture.java:510) at java.base/java.util.concurrent.CompletableFuture.completeExceptionally(CompletableFuture.java:2162) at io.vertx.core.Future.lambda$toCompletionStage$2(Future.java:362) with faster disk [not measured] 25,599 req/s ... at io.netty.channel.nio.NioEventLoop.run(NioEventLoop.java:503) at io.netty.util.concurrent.SingleThreadEventExecutor$4.run(SingleThreadEventExecutor.java:986) at io.netty.util.internal.ThreadExecutorMap$2.run(ThreadExecutorMap.java:74) at io.netty.util.concurrent.FastThreadLocalRunnable.run(FastThreadLocalRunnable.java:30) at java.base/java.lang.Thread.run(Thread.java:833) Caused by: io.vertx.core.impl.NoStackTraceThrowable: Timeout 2022-06-17 15:20:44,507 ERROR [org.hib.rea.errors] (vert.x-eventloop-thread-45) HR000057: Failed to execute statement [select zipcode0_.zip as zip1_0_0_, zipcode0_.city as city2_0_0_, zipcode0_.county as county3_0_0_, zipcode0_.state as state4_0_0_, -

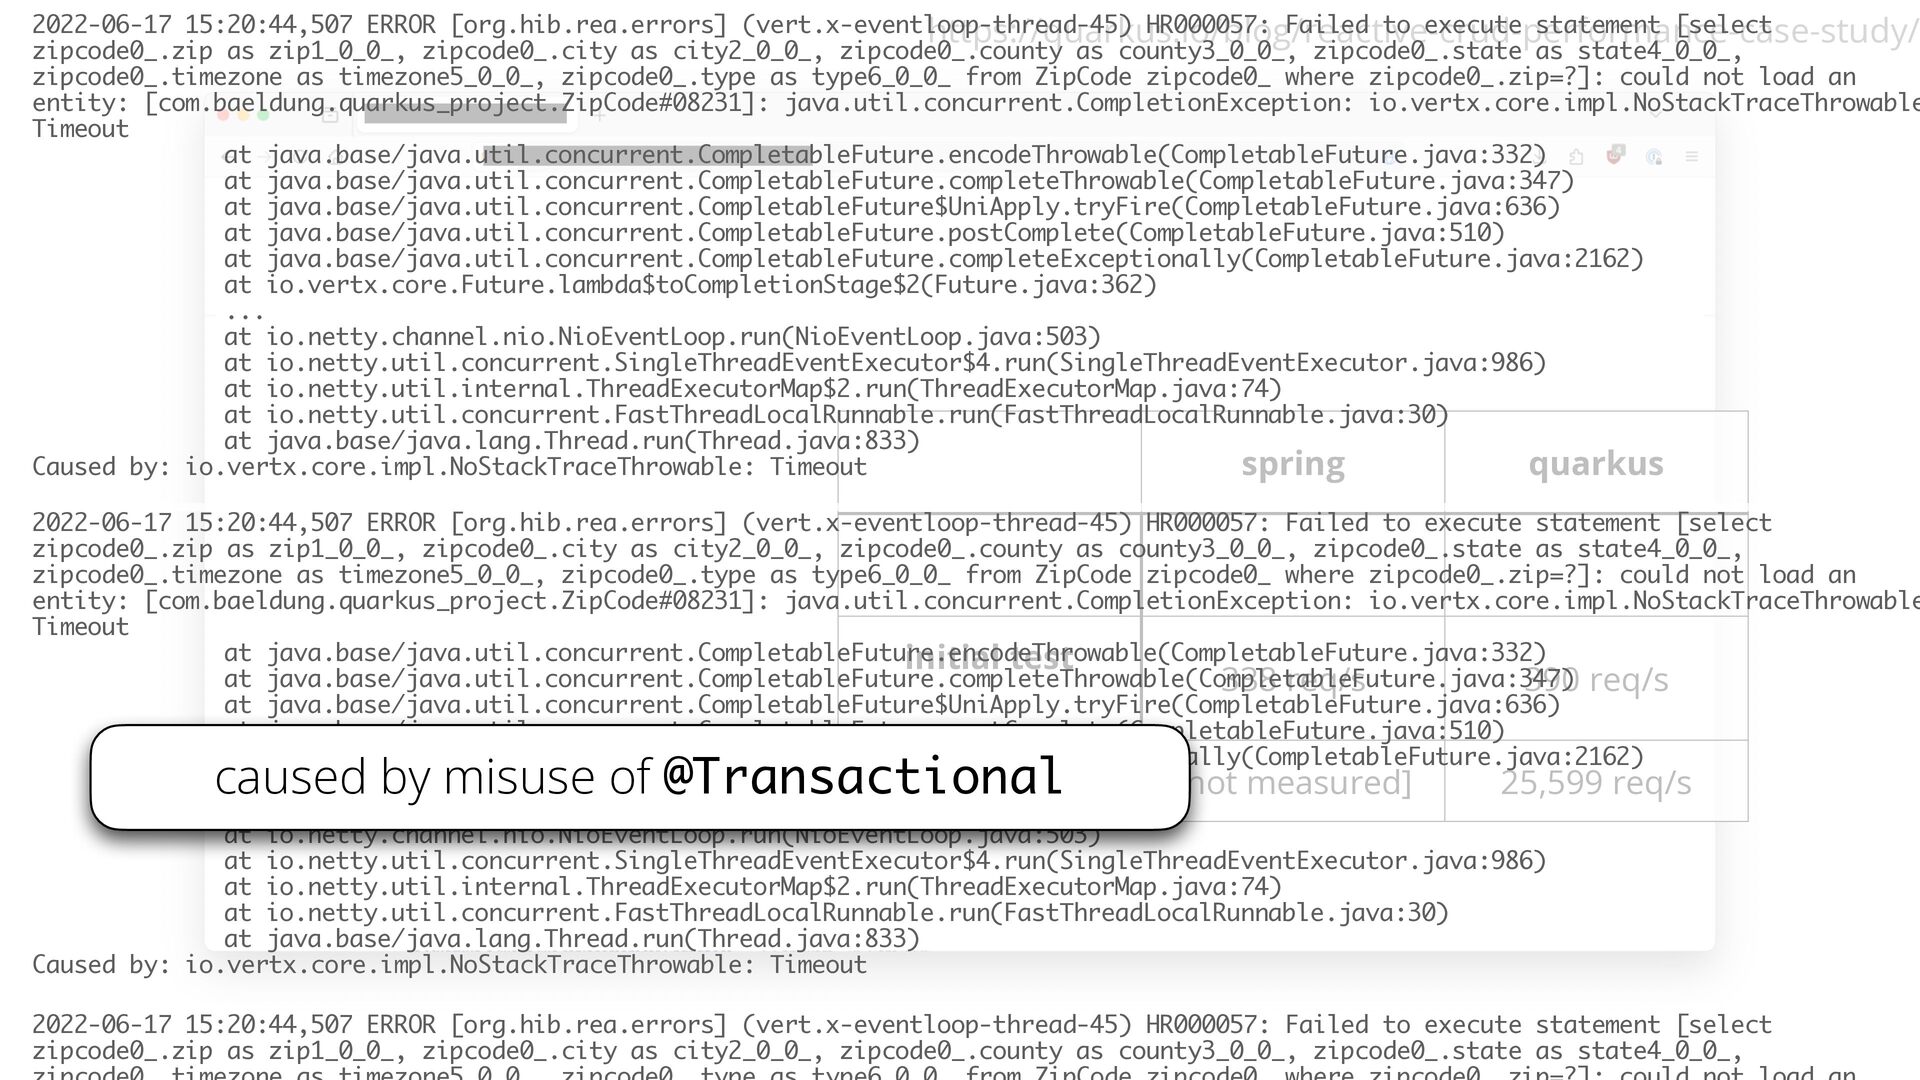
2022-06-17 15:20:44,507 ERROR [org.hib.rea.errors] (vert.x-eventloop-thread-45) HR000057: Failed to execute statement
[select https://quarkus.io/blog/reactive-crud-performance-case-study/ zipcode0_.zip as zip1_0_0_, zipcode0_.city as city2_0_0_, zipcode0_.county as county3_0_0_, zipcode0_.state as state4_0_0_, zipcode0_.timezone as timezone5_0_0_, zipcode0_.type as type6_0_0_ from ZipCode zipcode0_ where zipcode0_.zip=?]: could not load an entity: [com.baeldung.quarkus_project.ZipCode#08231]: java.util.concurrent.CompletionException: io.vertx.core.impl.NoStackTraceThrowable Timeout at java.base/java.util.concurrent.CompletableFuture.encodeThrowable(CompletableFuture.java:332) at java.base/java.util.concurrent.CompletableFuture.completeThrowable(CompletableFuture.java:347) at java.base/java.util.concurrent.CompletableFuture$UniApply.tryFire(CompletableFuture.java:636) at java.base/java.util.concurrent.CompletableFuture.postComplete(CompletableFuture.java:510) at java.base/java.util.concurrent.CompletableFuture.completeExceptionally(CompletableFuture.java:2162) at io.vertx.core.Future.lambda$toCompletionStage$2(Future.java:362) ... at io.netty.channel.nio.NioEventLoop.run(NioEventLoop.java:503) at io.netty.util.concurrent.SingleThreadEventExecutor$4.run(SingleThreadEventExecutor.java:986) at io.netty.util.internal.ThreadExecutorMap$2.run(ThreadExecutorMap.java:74) at io.netty.util.concurrent.FastThreadLocalRunnable.run(FastThreadLocalRunnable.java:30) at java.base/java.lang.Thread.run(Thread.java:833) spring quarkus Caused by: io.vertx.core.impl.NoStackTraceThrowable: Timeout 2022-06-17 15:20:44,507 ERROR [org.hib.rea.errors] (vert.x-eventloop-thread-45) HR000057: Failed to execute statement [select app with code zipcode0_.zip as zip1_0_0_, zipcode0_.city as city2_0_0_, zipcode0_.county as county3_0_0_, zipcode0_.state as state4_0_0_, – 1.75 req/s zipcode0_.timezone as timezone5_0_0_, zipcode0_.type as type6_0_0_ from ZipCode zipcode0_ where zipcode0_.zip=?]: could not load an that deadlocked entity: [com.baeldung.quarkus_project.ZipCode#08231]: java.util.concurrent.CompletionException: io.vertx.core.impl.NoStackTraceThrowable Timeout at java.base/java.util.concurrent.CompletableFuture.encodeThrowable(CompletableFuture.java:332) initial test at java.base/java.util.concurrent.CompletableFuture.completeThrowable(CompletableFuture.java:347) 338 req/s 390 req/s at java.base/java.util.concurrent.CompletableFuture$UniApply.tryFire(CompletableFuture.java:636) with correct code at java.base/java.util.concurrent.CompletableFuture.postComplete(CompletableFuture.java:510) at java.base/java.util.concurrent.CompletableFuture.completeExceptionally(CompletableFuture.java:2162) at io.vertx.core.Future.lambda$toCompletionStage$2(Future.java:362) with faster disk [not measured] 25,599 req/s ... at io.netty.channel.nio.NioEventLoop.run(NioEventLoop.java:503) at io.netty.util.concurrent.SingleThreadEventExecutor$4.run(SingleThreadEventExecutor.java:986) at io.netty.util.internal.ThreadExecutorMap$2.run(ThreadExecutorMap.java:74) at io.netty.util.concurrent.FastThreadLocalRunnable.run(FastThreadLocalRunnable.java:30) at java.base/java.lang.Thread.run(Thread.java:833) Caused by: io.vertx.core.impl.NoStackTraceThrowable: Timeout caused by misuse of @Transactional 2022-06-17 15:20:44,507 ERROR [org.hib.rea.errors] (vert.x-eventloop-thread-45) HR000057: Failed to execute statement [select zipcode0_.zip as zip1_0_0_, zipcode0_.city as city2_0_0_, zipcode0_.county as county3_0_0_, zipcode0_.state as state4_0_0_, -


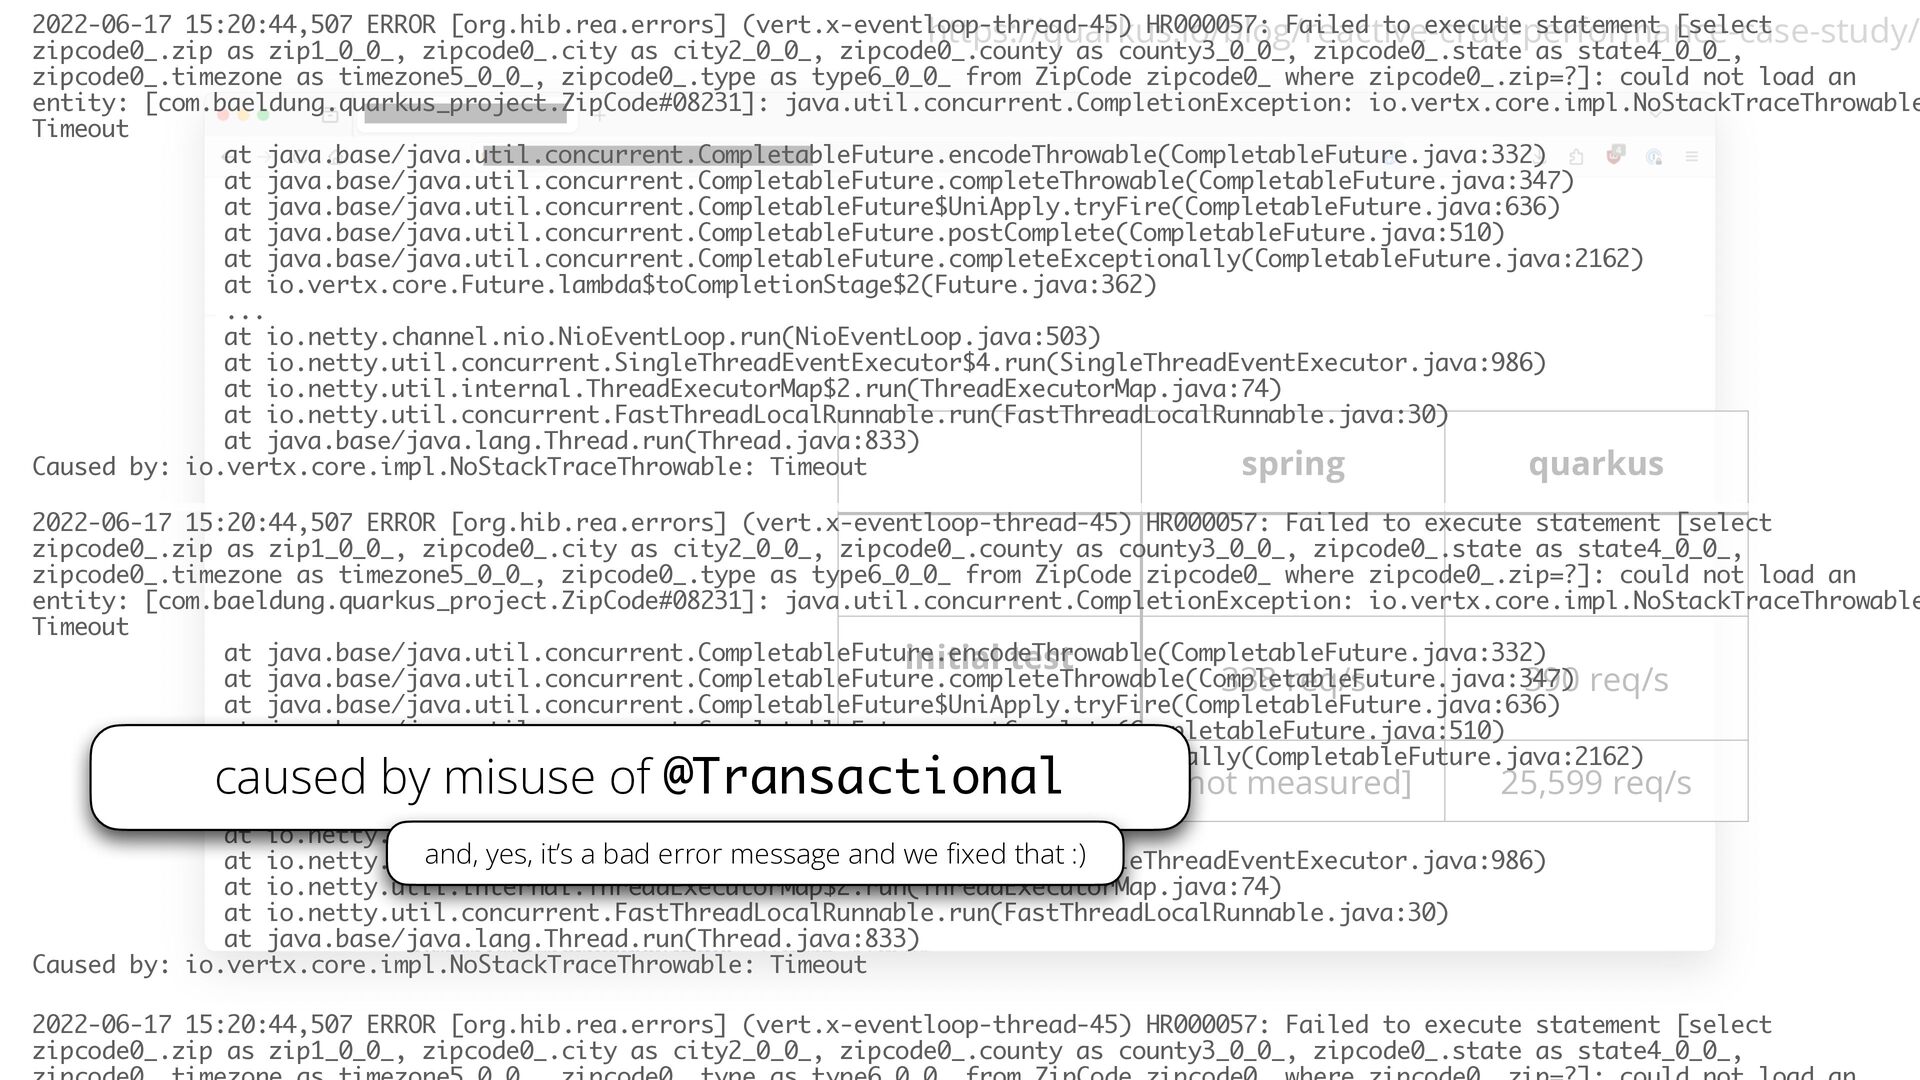
2022-06-17 15:20:44,507 ERROR [org.hib.rea.errors] (vert.x-eventloop-thread-45) HR000057: Failed to execute statement
[select https://quarkus.io/blog/reactive-crud-performance-case-study/ zipcode0_.zip as zip1_0_0_, zipcode0_.city as city2_0_0_, zipcode0_.county as county3_0_0_, zipcode0_.state as state4_0_0_, zipcode0_.timezone as timezone5_0_0_, zipcode0_.type as type6_0_0_ from ZipCode zipcode0_ where zipcode0_.zip=?]: could not load an entity: [com.baeldung.quarkus_project.ZipCode#08231]: java.util.concurrent.CompletionException: io.vertx.core.impl.NoStackTraceThrowable Timeout at java.base/java.util.concurrent.CompletableFuture.encodeThrowable(CompletableFuture.java:332) at java.base/java.util.concurrent.CompletableFuture.completeThrowable(CompletableFuture.java:347) at java.base/java.util.concurrent.CompletableFuture$UniApply.tryFire(CompletableFuture.java:636) at java.base/java.util.concurrent.CompletableFuture.postComplete(CompletableFuture.java:510) at java.base/java.util.concurrent.CompletableFuture.completeExceptionally(CompletableFuture.java:2162) at io.vertx.core.Future.lambda$toCompletionStage$2(Future.java:362) ... at io.netty.channel.nio.NioEventLoop.run(NioEventLoop.java:503) at io.netty.util.concurrent.SingleThreadEventExecutor$4.run(SingleThreadEventExecutor.java:986) at io.netty.util.internal.ThreadExecutorMap$2.run(ThreadExecutorMap.java:74) at io.netty.util.concurrent.FastThreadLocalRunnable.run(FastThreadLocalRunnable.java:30) at java.base/java.lang.Thread.run(Thread.java:833) spring quarkus Caused by: io.vertx.core.impl.NoStackTraceThrowable: Timeout 2022-06-17 15:20:44,507 ERROR [org.hib.rea.errors] (vert.x-eventloop-thread-45) HR000057: Failed to execute statement [select app with code zipcode0_.zip as zip1_0_0_, zipcode0_.city as city2_0_0_, zipcode0_.county as county3_0_0_, zipcode0_.state as state4_0_0_, – 1.75 req/s zipcode0_.timezone as timezone5_0_0_, zipcode0_.type as type6_0_0_ from ZipCode zipcode0_ where zipcode0_.zip=?]: could not load an that deadlocked entity: [com.baeldung.quarkus_project.ZipCode#08231]: java.util.concurrent.CompletionException: io.vertx.core.impl.NoStackTraceThrowable Timeout at java.base/java.util.concurrent.CompletableFuture.encodeThrowable(CompletableFuture.java:332) initial test at java.base/java.util.concurrent.CompletableFuture.completeThrowable(CompletableFuture.java:347) 338 req/s 390 req/s at java.base/java.util.concurrent.CompletableFuture$UniApply.tryFire(CompletableFuture.java:636) with correct code at java.base/java.util.concurrent.CompletableFuture.postComplete(CompletableFuture.java:510) at java.base/java.util.concurrent.CompletableFuture.completeExceptionally(CompletableFuture.java:2162) at io.vertx.core.Future.lambda$toCompletionStage$2(Future.java:362) with faster disk [not measured] 25,599 req/s ... at io.netty.channel.nio.NioEventLoop.run(NioEventLoop.java:503) and, yes, it’s a bad error message and we xed that :) at io.netty.util.concurrent.SingleThreadEventExecutor$4.run(SingleThreadEventExecutor.java:986) at io.netty.util.internal.ThreadExecutorMap$2.run(ThreadExecutorMap.java:74) at io.netty.util.concurrent.FastThreadLocalRunnable.run(FastThreadLocalRunnable.java:30) at java.base/java.lang.Thread.run(Thread.java:833) Caused by: io.vertx.core.impl.NoStackTraceThrowable: Timeout caused by misuse of @Transactional fi 2022-06-17 15:20:44,507 ERROR [org.hib.rea.errors] (vert.x-eventloop-thread-45) HR000057: Failed to execute statement [select zipcode0_.zip as zip1_0_0_, zipcode0_.city as city2_0_0_, zipcode0_.county as county3_0_0_, zipcode0_.state as state4_0_0_, -
https://quarkus.io/blog/reactive-crud-performance-case-study/ spring quarkus app with code that deadlocked – 1.75
req/s initial test with correct code 338 req/s 390 req/s with faster disk [not measured] 25,599 req/s -
https://quarkus.io/blog/reactive-crud-performance-case-study/ spring quarkus app with code that deadlocked – 1.75
req/s initial test with correct code 338 req/s 390 req/s with faster disk [not measured] 25,599 req/s -
https://quarkus.io/blog/reactive-crud-performance-case-study/ spring quarkus app with code that deadlocked – 1.75
req/s initial test with correct code 338 req/s 390 req/s with faster disk [not measured] 25,599 req/s -
https://quarkus.io/blog/reactive-crud-performance-case-study/ spring quarkus app with code that deadlocked – 1.75
req/s initial test with correct code 338 req/s 390 req/s with faster disk [not measured] 25,599 req/s -
https://quarkus.io/blog/reactive-crud-performance-case-study/ spring quarkus app with code that deadlocked – 1.75
req/s initial test with correct code 338 req/s 390 req/s with faster disk [not measured] 25,599 req/s -
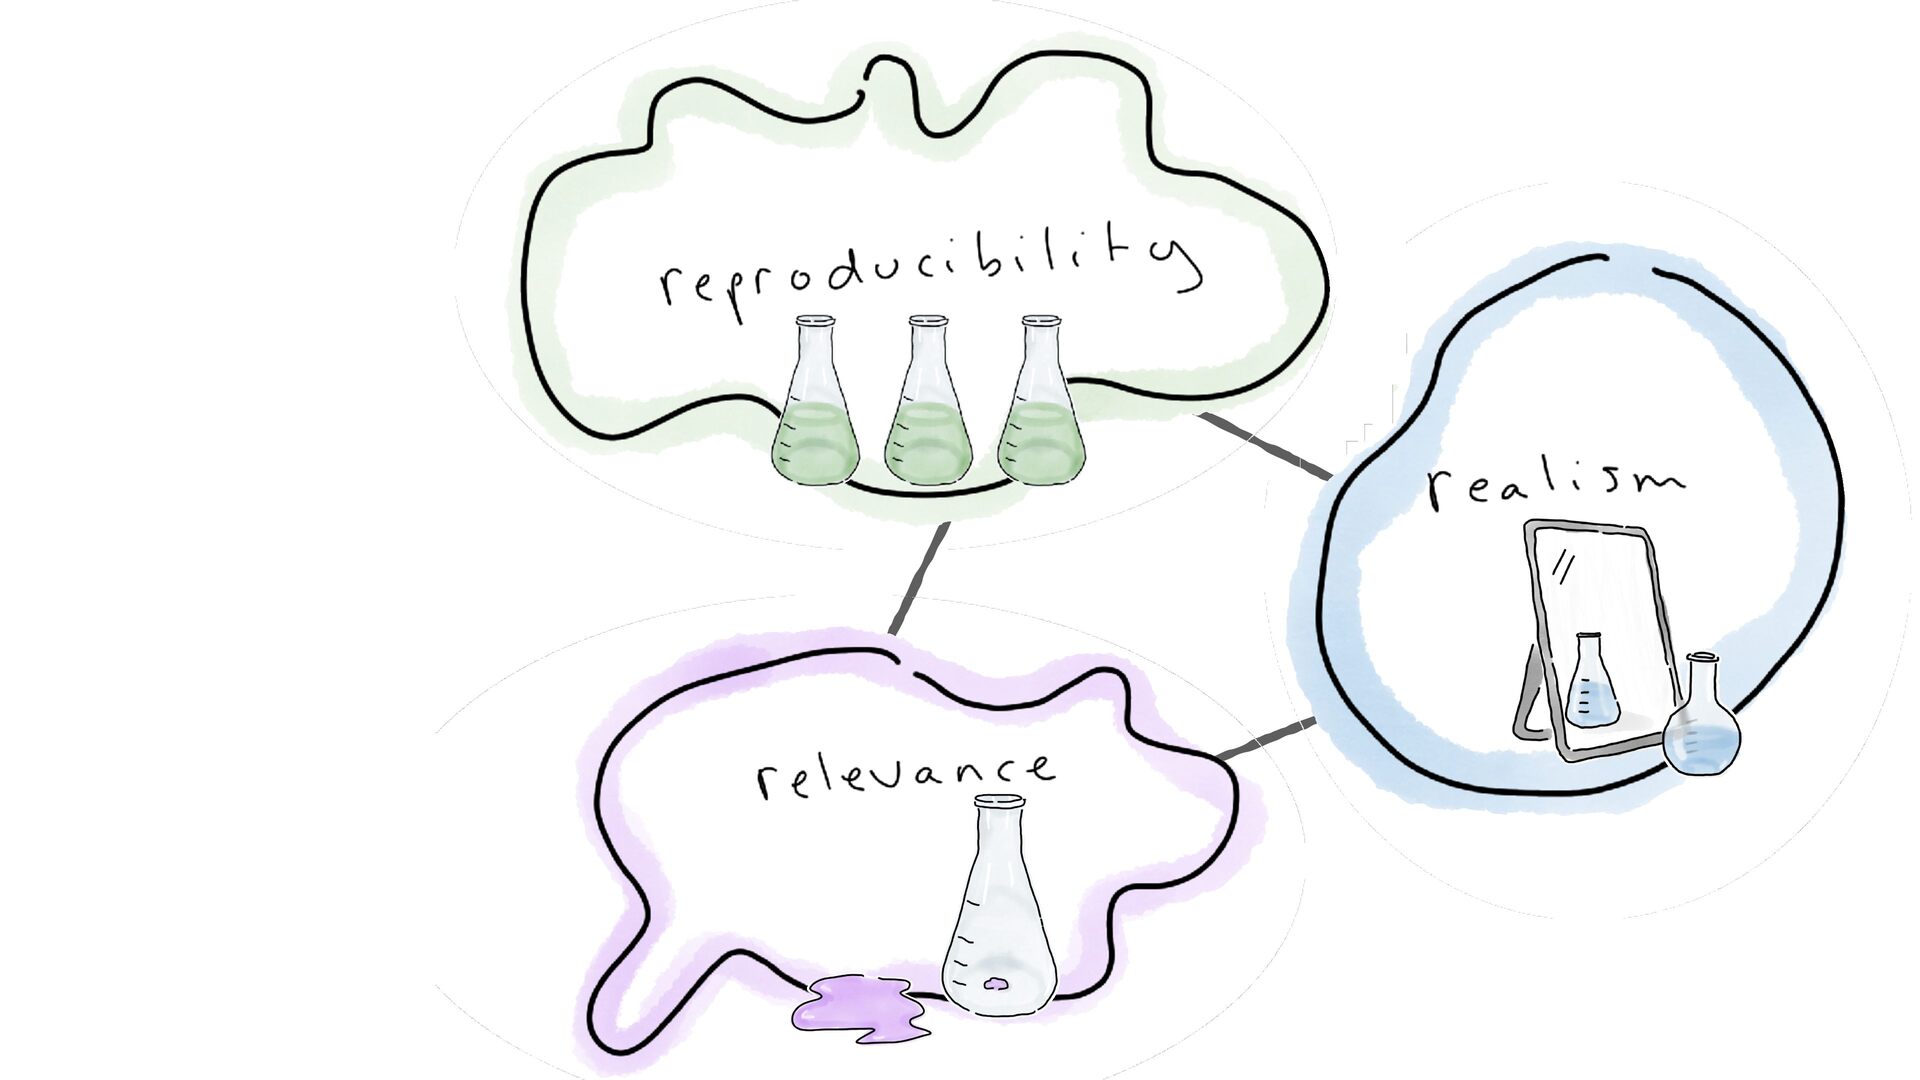
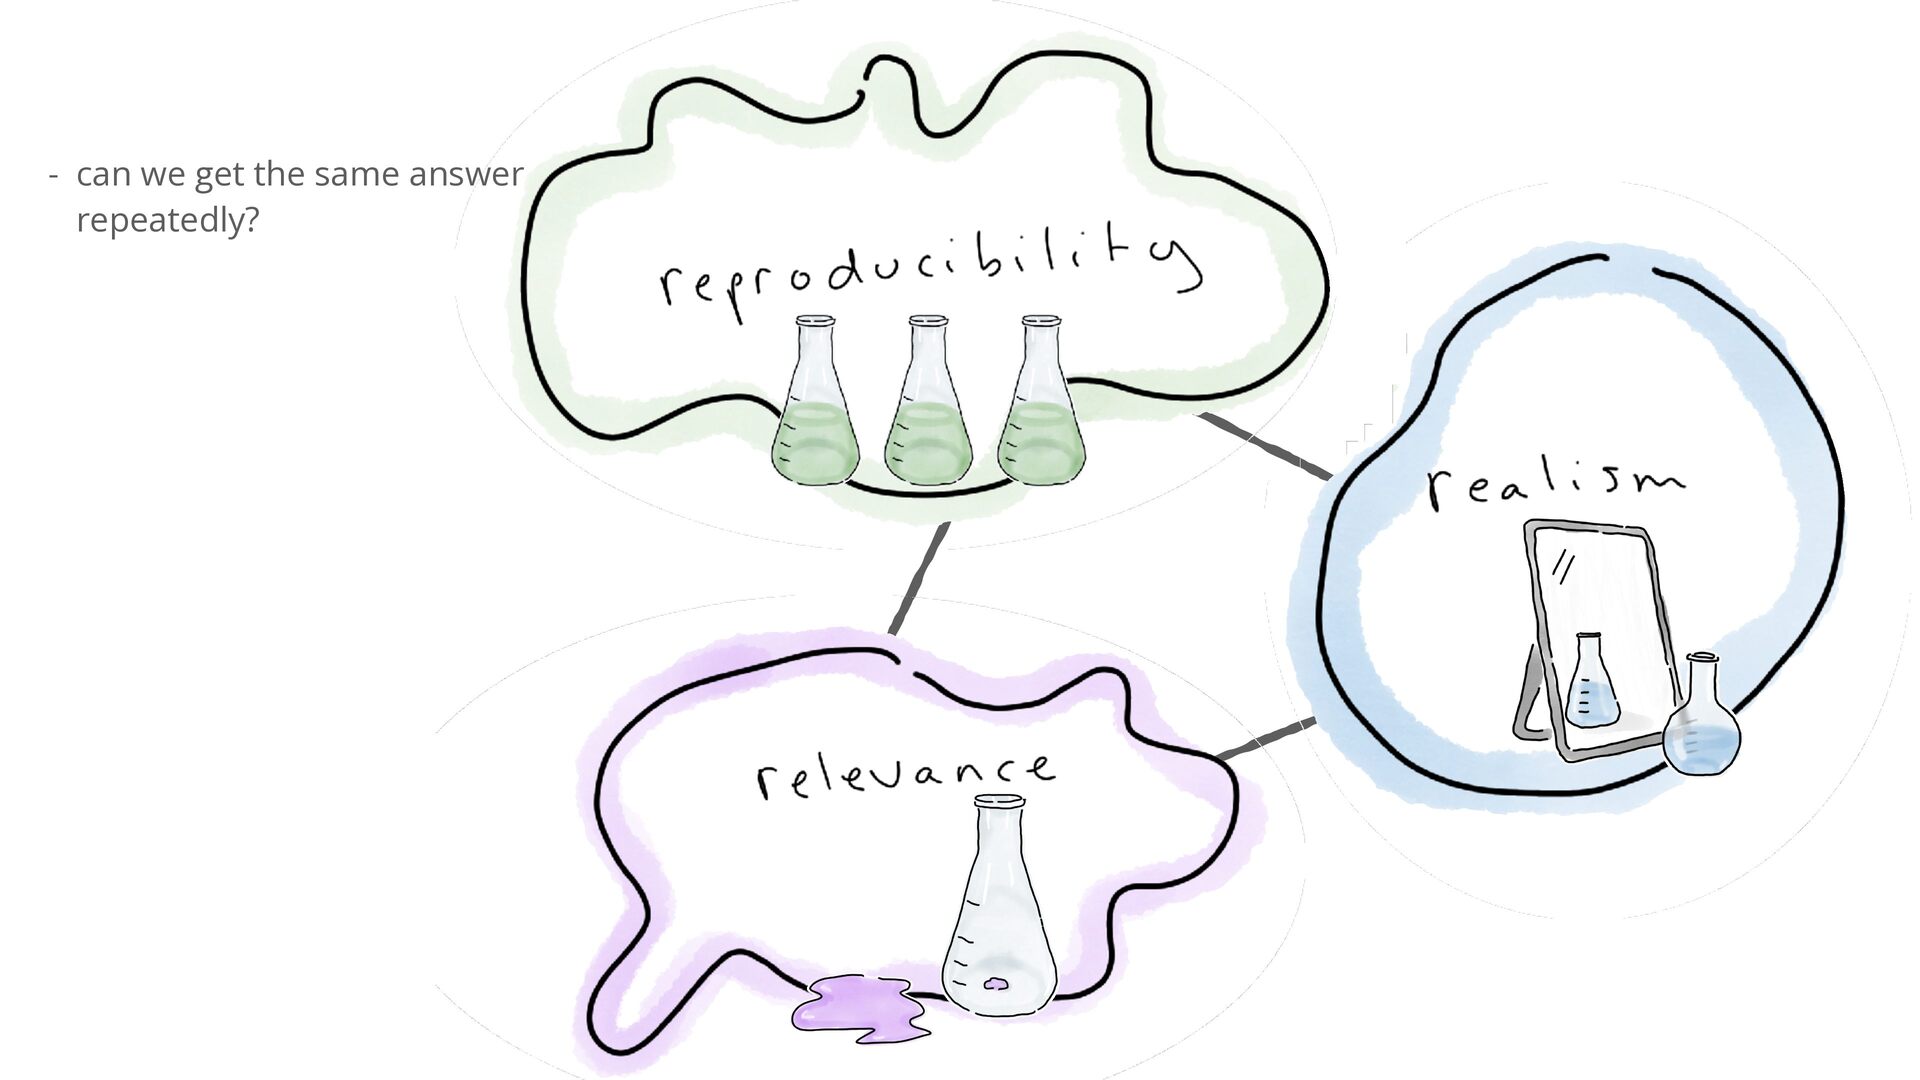
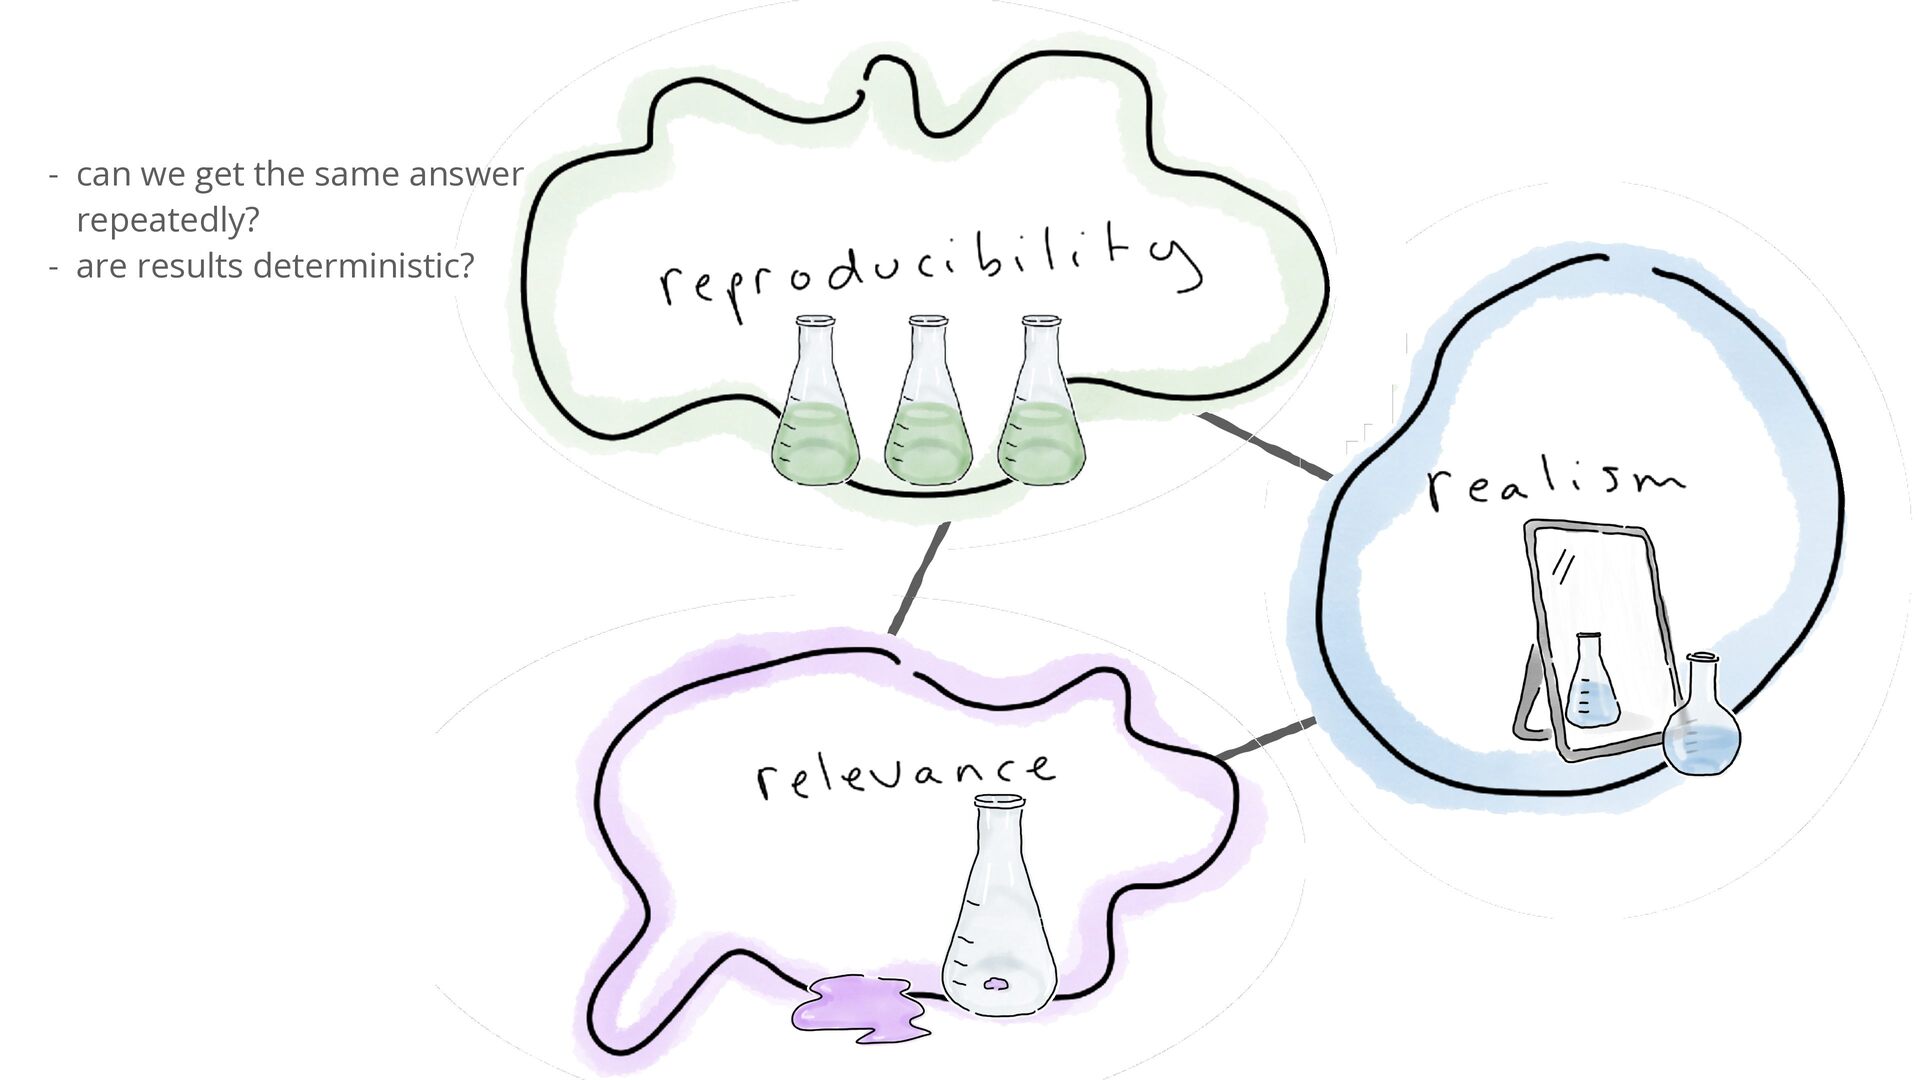
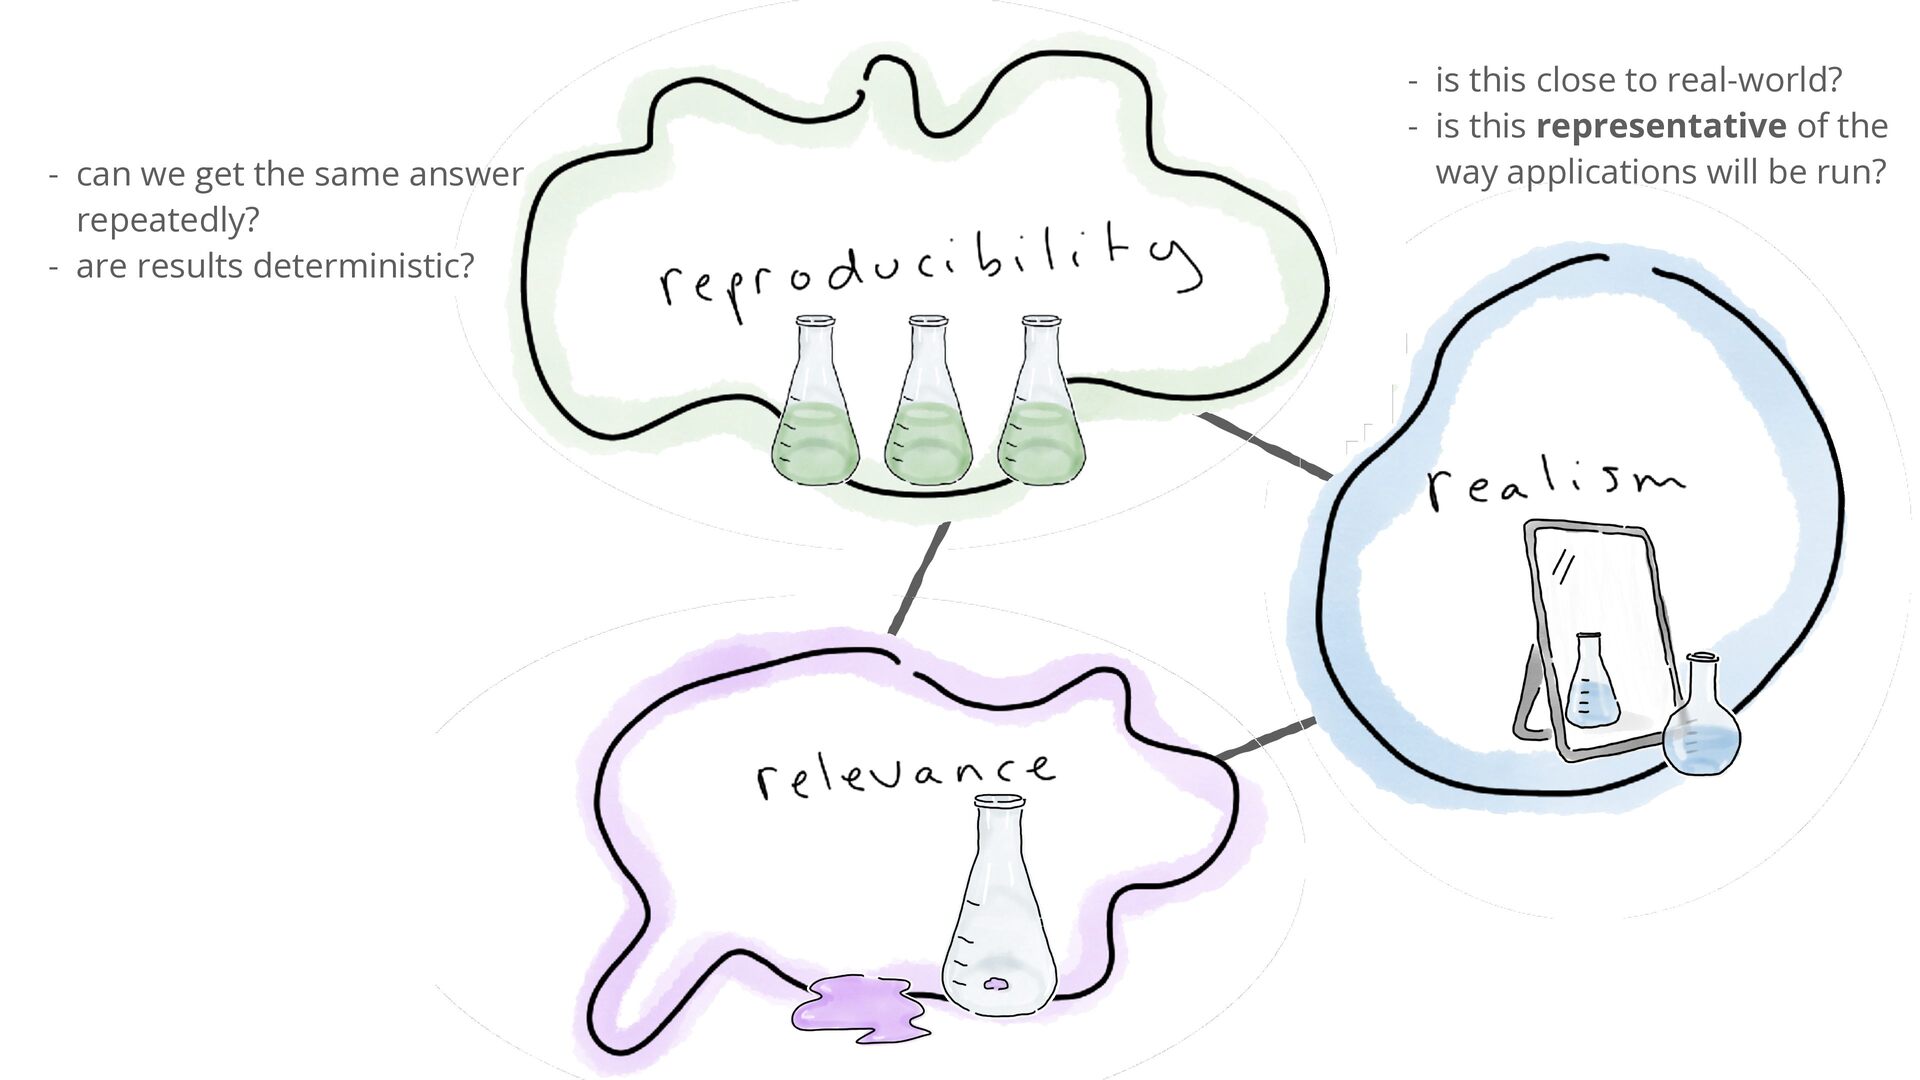
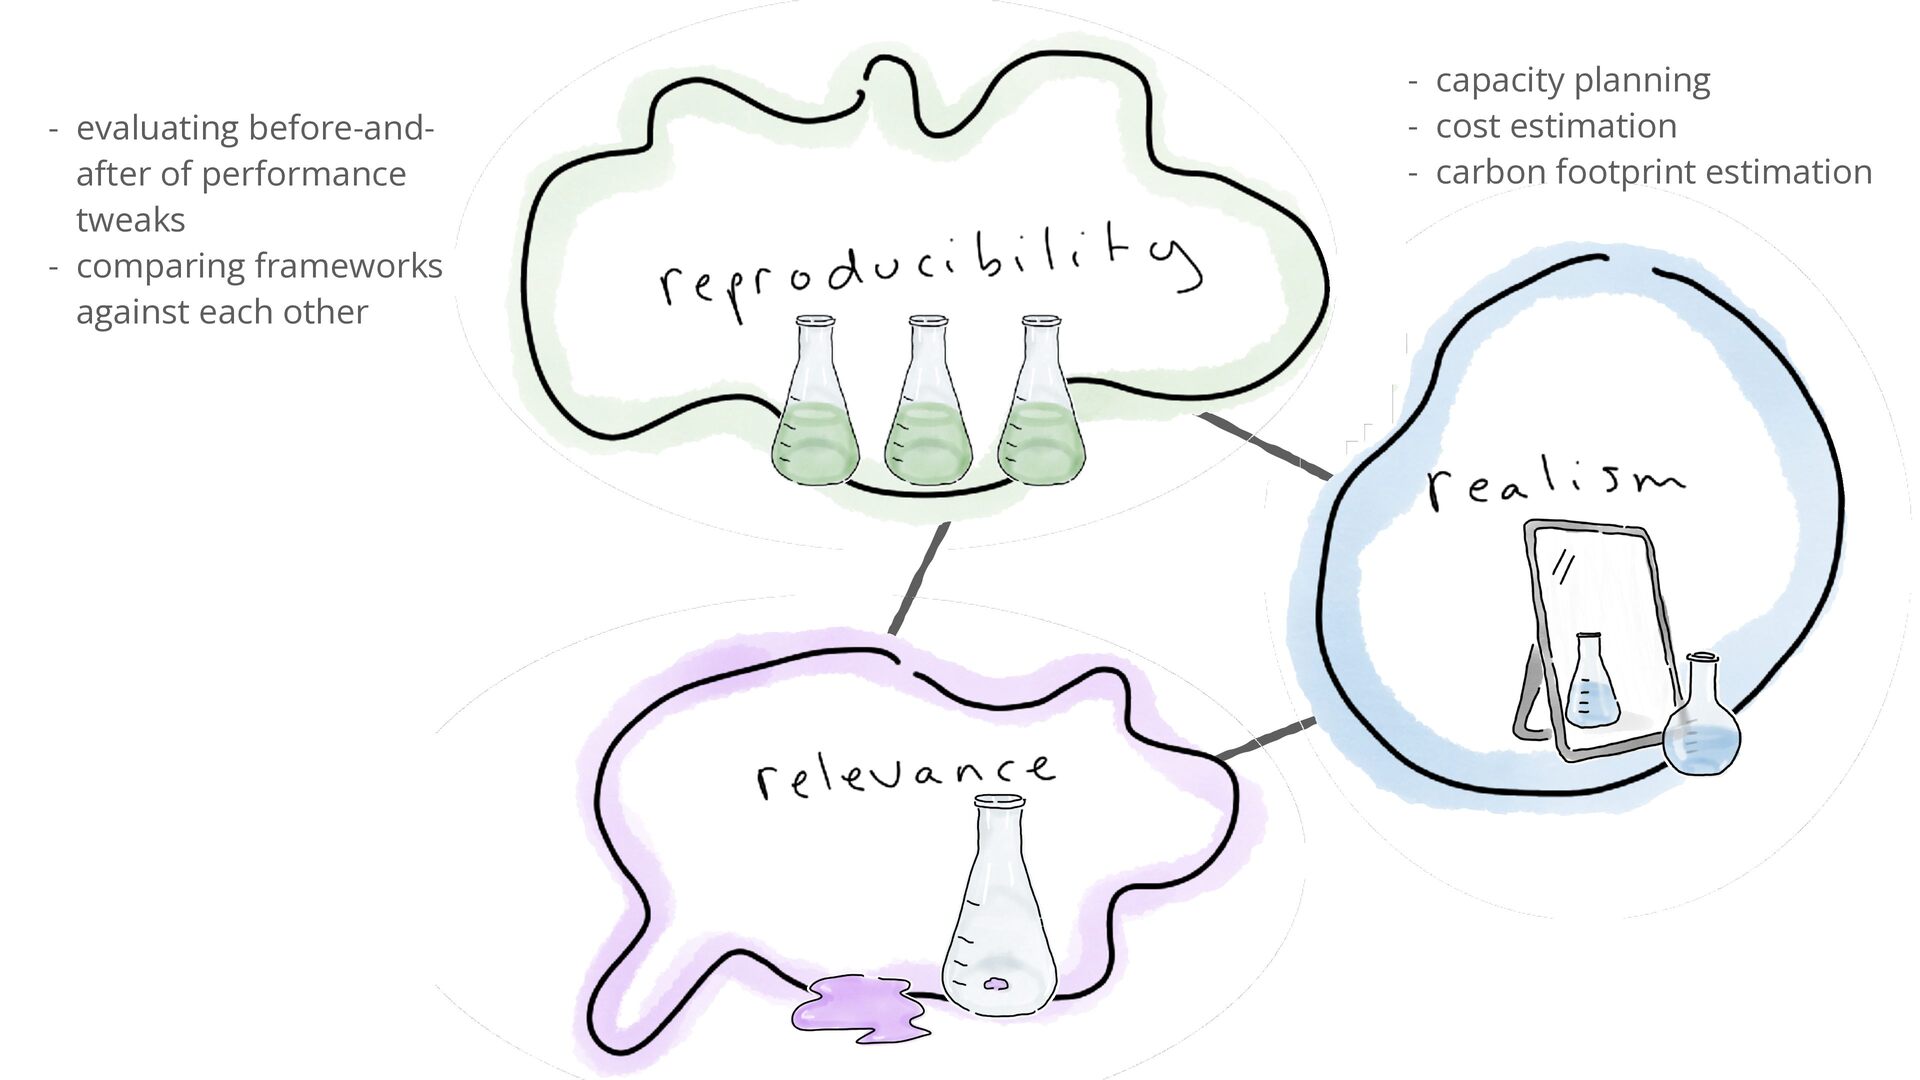
- can we get the same answer repeatedly? - are
results deterministic? -
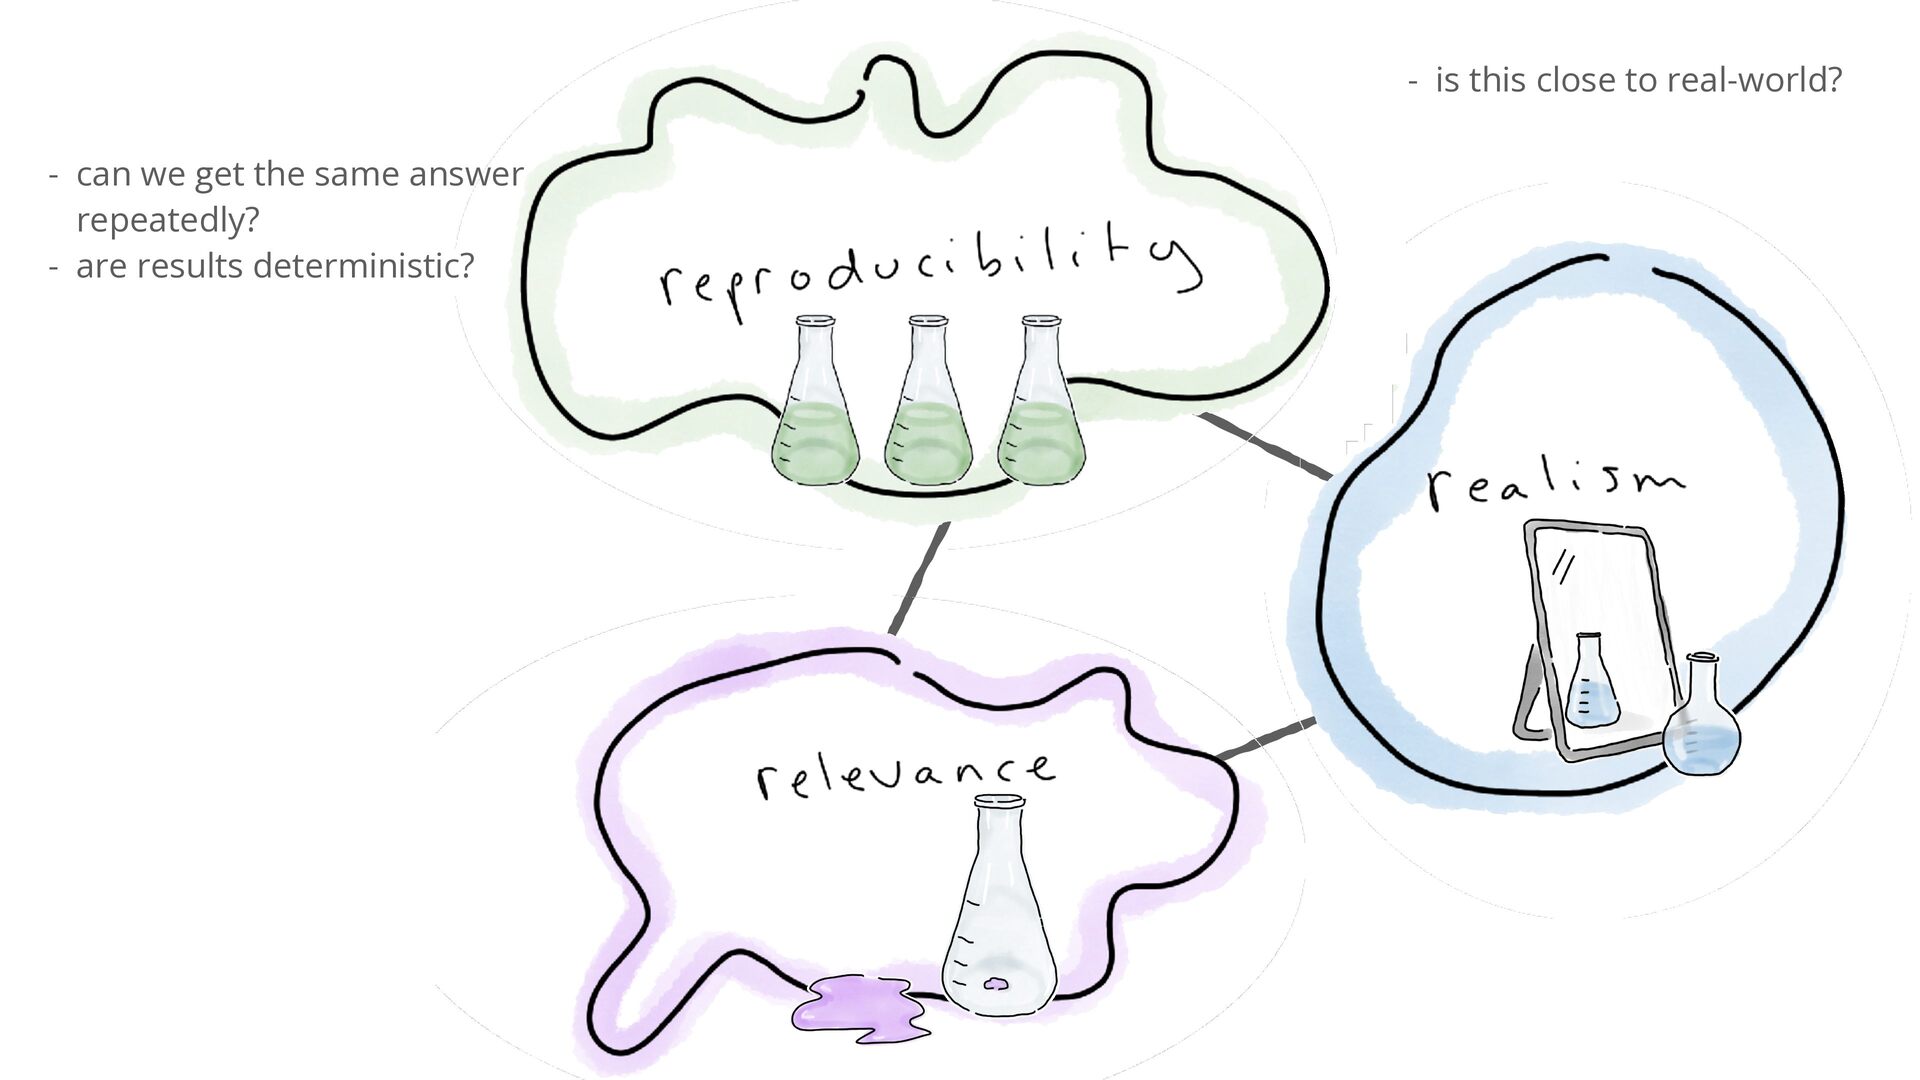
- is this close to real-world? - can we get
the same answer repeatedly? - are results deterministic? -
- can we get the same answer repeatedly? - are
results deterministic? - is this close to real-world? - is this representative of the way applications will be run? -
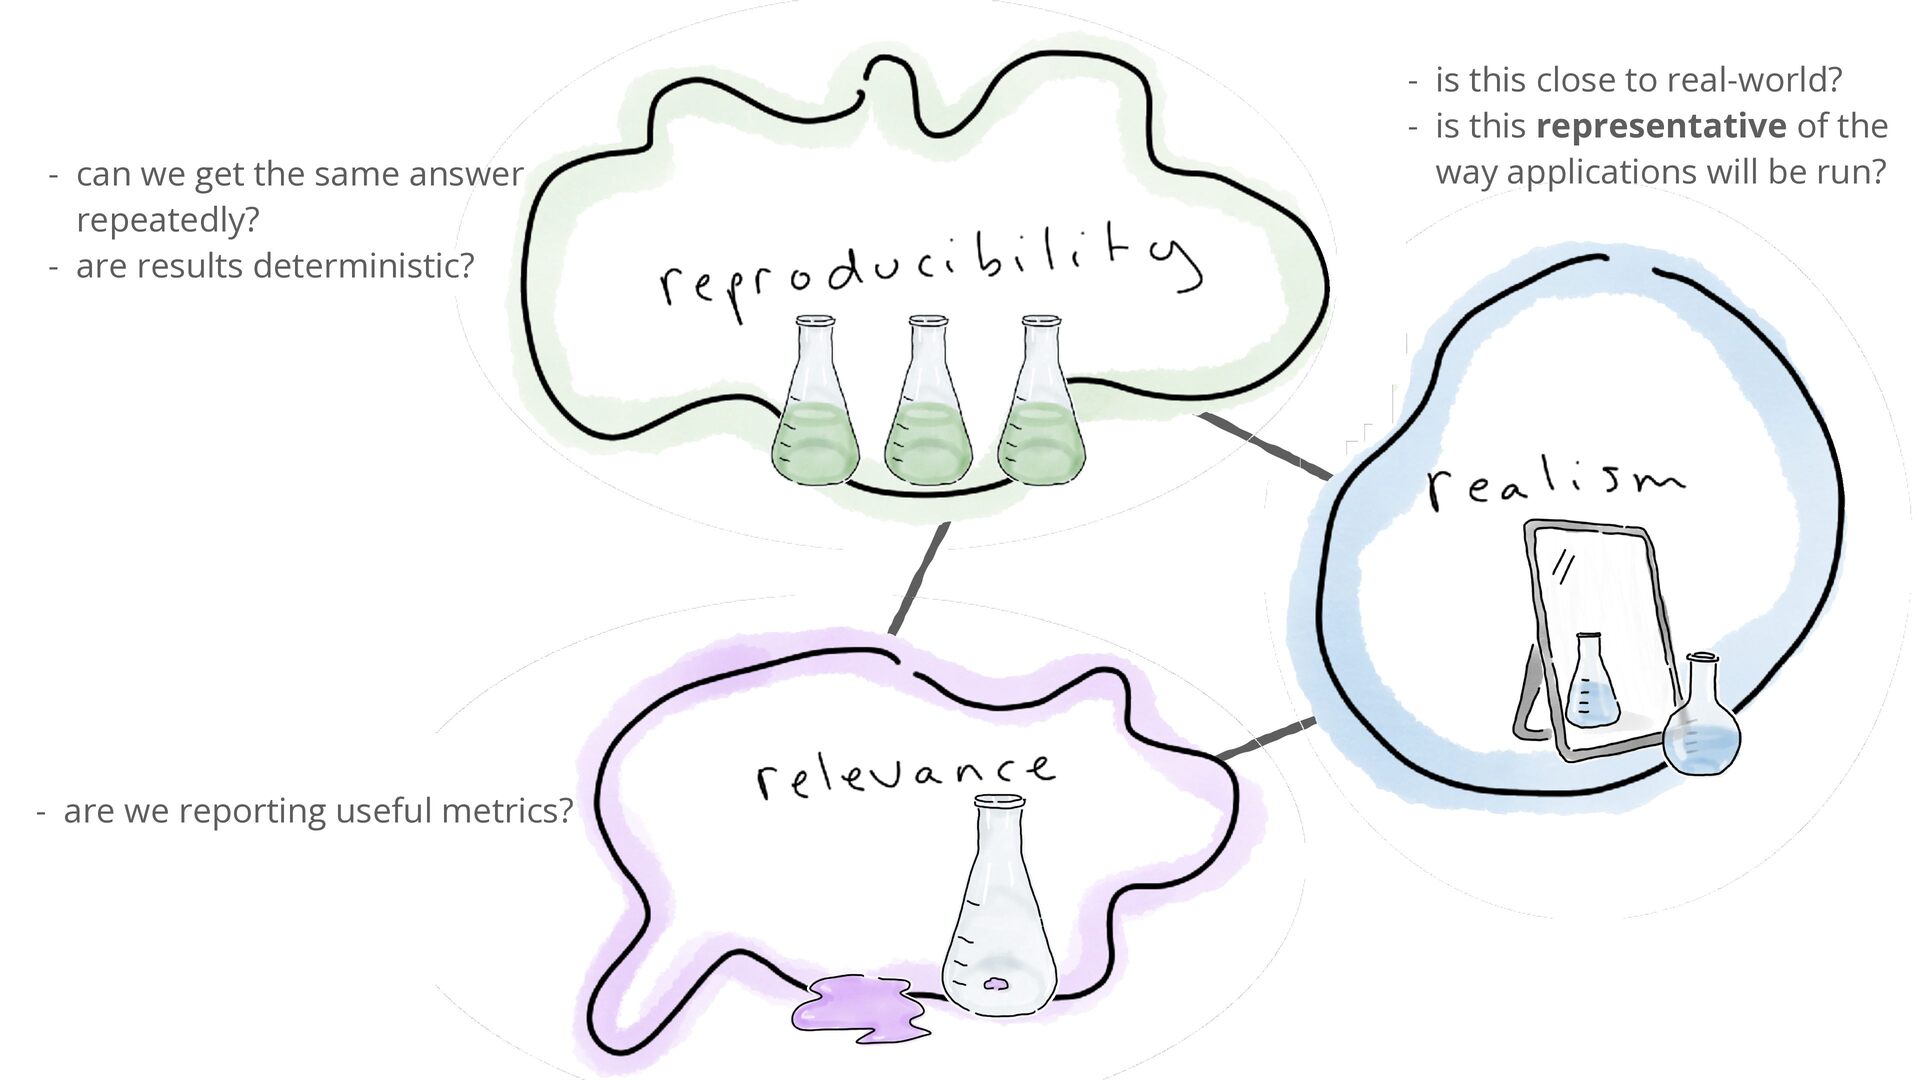
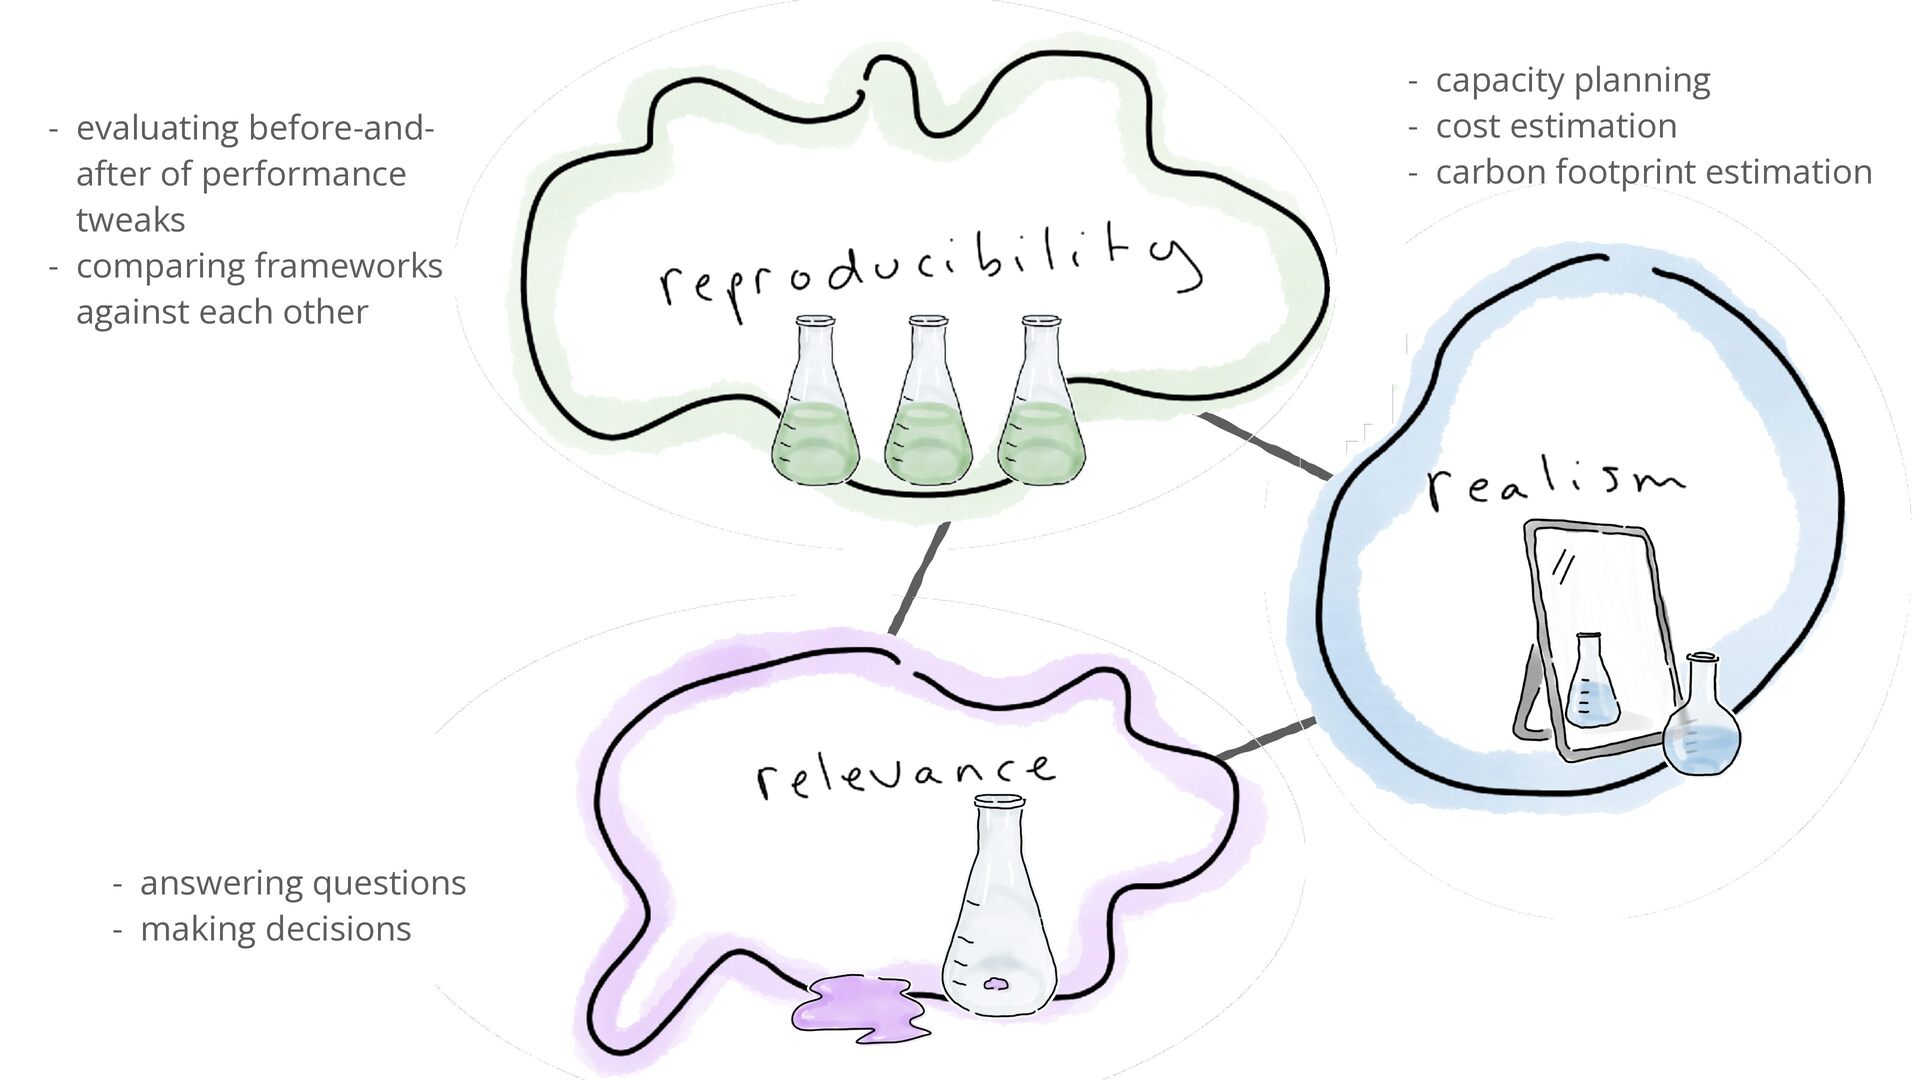
- can we get the same answer repeatedly? - are
results deterministic? - are we reporting useful metrics? - is this close to real-world? - is this representative of the way applications will be run? -
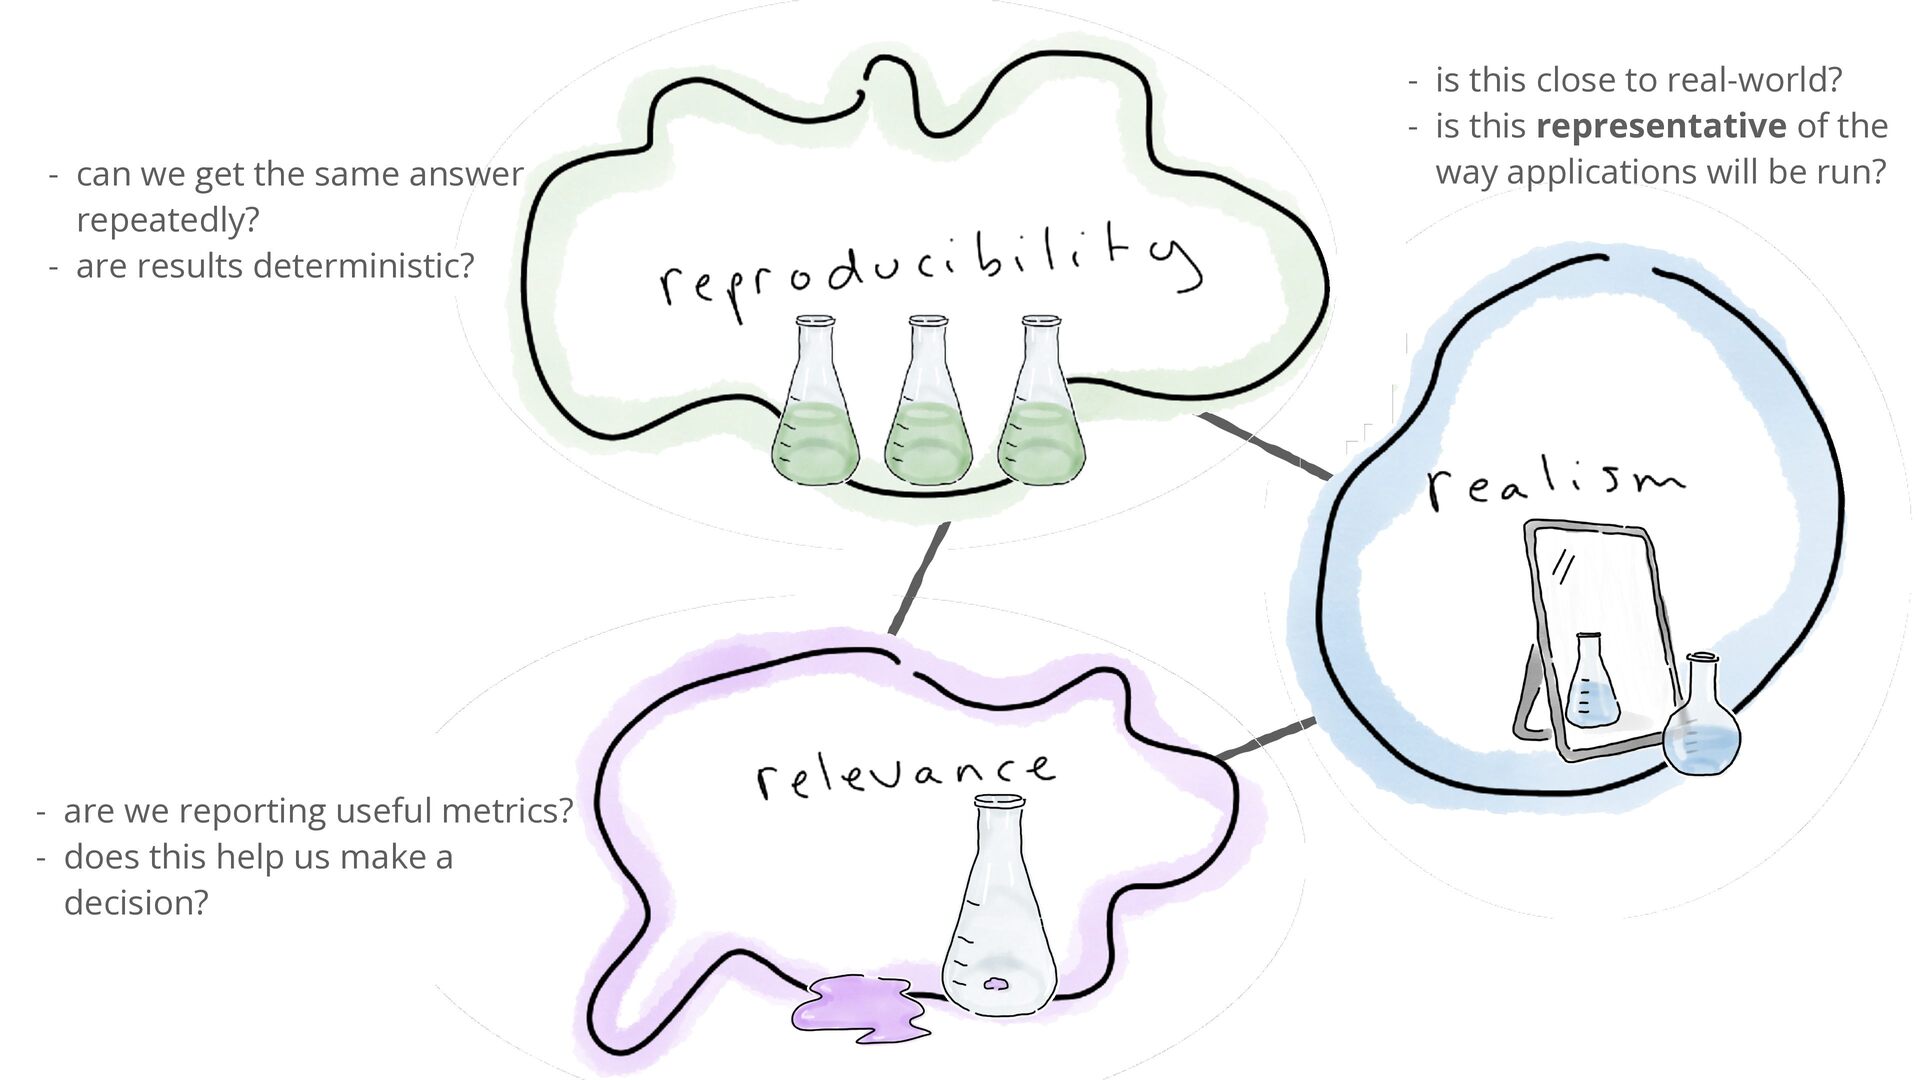
- can we get the same answer repeatedly? - are
results deterministic? - are we reporting useful metrics? - does this help us make a decision? - is this close to real-world? - is this representative of the way applications will be run? -
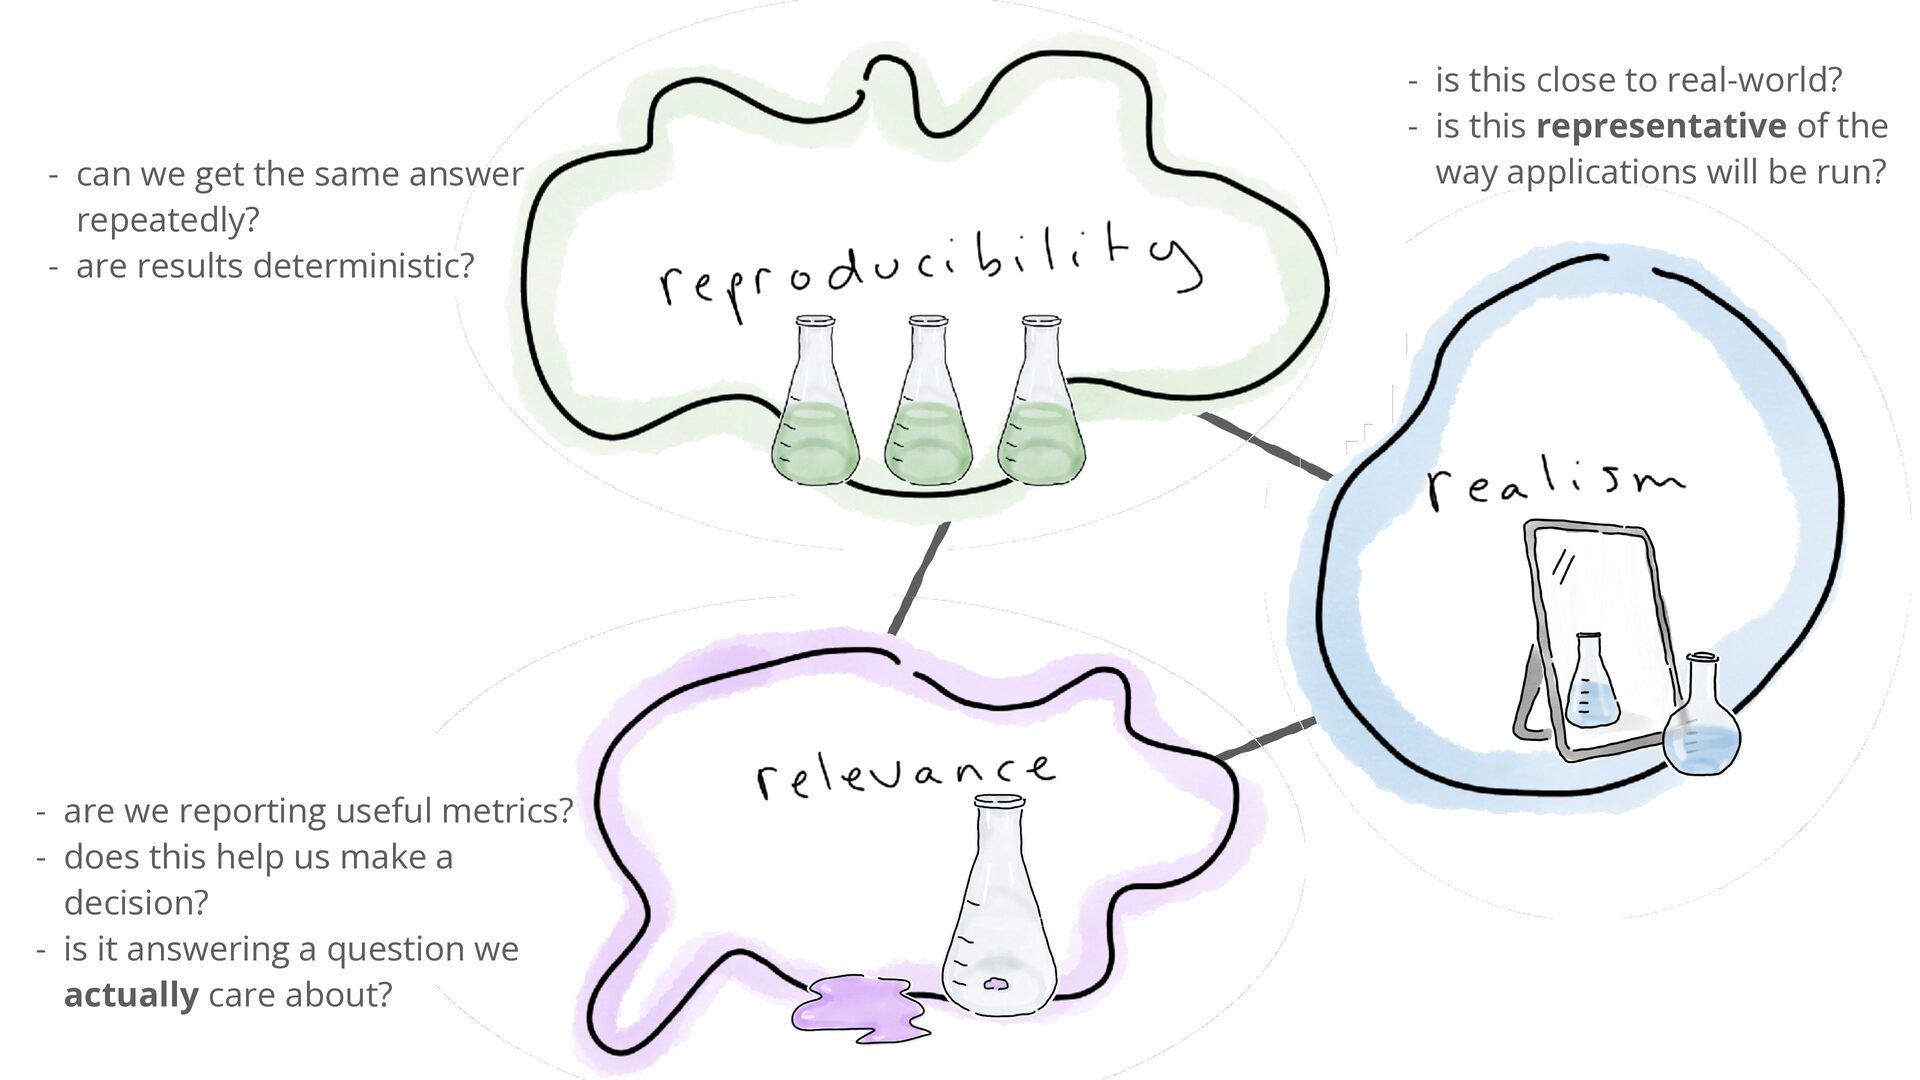
- can we get the same answer repeatedly? - are
results deterministic? - are we reporting useful metrics? - does this help us make a decision? - is it answering a question we actually care about? - is this close to real-world? - is this representative of the way applications will be run? -
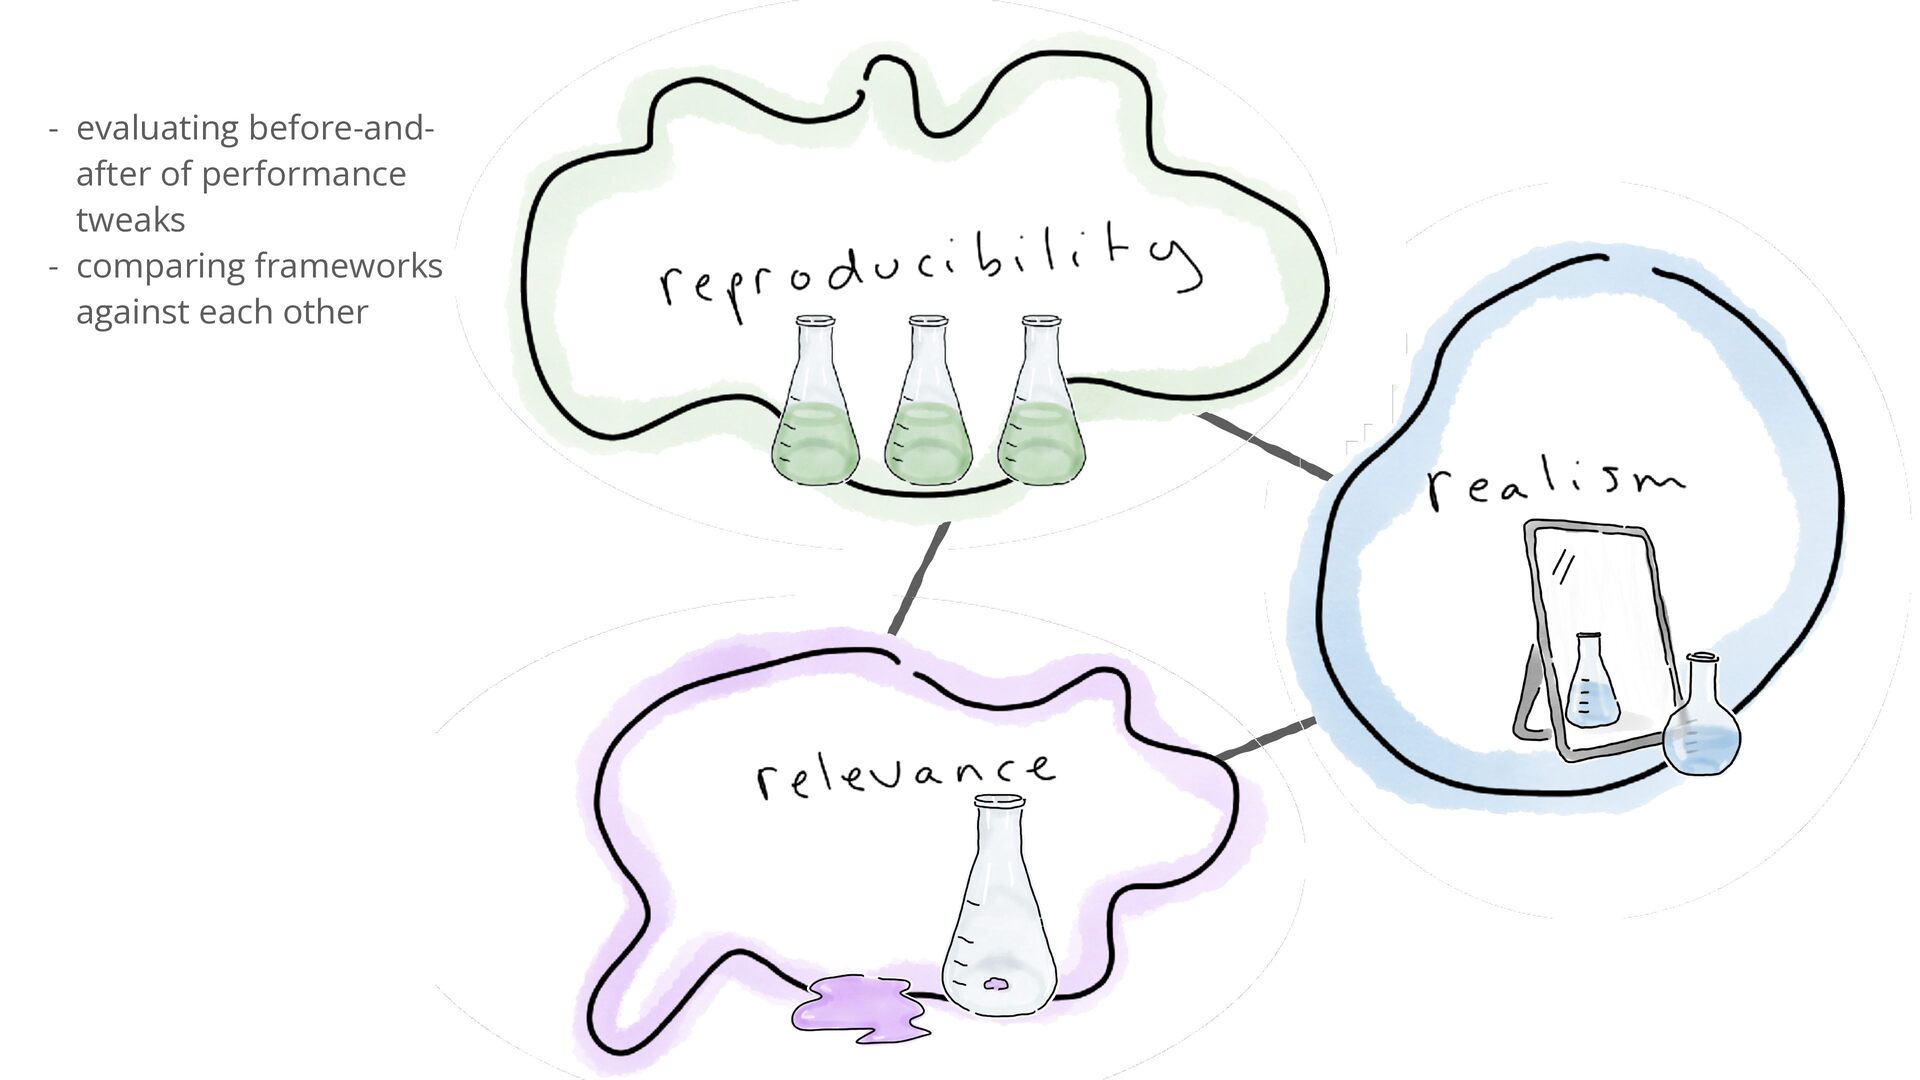
- evaluating before-andafter of performance tweaks - comparing frameworks against
each other - capacity planning - cost estimation - carbon footprint estimation -
- evaluating before-andafter of performance tweaks - comparing frameworks against
each other - answering questions - making decisions - capacity planning - cost estimation - carbon footprint estimation -
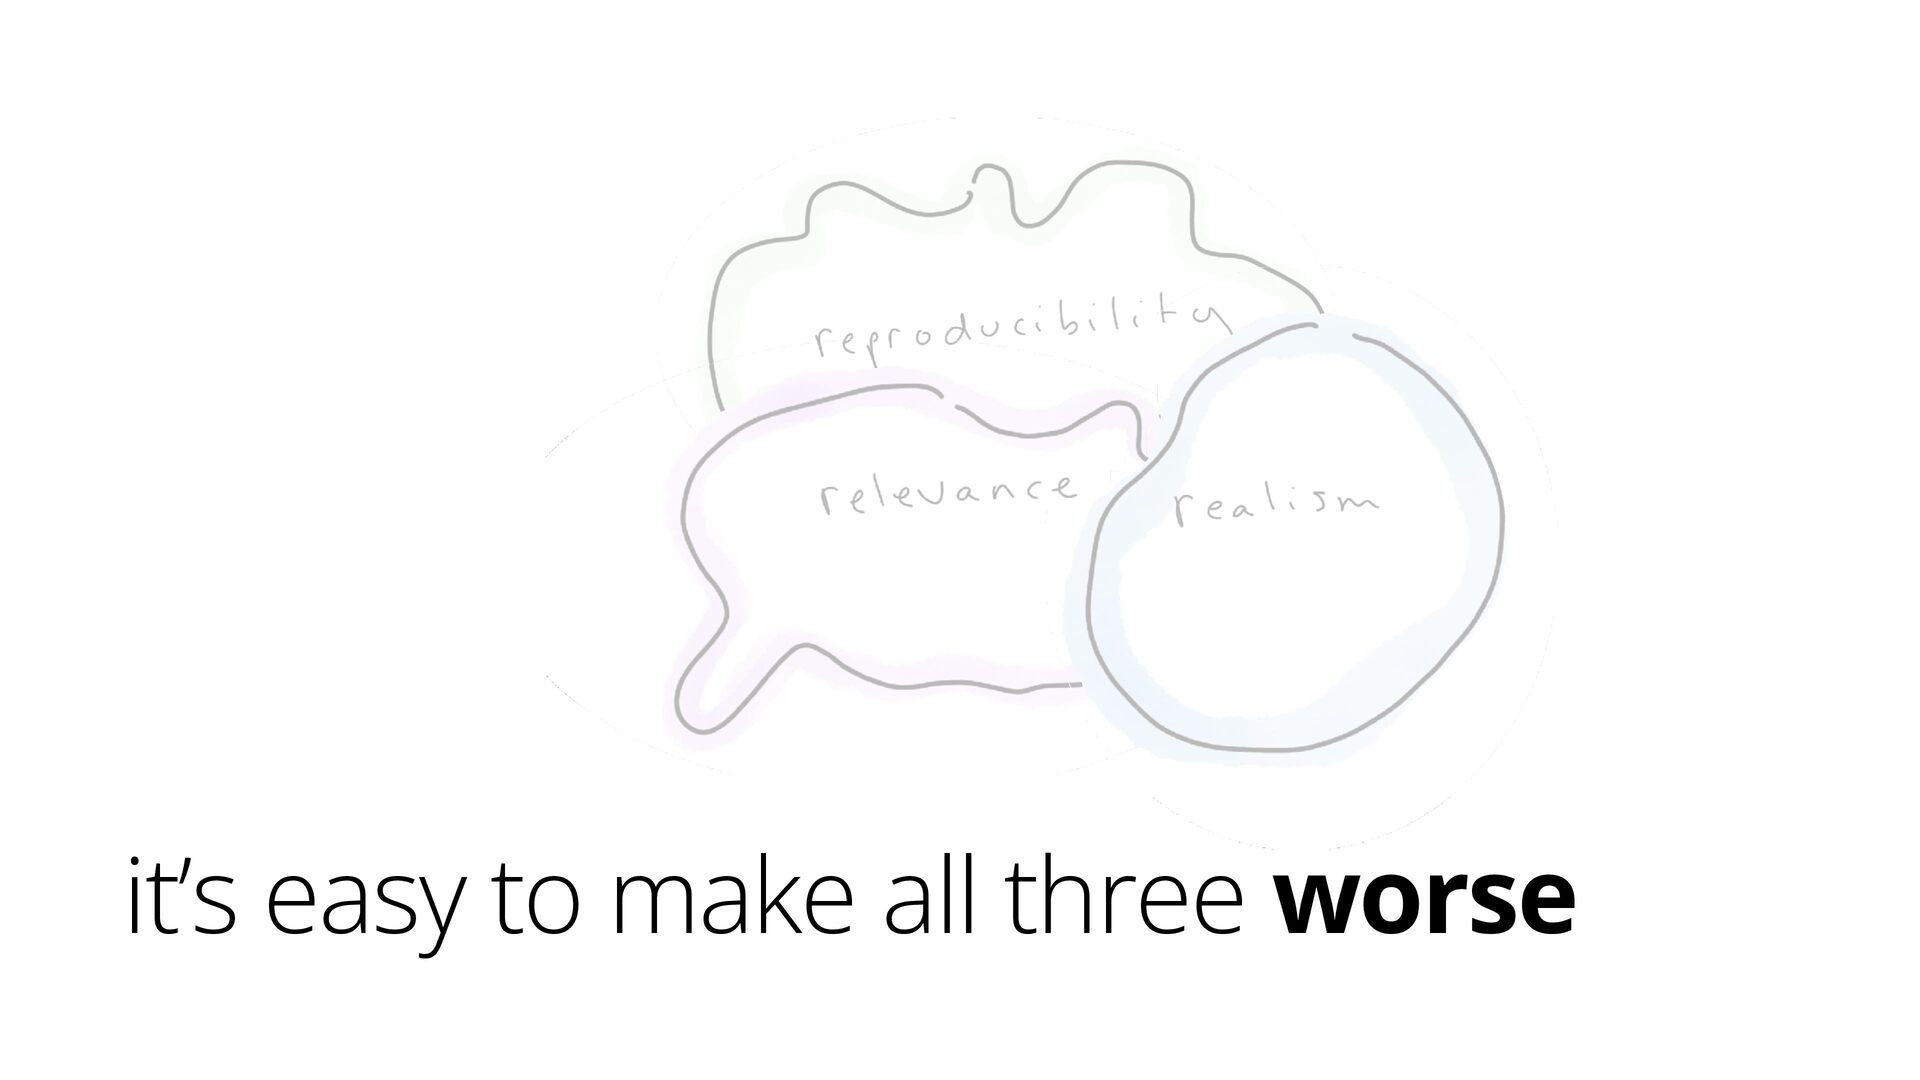
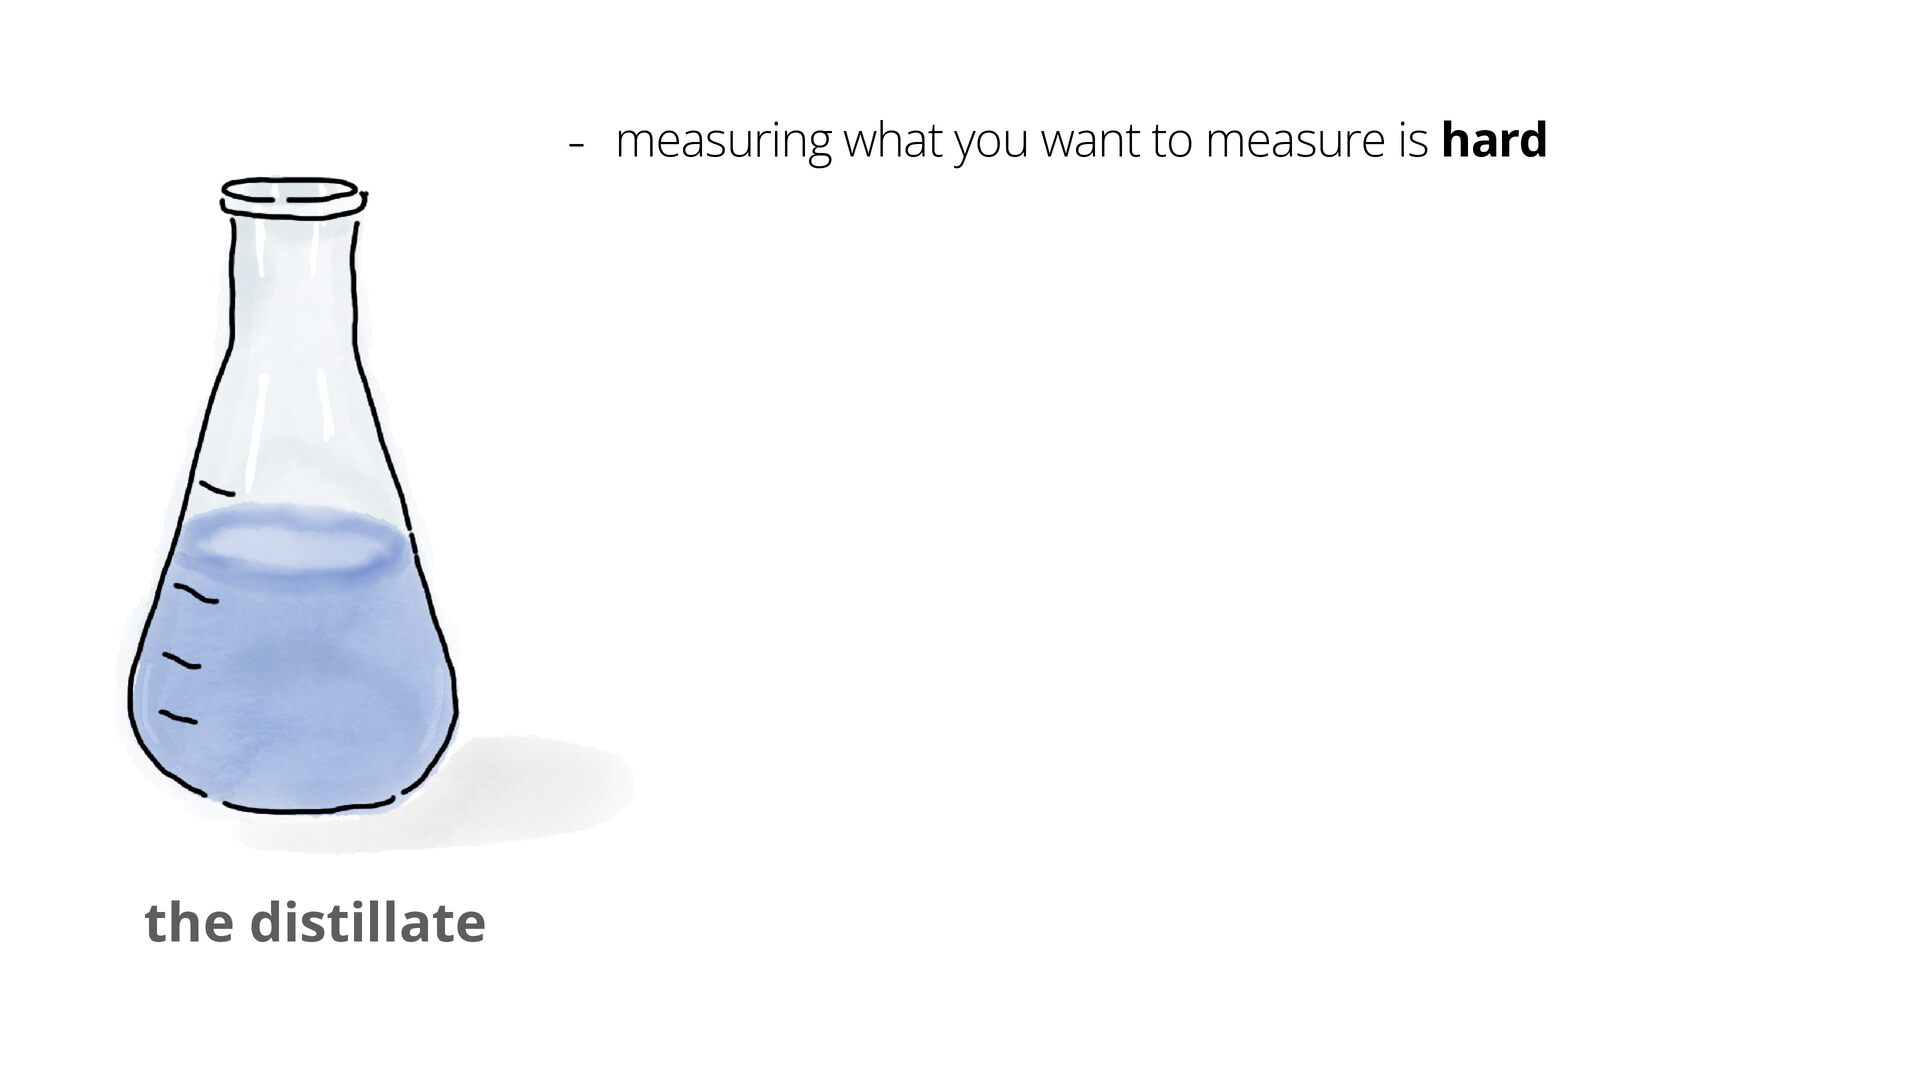
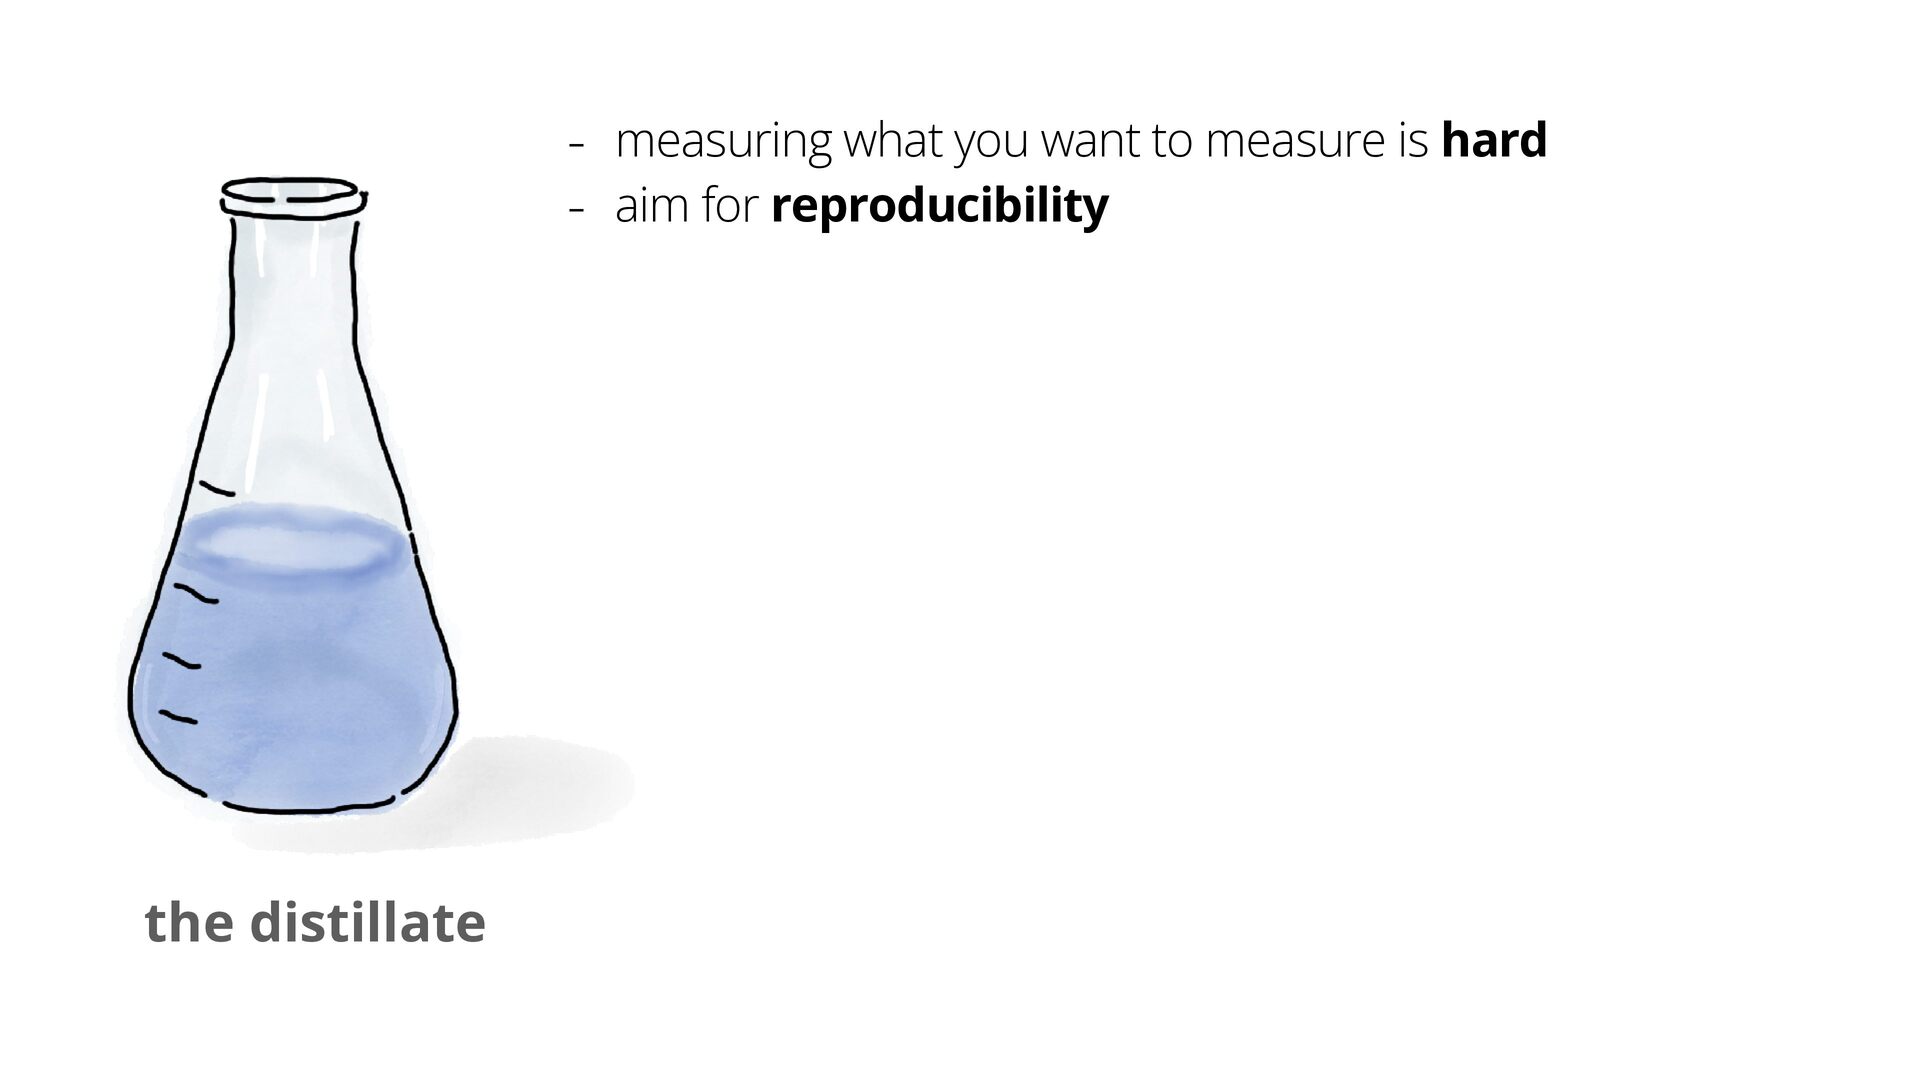
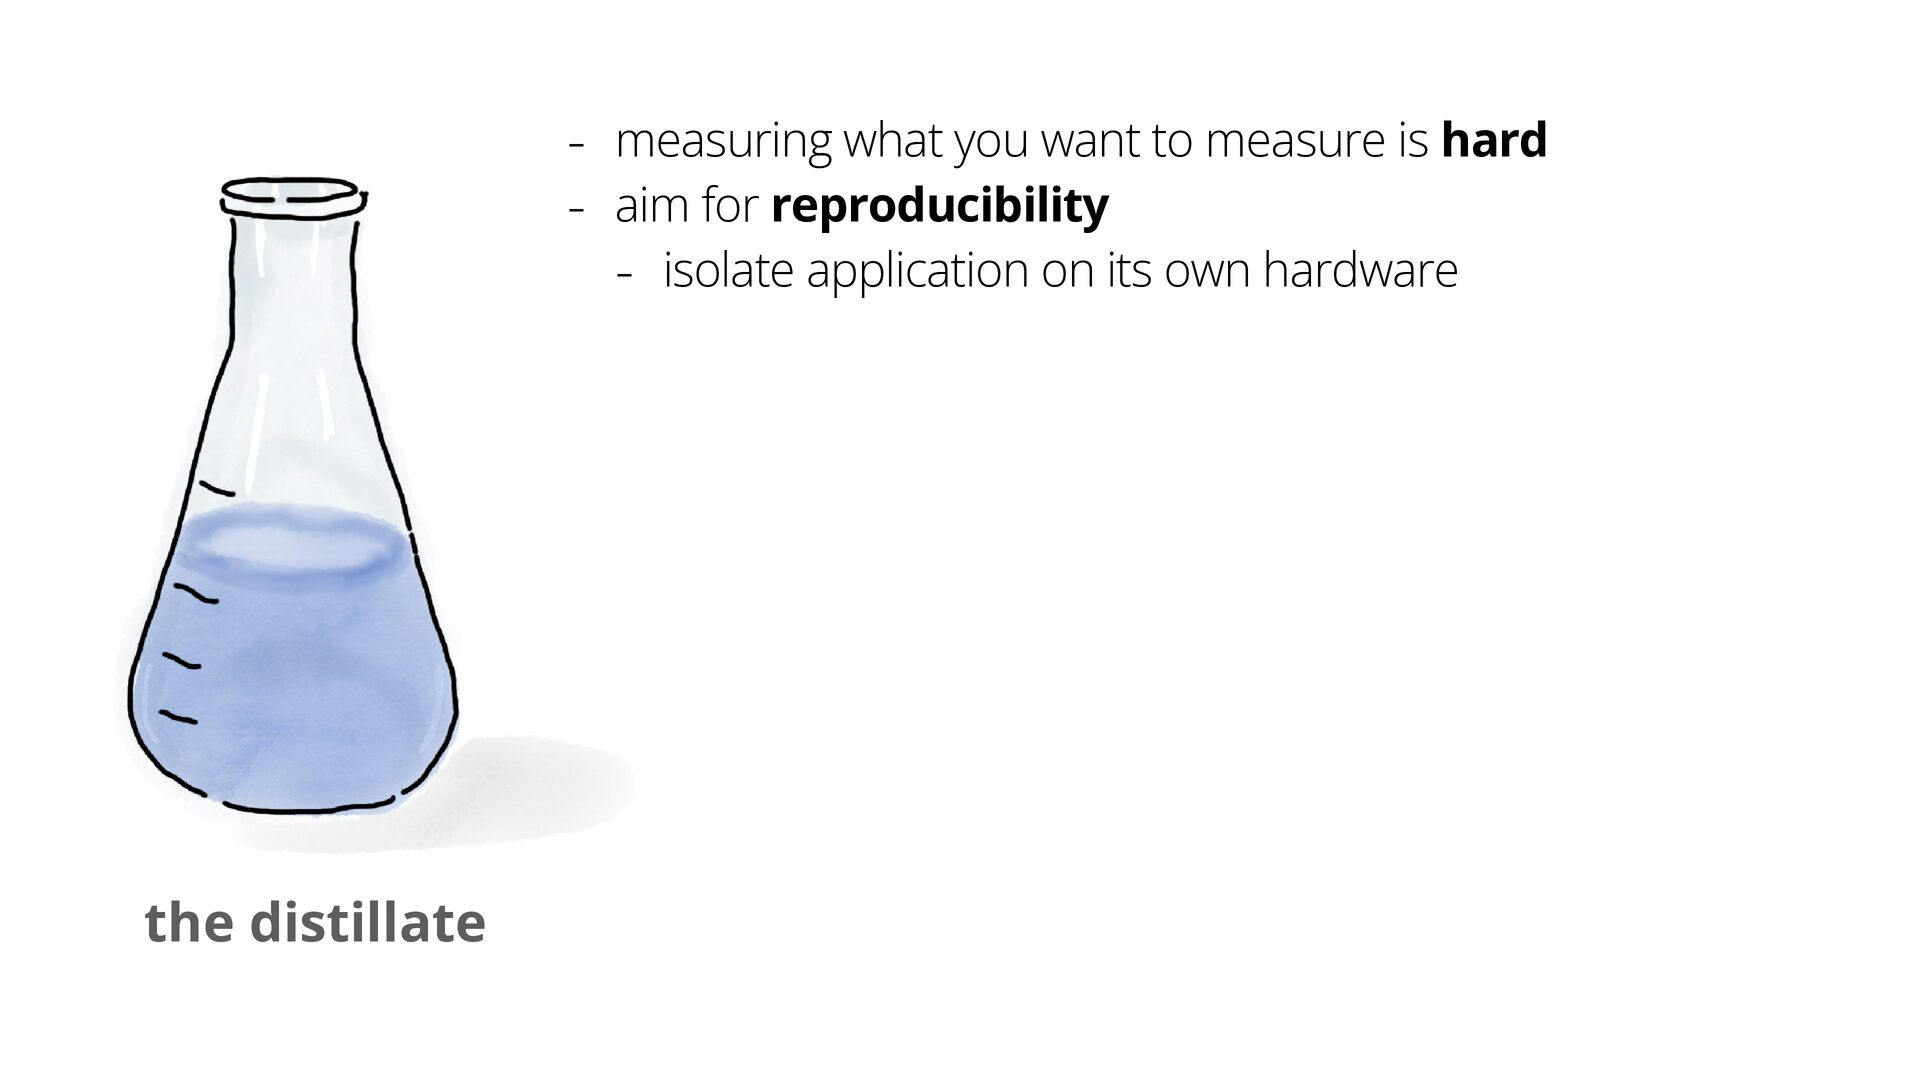
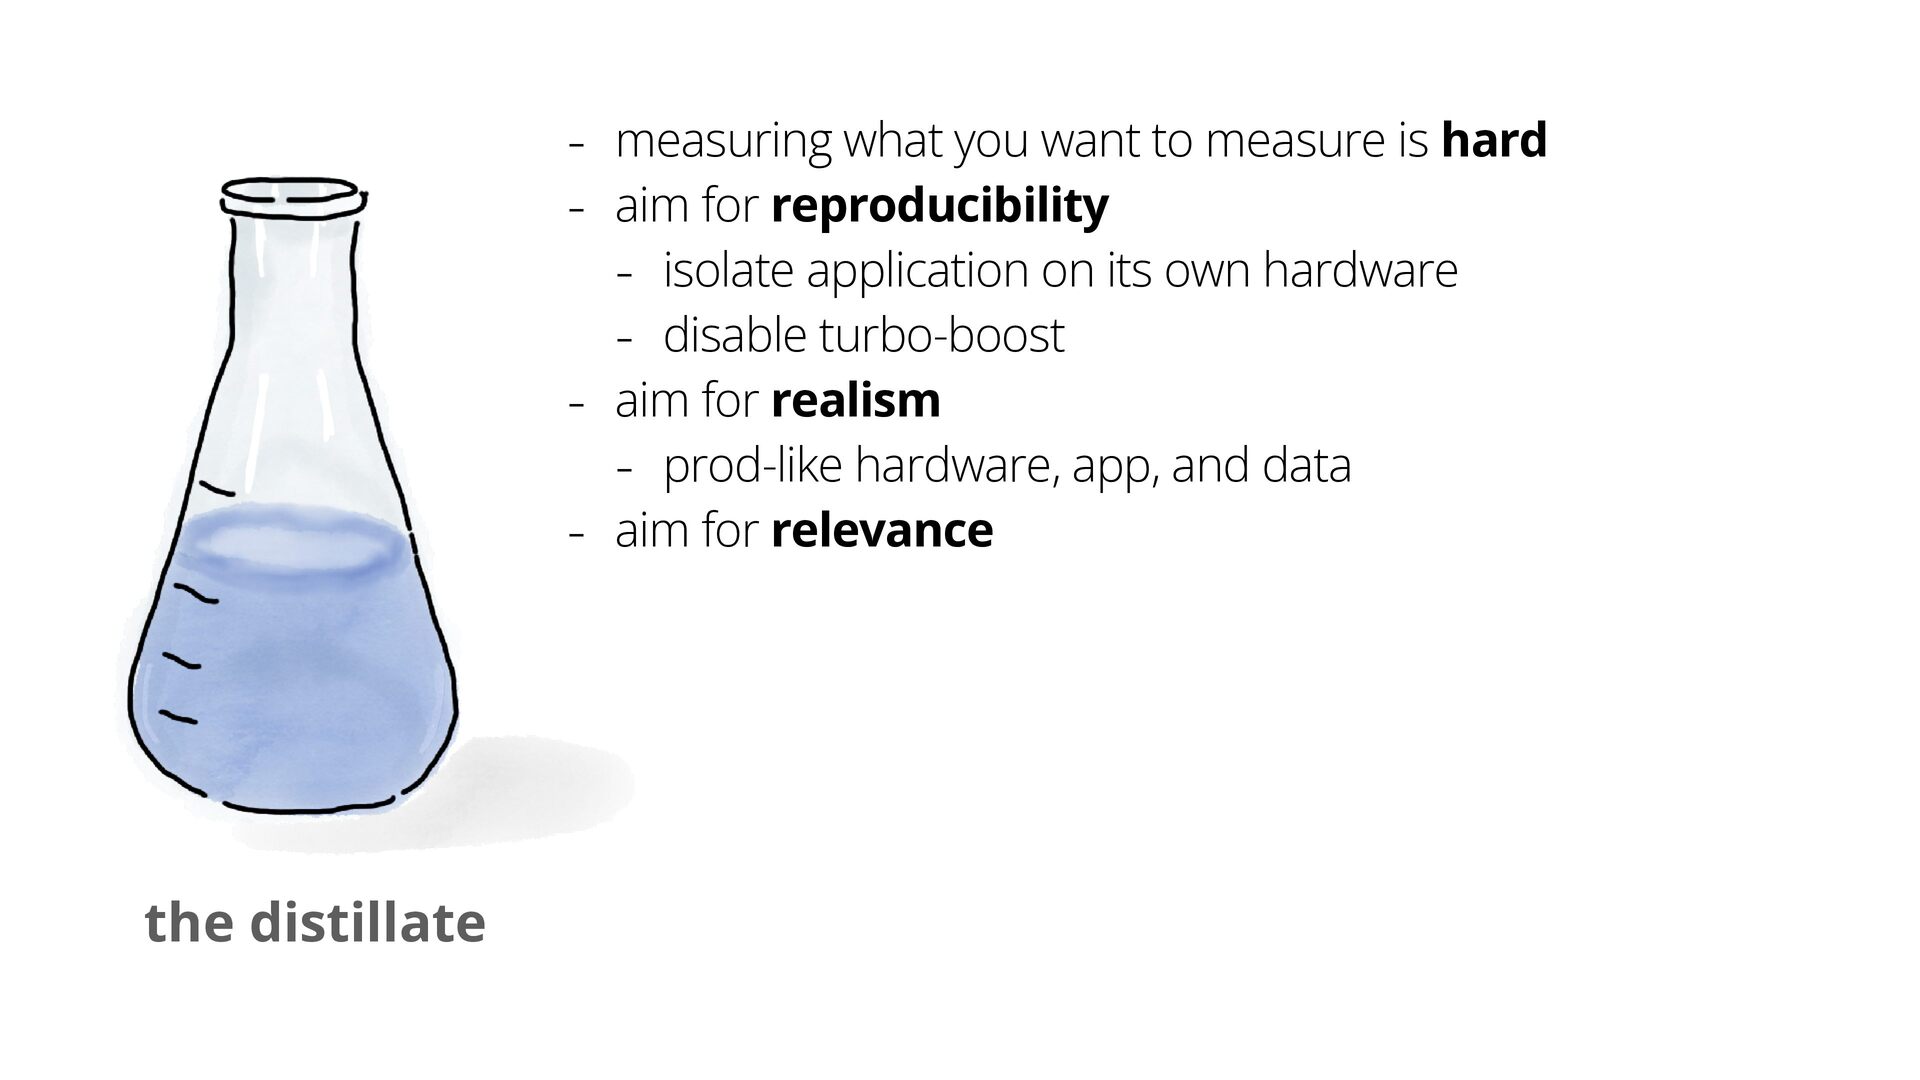
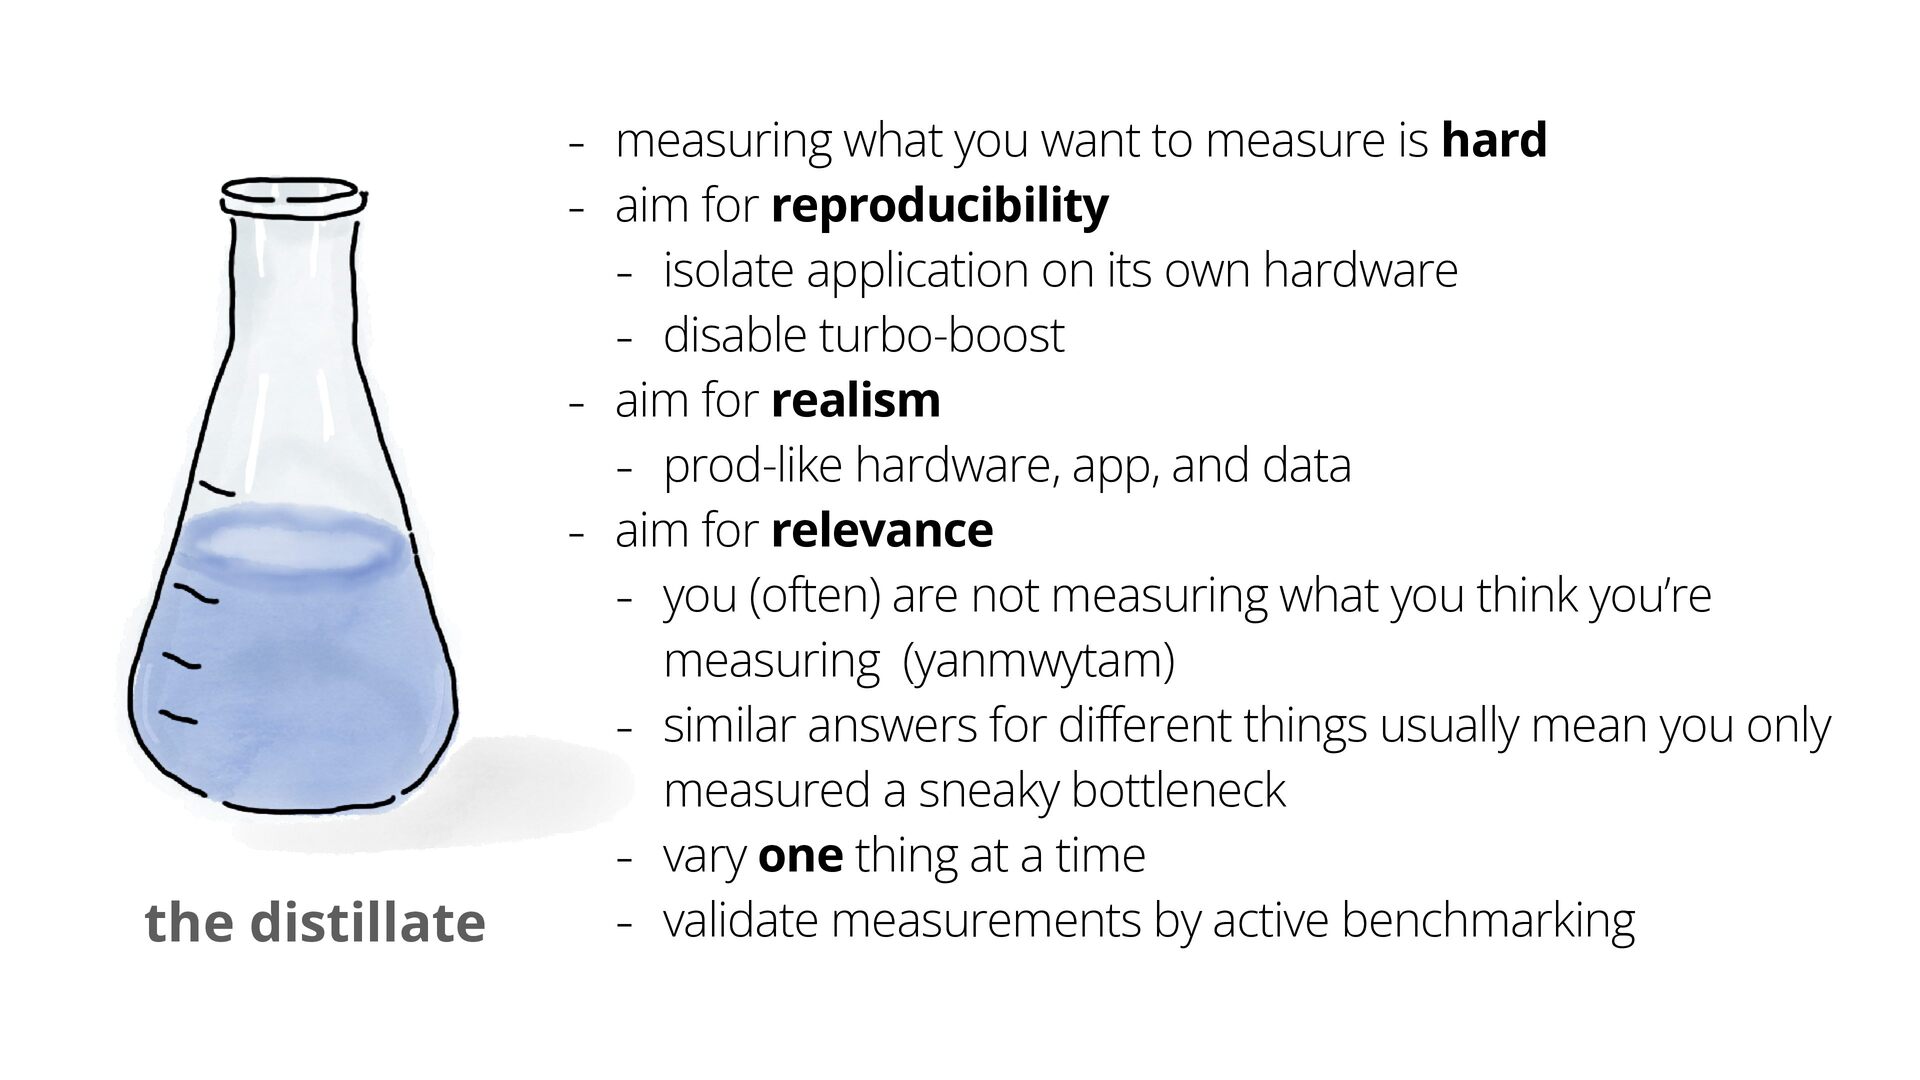
- measuring what you want to measure is hard -
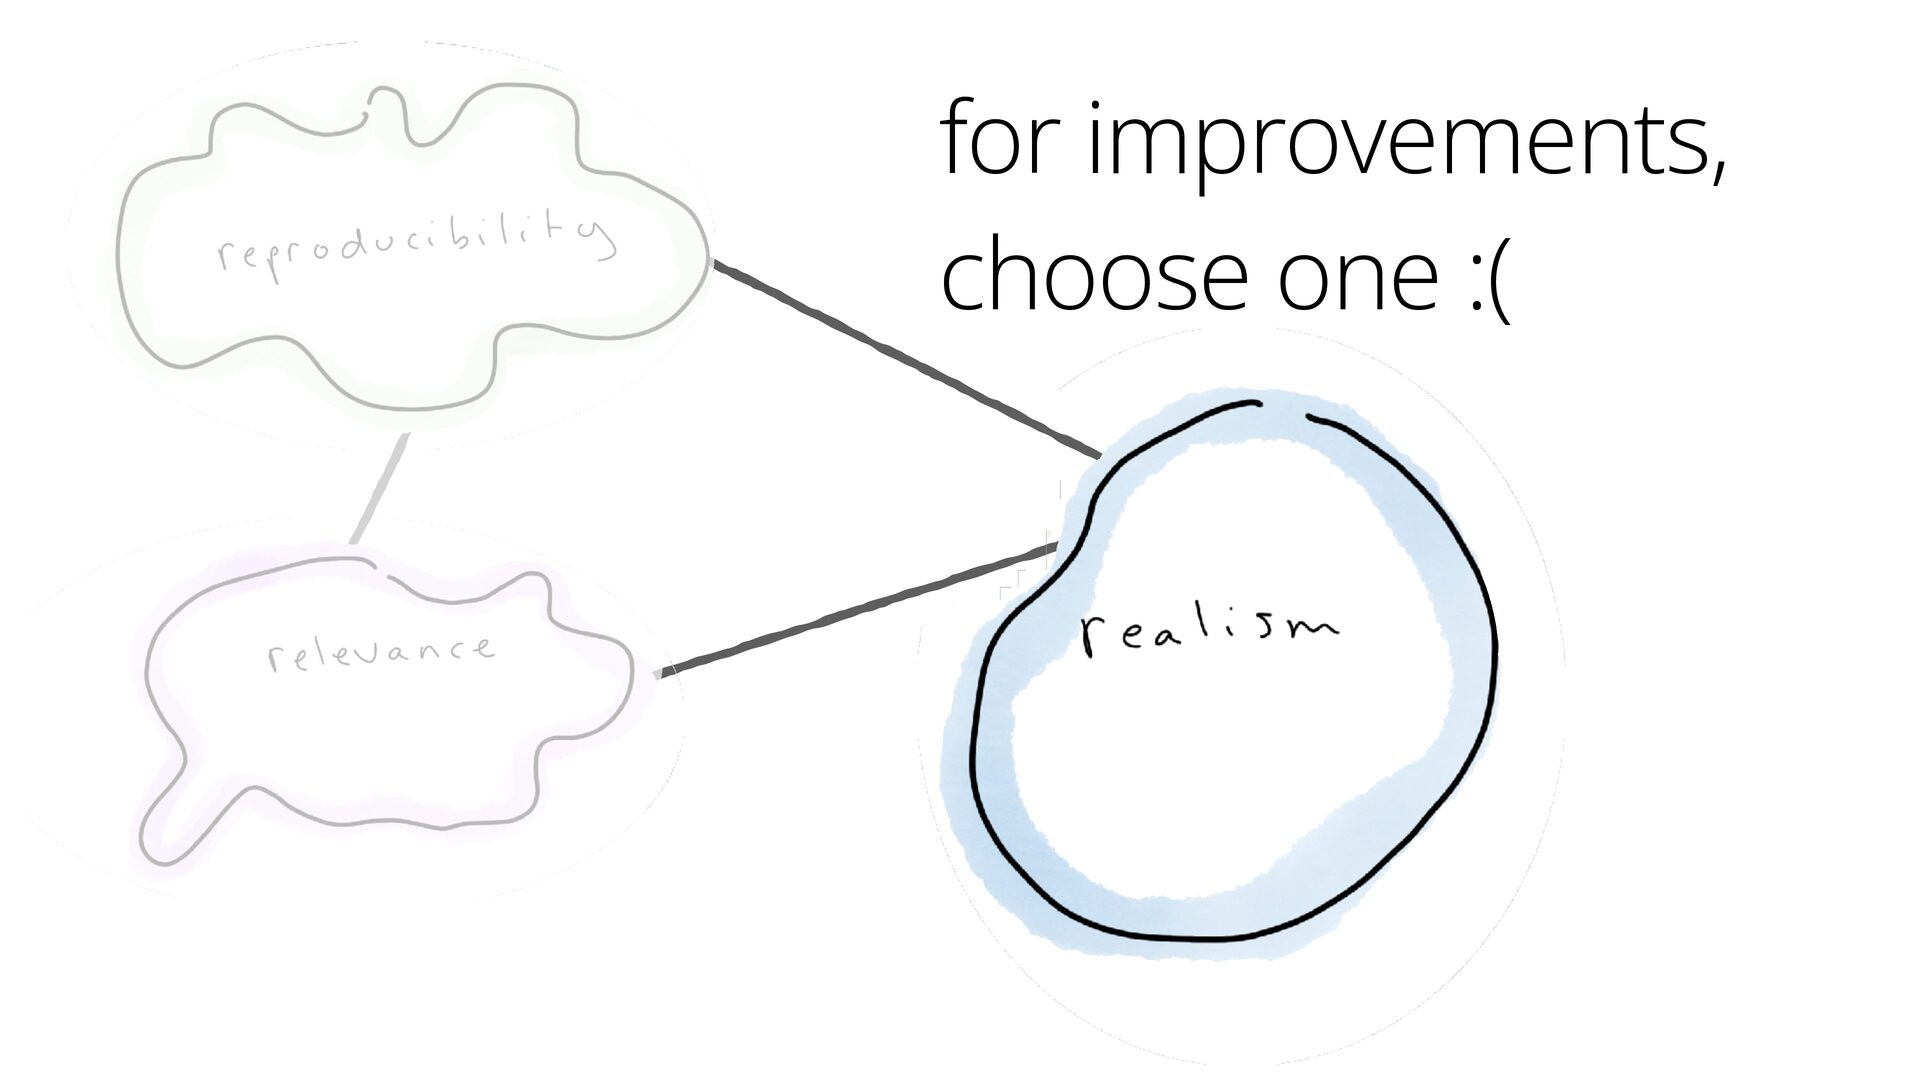
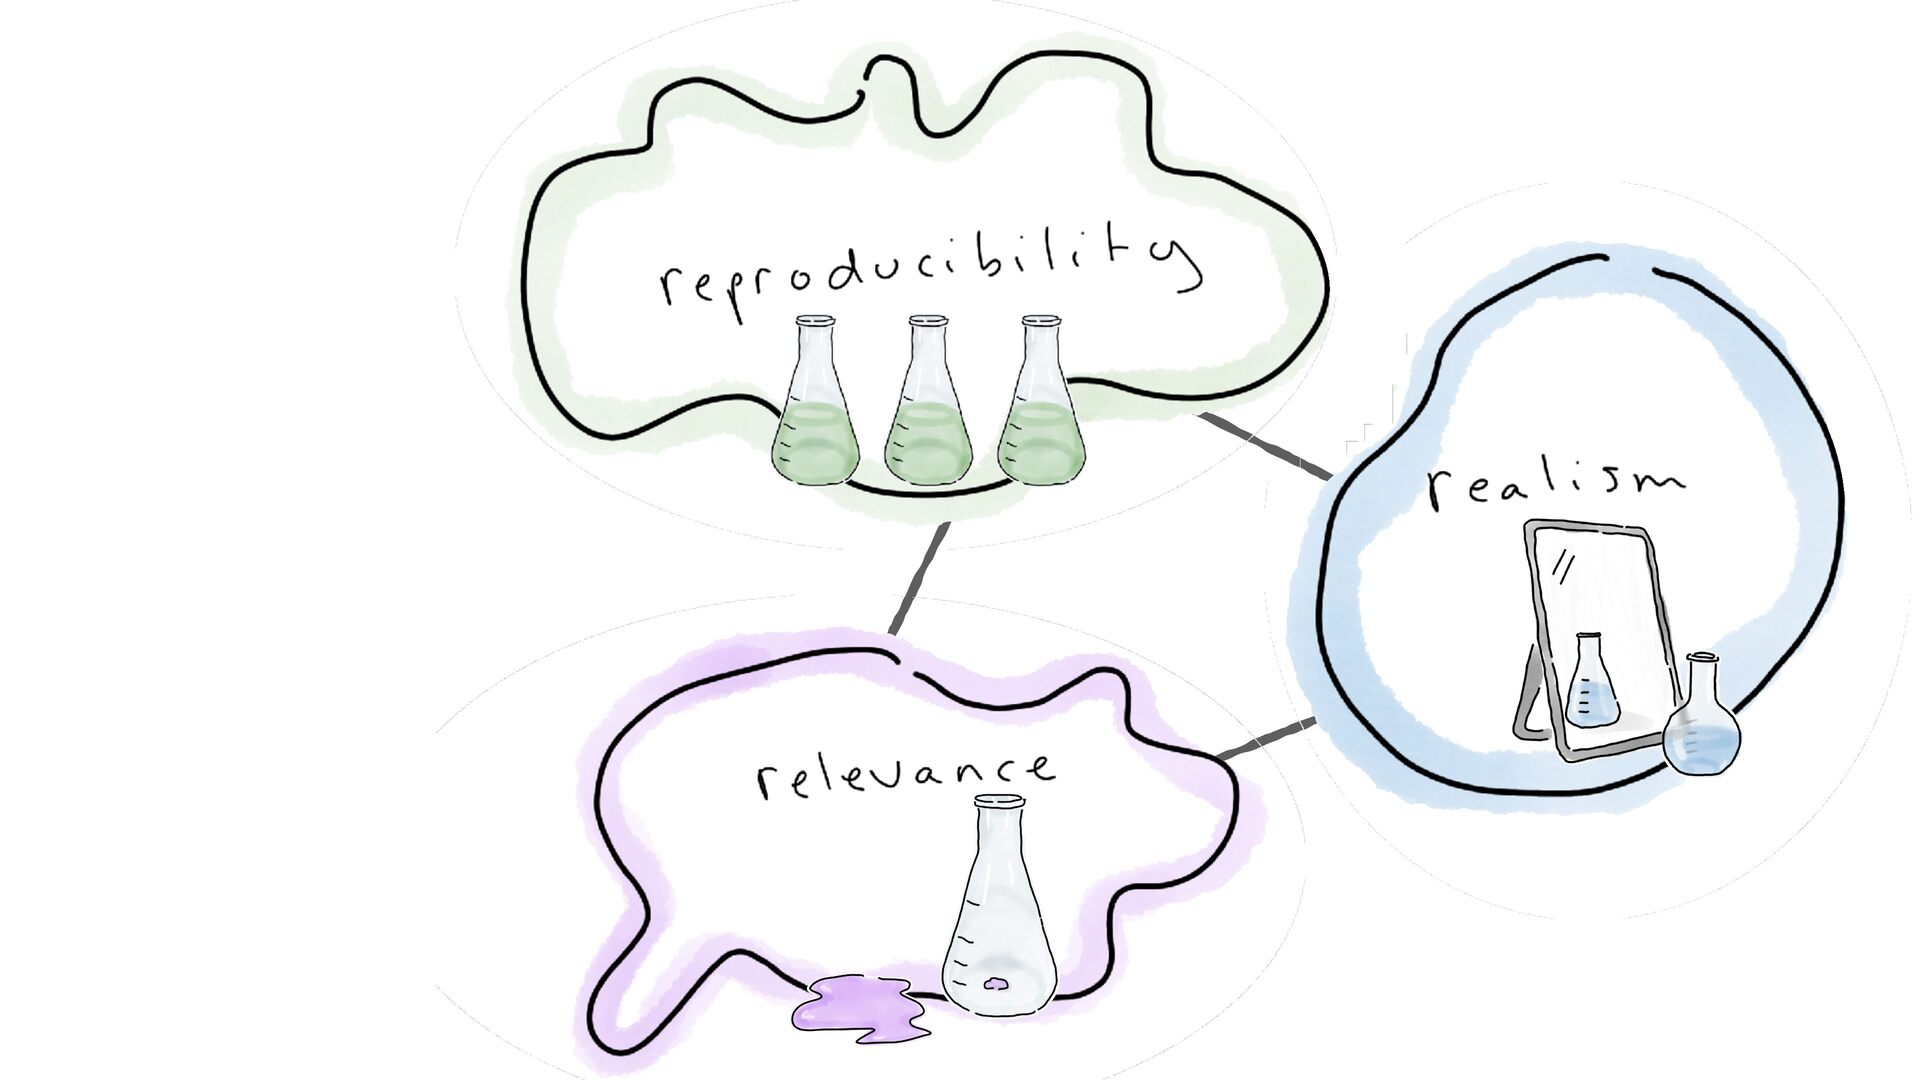
aim for reproducibility the distillate -
- measuring what you want to measure is hard -
aim for reproducibility - isolate application on its own hardware the distillate -
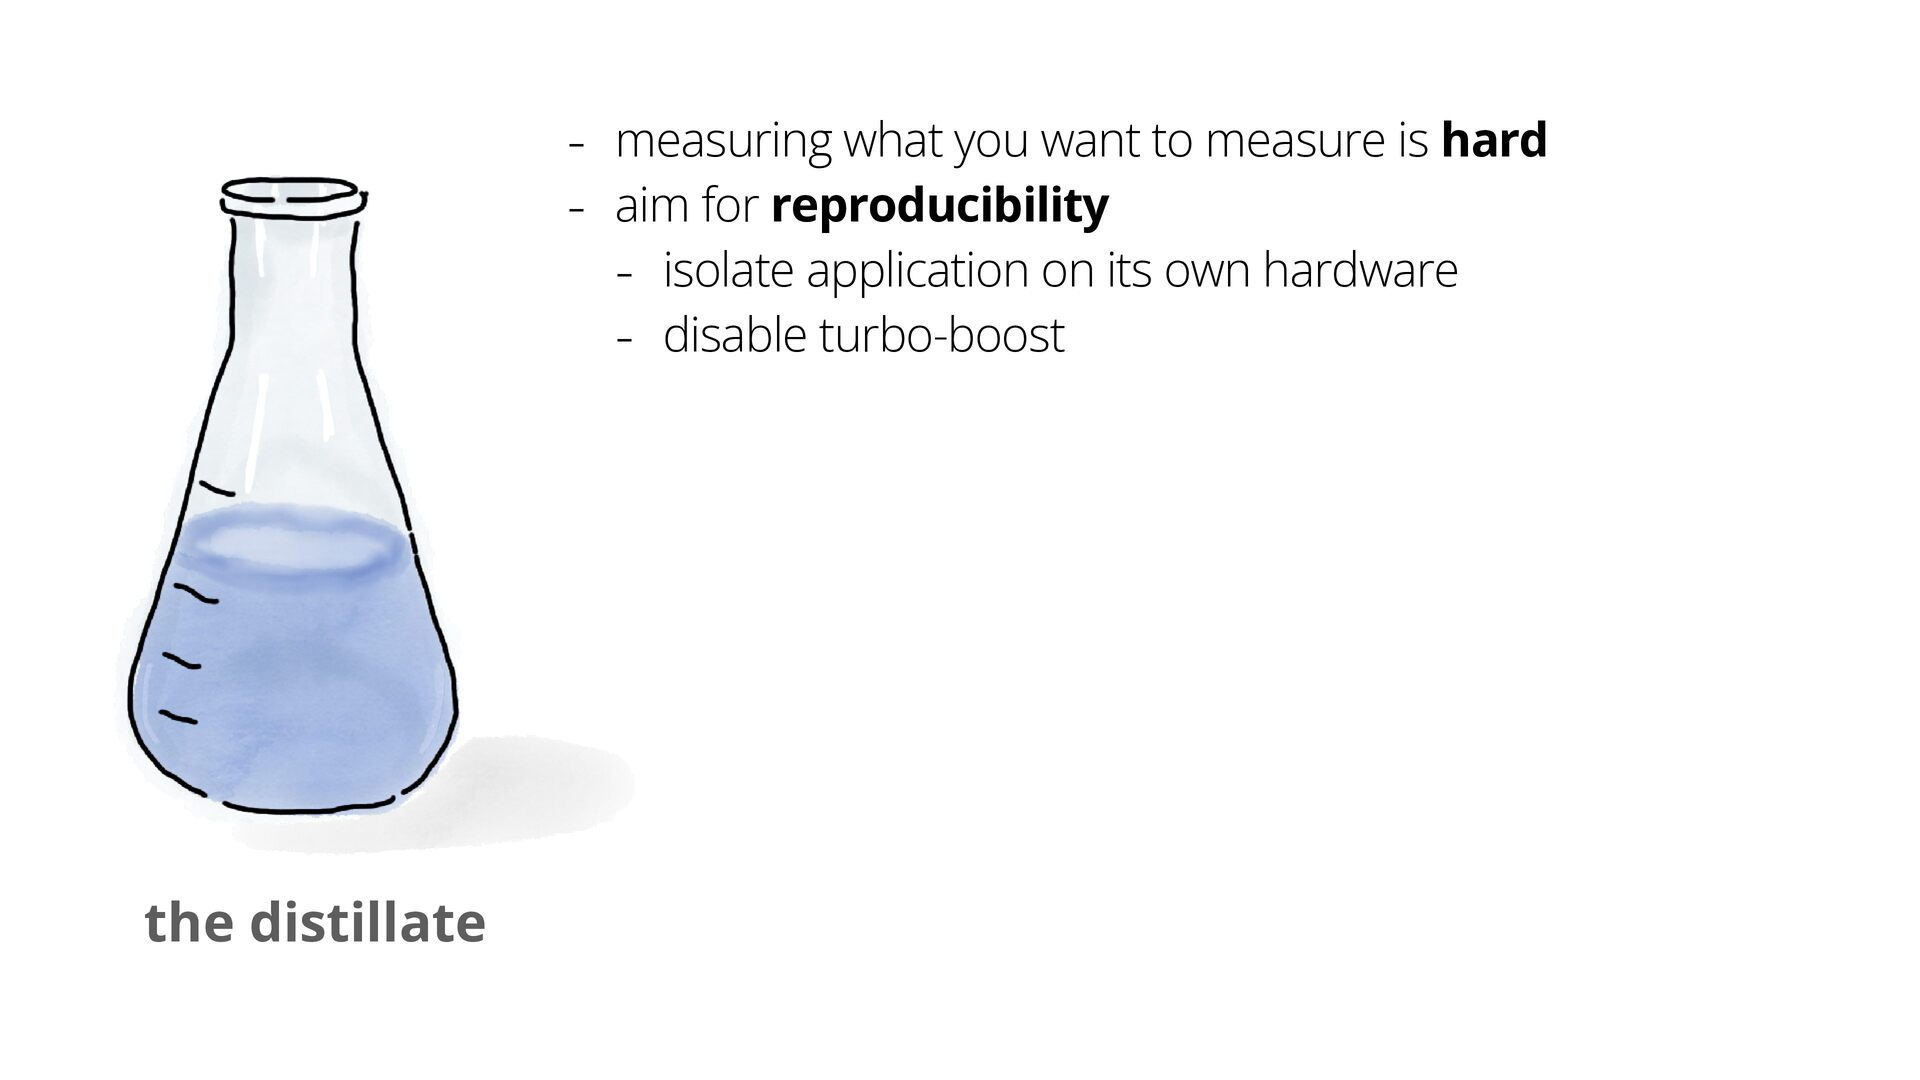
- measuring what you want to measure is hard -
aim for reproducibility - isolate application on its own hardware - disable turbo-boost the distillate -
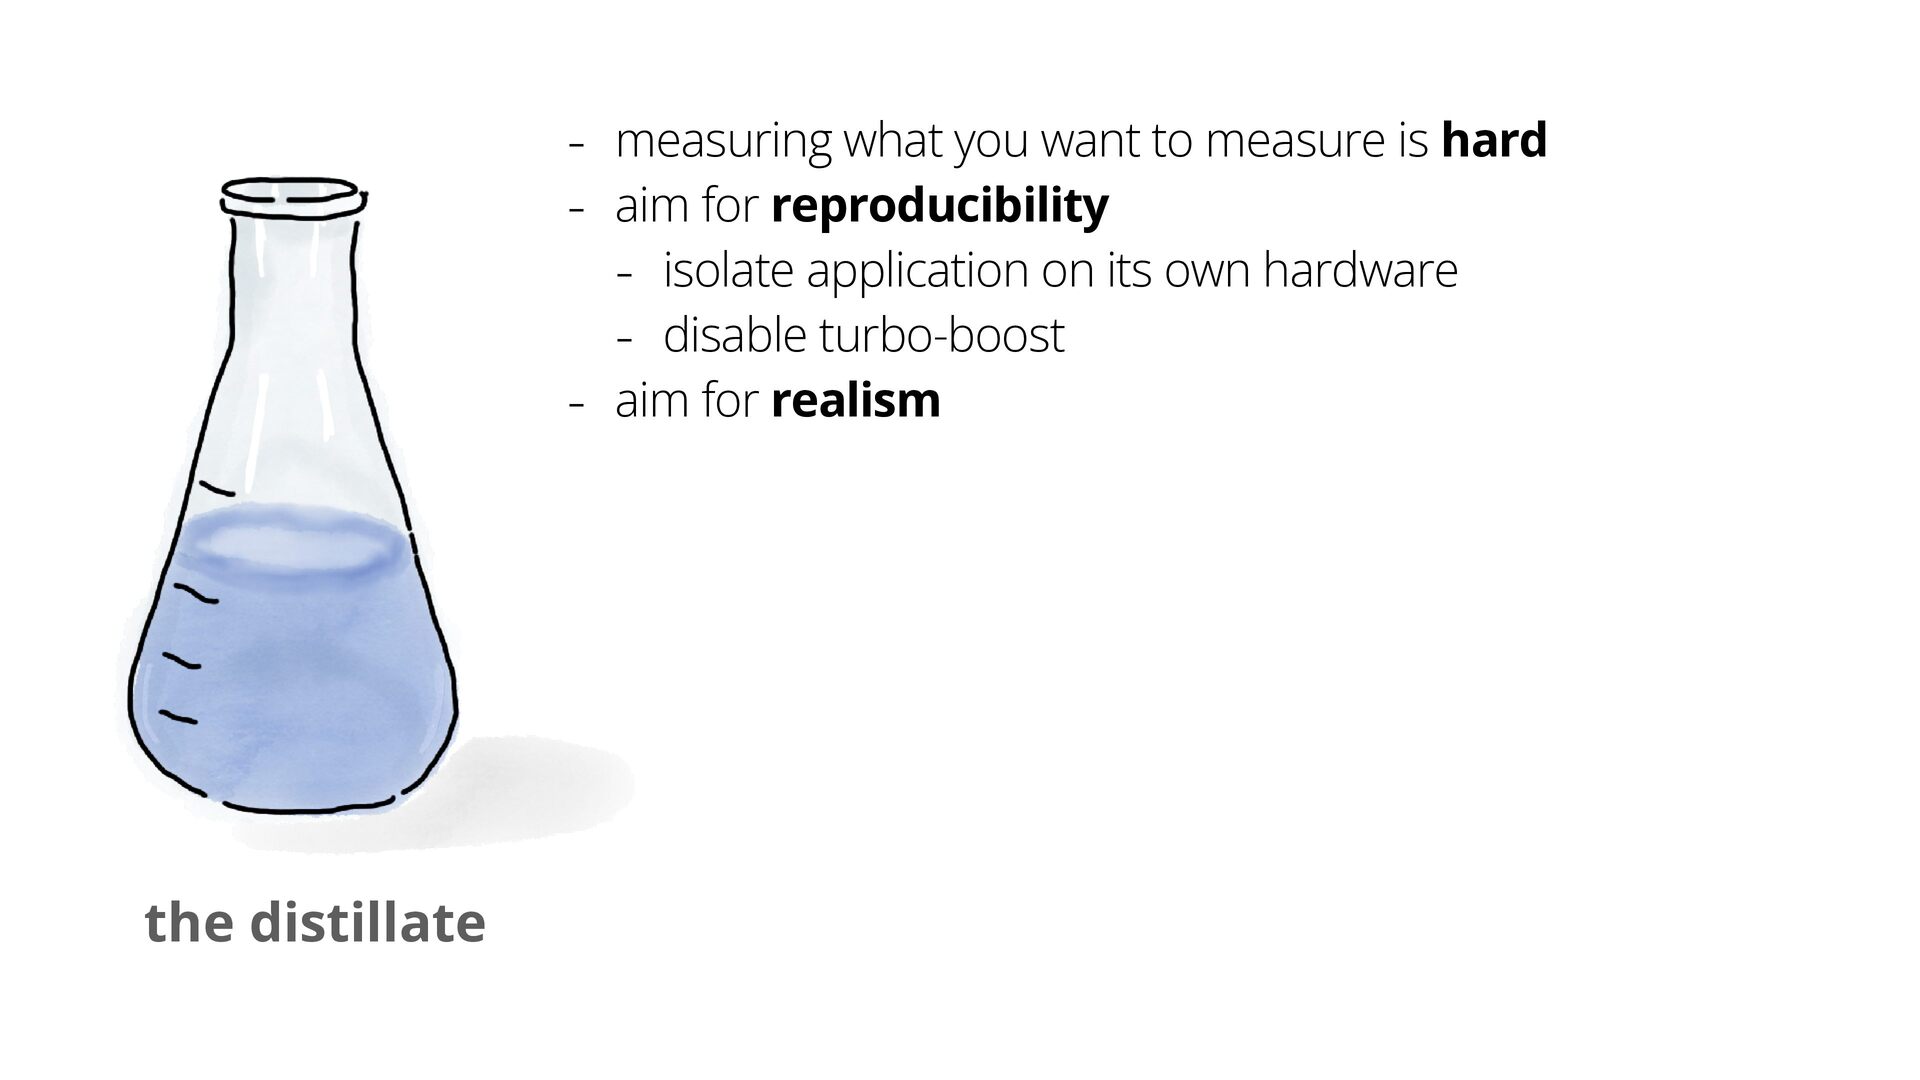
- measuring what you want to measure is hard -
aim for reproducibility - isolate application on its own hardware - disable turbo-boost - aim for realism the distillate -
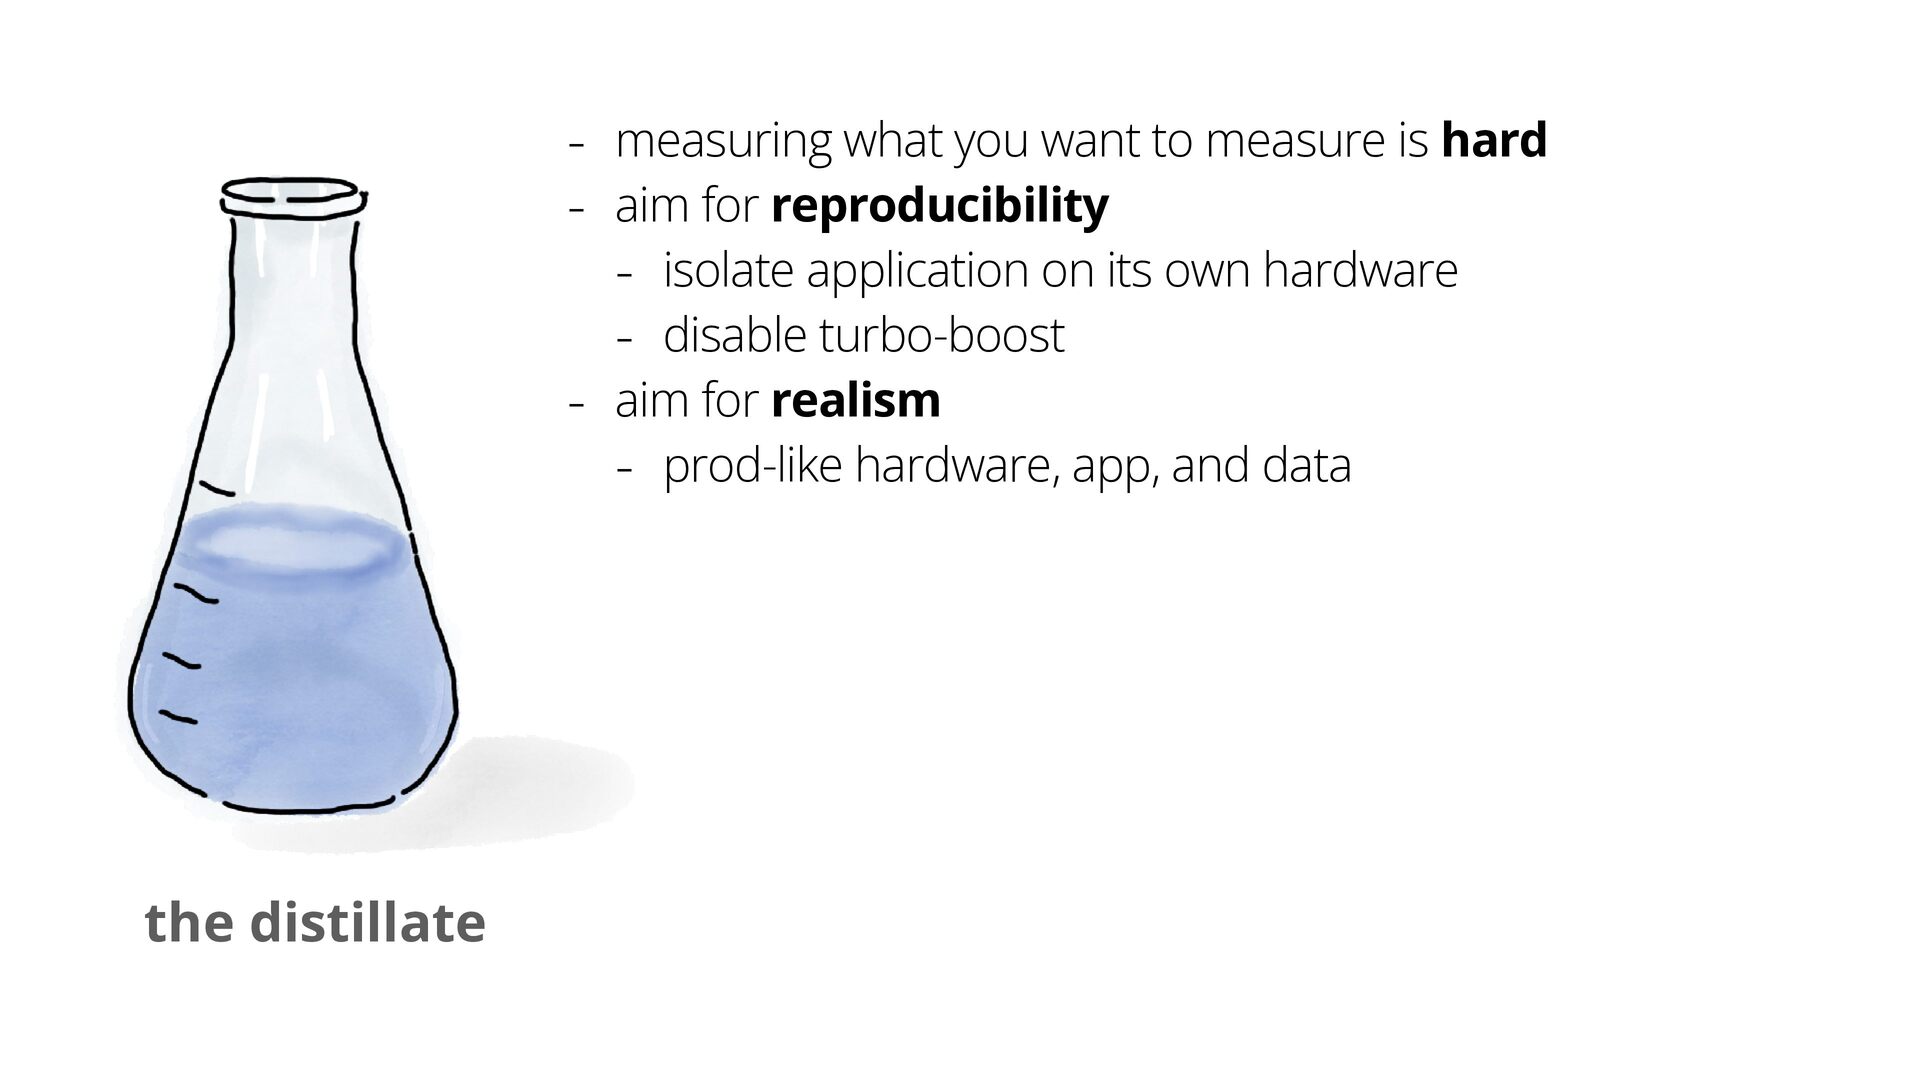
- measuring what you want to measure is hard -
aim for reproducibility - isolate application on its own hardware - disable turbo-boost - aim for realism - prod-like hardware, app, and data the distillate -
- measuring what you want to measure is hard -
aim for reproducibility - isolate application on its own hardware - disable turbo-boost - aim for realism - prod-like hardware, app, and data - aim for relevance the distillate -
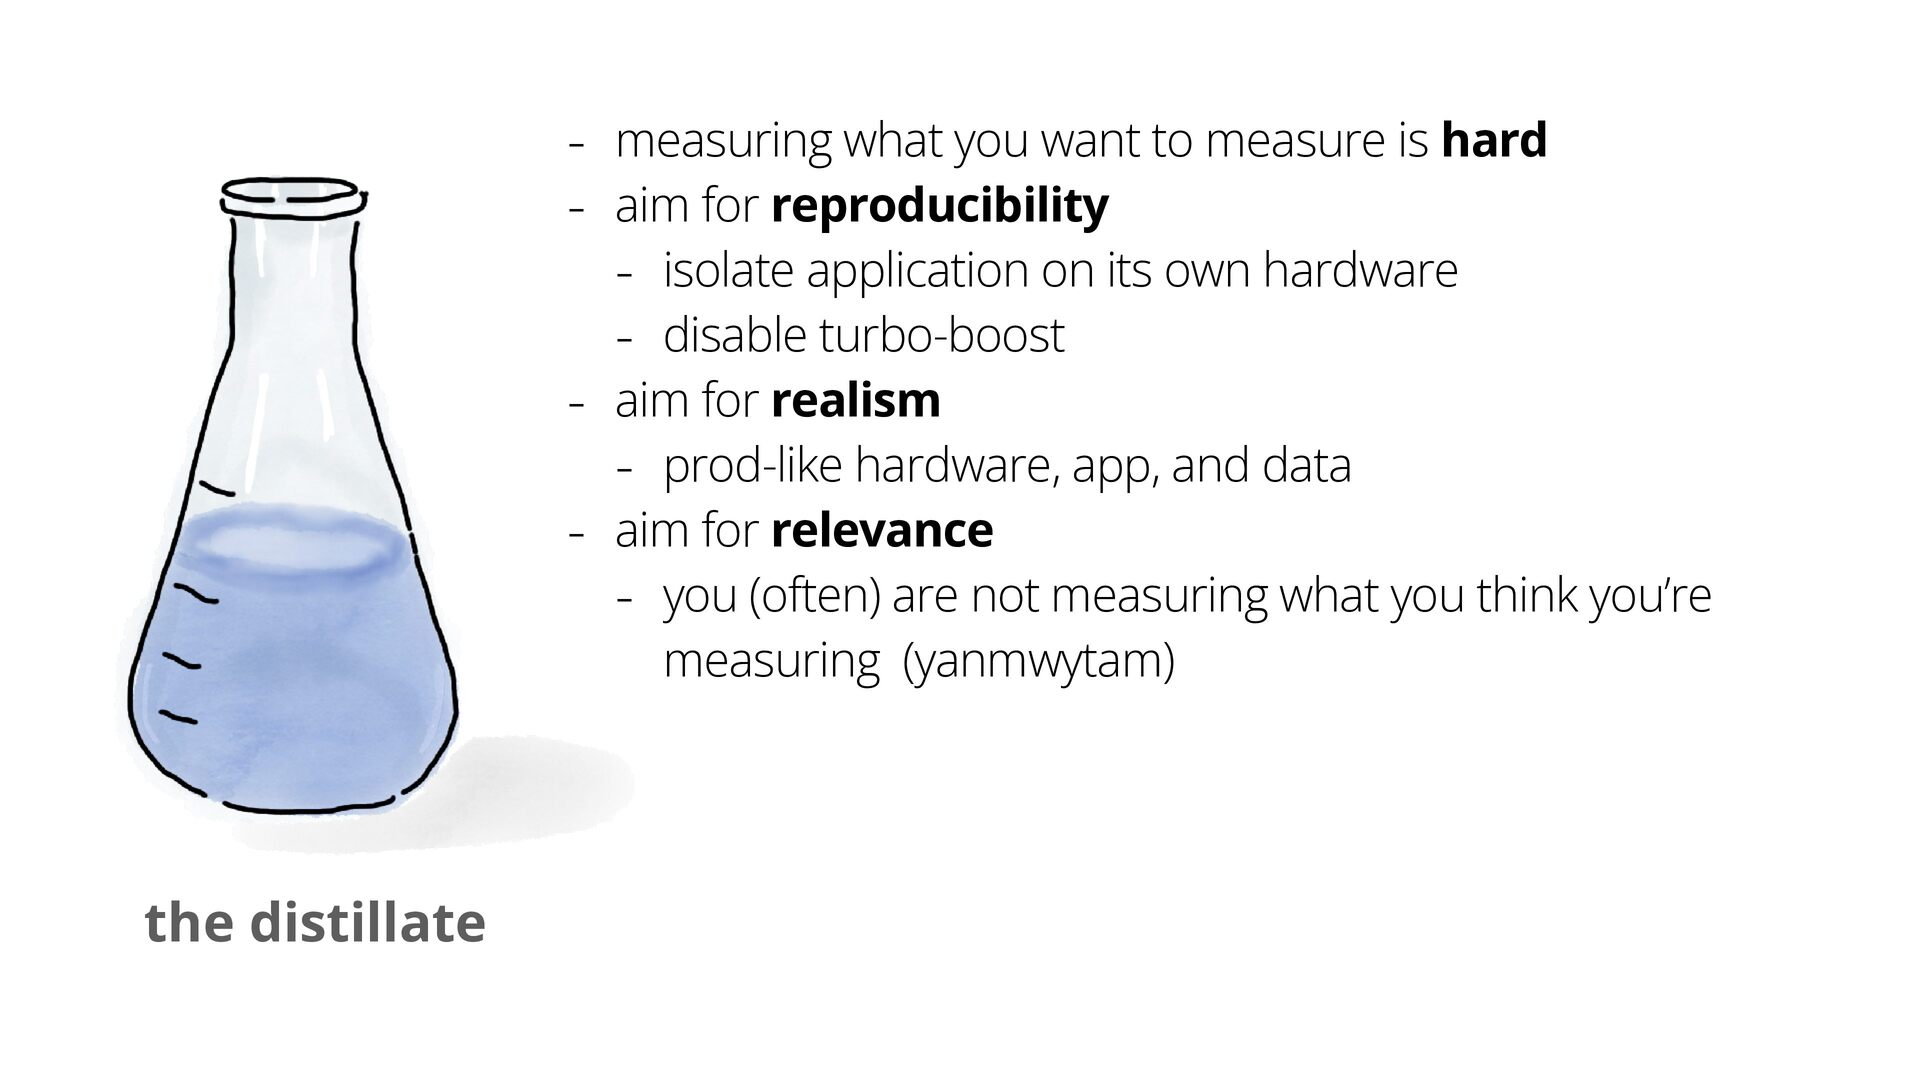
- measuring what you want to measure is hard -
aim for reproducibility - isolate application on its own hardware - disable turbo-boost - aim for realism - prod-like hardware, app, and data - aim for relevance - you (often) are not measuring what you think you’re measuring (yanmwytam) the distillate -
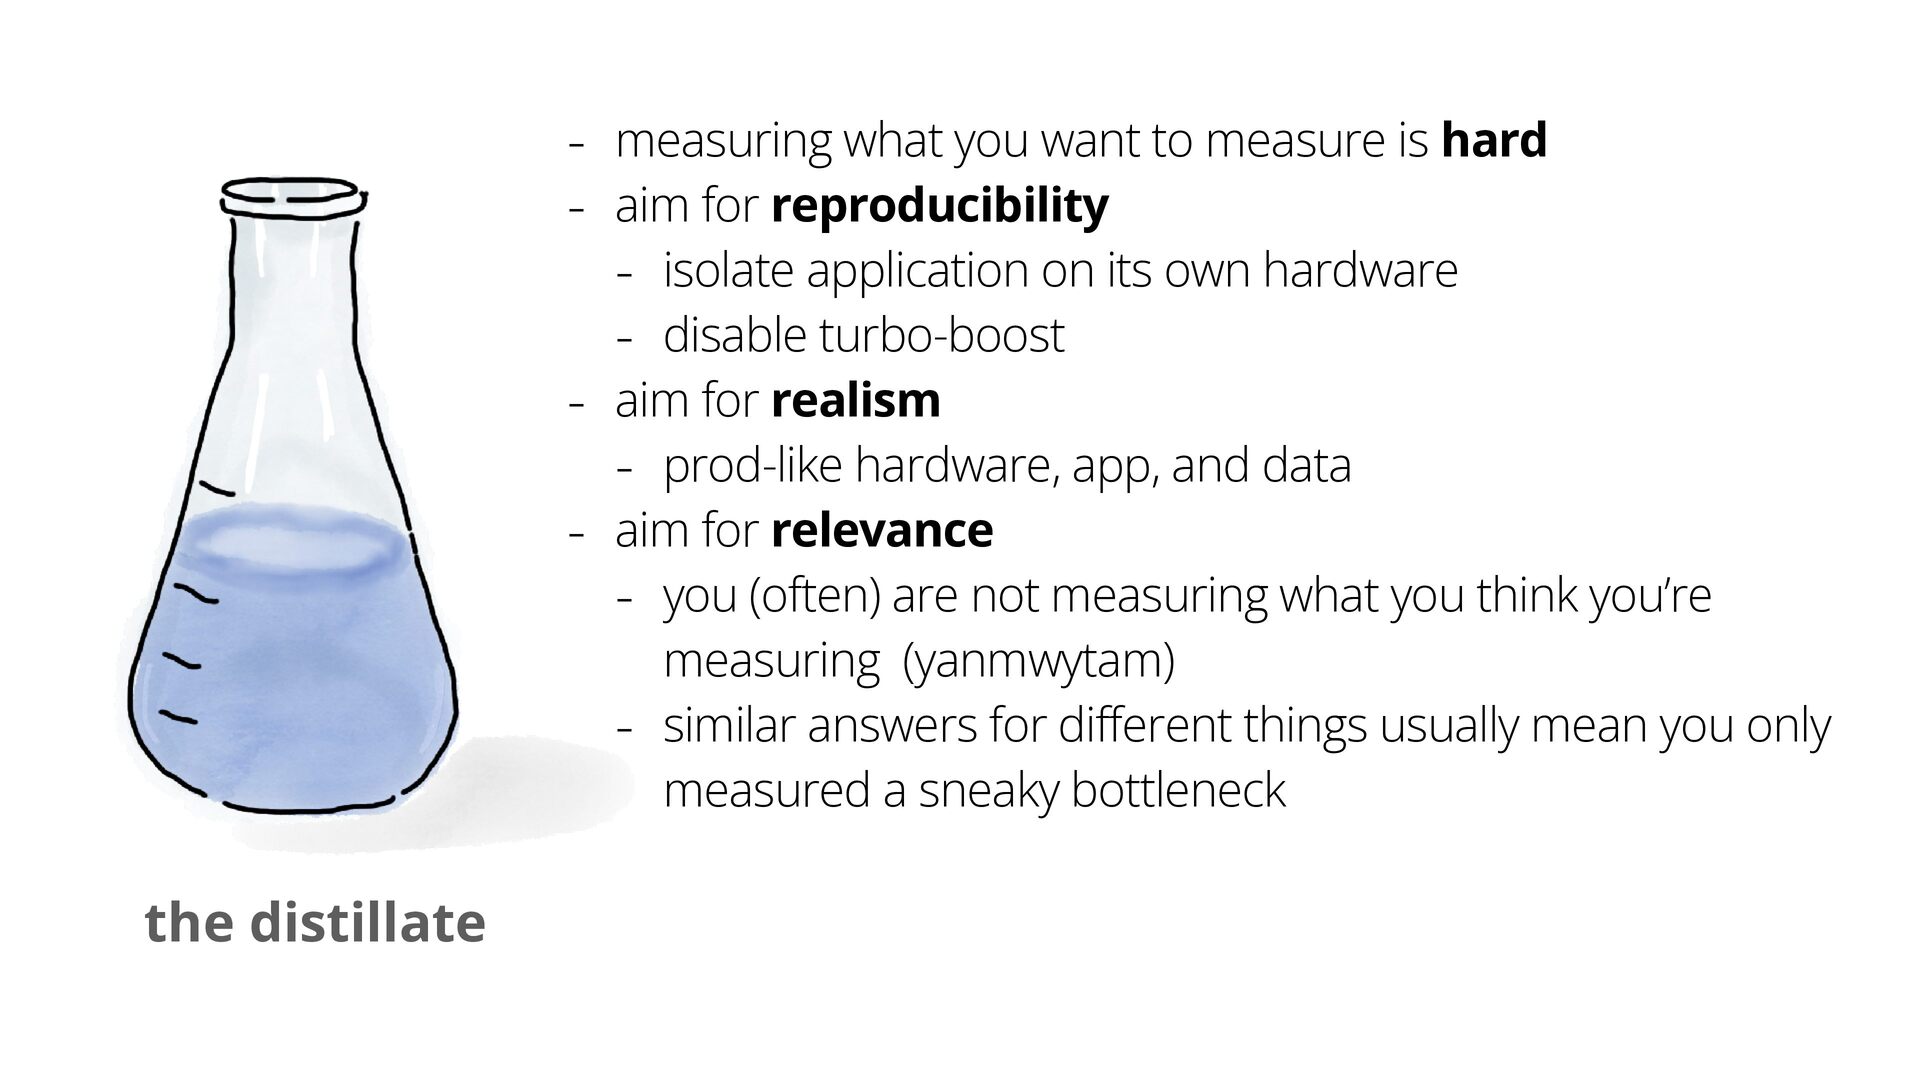
- measuring what you want to measure is hard -
aim for reproducibility - isolate application on its own hardware - disable turbo-boost - aim for realism - prod-like hardware, app, and data - aim for relevance - you (often) are not measuring what you think you’re measuring (yanmwytam) - similar answers for different things usually mean you only measured a sneaky bottleneck the distillate -
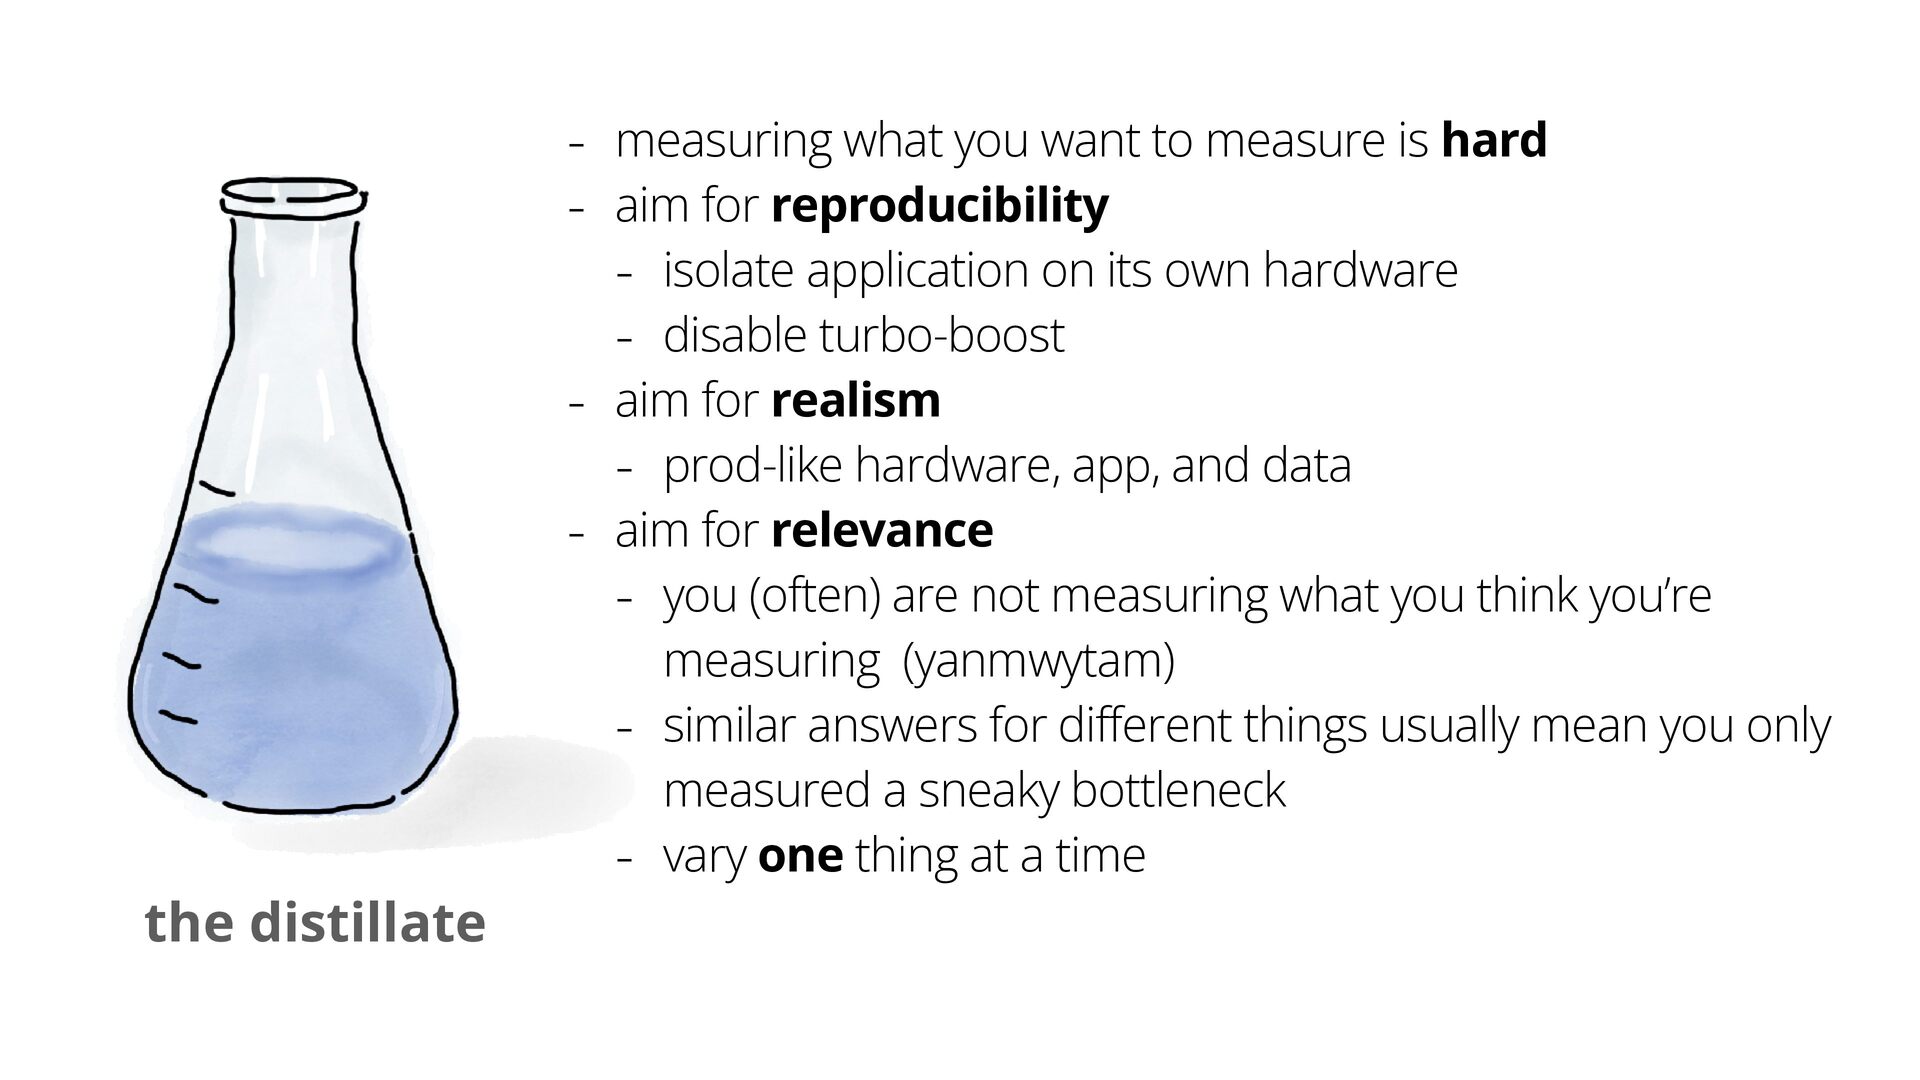
- measuring what you want to measure is hard -
aim for reproducibility - isolate application on its own hardware - disable turbo-boost - aim for realism - prod-like hardware, app, and data - aim for relevance - you (often) are not measuring what you think you’re the distillate measuring (yanmwytam) - similar answers for different things usually mean you only measured a sneaky bottleneck - vary one thing at a time -
- measuring what you want to measure is hard -
aim for reproducibility - isolate application on its own hardware - disable turbo-boost - aim for realism - prod-like hardware, app, and data - aim for relevance - you (often) are not measuring what you think you’re the distillate measuring (yanmwytam) - similar answers for different things usually mean you only measured a sneaky bottleneck - vary one thing at a time - validate measurements by active benchmarking -
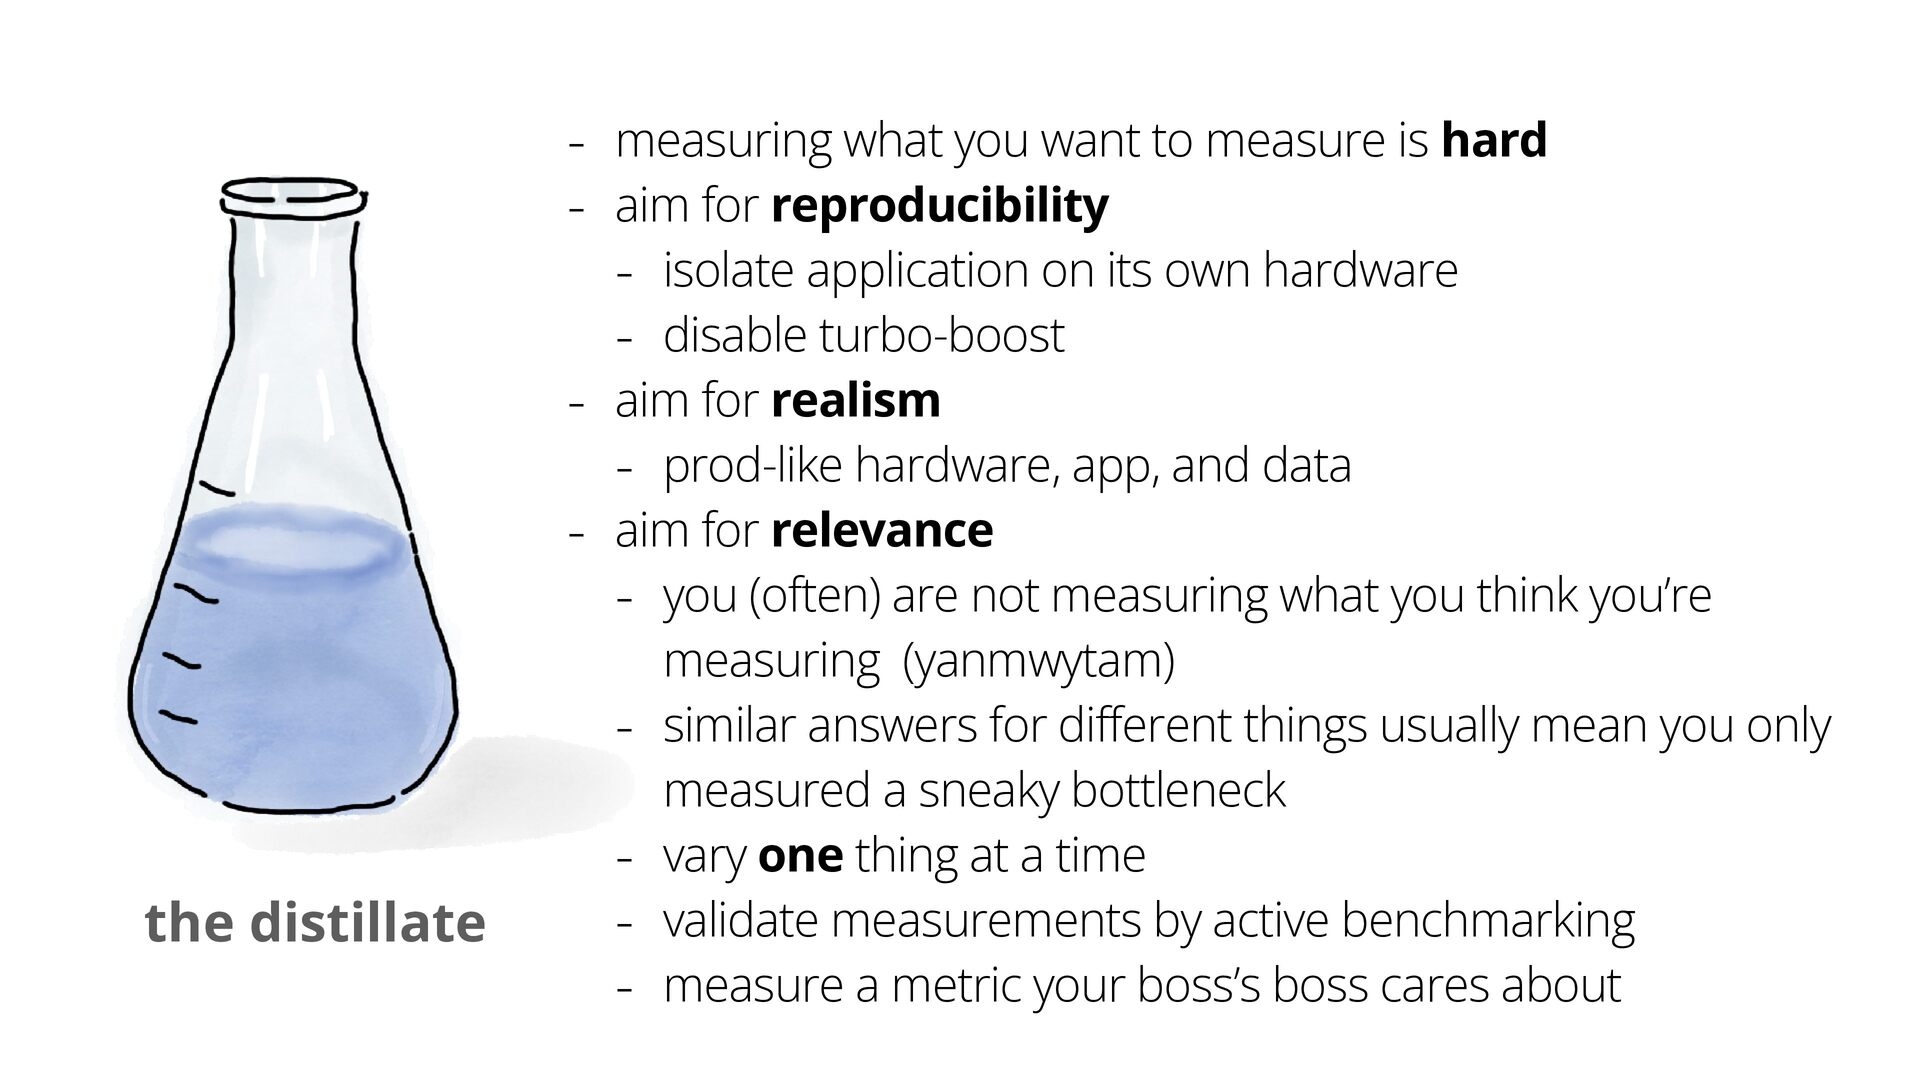
- measuring what you want to measure is hard -
aim for reproducibility - isolate application on its own hardware - disable turbo-boost - aim for realism - prod-like hardware, app, and data - aim for relevance - you (often) are not measuring what you think you’re the distillate measuring (yanmwytam) - similar answers for different things usually mean you only measured a sneaky bottleneck - vary one thing at a time - validate measurements by active benchmarking - measure a metric your boss’s boss cares about