Upgrade to Pro — share decks privately, control downloads, hide ads and more …

System Performance Analysis: From Case Study to...

System Performance Analysis: From Case Study to BPF tool

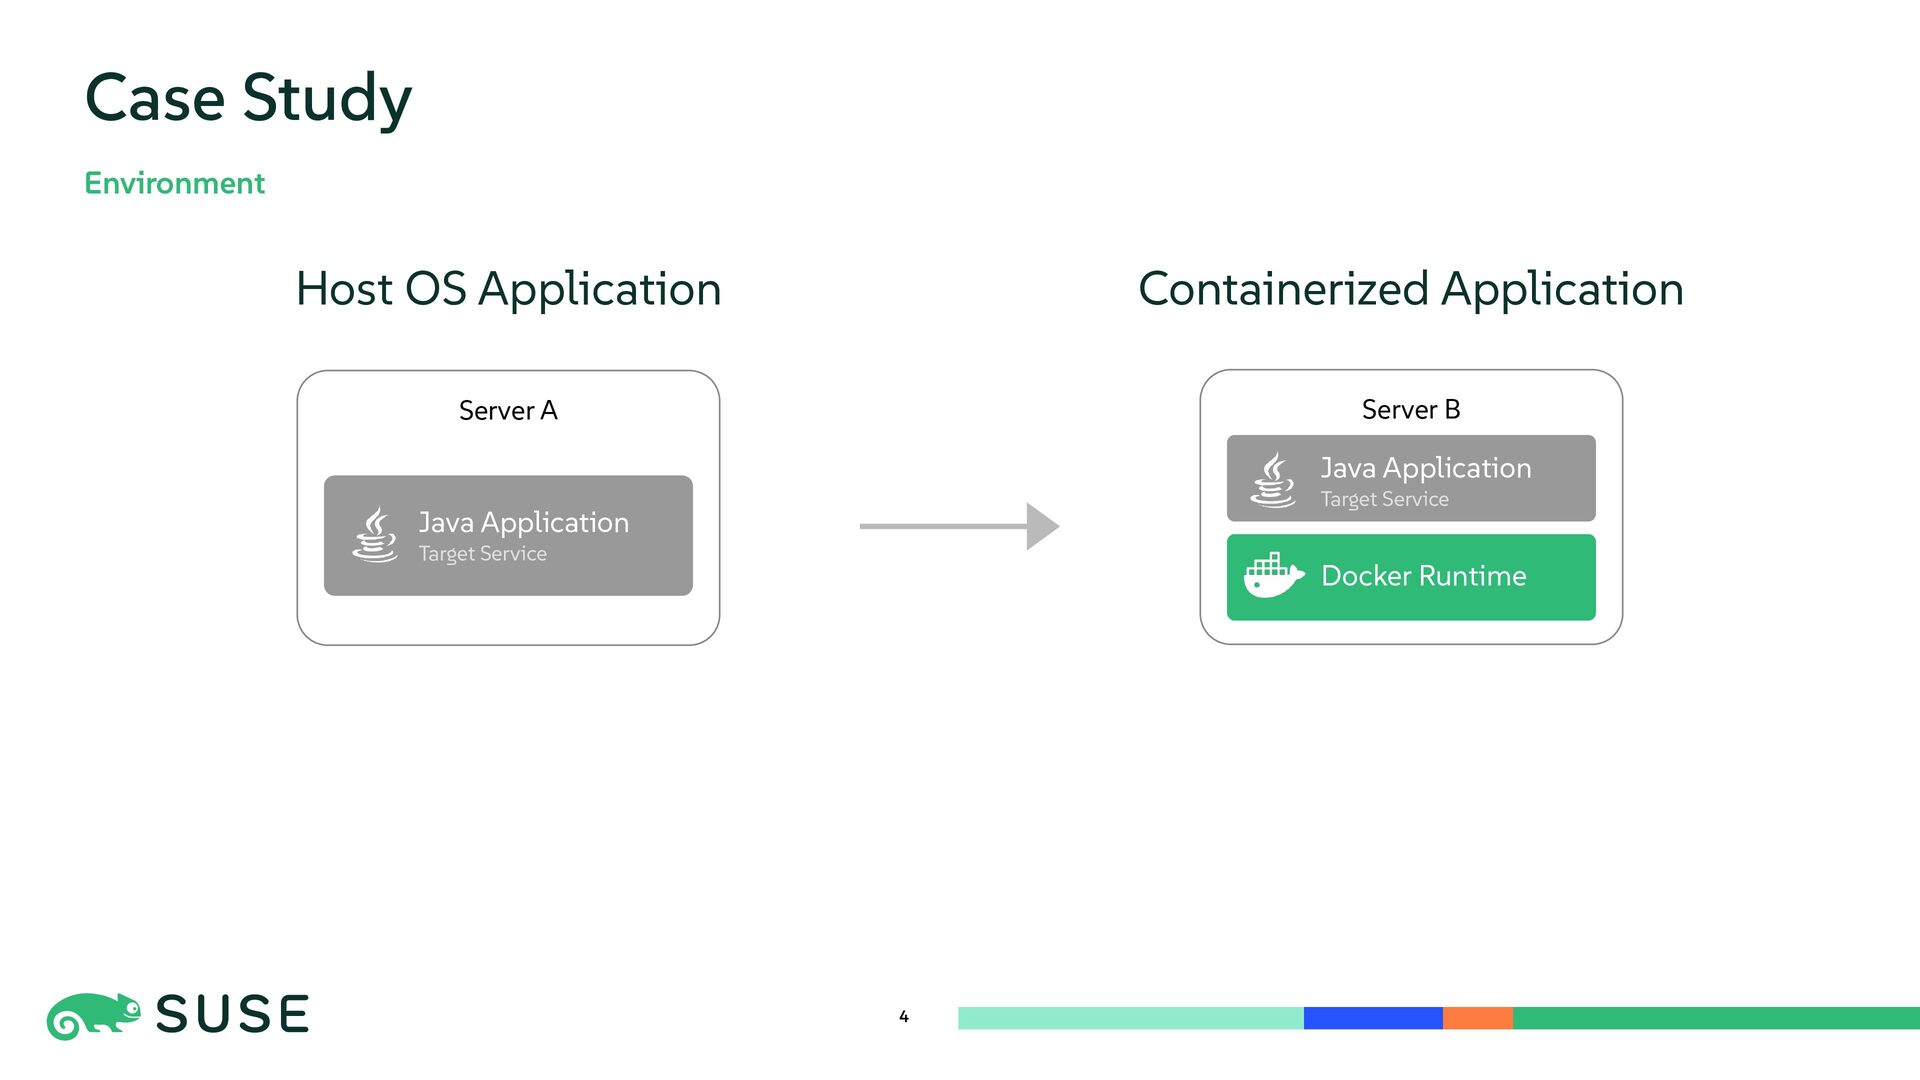
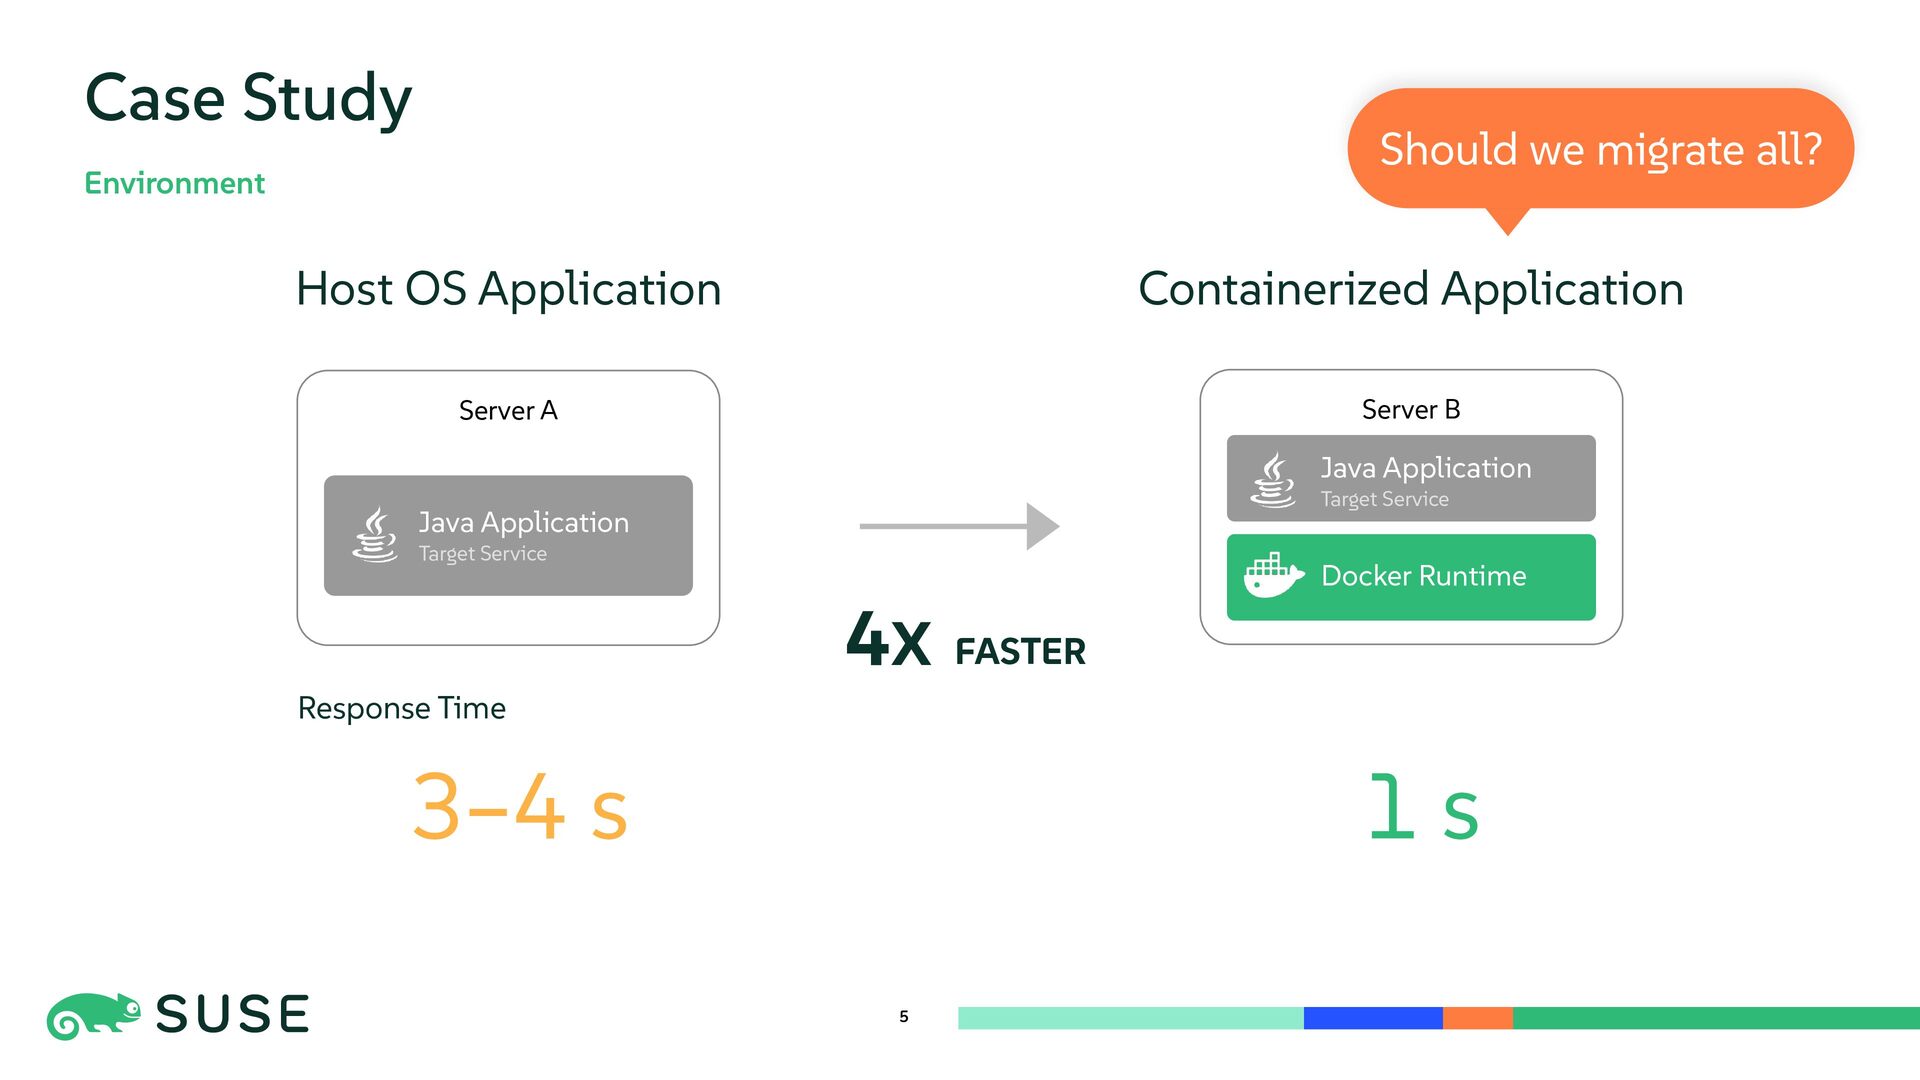
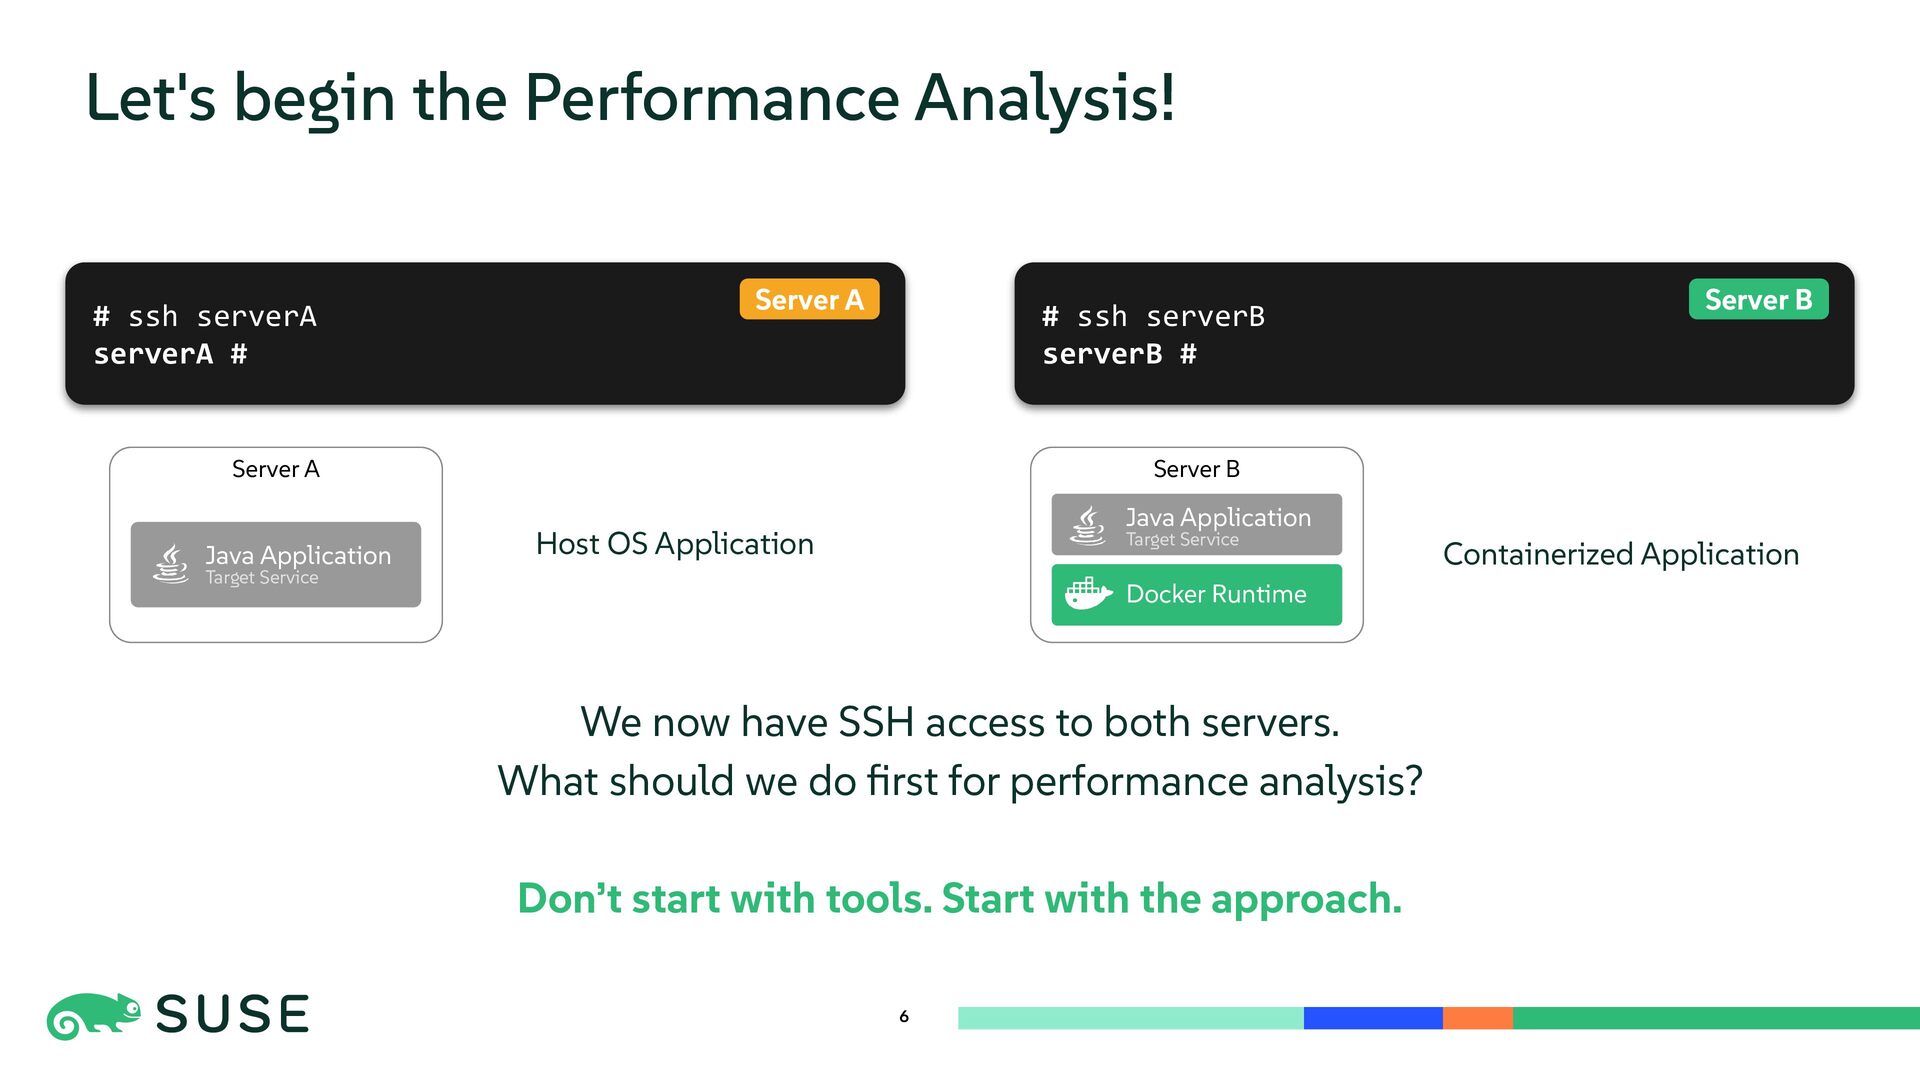
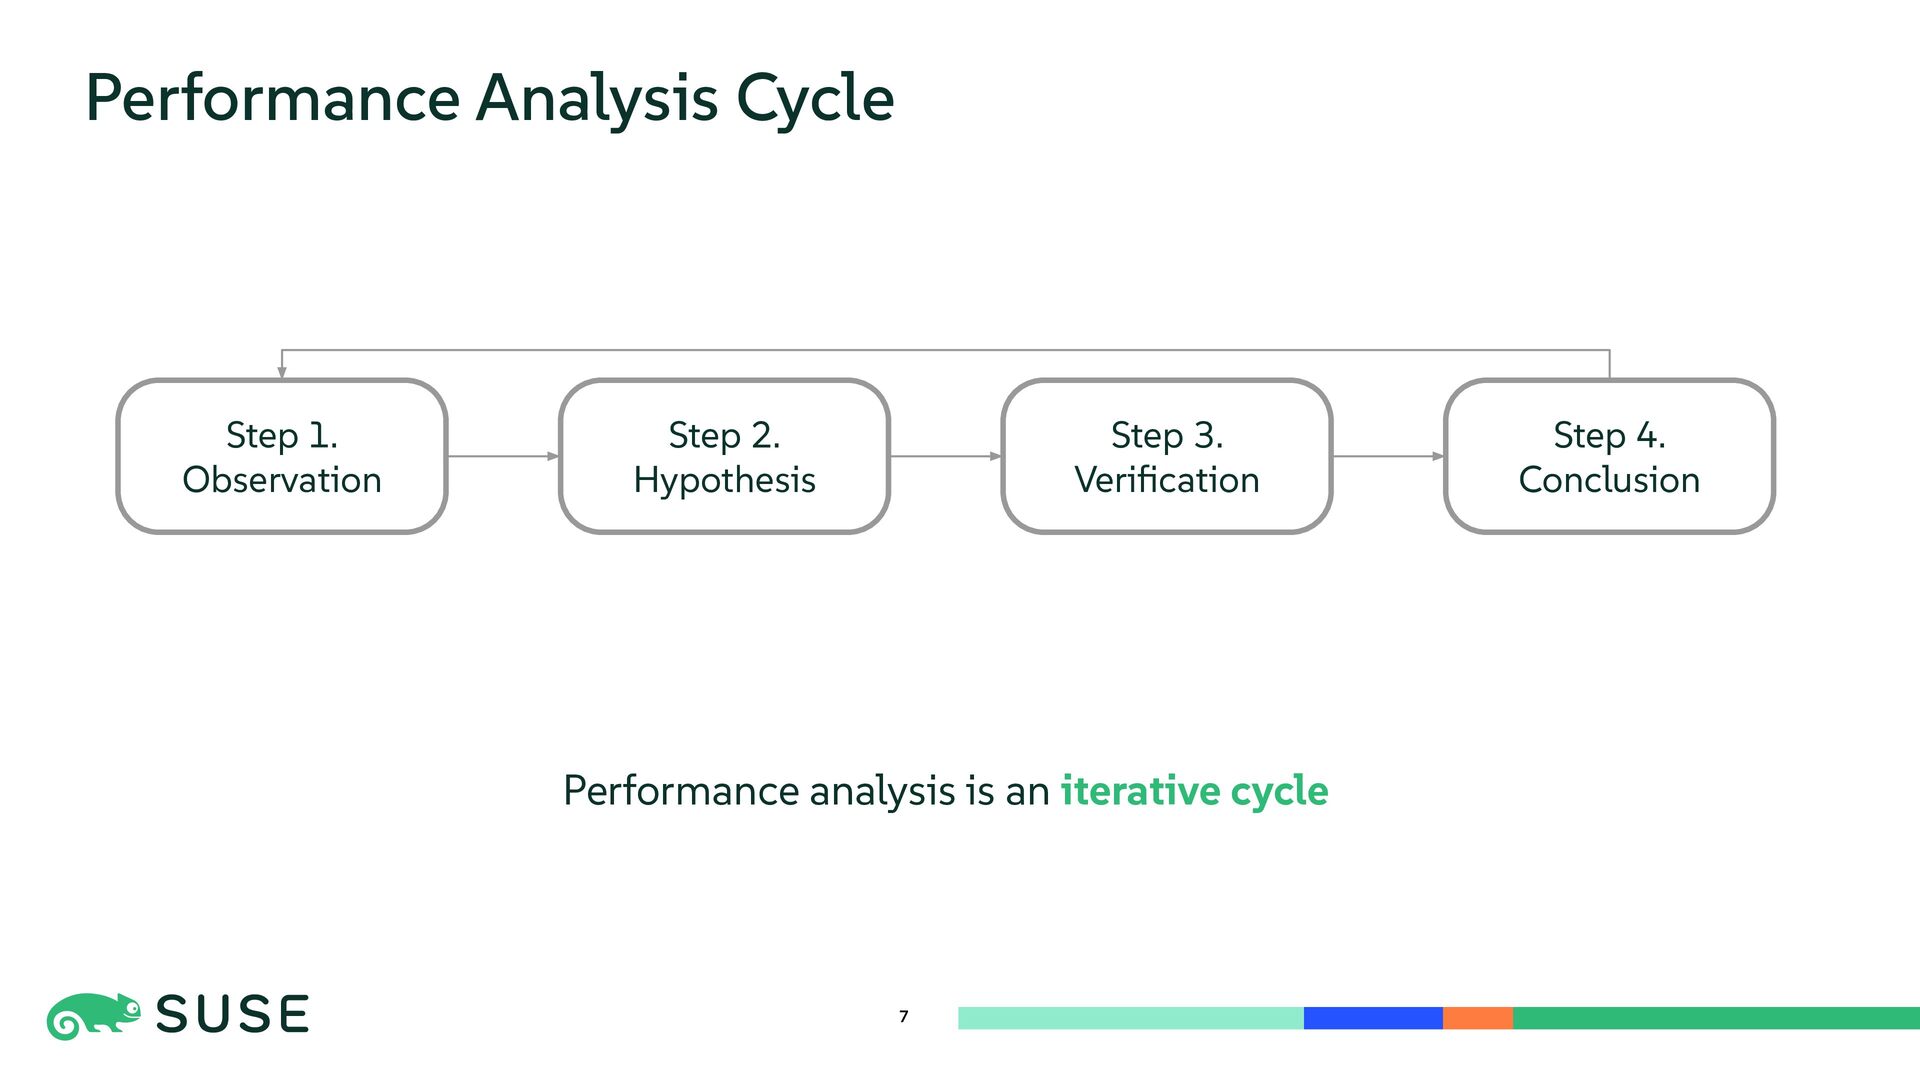
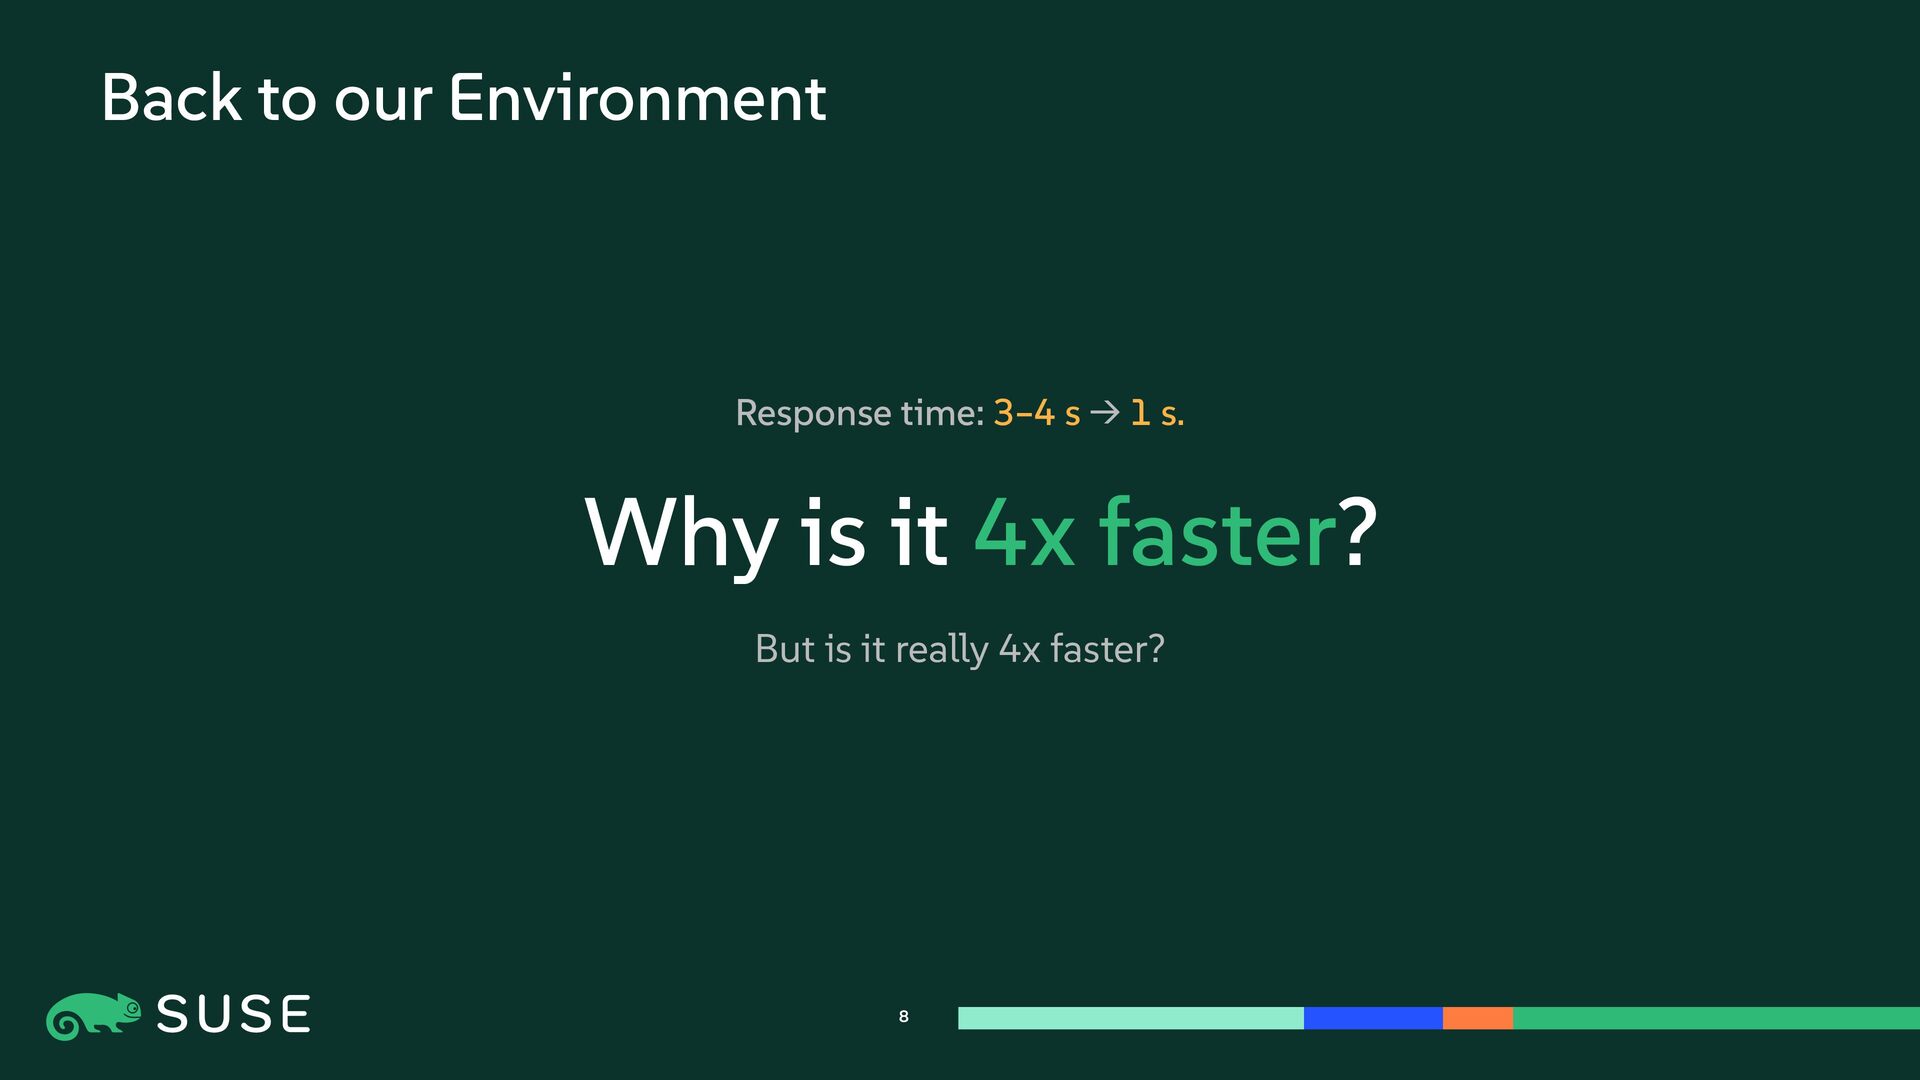
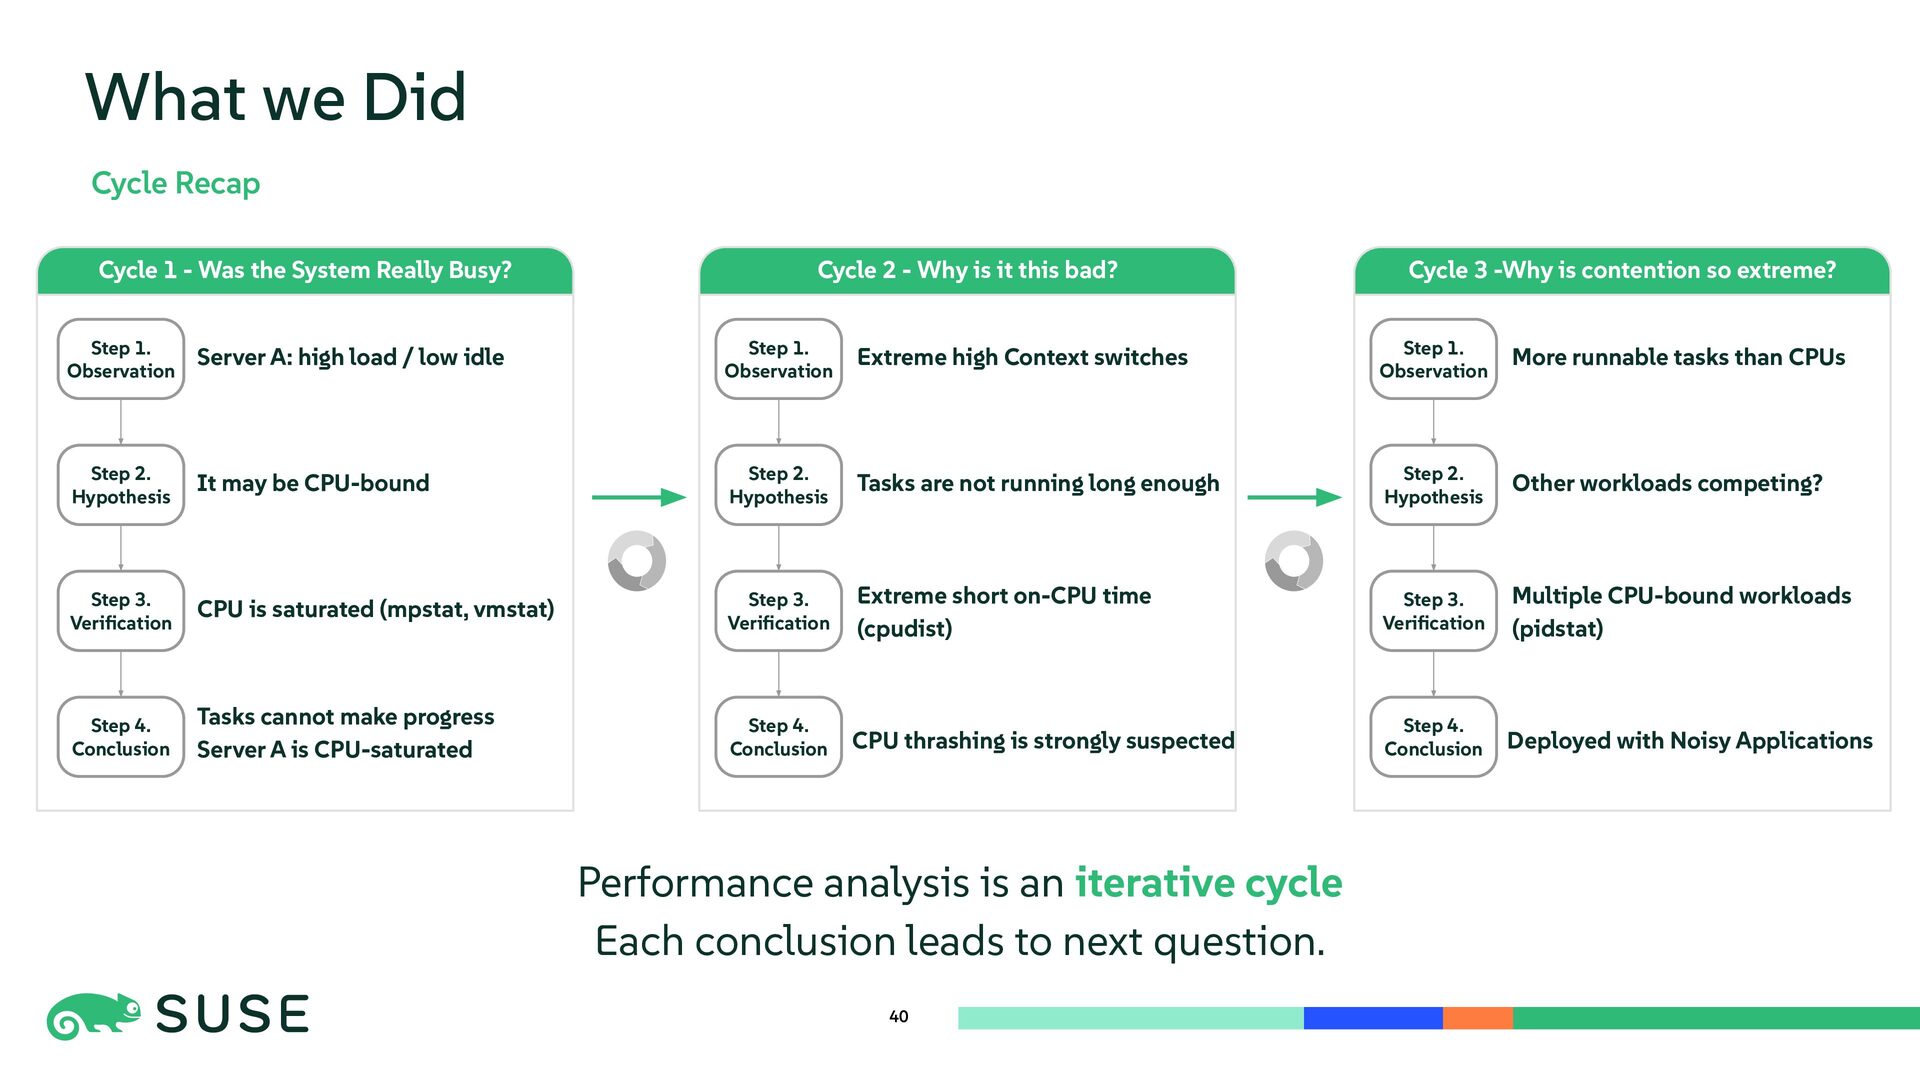
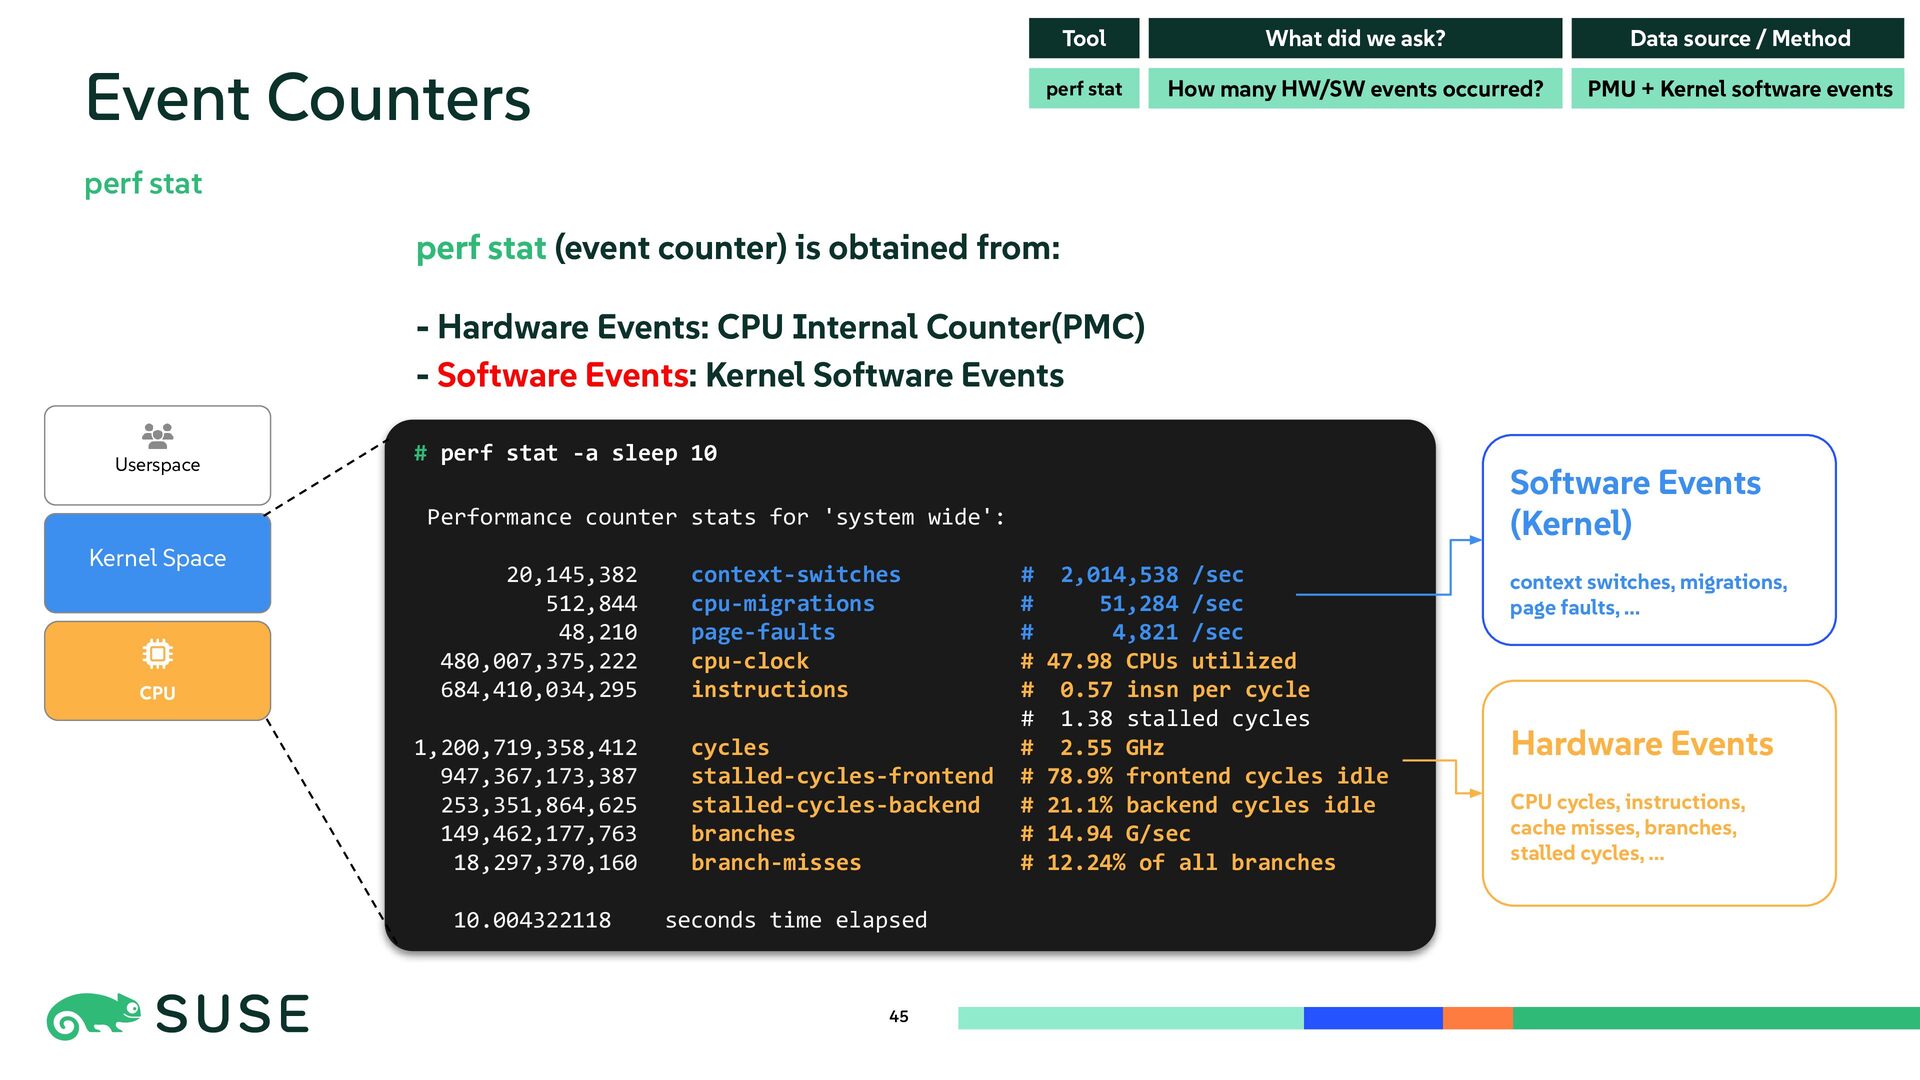
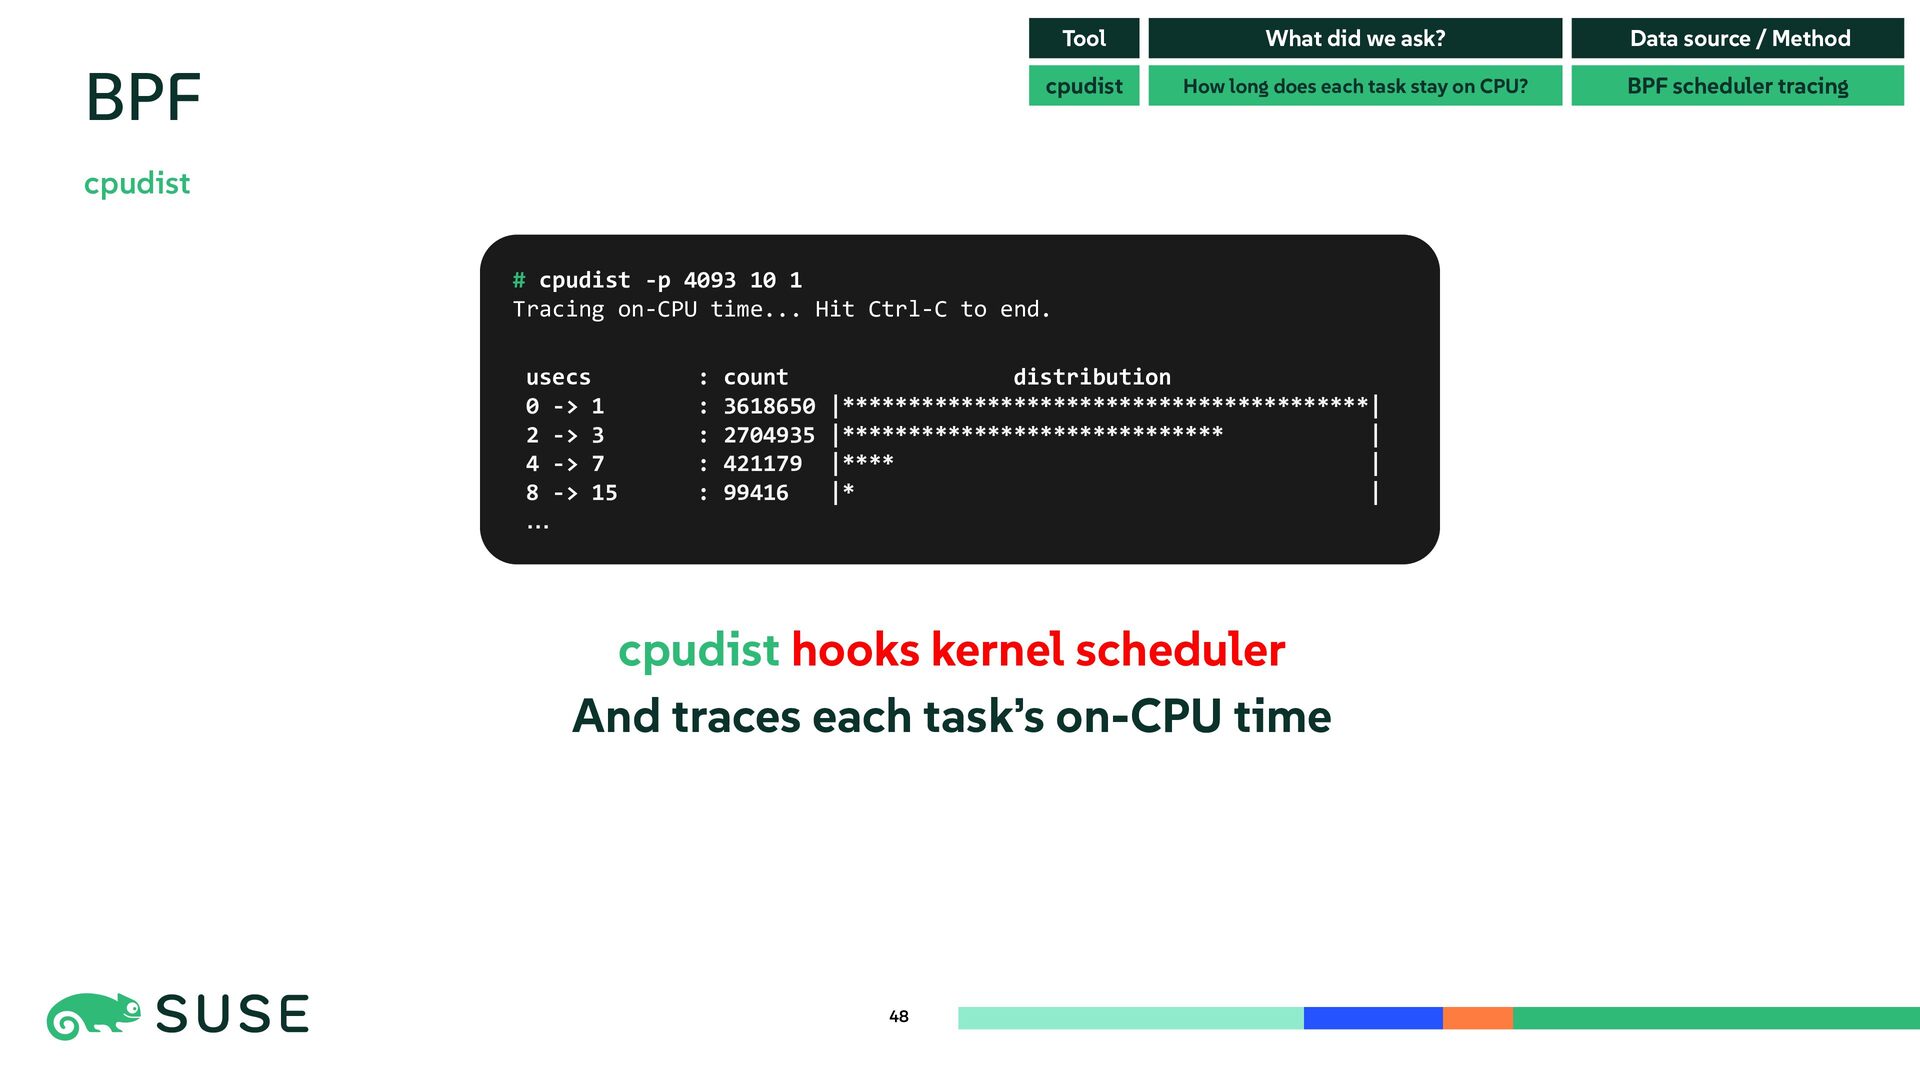
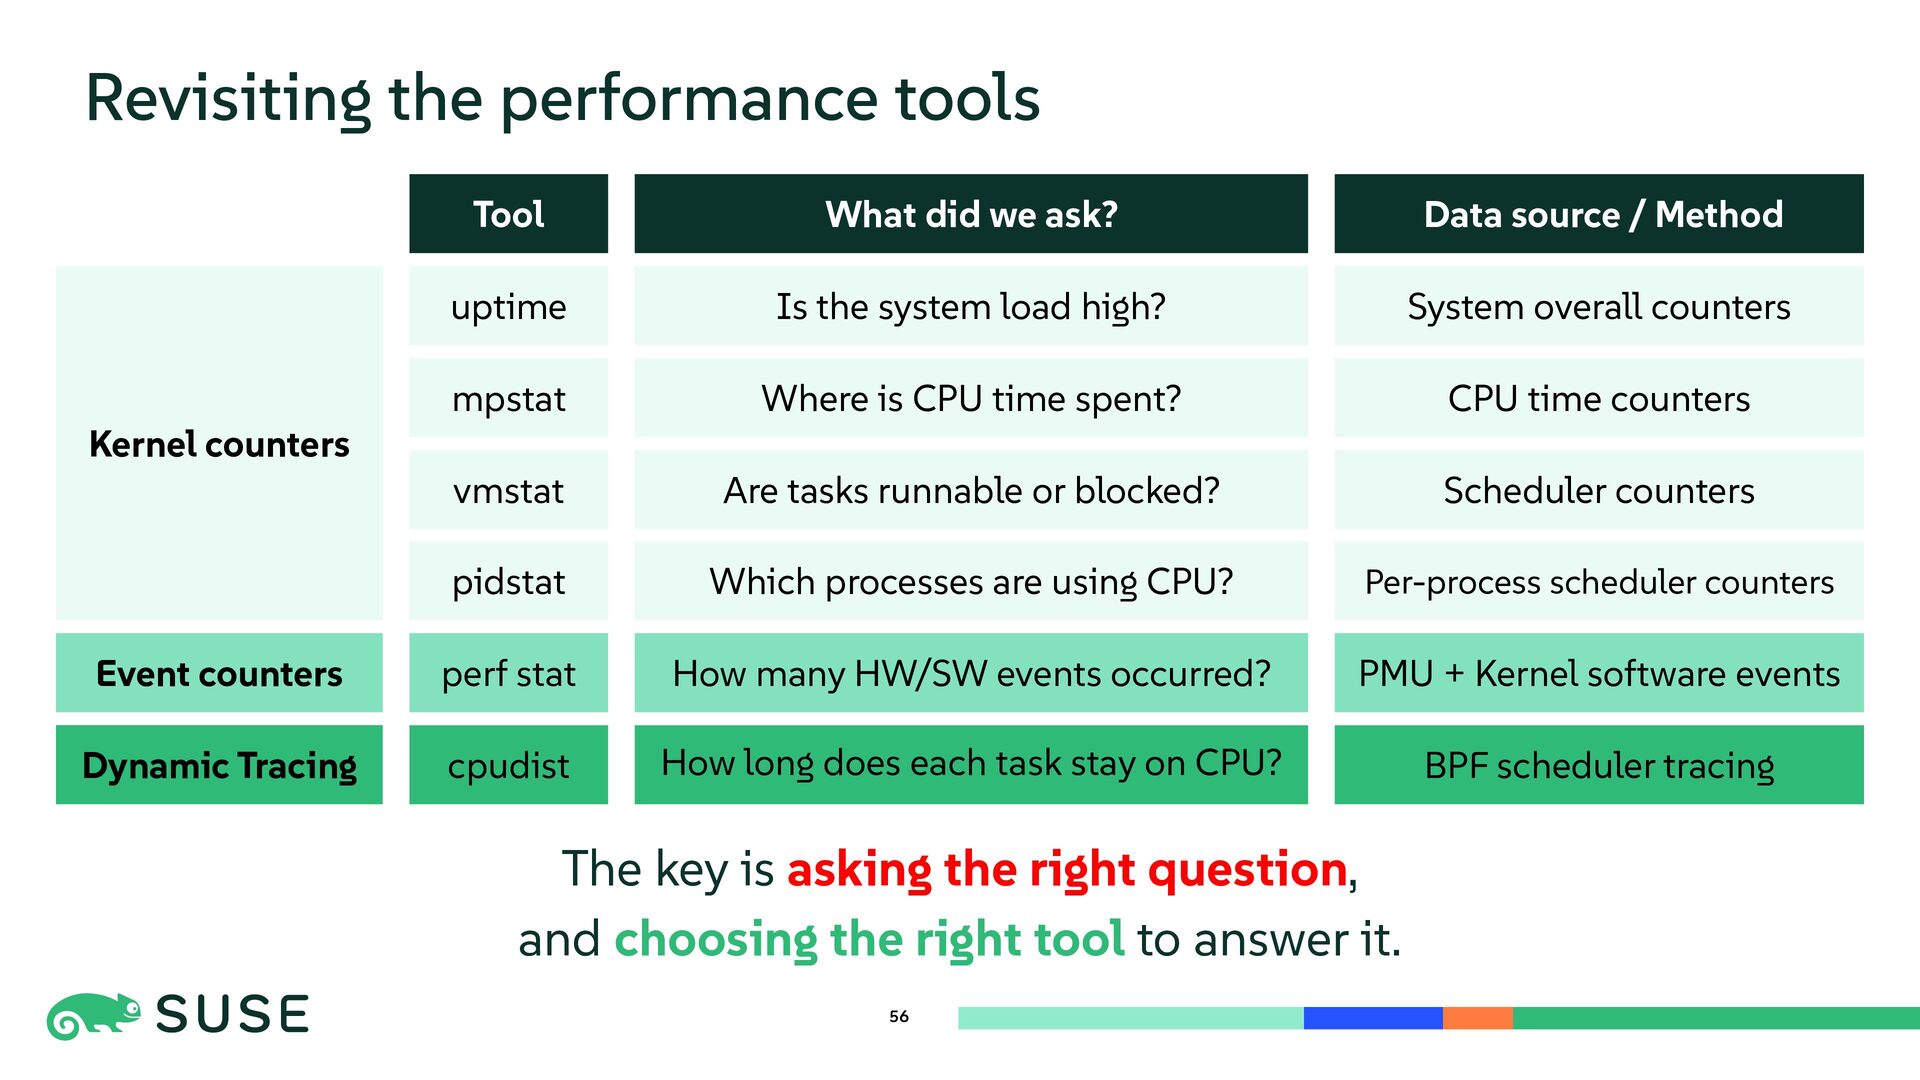
This session walks through a real-world system performance investigation centered on an unexpected speedup observed during a container migration. What initially appeared to be a straightforward performance improvement gradually revealed itself to be extreme CPU thrashing on the original server. Through an iterative investigation process, the root cause was traced to CPU saturation and severe resource contention introduced by noisy applications sharing the same host. The talk also introduces the observability tools used throughout the analysis, ranging from standard counters such as uptime and perf stat to BPF-based dynamic tracing.

Avatar for Hoyeon Lee

Hoyeon Lee

May 27, 2026

More Decks by Hoyeon Lee

Other Decks in Technology

Transcript

  1. 3 Objectives Assume you are a System Performance Engineer. You

    are given a Performance analysis request from service team. Your job is to figure out: What is happening Why it is happening How to prove it   
  2. 4 Case Study Environment Host OS Application Containerized Application Server

    B Server A Java Application Target Service Docker Runtime Java Application Target Service
  3. 5 Case Study Environment 3–4 s Response Time 1 s

    4X FASTER Should we migrate all? Host OS Application Containerized Application Server B Server A Java Application Target Service Docker Runtime Java Application Target Service
  4. # ssh serverB serverB # 6 Let's begin the Performance

    Analysis! We now have SSH access to both servers. What should we do first for performance analysis? Don’t start with tools. Start with the approach. # ssh serverA serverA # Server A Host OS Application Containerized Application Server B Server A Java Application Target Service Docker Runtime Java Application Target Service Server B
  5. 7 Performance Analysis Cycle Step 2. Hypothesis Step 3. Verification

    Step 4. Conclusion Step 1. Observation Performance analysis is an iterative cycle
  6. 8 Back to our Environment Response time: 3–4 s →

    1 s. Why is it 4x faster? But is it really 4x faster?
  7. 9 Cycle 1 - Question Before digging deeper, Is the

    system actually busy? Step 2. Hypothesis Step 3. Verification Step 4. Conclusion Step 1. Observation
  8. 10 Cycle 1 - Observation uptime # uptime 22:06:24 up

    91 days, 23:52, 1 user, load average: 17.94, 16.92, 16.62 # uptime 22:07:23 up 15 days, 5:01, 1 user, load average: 85.09, 89.25, 91.26 Server A Server B Step 2. Hypothesis Step 3. Verification Step 4. Conclusion Step 1. Observation Is the system actually busy?
  9. 11 Cycle 1 - Observation # uptime 22:07:23 up 15

    days, 5:01, 1 user, load average: 85.09, 89.25, 91.26 Current Time Logged-in Users uptime Number of tasks waiting to run (CPU + I/O) uptime 1-min avg 5-min avg 15-min avg Step 2. Hypothesis Step 3. Verification Step 4. Conclusion Step 1. Observation Is the system actually busy?
  10. 12 Cycle 1 - Observation uptime Server A is abnormally

    busy. # uptime 22:06:24 up 91 days, 23:52, 1 user, load average: 17.94, 16.92, 16.62 # uptime 22:07:23 up 15 days, 5:01, 1 user, load average: 85.09, 89.25, 91.26 Server A Server B Step 2. Hypothesis Step 3. Verification Step 4. Conclusion Step 1. Observation Is the system actually busy?
  11. 13 Cycle 1 - Hypothesis uptime Server A is abnormally

    busy. “But what kind of load is this? CPU or I/O?” uptime cannot determine type of workload # uptime 22:06:24 up 91 days, 23:52, 1 user, load average: 17.94, 16.92, 16.62 # uptime 22:07:23 up 15 days, 5:01, 1 user, load average: 85.09, 89.25, 91.26 Server A Server B Step 3. Verification Step 4. Conclusion Is the system actually busy? Step 2. Hypothesis Step 1. Observation
  12. 14 Cycle 1 - Verification (CPU View) mpstat # mpstat

    10 Linux 4.19.26 ... (64 CPU) CPU %usr %nice %sys %iowait %irq %soft %steal %guest %gnice %idle all 23.21 0.01 0.32 0.00 0.00 0.10 0.00 0.00 0.00 76.37 all 20.21 0.00 0.38 0.00 0.00 0.08 0.00 0.00 0.00 79.33 all 21.58 0.00 0.39 0.00 0.00 0.10 0.00 0.00 0.00 77.92 all 21.57 0.01 0.39 0.02 0.00 0.09 0.00 0.00 0.00 77.93 all 20.93 0.00 0.35 0.00 0.00 0.09 0.00 0.00 0.00 78.63 Average: all 21.50 0.00 0.36 0.00 0.00 0.09 0.00 0.00 0.00 78.04 # mpstat 10 Linux 4.4.0-130-generic (48 CPU) CPU %usr %nice %sys %iowait %irq %soft %steal %guest %gnice %idle all 89.72 0.00 7.84 0.00 0.00 0.04 0.00 0.00 0.00 2.40 all 88.60 0.00 9.18 0.00 0.00 0.05 0.00 0.00 0.00 2.17 all 89.71 0.00 9.01 0.00 0.00 0.05 0.00 0.00 0.00 1.23 all 89.55 0.00 8.11 0.00 0.00 0.06 0.00 0.00 0.00 2.28 all 89.87 0.00 8.21 0.00 0.00 0.05 0.00 0.00 0.00 1.86 Average: all 89.49 0.00 8.47 0.00 0.00 0.05 0.00 0.00 0.00 1.99 Server A Server B Is the system actually busy? Step 1. Observation Step 2. Hypothesis Step 3. Verification Step 4. Conclusion
  13. 15 Cycle 1 - Verification (CPU View) mpstat # mpstat

    10 Linux 4.4.0-130-generic (...) 07/18/2019 (48 CPU) 10:07:55 PM CPU %usr %nice %sys %iowait %irq %soft %steal %guest %gnice %idle 10:08:05 PM all 89.72 0.00 7.84 0.00 0.00 0.04 0.00 0.00 0.00 2.40 10:08:15 PM all 88.60 0.00 9.18 0.00 0.00 0.05 0.00 0.00 0.00 2.17 10:08:25 PM all 89.71 0.00 9.01 0.00 0.00 0.05 0.00 0.00 0.00 1.23 10:08:35 PM all 89.55 0.00 8.11 0.00 0.00 0.06 0.00 0.00 0.00 2.28 10:08:45 PM all 89.87 0.00 8.21 0.00 0.00 0.05 0.00 0.00 0.00 1.86 Average: all 89.49 0.00 8.47 0.00 0.00 0.05 0.00 0.00 0.00 1.99 Is the system actually busy? Step 1. Observation Step 2. Hypothesis Step 3. Verification Step 4. Conclusion User I/O Wait Kernel Idle
  14. 16 Cycle 1 - Verification (CPU View) mpstat Is the

    system actually busy? Step 1. Observation Step 2. Hypothesis Step 3. Verification Step 4. Conclusion # mpstat 10 Linux 4.19.26 ... (64 CPU) CPU %usr %nice %sys %iowait %irq %soft %steal %guest %gnice %idle all 23.21 0.01 0.32 0.00 0.00 0.10 0.00 0.00 0.00 76.37 all 20.21 0.00 0.38 0.00 0.00 0.08 0.00 0.00 0.00 79.33 all 21.58 0.00 0.39 0.00 0.00 0.10 0.00 0.00 0.00 77.92 all 21.57 0.01 0.39 0.02 0.00 0.09 0.00 0.00 0.00 77.93 all 20.93 0.00 0.35 0.00 0.00 0.09 0.00 0.00 0.00 78.63 Average: all 21.50 0.00 0.36 0.00 0.00 0.09 0.00 0.00 0.00 78.04 # mpstat 10 Linux 4.4.0-130-generic (48 CPU) CPU %usr %nice %sys %iowait %irq %soft %steal %guest %gnice %idle all 89.72 0.00 7.84 0.00 0.00 0.04 0.00 0.00 0.00 2.40 all 88.60 0.00 9.18 0.00 0.00 0.05 0.00 0.00 0.00 2.17 all 89.71 0.00 9.01 0.00 0.00 0.05 0.00 0.00 0.00 1.23 all 89.55 0.00 8.11 0.00 0.00 0.06 0.00 0.00 0.00 2.28 all 89.87 0.00 8.21 0.00 0.00 0.05 0.00 0.00 0.00 1.86 Average: all 89.49 0.00 8.47 0.00 0.00 0.05 0.00 0.00 0.00 1.99 Server B Server A Workload is CPU-bound Server A is CPU busy 0.0% iowait Low %idle on Server A usr 89.49 sys 0% 100% CPU time breakdown idle 78.04 0% 100% CPU time breakdown usr 21.50
  15. # vmstat 1 4 procs ----------memory---------- -swap- --io-- --system-- ------cpu-----

    r b swpd free buff cache si so bi bo in cs us sy id wa st 16 0 0 922144 26432 1488320 0 0 0 1 412 1021 21 1 78 0 0 18 0 0 921980 26432 1488412 0 0 0 0 405 987 22 1 77 0 0 17 0 0 922300 26432 1488504 0 0 0 0 420 1004 21 1 78 0 0 17 0 0 922144 26432 1488320 0 0 0 0 420 1014 21 1 78 0 0 # vmstat 1 4 procs ---------memory---------- -swap- ---io--- --system-- ------cpu----- r b swpd free buff cache si so bi bo in cs us sy id wa st 82 0 0 412384 18240 905120 0 0 1 2 980 46231 89 9 2 0 0 79 0 0 410912 18240 905376 0 0 0 1 1024 47128 88 10 2 0 0 84 1 0 411108 18240 905440 0 0 3 1 995 45802 90 8 2 0 0 85 0 0 410700 18240 905612 0 0 0 0 1008 46614 89 9 2 0 0 17 Cycle 1 - Verification (Task View) vmstat Server B Server A Is the system actually busy? Step 1. Observation Step 2. Hypothesis Step 3. Verification Step 4. Conclusion
  16. 18 Cycle 1 - Verification (Task View) vmstat # vmstat

    1 4 procs ---------memory---------- -swap- ---io--- --system-- ------cpu----- r b swpd free buff cache si so bi bo in cs us sy id wa st 82 0 0 412384 18240 905120 0 0 1 2 980 46231 89 9 2 0 0 79 0 0 410912 18240 905376 0 0 0 1 1024 47128 88 10 2 0 0 84 1 0 411108 18240 905440 0 0 3 1 995 45802 90 8 2 0 0 85 0 0 410700 18240 905612 0 0 0 0 1008 46614 89 9 2 0 0 Is the system actually busy? Step 1. Observation Step 2. Hypothesis Step 3. Verification Step 4. Conclusion r: runnable tasks waiting for CPU b: tasks blocked, waiting for I/O or external resources
  17. # mpstat 10 Linux 4.19.26 ... (64 CPU) … #

    vmstat 1 4 procs ----------memory---------- -swap- --io-- --system-- ------cpu----- r b swpd free buff cache si so bi bo in cs us sy id wa st 16 0 0 922144 26432 1488320 0 0 0 1 412 1021 21 1 78 0 0 18 0 0 921980 26432 1488412 0 0 0 0 405 987 22 1 77 0 0 17 0 0 922300 26432 1488504 0 0 0 0 420 1004 21 1 78 0 0 17 0 0 922144 26432 1488320 0 0 0 0 420 1014 21 1 78 0 0 # mpstat 10 Linux 4.4.0-130-generic (48 CPU) … # vmstat 1 4 procs ---------memory---------- -swap- ---io--- --system-- ------cpu----- r b swpd free buff cache si so bi bo in cs us sy id wa st 82 0 0 412384 18240 905120 0 0 1 2 980 46231 89 9 2 0 0 79 0 0 410912 18240 905376 0 0 0 1 1024 47128 88 10 2 0 0 84 1 0 411108 18240 905440 0 0 3 1 995 45802 90 8 2 0 0 85 0 0 410700 18240 905612 0 0 0 0 1008 46614 89 9 2 0 0 19 Cycle 1 - Verification (Task View) vmstat Server B Server A Is the system actually busy? Step 1. Observation Step 2. Hypothesis Step 3. Verification Step 4. Conclusion 48 CPU 85 Tasks 1.77 = 64 CPU 17 Tasks 0.26 = CPU Tasks CPU Tasks Server A is not ‘just busy’. It is CPU-saturated!
  18. Cycle 1 - Conclusion 20 Step 1. Observation Step 2.

    Hypothesis Step 3. Verification Step 4. Conclusion Host OS Application Containerized Application Server B Server A Java Application Target Service Docker Runtime Java Application Target Service Is the system actually busy? Yes, server A is CPU-saturated 4X FASTER Response: 3–4 s Response: 1 s
  19. Cycle 1 - Conclusion 21 Step 1. Observation Step 2.

    Hypothesis Step 3. Verification Step 4. Conclusion Is the system actually busy? Yes, server A is CPU-saturated Host OS Application Containerized Application Server B Server A Java Application Target Service Docker Runtime Java Application Target Service 4X FASTER This is not a 4x speedup Server A was 4x slower than normal 4X SLOWER Response: 1 s Response: 3–4 s
  20. 22 Cycle 2 - Question Step 2. Hypothesis Step 3.

    Verification Step 4. Conclusion Step 1. Observation If CPU is saturated, Why is it this bad?
  21. 23 Cycle 2 - Observation perf stat Step 2. Hypothesis

    Step 3. Verification Step 4. Conclusion Step 1. Observation If CPU is saturated, Why is it this bad? # perf stat -a sleep 10 Performance counter stats for 'system wide': 140,287,816,904 cpu-clock # 14.03 CPUs utilized 255,842,913,776 instructions # 1.52 insn per cycle # 0.66 stalled cycles per insn 10,842 context-switches # 1,084 /sec ... 10.002114908 seconds time elapsed # perf stat -a sleep 10 Performance counter stats for 'system wide': 480,007,375,222 cpu-clock # 47.98 CPUs utilized 684,410,034,295 instructions # 0.57 insn per cycle # 1.38 stalled cycles per insn 20,145,382 context-switches # 2,014,538 /sec ... 10.004322118 seconds time elapsed Server B Server A
  22. 24 Cycle 2 - Observation perf stat Step 2. Hypothesis

    Step 3. Verification Step 4. Conclusion Step 1. Observation If CPU is saturated, Why is it this bad? # perf stat -a sleep 10 Performance counter stats for 'system wide': 480,007,375,222 cpu-clock # 47.98 CPUs utilized 20,145,382 context-switches # 2,014,538 /sec 512,844 cpu-migrations # 51,284 /sec 48,210 page-faults # 4,821 /sec 684,410,034,295 instructions # 0.57 insn per cycle # 1.38 stalled cycles per insn 1,200,719,358,412 cycles # 2.55 GHz 947,367,173,387 stalled-cycles-frontend # 78.9% frontend cycles idle 253,351,864,625 stalled-cycles-backend # 21.1% backend cycles idle 149,462,177,763 branches # 14.94 G/sec 18,297,370,160 branch-misses # 12.24% of all branches 10.004322118 seconds time elapsed Context switches Instruction Per Cycle (IPC) Page Fault CPU utilization
  23. 2525 Cycle 2 - Observation perf stat Step 2. Hypothesis

    Step 3. Verification Step 4. Conclusion Step 1. Observation If CPU is saturated, Why is it this bad? # perf stat -a sleep 10 Performance counter stats for 'system wide': 140,287,816,904 cpu-clock # 14.03 CPUs utilized 255,842,913,776 instructions # 1.52 insn per cycle # 0.66 stalled cycles per insn 10,842 context-switches # 1,084 /sec ... 10.002114908 seconds time elapsed # perf stat -a sleep 10 Performance counter stats for 'system wide': 480,007,375,222 cpu-clock # 47.98 CPUs utilized 684,410,034,295 instructions # 0.57 insn per cycle # 1.38 stalled cycles per insn 20,145,382 context-switches # 2,014,538 /sec ... 10.004322118 seconds time elapsed Server B Server A Among the metrics, context switches stand out. (2M vs 1K)
  24. Among the metrics, context switches stand out. 26 Cycle 2

    - Hypothesis perf stat # perf stat -a sleep 10 Performance counter stats for 'system wide': 140,287,816,904 cpu-clock # 14.03 CPUs utilized 255,842,913,776 instructions # 1.52 insn per cycle # 0.66 stalled cycles per insn 10,842 context-switches # 1,084 /sec ... 10.002114908 seconds time elapsed # perf stat -a sleep 10 Performance counter stats for 'system wide': 480,007,375,222 cpu-clock # 47.98 CPUs utilized 684,410,034,295 instructions # 0.57 insn per cycle # 1.38 stalled cycles per insn 20,145,382 context-switches # 2,014,538 /sec ... 10.004322118 seconds time elapsed Server B Server A Frequent context switch may prevent tasks from running long enough. Step 3. Verification Step 4. Conclusion Step 2. Hypothesis Step 1. Observation If CPU is saturated, Why is it this bad? (2M vs 1K)
  25. 27 Cycle 2 - Verification cpudist # cpudist -p 1928219

    10 1 Tracing on-CPU time... Hit Ctrl-C to end. usecs : count distribution 0 -> 1 : 0 | | 2 -> 3 : 16 | | 4 -> 7 : 6 | | 8 -> 15 : 7 | | 16 -> 31 : 8 | | 32 -> 63 : 10 | | 64 -> 127 : 18 | | 128 -> 255 : 40 | | 256 -> 511 : 44 | | 512 -> 1023 : 156 |* | 1024 -> 2047 : 238 |** | 2048 -> 4095 : 4511 |****************************************| 4096 -> 8191 : 277 |** | 8192 -> 16383 : 286 |** | 16384 -> 32767 : 77 | | 32768 -> 65535 : 63 | | 65536 -> 131071 : 44 | | 131072 -> 262143 : 9 | | 262144 -> 524287 : 14 | | 524288 -> 1048575 : 5 | | # cpudist -p 4093 10 1 Tracing on-CPU time... Hit Ctrl-C to end. usecs : count distribution 0 -> 1 : 3618650 |****************************************| 2 -> 3 : 2704935 |***************************** | 4 -> 7 : 421179 |**** | 8 -> 15 : 99416 |* | 16 -> 31 : 16951 | | 32 -> 63 : 6355 | | 64 -> 127 : 3586 | | 128 -> 255 : 3400 | | 256 -> 511 : 4004 | | 512 -> 1023 : 4445 | | 1024 -> 2047 : 8173 | | 2048 -> 4095 : 9165 | | 4096 -> 8191 : 7194 | | 8192 -> 16383 : 11954 | | 16384 -> 32767 : 1426 | | 32768 -> 65535 : 967 | | 65536 -> 131071 : 338 | | 131072 -> 262143 : 93 | | 262144 -> 524287 : 28 | | 524288 -> 1048575 : 4 | | Server B Server A Step 2. Hypothesis Step 3. Verification Step 4. Conclusion Step 1. Observation If CPU is saturated, Why is it this bad?
  26. 28 Cycle 2 - Verification # cpudist -p 4093 10

    1 Tracing on-CPU time... Hit Ctrl-C to end. usecs : count distribution 0 -> 1 : 3618650 |****************************************| 2 -> 3 : 2704935 |***************************** | 4 -> 7 : 421179 |**** | 8 -> 15 : 99416 |* | … cpudist on-CPU duration Occurrences Visual bar chart of the count Step 2. Hypothesis Step 3. Verification Step 4. Conclusion Step 1. Observation If CPU is saturated, Why is it this bad?
  27. 29 Cycle 2 - Verification cpudist Step 2. Hypothesis Step

    3. Verification Step 4. Conclusion Step 1. Observation If CPU is saturated, Why is it this bad? # cpudist -p 4093 10 1 Tracing on-CPU time... Hit Ctrl-C to end. usecs : count distribution 0 -> 1 : 3618650 |****************************************| 2 -> 3 : 2704935 |***************************** | 4 -> 7 : 421179 |**** | 8 -> 15 : 99416 |* | 16 -> 31 : 16951 | | 32 -> 63 : 6355 | | 64 -> 127 : 3586 | | 128 -> 255 : 3400 | | 256 -> 511 : 4004 | | 512 -> 1023 : 4445 | | 1024 -> 2047 : 8173 | | 2048 -> 4095 : 9165 | | 4096 -> 8191 : 7194 | | 8192 -> 16383 : 11954 | | 16384 -> 32767 : 1426 | | 32768 -> 65535 : 967 | | 65536 -> 131071 : 338 | | 131072 -> 262143 : 93 | | 262144 -> 524287 : 28 | | 524288 -> 1048575 : 4 | | Server A Distribution 0~1 (µs) 0.5 ~ 1 (sec) mostly under ~16 µs
  28. # cpudist -p 1928219 10 1 Tracing on-CPU time... Hit

    Ctrl-C to end. usecs : count distribution 0 -> 1 : 0 | | 2 -> 3 : 16 | | 4 -> 7 : 6 | | 8 -> 15 : 7 | | 16 -> 31 : 8 | | 32 -> 63 : 10 | | 64 -> 127 : 18 | | 128 -> 255 : 40 | | 256 -> 511 : 44 | | 512 -> 1023 : 156 |* | 1024 -> 2047 : 238 |** | 2048 -> 4095 : 4511 |****************************************| 4096 -> 8191 : 277 |** | 8192 -> 16383 : 286 |** | 16384 -> 32767 : 77 | | 32768 -> 65535 : 63 | | 65536 -> 131071 : 44 | | 131072 -> 262143 : 9 | | 262144 -> 524287 : 14 | | 524288 -> 1048575 : 5 | | 30 Cycle 2 - Verification cpudist Step 2. Hypothesis Step 3. Verification Step 4. Conclusion Step 1. Observation If CPU is saturated, Why is it this bad? Server B Distribution 0~1 (µs) 0.5 ~ 1 (sec) Distribution 0~1 (µs) 0.5 ~ 1 (sec) mostly under ~16 µs around 1 ~ 8 ms
  29. Cycle 2 - Conclusion 31 Step 1. Observation Step 2.

    Hypothesis Step 3. Verification Step 4. Conclusion Host OS Application Containerized Application Server B Server A Java Application Target Service Docker Runtime Java Application Target Service 4X FASTER 4X SLOWER Response: 1 s Response: 3–4 s If CPU is saturated, Why is it this bad? Due to high Context Switches! (2M vs 1K)
  30. Cycle 2 - Conclusion 32 Step 1. Observation Step 2.

    Hypothesis Step 3. Verification Step 4. Conclusion Host OS Application Containerized Application Server B Server A Java Application Target Service Docker Runtime Java Application Target Service 4X FASTER 4X SLOWER Response: 1 s Response: 3–4 s mostly under ~16 µs around 1 ~ 8 ms If CPU is saturated, Why is it this bad? Due to high Context Switches! (2M vs 1K) under ~16µs on-CPU time This strongly suggests CPU thrashing.
  31. 33 Cycle 3 - Question Step 2. Hypothesis Step 3.

    Verification Step 4. Conclusion Step 1. Observation CPU is saturated, thrashing occurs Why is contention so extreme?
  32. 34 Cycle 3 - Observation uptime → More runnable tasks

    than CPUs Is the application running alone? # uptime 22:06:24 up 91 days, 23:52, 1 user, load average: 17.94, 16.92, 16.62 # uptime 22:07:23 up 15 days, 5:01, 1 user, load average: 85.09, 89.25, 91.26 Server A Server B Step 2. Hypothesis Step 3. Verification Step 4. Conclusion Step 1. Observation Why is contention so extreme? 48 CPU 85 Tasks 1.77 = 64 CPU 17 Tasks 0.26 = CPU Tasks CPU Tasks
  33. 35 Cycle 3 - Hypothesis # uptime 22:06:24 up 91

    days, 23:52, 1 user, load average: 17.94, 16.92, 16.62 # uptime 22:07:23 up 15 days, 5:01, 1 user, load average: 85.09, 89.25, 91.26 Server A Server B Step 3. Verification Step 4. Conclusion Why is contention so extreme? 48 CPU 85 Tasks 1.77 = 64 CPU 17 Tasks 0.26 = CPU Tasks CPU Tasks → More runnable tasks than CPUs Is the application running alone? Other CPU-intensive workloads may compete for CPU Step 2. Hypothesis Step 1. Observation
  34. 36 Cycle 3 - Verification pidstat # pidstat -u 1

    Linux 4.19.26 ... (64 CPU) UID PID %usr %system %guest %wait %CPU CPU Command 1000 1928219 1328.40 48.20 0.00 2.10 1376.60 12 java 0 912 0.25 0.20 0.00 0.00 0.45 3 containerd 0 1241 0.18 0.15 0.00 0.00 0.33 7 dockerd ... # pidstat -u 1 Linux 4.4.0-130-generic ... (48 CPU) UID PID %usr %system %guest %wait %CPU CPU Command 1000 4093 690.20 42.40 0.00 180.10 732.60 4 java 1001 5221 760.30 38.20 0.00 210.40 798.50 11 batch-worker 1001 5228 720.10 35.60 0.00 198.30 755.70 2 batch-worker 1002 6104 610.40 30.20 0.00 170.80 640.60 9 data-indexer 1002 6110 560.20 27.50 0.00 158.20 587.70 15 data-indexer 1003 7332 500.10 25.90 0.00 140.60 526.00 6 log-parser 1003 7339 460.80 24.30 0.00 132.10 485.10 13 log-parser 0 1558 56.30 121.50 0.00 18.20 177.80 1 kworker/u96:2 Server B Server A Step 2. Hypothesis Step 3. Verification Step 4. Conclusion Step 1. Observation Why is contention so extreme?
  35. 37 Cycle 3 - Verification pidstat # pidstat -u 1

    Linux 4.4.0-130-generic ... (48 CPU) UID PID %usr %system %guest %wait %CPU CPU Command 1000 4093 690.20 42.40 0.00 180.10 732.60 4 java 1001 5221 760.30 38.20 0.00 210.40 798.50 11 batch-worker 1001 5228 720.10 35.60 0.00 198.30 755.70 2 batch-worker 1002 6104 610.40 30.20 0.00 170.80 640.60 9 data-indexer 1002 6110 560.20 27.50 0.00 158.20 587.70 15 data-indexer 1003 7332 500.10 25.90 0.00 140.60 526.00 6 log-parser 1003 7339 460.80 24.30 0.00 132.10 485.10 13 log-parser 0 1558 56.30 121.50 0.00 18.20 177.80 1 kworker/u96:2 Step 2. Hypothesis Step 3. Verification Step 4. Conclusion Step 1. Observation Why is contention so extreme? total CPU usage User Kernel
  36. 38 Cycle 3 - Verification pidstat # pidstat -u 1

    Linux 4.19.26 ... (64 CPU) UID PID %usr %system %guest %wait %CPU CPU Command 1000 1928219 1328.40 48.20 0.00 2.10 1376.60 12 java 0 912 0.25 0.20 0.00 0.00 0.45 3 containerd 0 1241 0.18 0.15 0.00 0.00 0.33 7 dockerd ... # pidstat -u 1 Linux 4.4.0-130-generic ... (48 CPU) UID PID %usr %system %guest %wait %CPU CPU Command 1000 4093 690.20 42.40 0.00 180.10 732.60 4 java 1001 5221 760.30 38.20 0.00 210.40 798.50 11 batch-worker 1001 5228 720.10 35.60 0.00 198.30 755.70 2 batch-worker 1002 6104 610.40 30.20 0.00 170.80 640.60 9 data-indexer 1002 6110 560.20 27.50 0.00 158.20 587.70 15 data-indexer 1003 7332 500.10 25.90 0.00 140.60 526.00 6 log-parser 1003 7339 460.80 24.30 0.00 132.10 485.10 13 log-parser 0 1558 56.30 121.50 0.00 18.20 177.80 1 kworker/u96:2 Server B Server A Step 2. Hypothesis Step 3. Verification Step 4. Conclusion Step 1. Observation Why is contention so extreme? Other CPU-intensive workloads may compete for CPU
  37. Server A was deployed with Noisy Applications! Server B Server

    A Cycle 3 - Conclusion 39 Host OS Application Containerized Application Java Application Target Service Docker Runtime Java Application Target Service App App App Noisy Applications . . . Shared CPU Shared LLC Dedicated CPU Dedicated LLC
  38. 40 What we Did Cycle Recap Performance analysis is an

    iterative cycle Each conclusion leads to next question. Cycle 1 - Was the System Really Busy? Step 1. Observation Step 2. Hypothesis Step 3. Verification Step 4. Conclusion Server A: high load / low idle It may be CPU-bound CPU is saturated (mpstat, vmstat) Tasks cannot make progress Server A is CPU-saturated Cycle 2 - Why is it this bad? Step 1. Observation Step 2. Hypothesis Step 3. Verification Step 4. Conclusion Extreme high Context switches Tasks are not running long enough Extreme short on-CPU time (cpudist) CPU thrashing is strongly suspected Cycle 3 -Why is contention so extreme? Step 1. Observation Step 2. Hypothesis Step 3. Verification Step 4. Conclusion More runnable tasks than CPUs Other workloads competing? Multiple CPU-bound workloads (pidstat) Deployed with Noisy Applications
  39. Three types of Performance Tools: 42 Revisiting the performance tools

    Kernel counters Event counters Dynamic Tracing
  40. 43 Revisiting the performance tools Tool uptime mpstat vmstat perf

    stat cpudist What did we ask? Is the system load high? Where is CPU time spent? Are tasks runnable or blocked? How many HW/SW events occurred? How long does each task stay on CPU? Data source / Method PMU + Kernel software events BPF scheduler tracing System overall counters Scheduler counters CPU time counters Kernel counters Event counters Dynamic Tracing pidstat Which processes are using CPU? Per-process scheduler counters
  41. 44 Kernel Counters uptime / mpstat / vmstat / pidstat

    Tool uptime What did we ask? Is the system load high? Data source / Method Kernel summary counters mpstat Where is CPU time spent? Kernel CPU time counters vmstat Are tasks runnable or blocked? Kernel scheduler counters CPU Kernel Space # ls /proc uptime loadavg stat meminfo # uptime 13:23:25 up 22 days, 1:33, 1 users, load average: 0.21, 0.19, 0.19 # mpstat 10 Linux 6.8.0-1048-raspi (hub) 04/24/26 _aarch64_(4 CPU) CPU %usr %nice %sys %iowait %irq %soft %steal %guest %gnice %idle all 1.94 0.00 3.35 0.00 0.00 0.05 0.00 0.00 0.00 94.67 all 2.19 0.00 4.17 0.00 0.00 5.47 0.00 0.00 0.00 88.17 all 1.99 0.00 3.72 0.05 0.00 0.10 0.00 0.00 0.00 94.14 . . . # vmstat 1 4 procs -----------memory---------- ---swap-- -----io---- -system-- r b swpd free buff cache si so bi bo in cs 2 0 1024316 481492 967272 5254528 4 6 2091 362 2100 3 1 0 1024316 481300 967280 5254528 0 0 0 20 588 349 1 0 1024316 475508 967280 5254528 0 0 0 0 2240 1853 . . . /proc/uptime /proc/loadavg /proc/stat /proc/stat /proc/meminfo Kernel-level counters Userspace pidstat Which processes are using CPU? Per-process scheduler counters
  42. 45 Event Counters perf stat # perf stat -a sleep

    10 Performance counter stats for 'system wide': 20,145,382 context-switches # 2,014,538 /sec 512,844 cpu-migrations # 51,284 /sec 48,210 page-faults # 4,821 /sec 480,007,375,222 cpu-clock # 47.98 CPUs utilized 684,410,034,295 instructions # 0.57 insn per cycle # 1.38 stalled cycles 1,200,719,358,412 cycles # 2.55 GHz 947,367,173,387 stalled-cycles-frontend # 78.9% frontend cycles idle 253,351,864,625 stalled-cycles-backend # 21.1% backend cycles idle 149,462,177,763 branches # 14.94 G/sec 18,297,370,160 branch-misses # 12.24% of all branches 10.004322118 seconds time elapsed Tool What did we ask? Data source / Method How many HW/SW events occurred? PMU + Kernel software events How many HW/SW events occurred? PMU + Kernel software events perf stat CPU Kernel Space Userspace perf stat (event counter) is obtained from: - Hardware Events: CPU Internal Counter(PMC) - Software Events: Kernel Software Events Hardware Events CPU cycles, instructions, cache misses, branches, stalled cycles, ... Software Events (Kernel) context switches, migrations, page faults, ...
  43. 46 Counter tools show predefined values But these tools can’t

    answer: How long does each task actually run?
  44. 47 Dynamic Tracing But these tools can’t answer: How long

    does each task actually run? So we used Dynamic Tracing Tool! (especially, BPF)
  45. cpudist hooks kernel scheduler And traces each task’s on-CPU time

    48 BPF cpudist cpudist How long does each task stay on CPU? BPF scheduler tracing Tool What did we ask? Data source / Method # cpudist -p 4093 10 1 Tracing on-CPU time... Hit Ctrl-C to end. usecs : count distribution 0 -> 1 : 3618650 |****************************************| 2 -> 3 : 2704935 |***************************** | 4 -> 7 : 421179 |**** | 8 -> 15 : 99416 |* | …
  46. cpudist hooks kernel scheduler And traces each task’s on-CPU time

    But how is this even possible? 49 BPF cpudist cpudist How long does each task stay on CPU? BPF scheduler tracing Tool What did we ask? Data source / Method # cpudist -p 4093 10 1 Tracing on-CPU time... Hit Ctrl-C to end. usecs : count distribution 0 -> 1 : 3618650 |****************************************| 2 -> 3 : 2704935 |***************************** | 4 -> 7 : 421179 |**** | 8 -> 15 : 99416 |* | …
  47. 50 BPF cpudist cpudist How long does each task stay

    on CPU? BPF scheduler tracing Tool What did we ask? Data source / Method # cpudist -p 4093 10 1 Tracing on-CPU time... Hit Ctrl-C to end. usecs : count distribution 0 -> 1 : 3618650 |****************************************| 2 -> 3 : 2704935 |***************************** | 4 -> 7 : 421179 |**** | 8 -> 15 : 99416 |* | … #!/usr/bin/env bpftrace BEGIN { printf("Tracing on-CPU time... Hit Ctrl-C to end.\n"); } tracepoint:sched:sched_switch { // on-CPU runtime (usec) histogram if (@s[args->prev_pid]) { @h = hist((nsecs - @s[args->prev_pid]) / 1000); delete(@s[args->prev_pid]); } // record start time @s[args->next_pid] = nsecs; } cpudist is a small program (BPF Code) that is injected to kernel
  48. BPF 51 CPU Userspace KERNEL SPACE Hook points: callback points

    Kernel Space kprobe: function Entry/Return XDP: @L2 device driver KERNEL SPACE Tracepoint: instrument. point 0. Inside kernel, there are multiple hook points
  49. BPF CPU Userspace KERNEL SPACE Hook points: callback points Kernel

    Space kprobe: function Entry/Return XDP: @L2 device driver 52 KERNEL SPACE Tracepoint: instrument. point 0. Inside kernel, there are multiple hook points 1. BPF Subsystem loads BPF program and attach to hooks User written BPF program BEGIN { printf("Tracing on-CPU time... \n"); } tracepoint:sched:sched_switch { // on-CPU runtime (usec) histogram if (@s[args->prev_pid]) { @h = hist((nsecs - @s[args->prev_pid]) / 1000); delete(@s[args->prev_pid]); } // record start time @s[args->next_pid] = nsecs; } BPF BPF BPF
  50. BPF CPU Userspace KERNEL SPACE Hook points: callback points Kernel

    Space kprobe: function Entry/Return XDP: @L2 device driver 53 KERNEL SPACE Tracepoint: instrument. point 0. Inside kernel, there are multiple hook points 1. BPF Subsystem loads BPF program and attach to hooks 2. When this hook is invoked, BPF program is executed BPF BPF BPF if(has_bpf_prog) BPF_PROG_RUN(); BPF CALLBACK!! Callback / Hooked Runs your own code!! Inside specific Kernel function
  51. 54 BPF cpudist cpudist How long does each task stay

    on CPU? BPF scheduler tracing Tool What did we ask? Data source / Method #!/usr/bin/env bpftrace BEGIN { printf("Tracing on-CPU time... Hit Ctrl-C to end.\n"); } tracepoint:sched:sched_switch { // on-CPU runtime (usec) histogram if (@s[args->prev_pid]) { @h = hist((nsecs - @s[args->prev_pid]) / 1000); delete(@s[args->prev_pid]); } // record start time @s[args->next_pid] = nsecs; } Task A (prev) Task B (prev) sched_switch tracepoint:sched:sched_switch Example Hook: sched_switch Scheduler switches from prev task to next task KERNEL SPACE BPF Triggered every time a task is switched on or off the CPU → RUN cpudist
  52. TASK A 55 BPF cpudist cpudist How long does each

    task stay on CPU? BPF scheduler tracing Tool What did we ask? Data source / Method #!/usr/bin/env bpftrace BEGIN { printf("Tracing on-CPU time... Hit Ctrl-C to end.\n"); } tracepoint:sched:sched_switch { // on-CPU runtime (usec) histogram if (@s[args->prev_pid]) { @h = hist((nsecs - @s[args->prev_pid]) / 1000); delete(@s[args->prev_pid]); } // record start time @s[args->next_pid] = nsecs; } How cpudist works (with BPF) time TASK A TASK B sched_switch sched_switch CPU 1) When task B is switched IN → record start time for task B (next) 2) When task A is switched OUT → record end time for task A (prev) → record end time for that task → Calculate on-CPU time and Update histogram
  53. 56 Revisiting the performance tools The key is asking the

    right question, and choosing the right tool to answer it. perf stat cpudist How many HW/SW events occurred? How long does each task stay on CPU? PMU + Kernel software events BPF scheduler tracing Event counters Dynamic Tracing Tool uptime mpstat vmstat What did we ask? Is the system load high? Where is CPU time spent? Are tasks runnable or blocked? Data source / Method System overall counters Scheduler counters CPU time counters Kernel counters pidstat Which processes are using CPU? Per-process scheduler counters