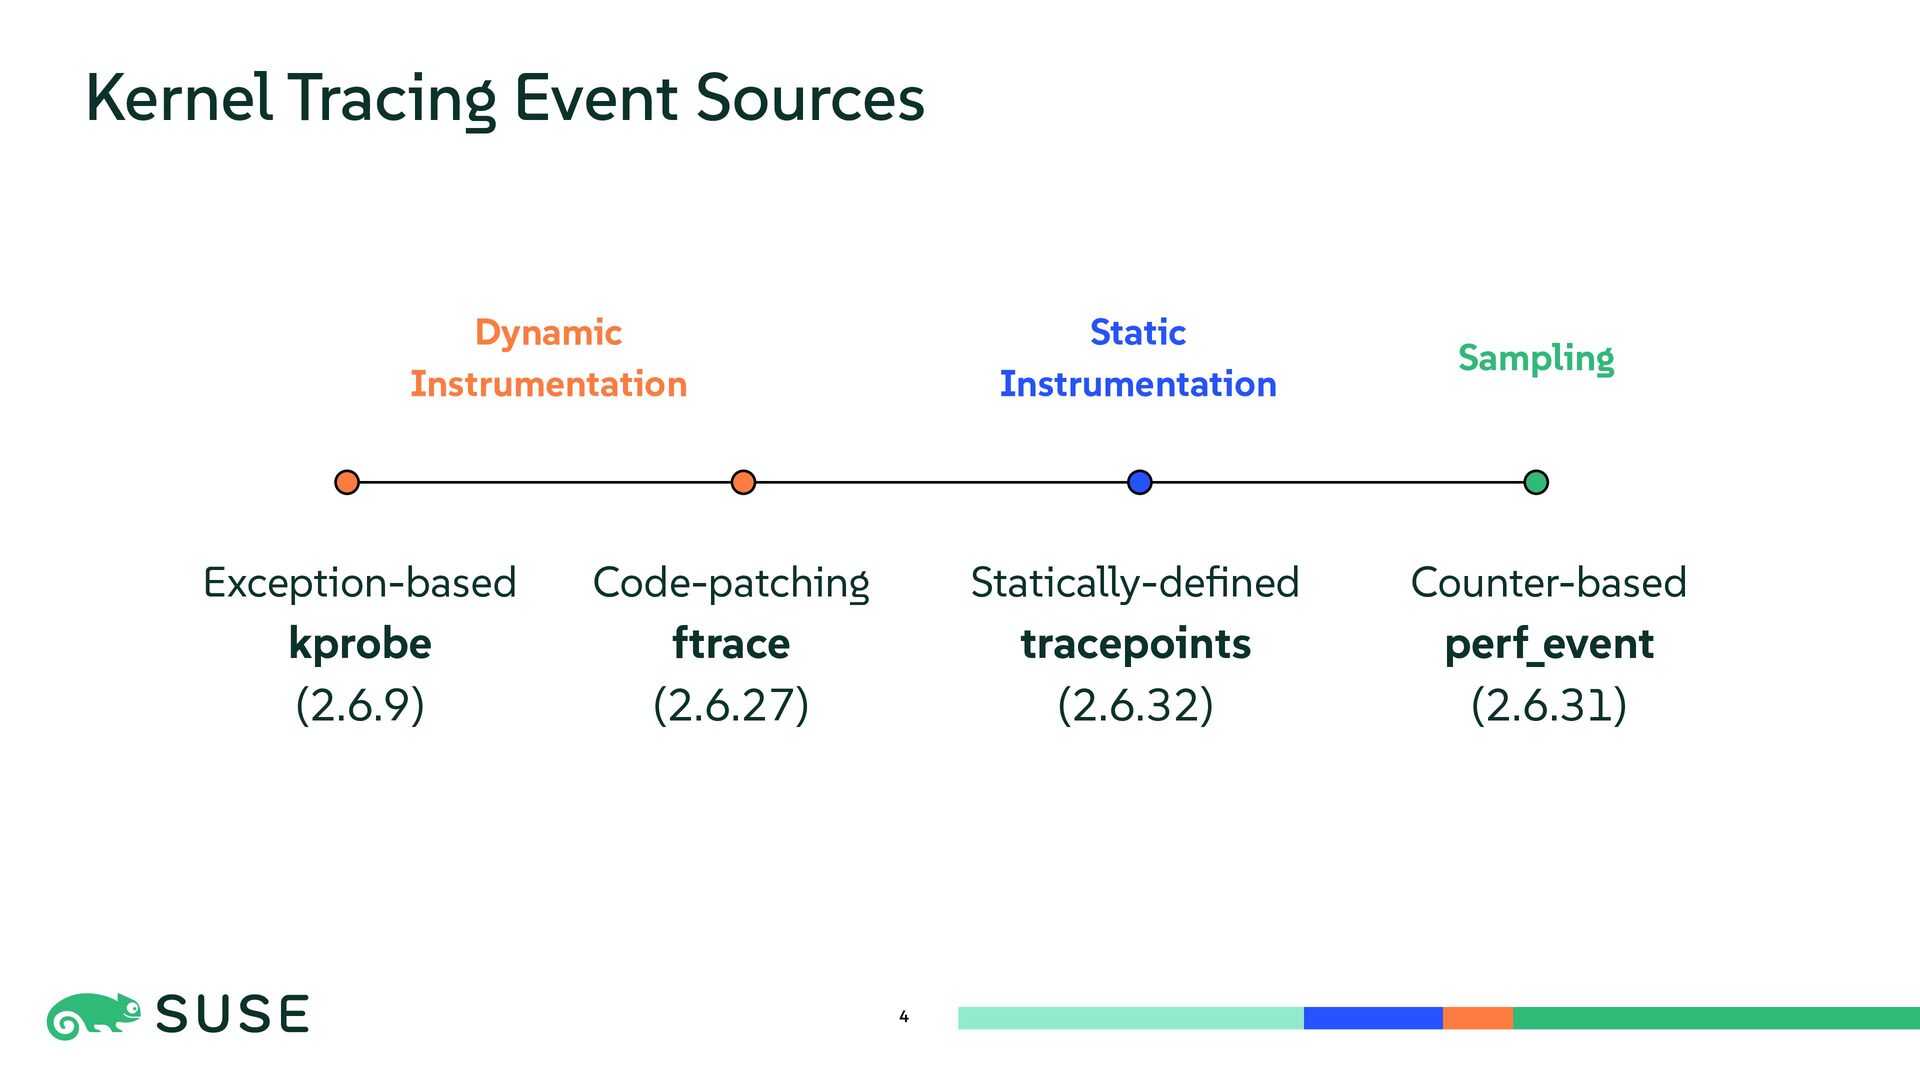
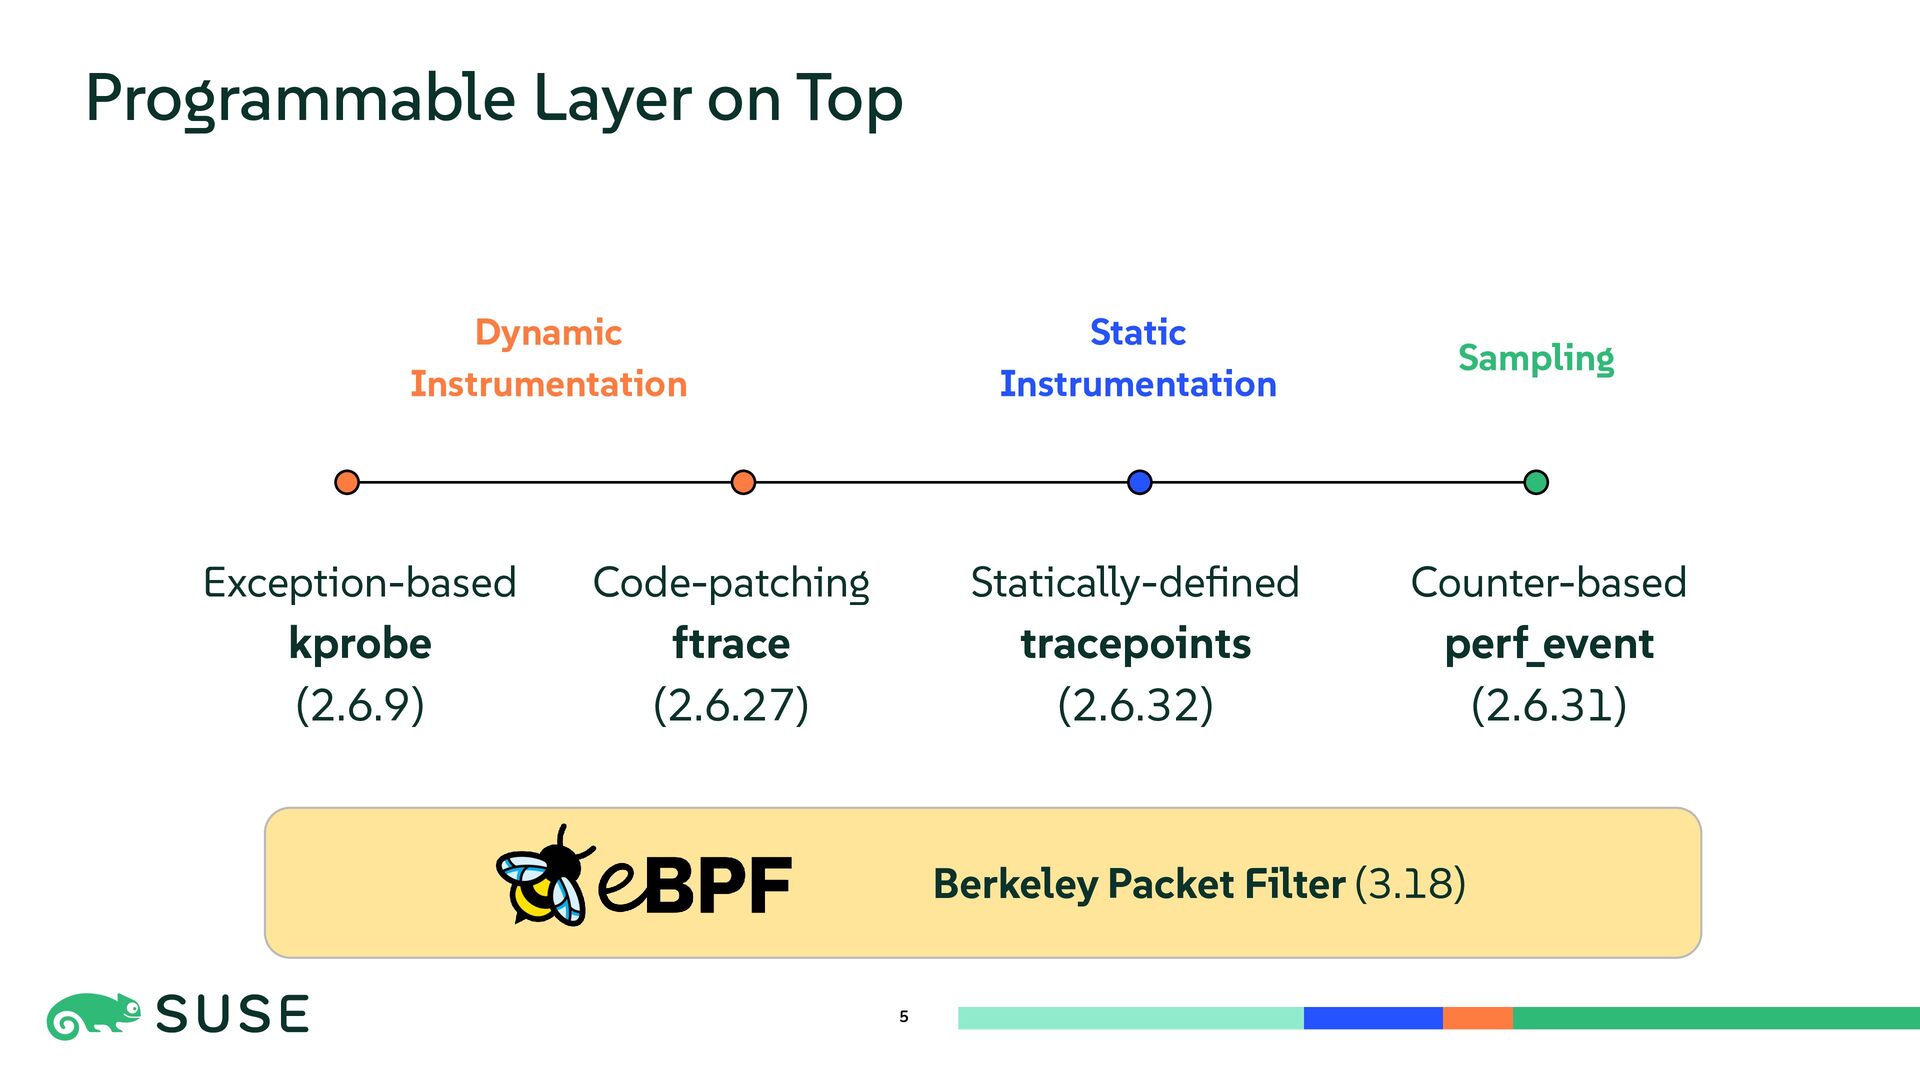
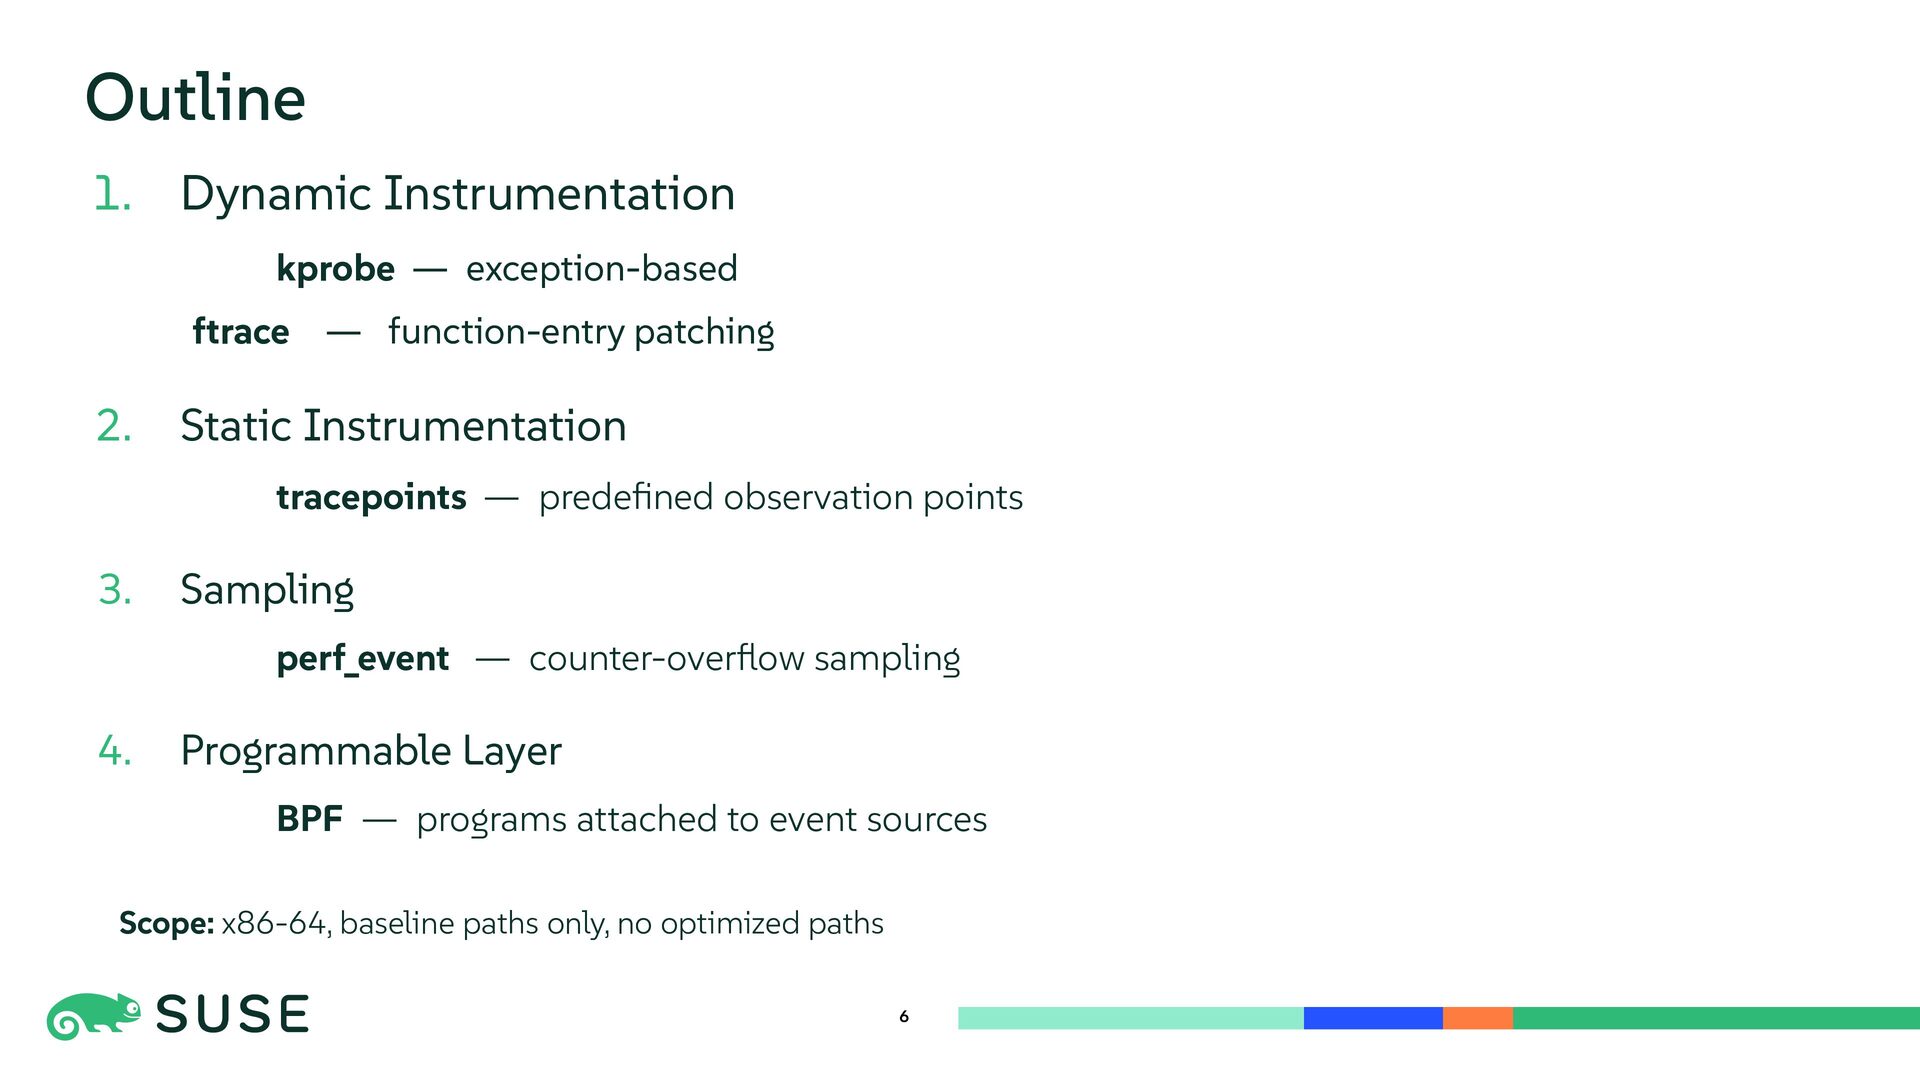
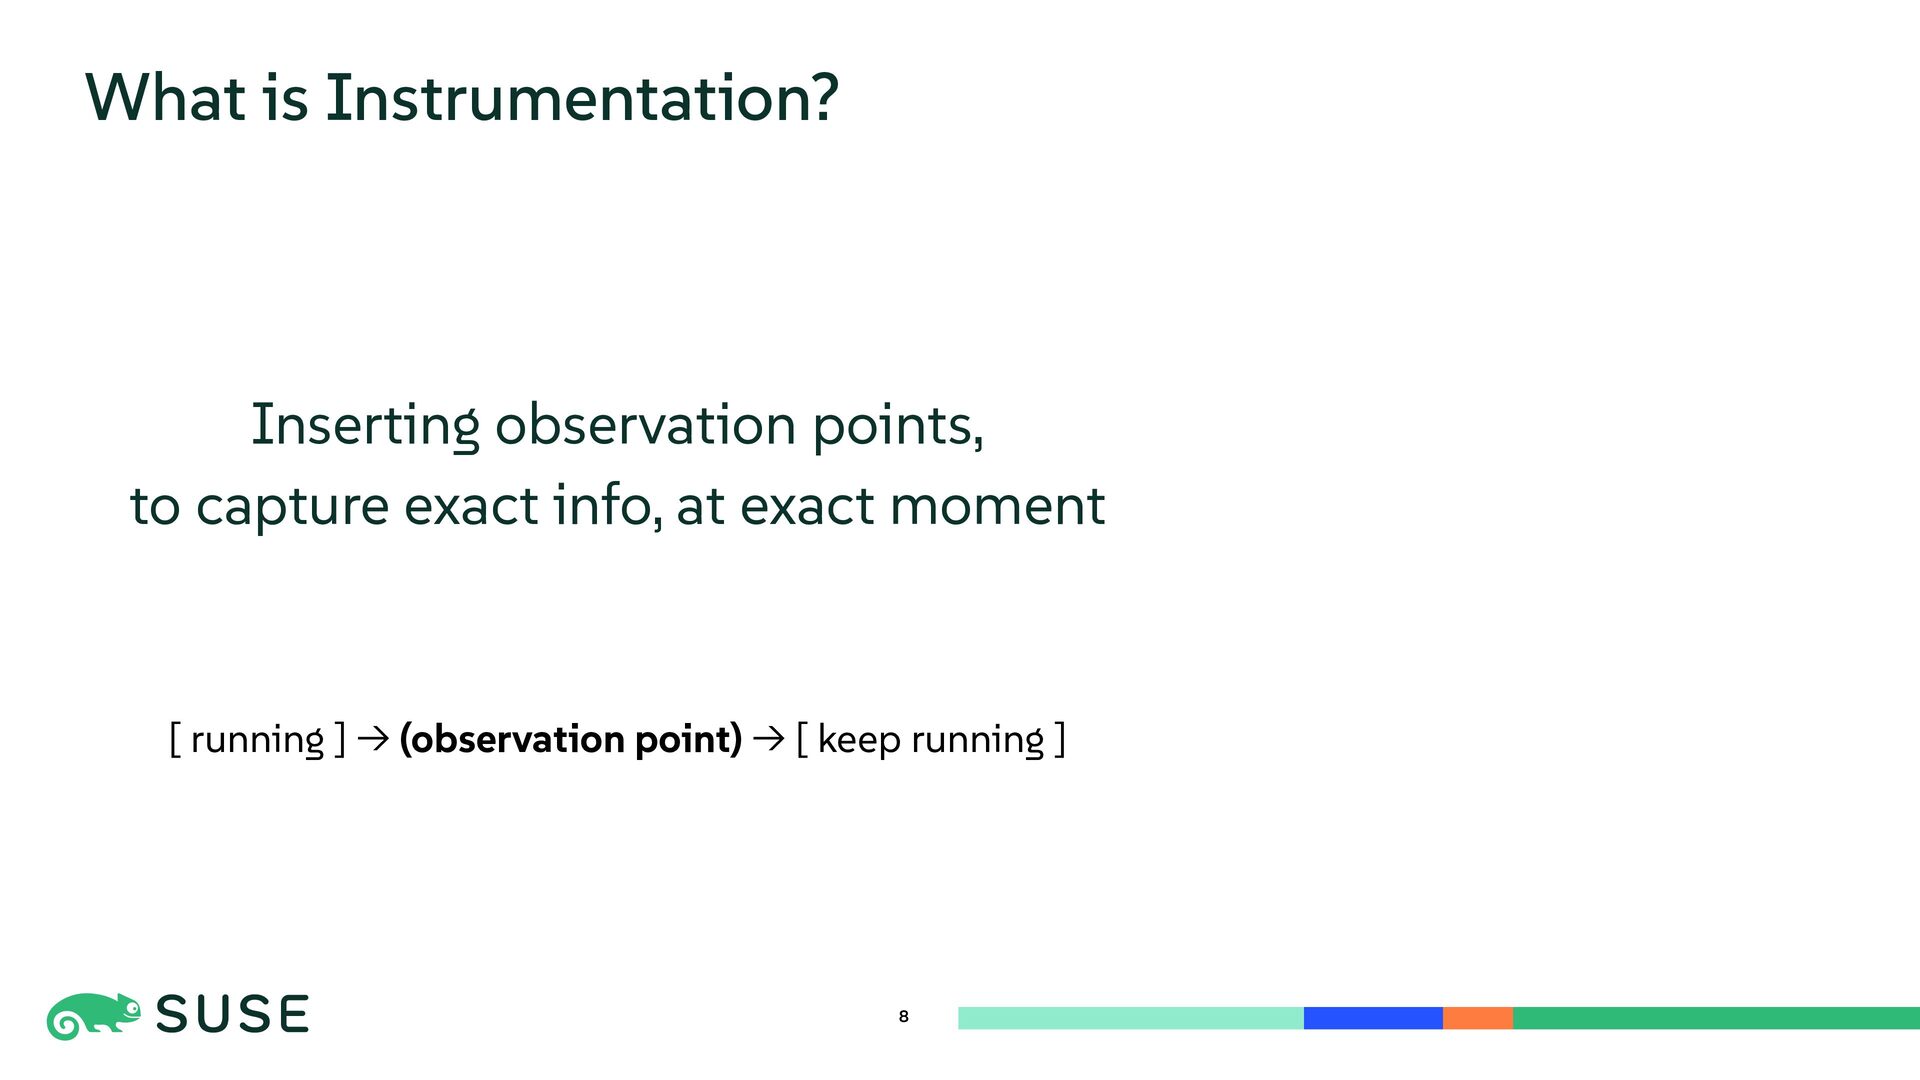
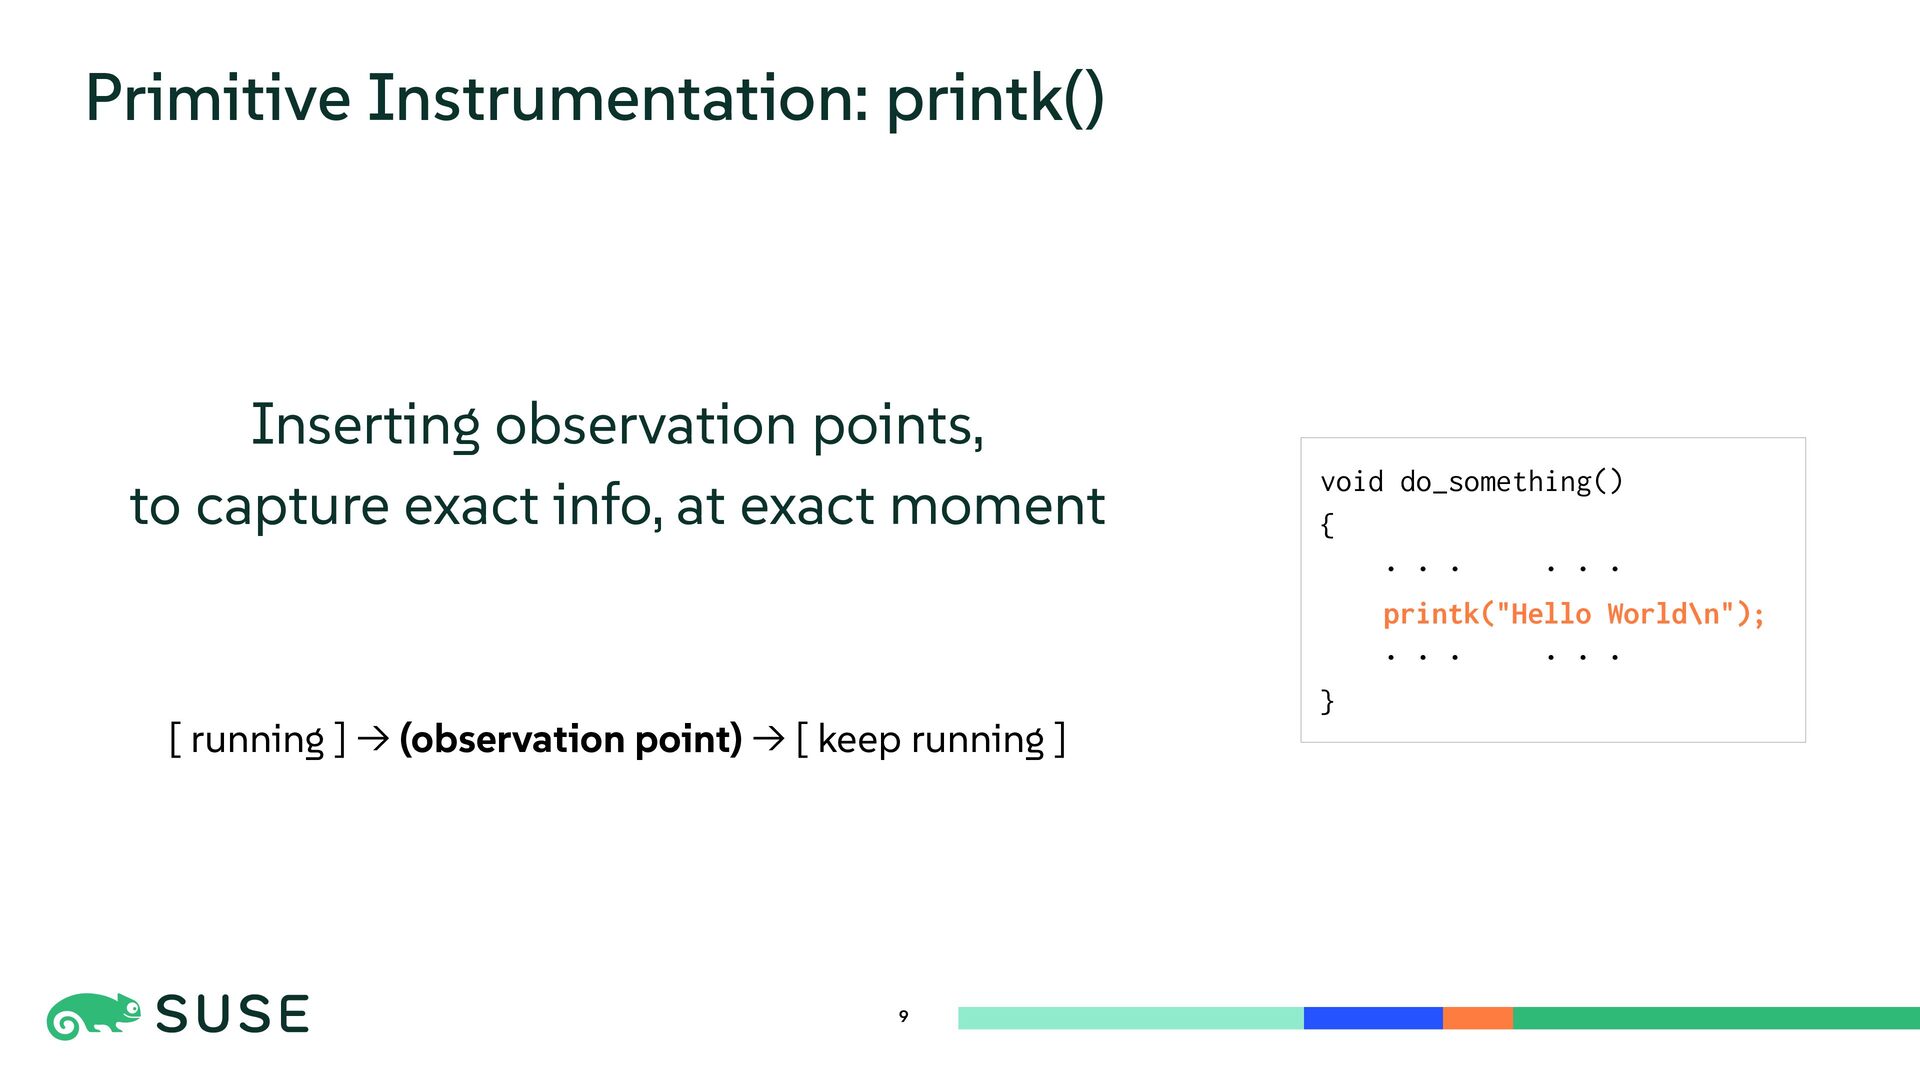
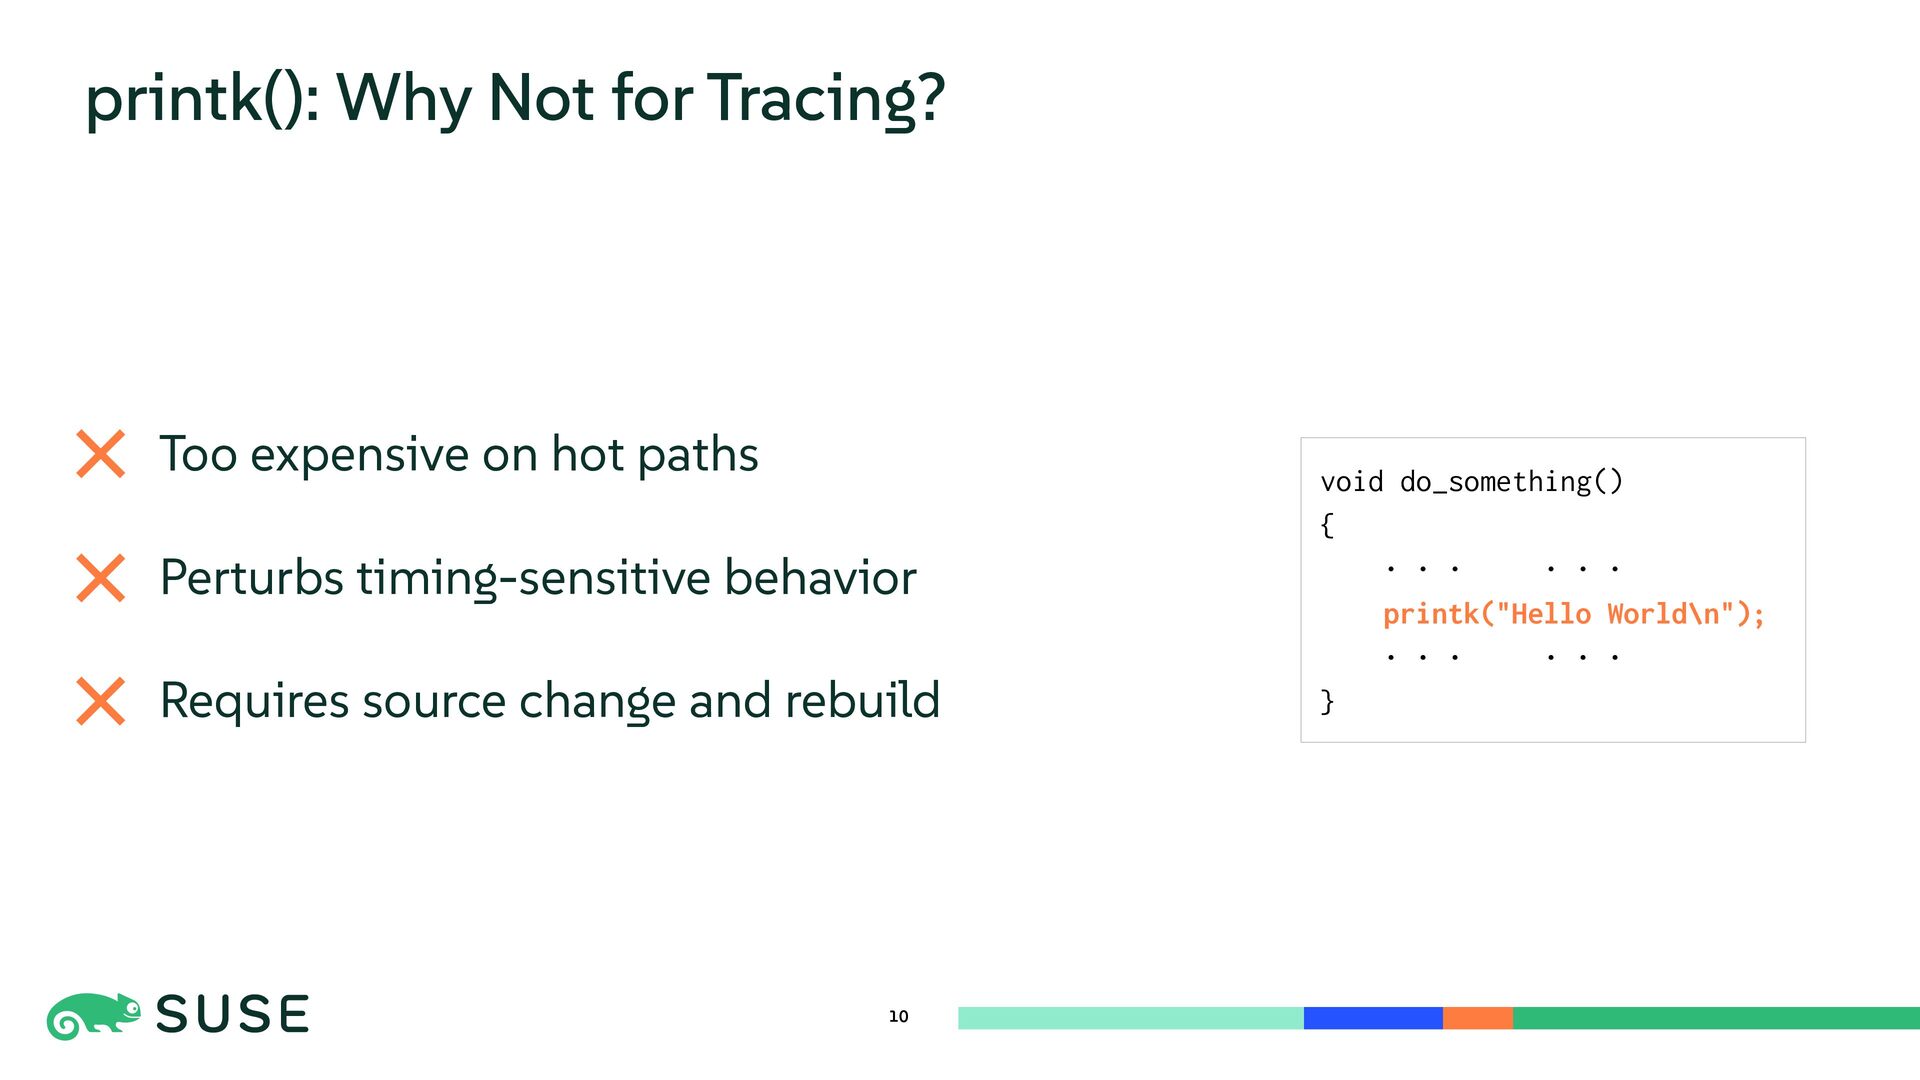
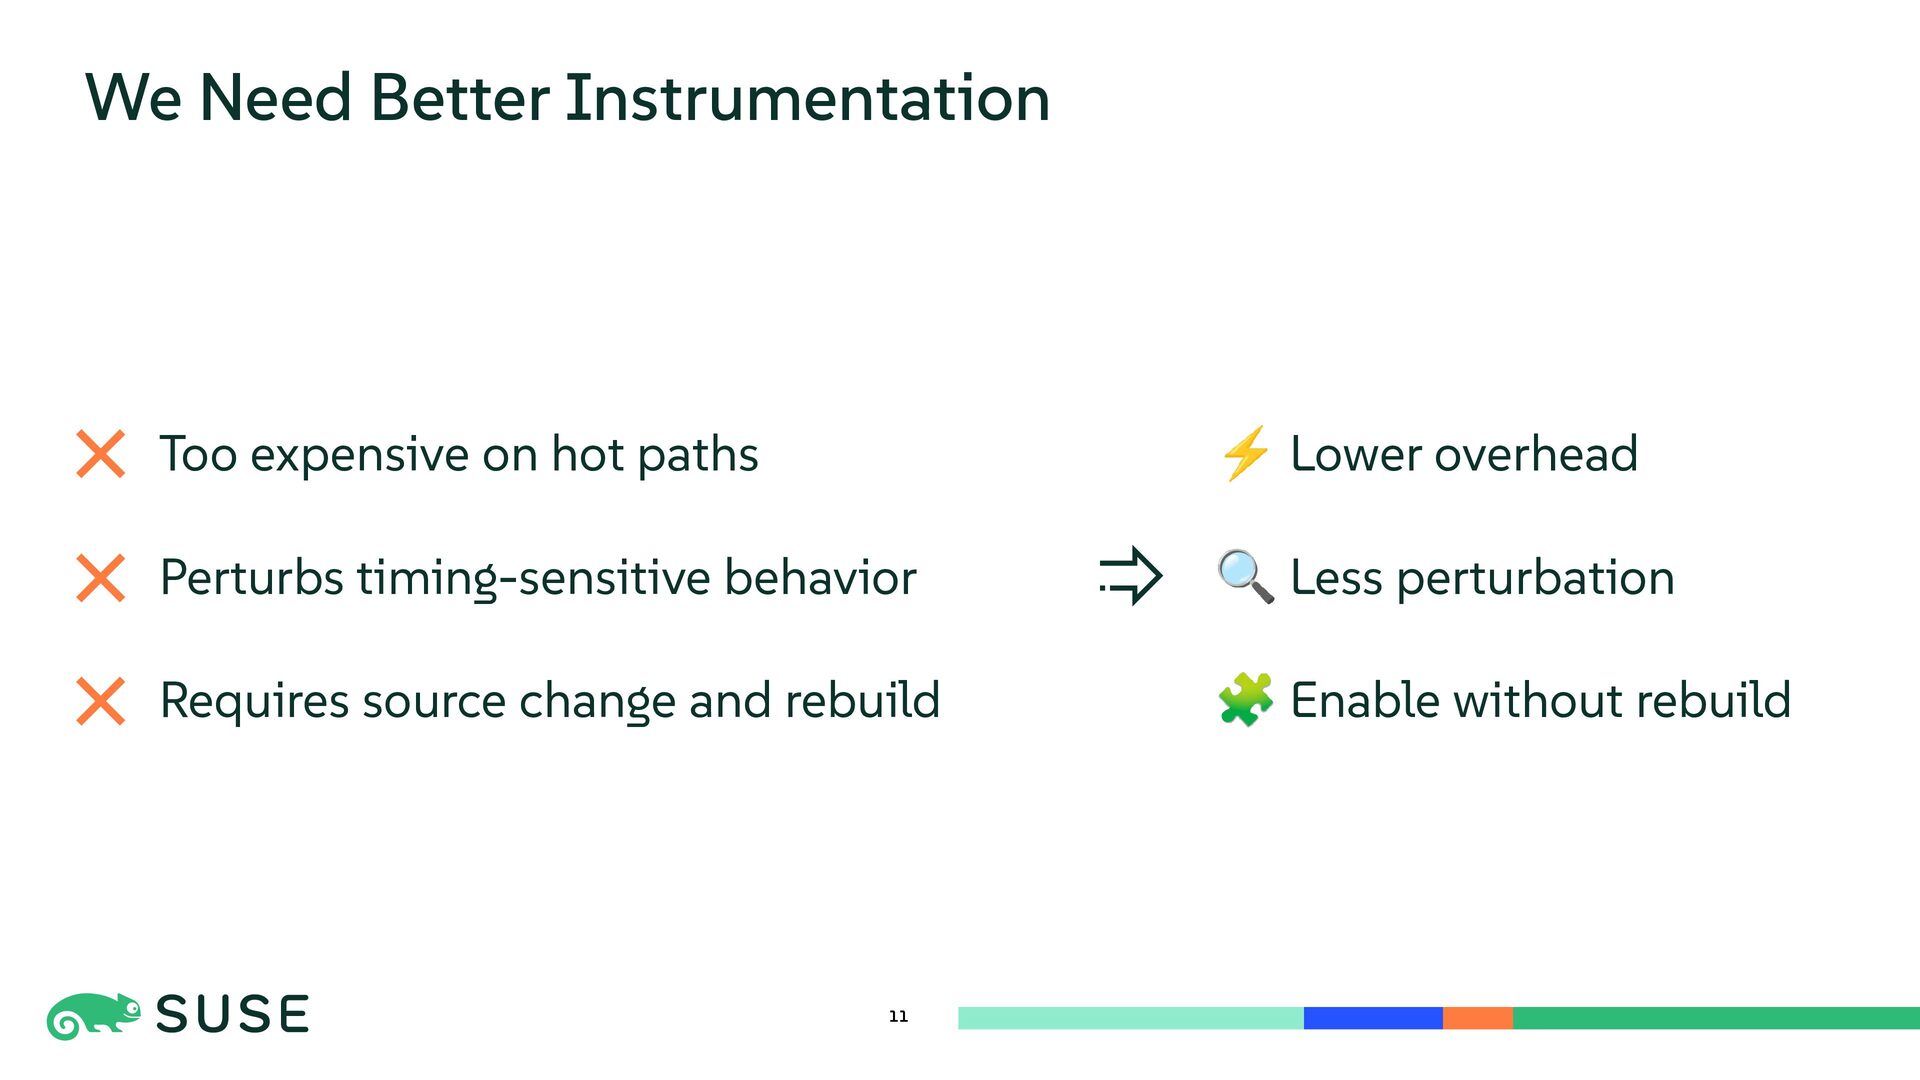
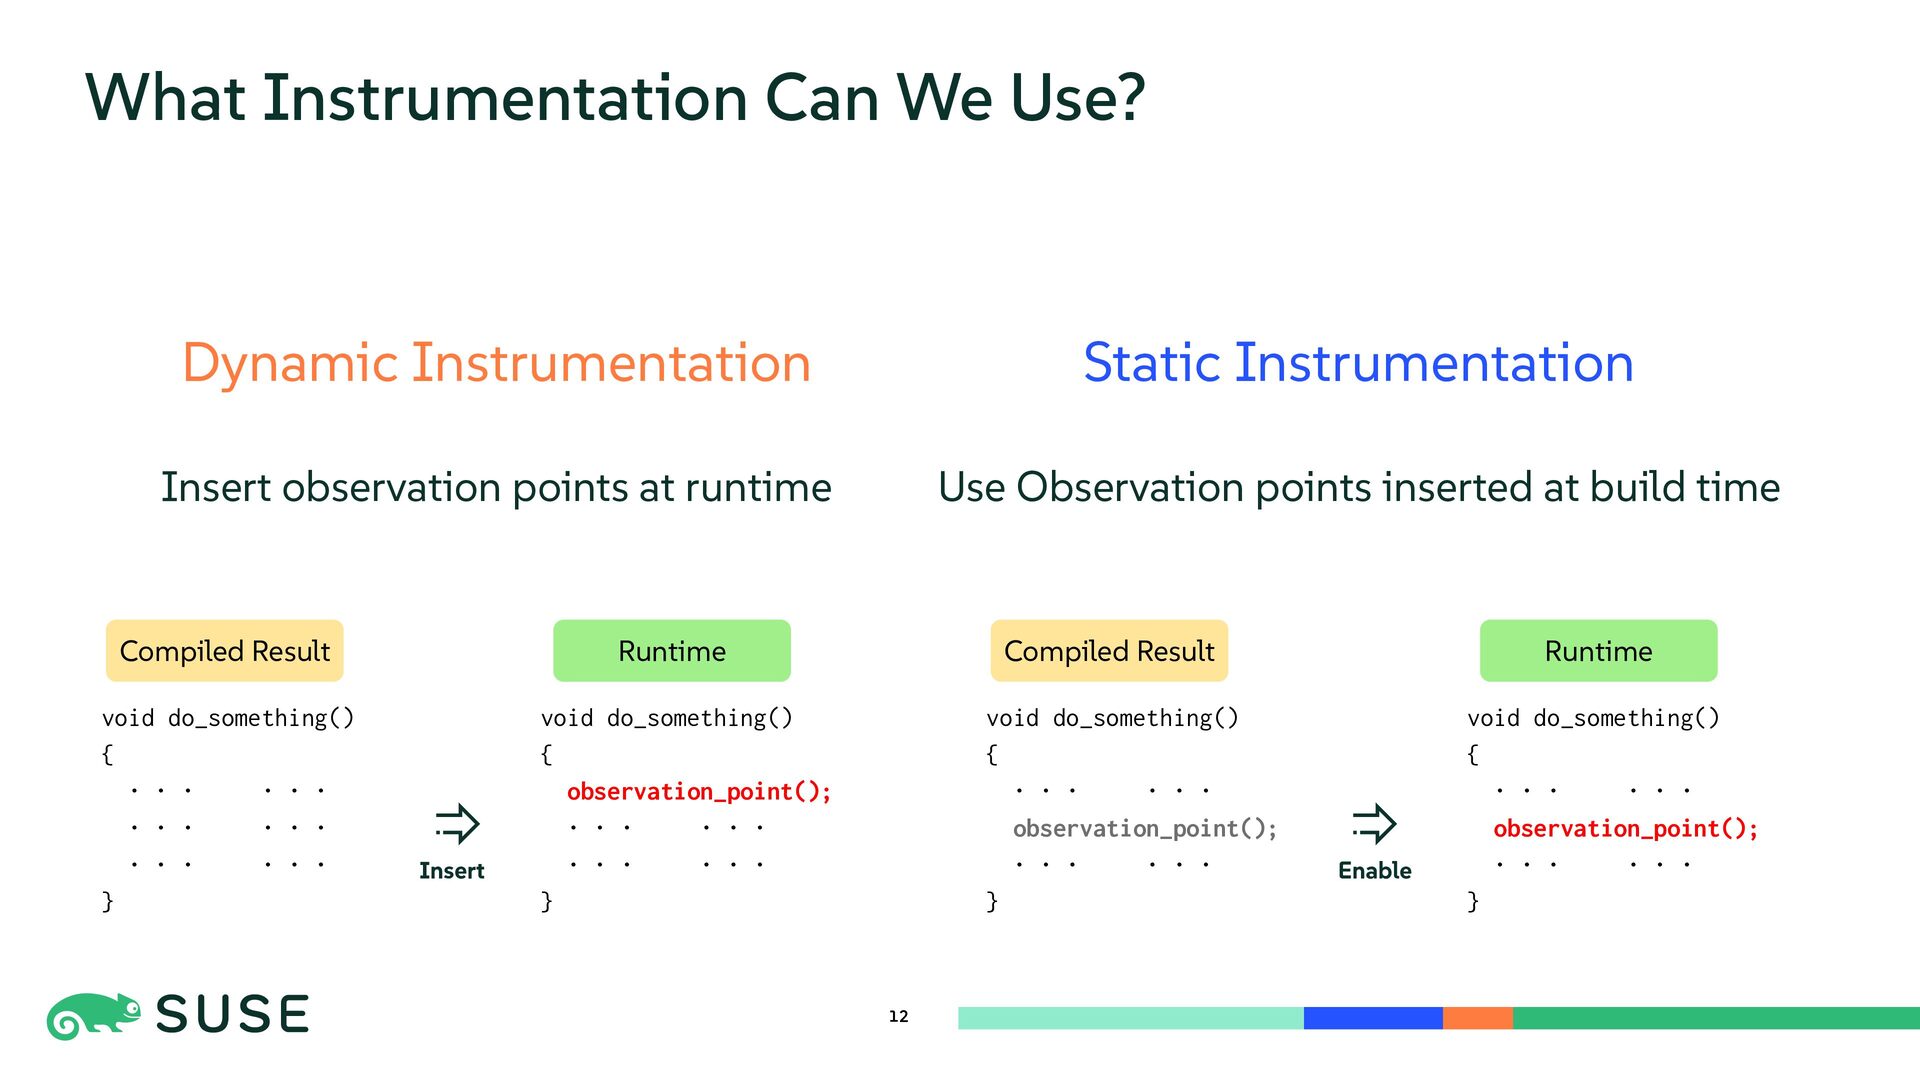
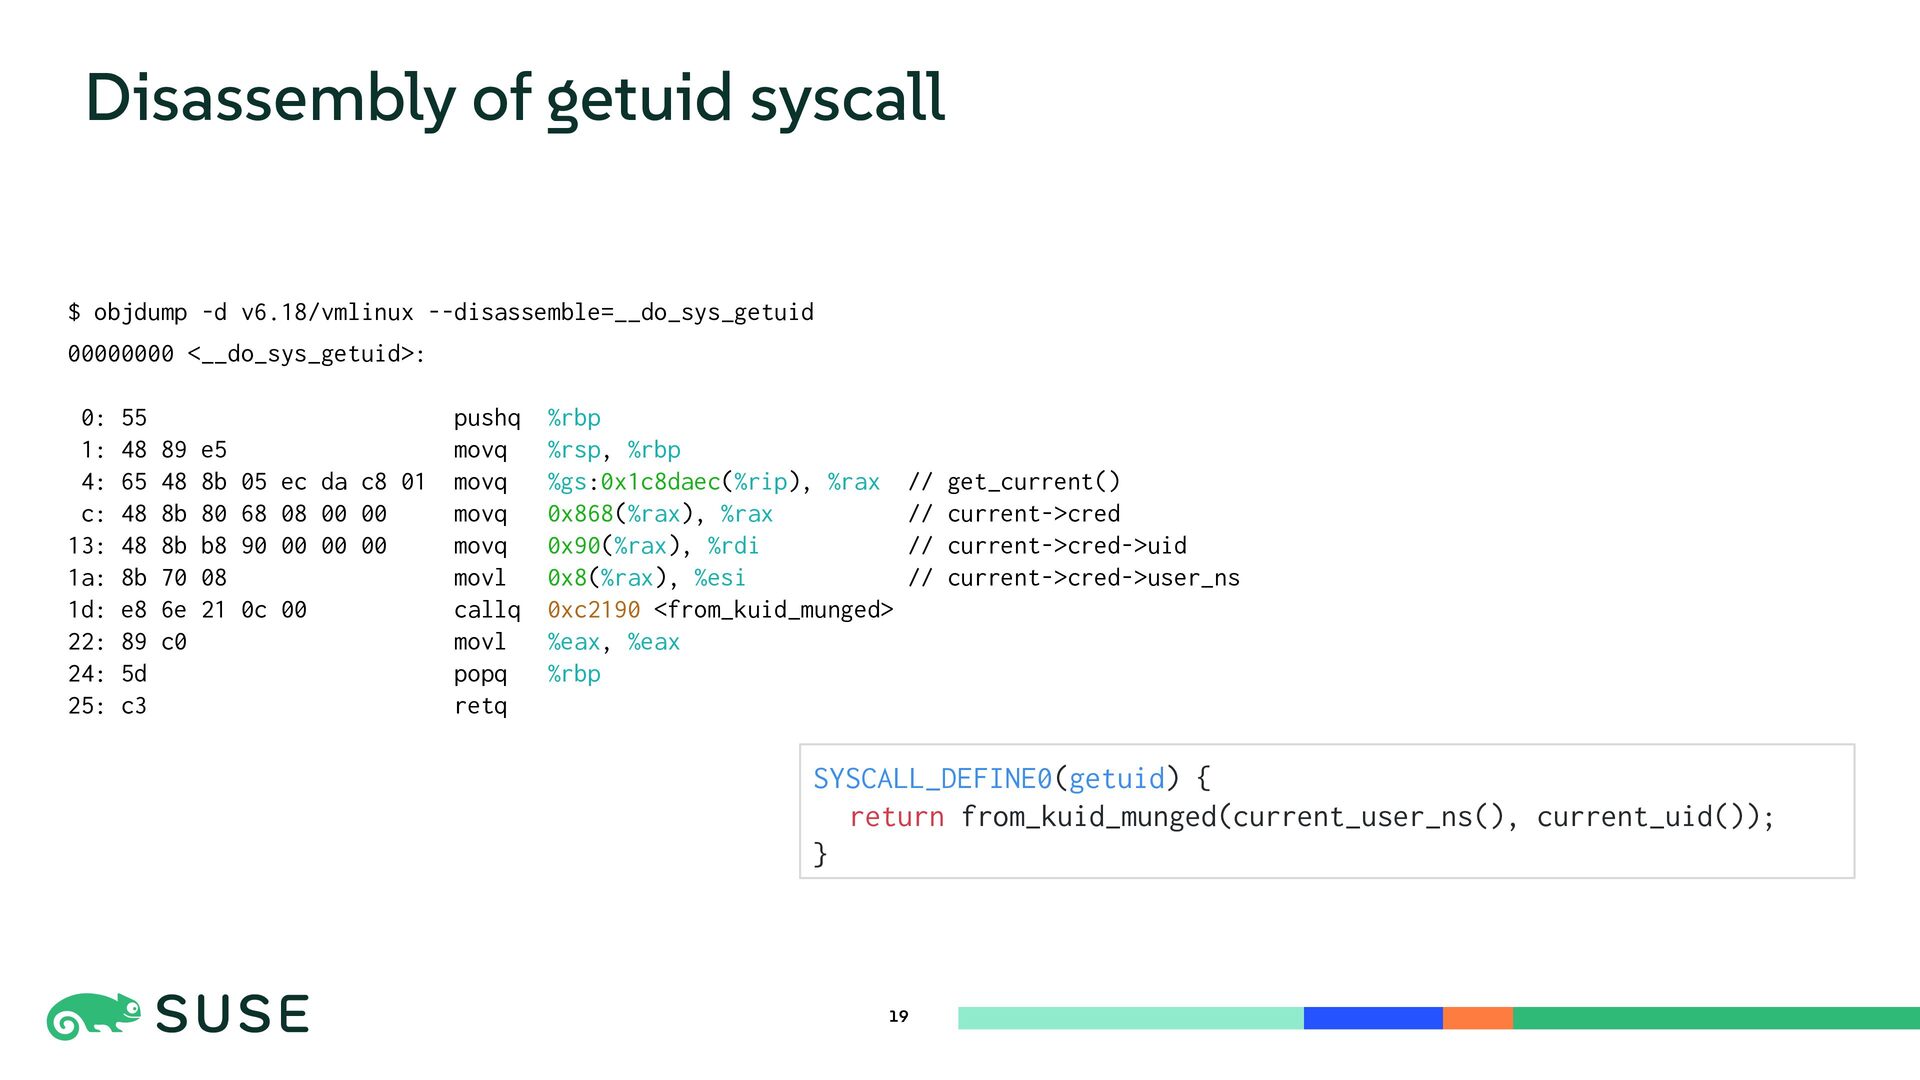
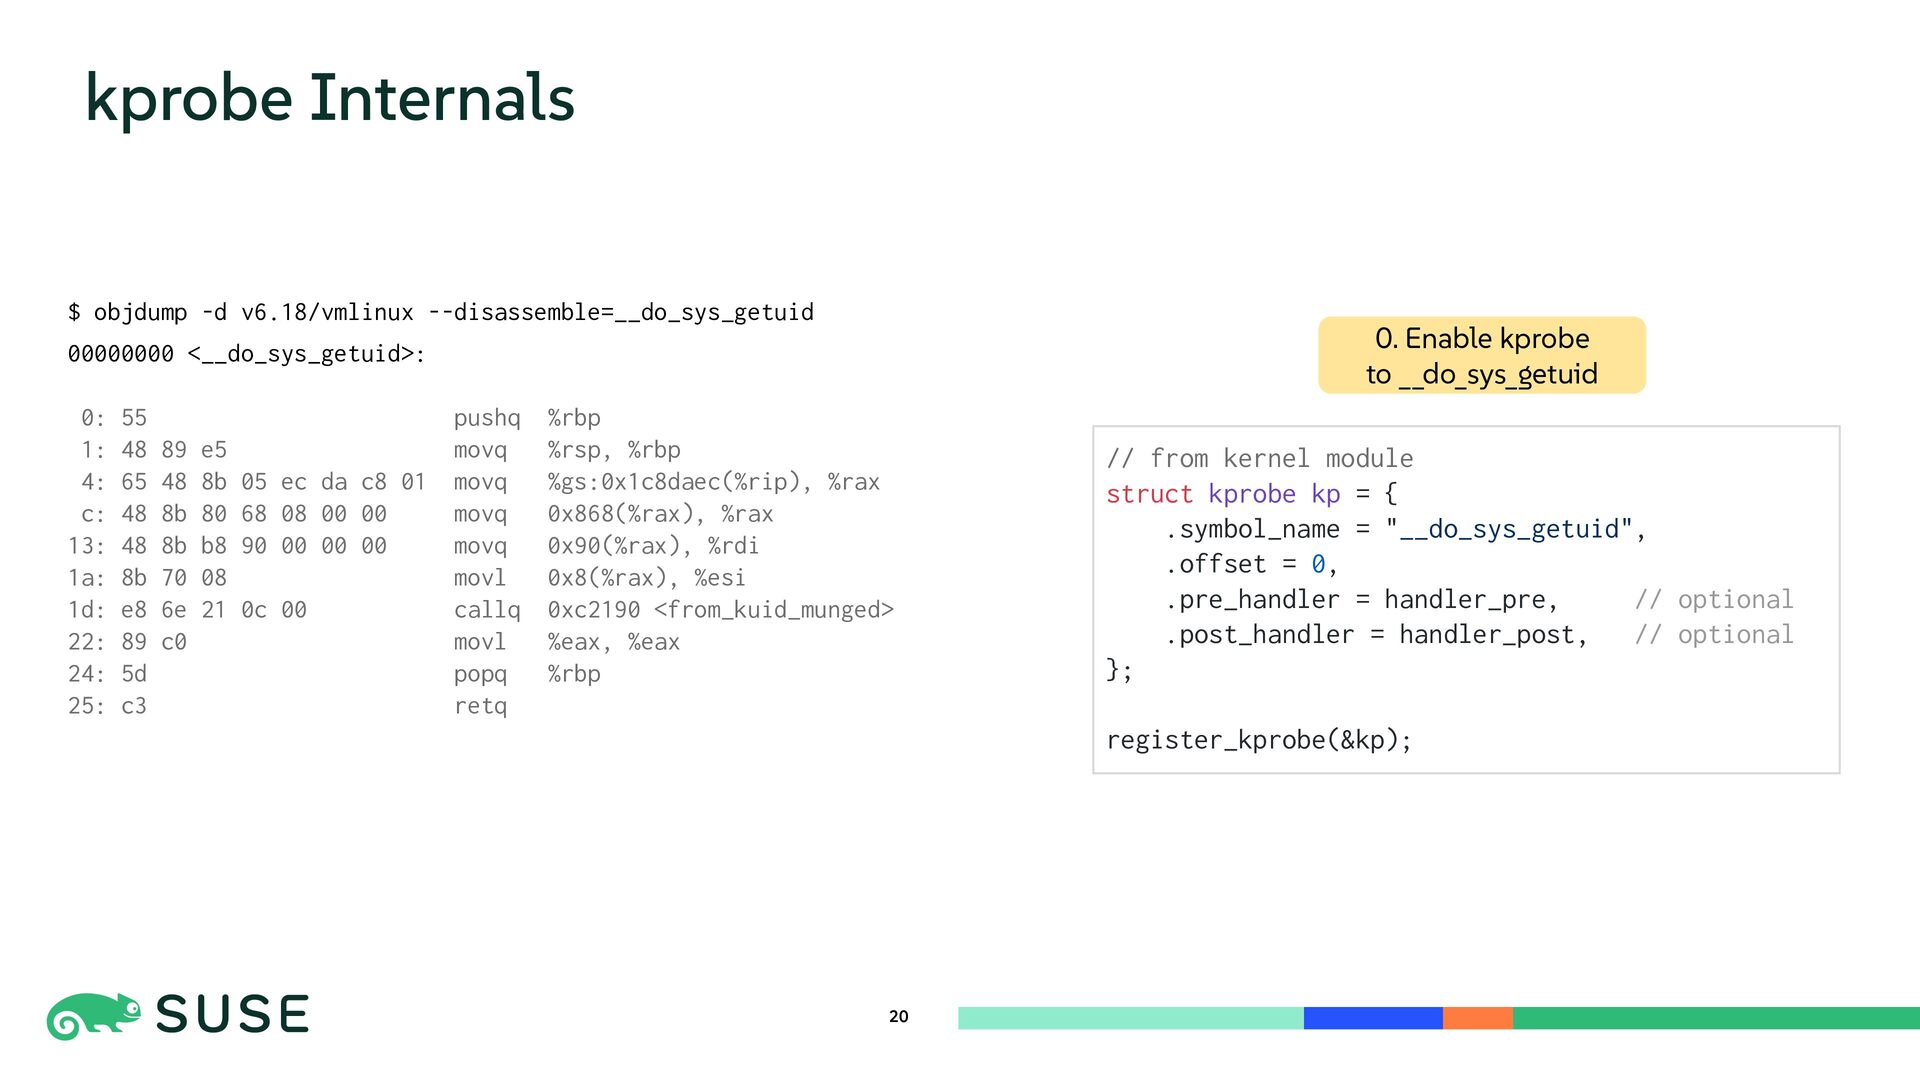
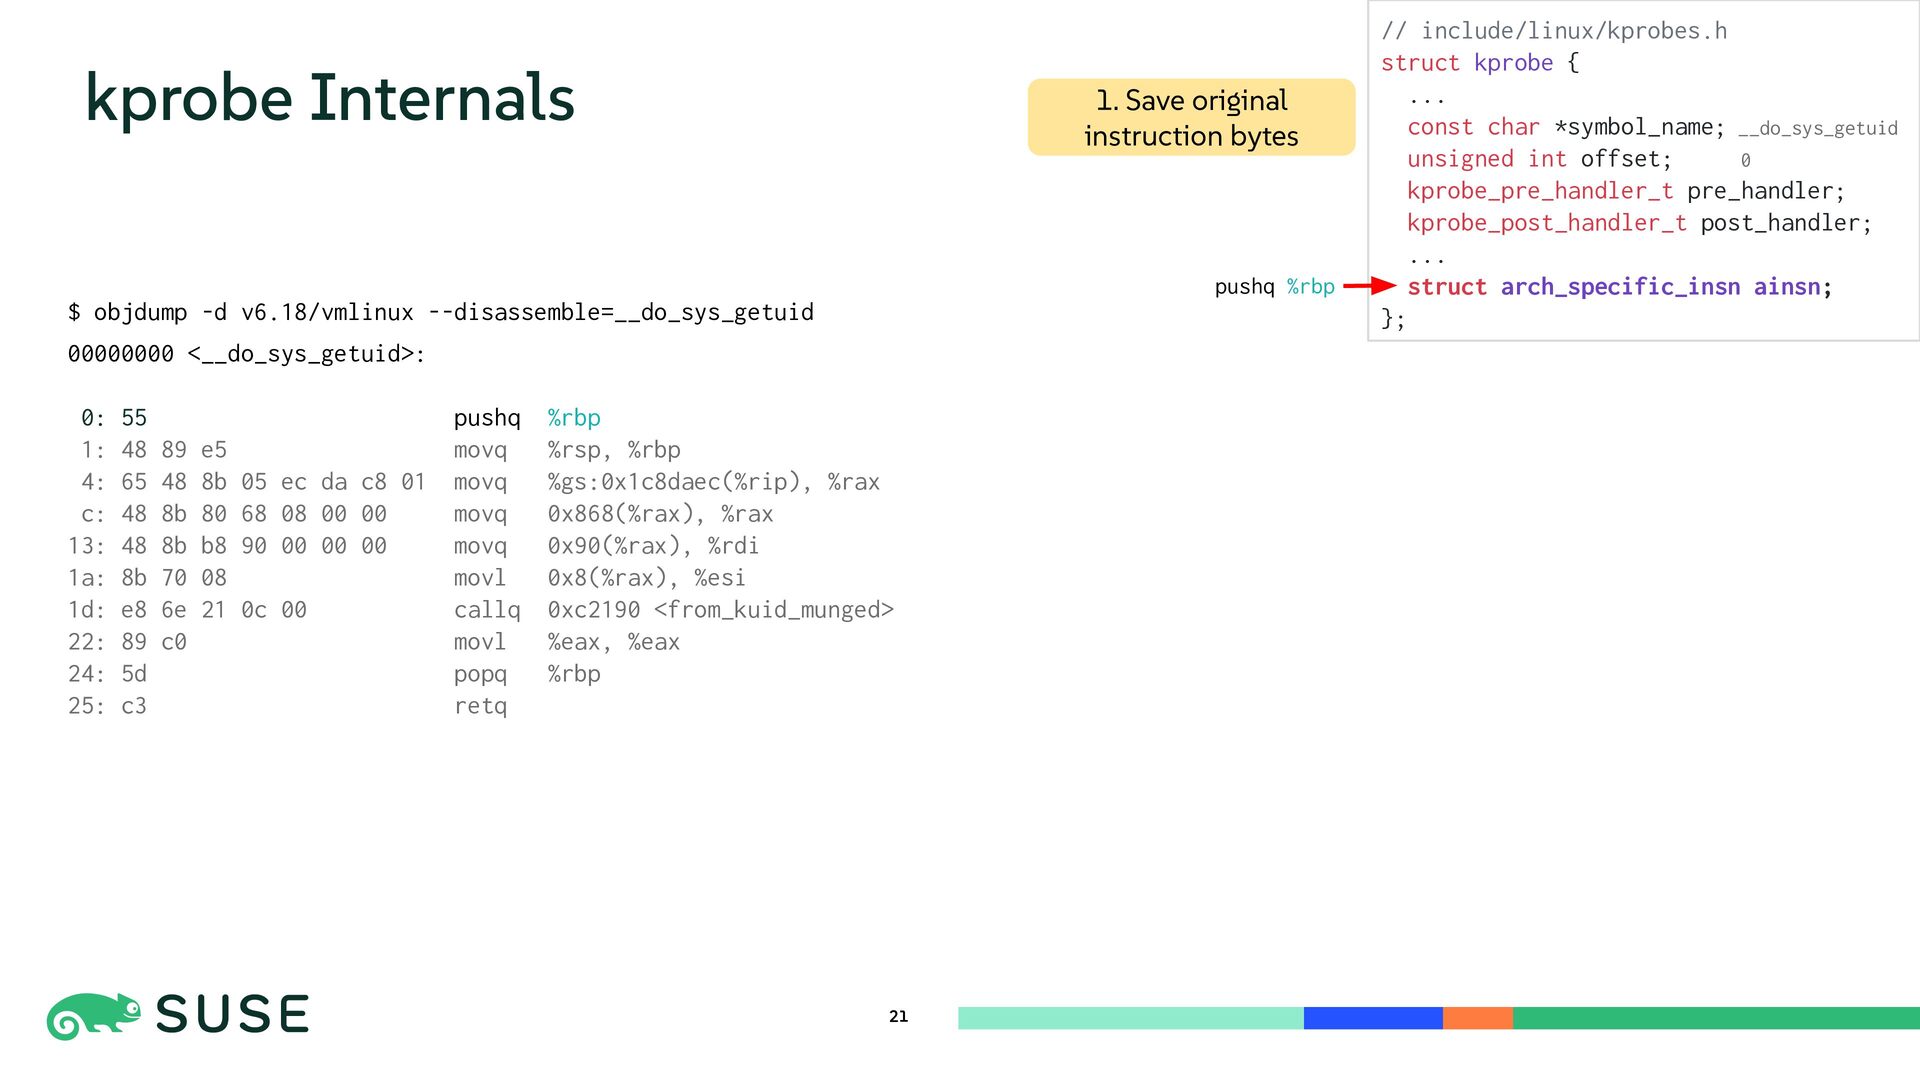
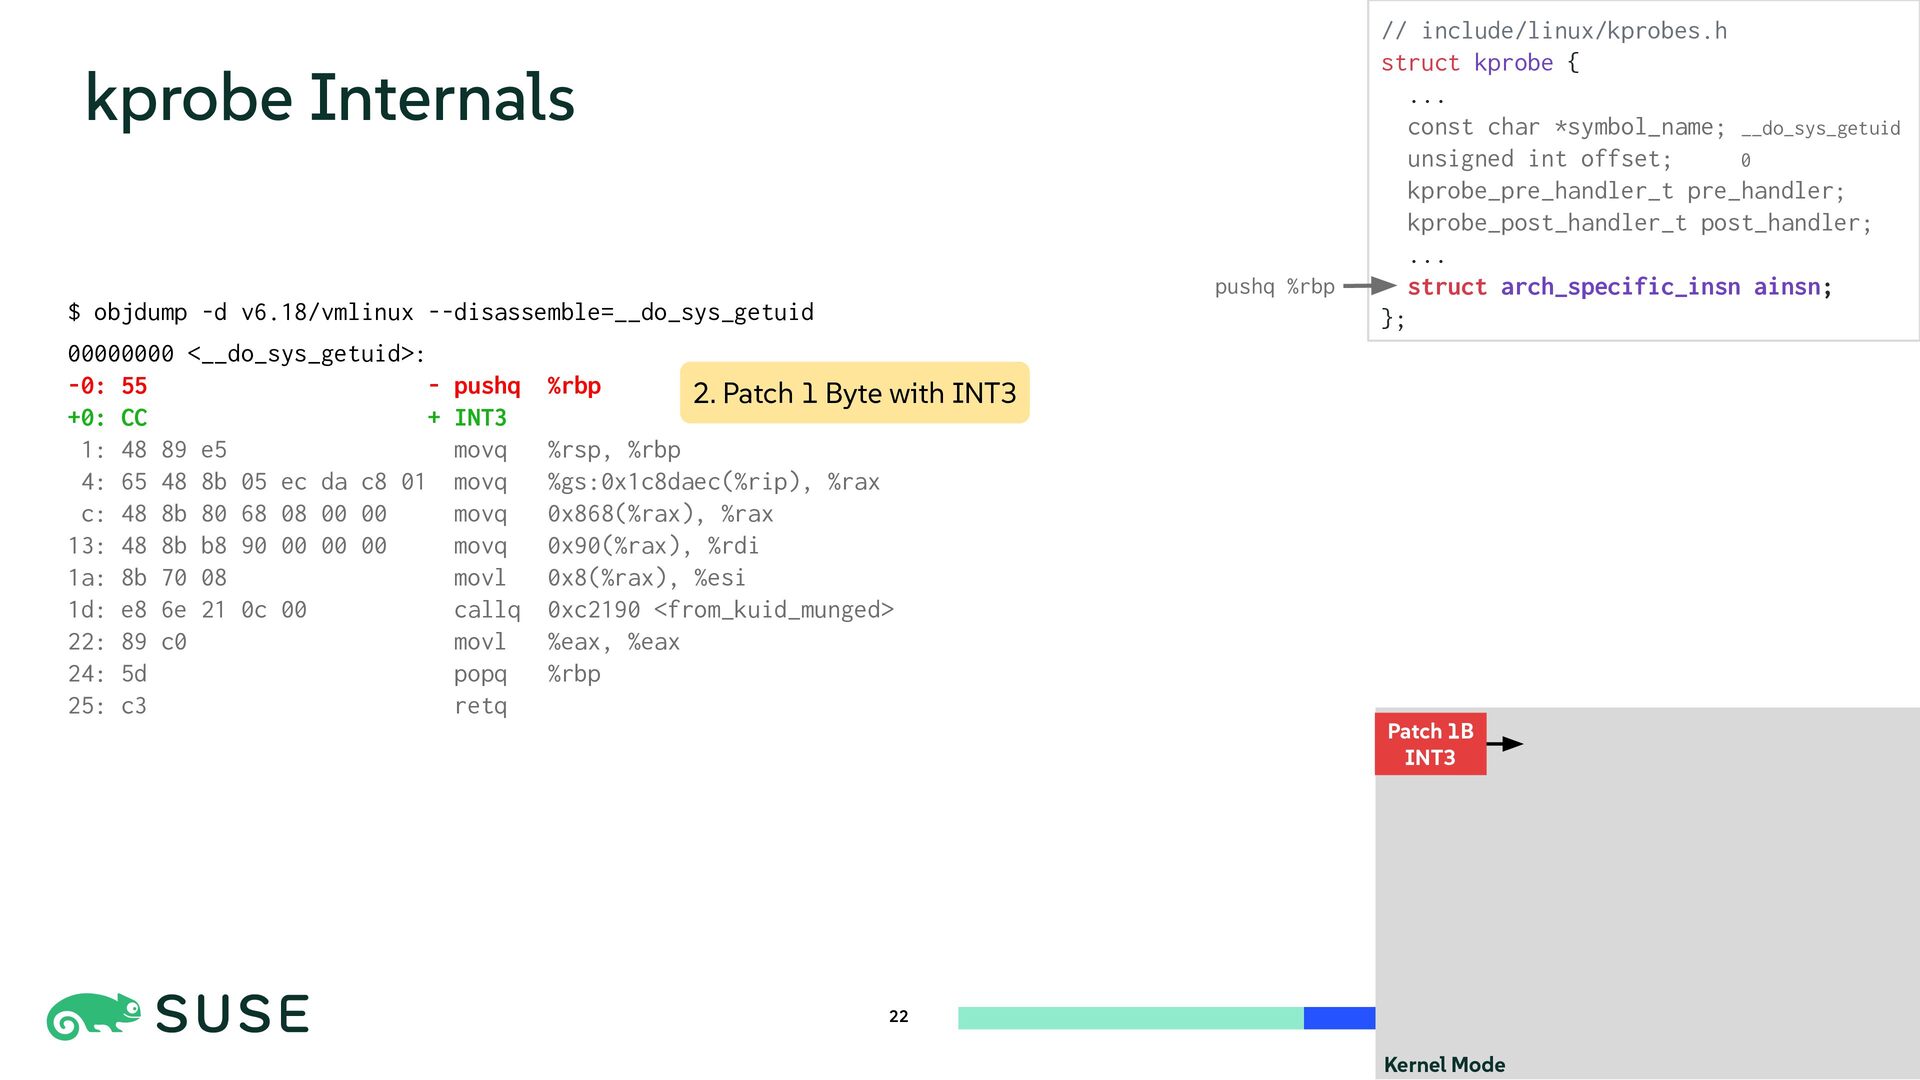
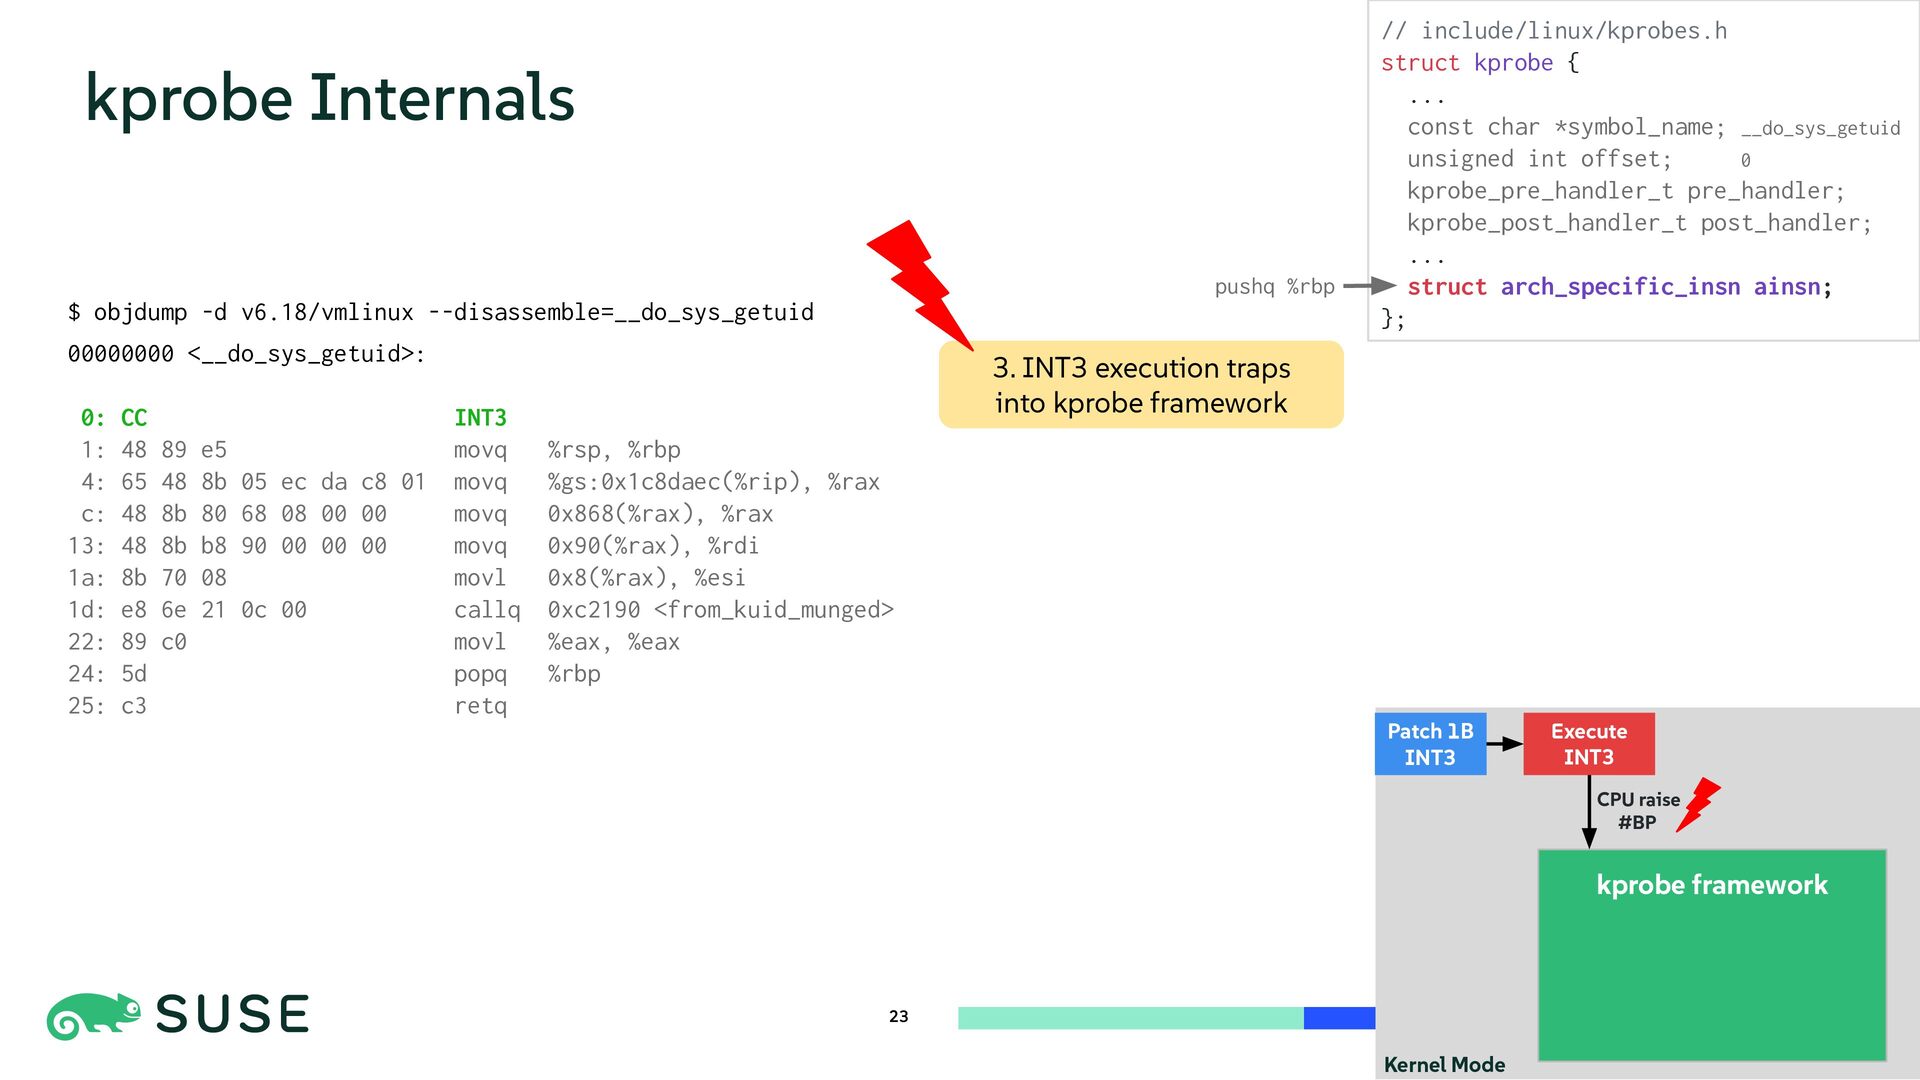
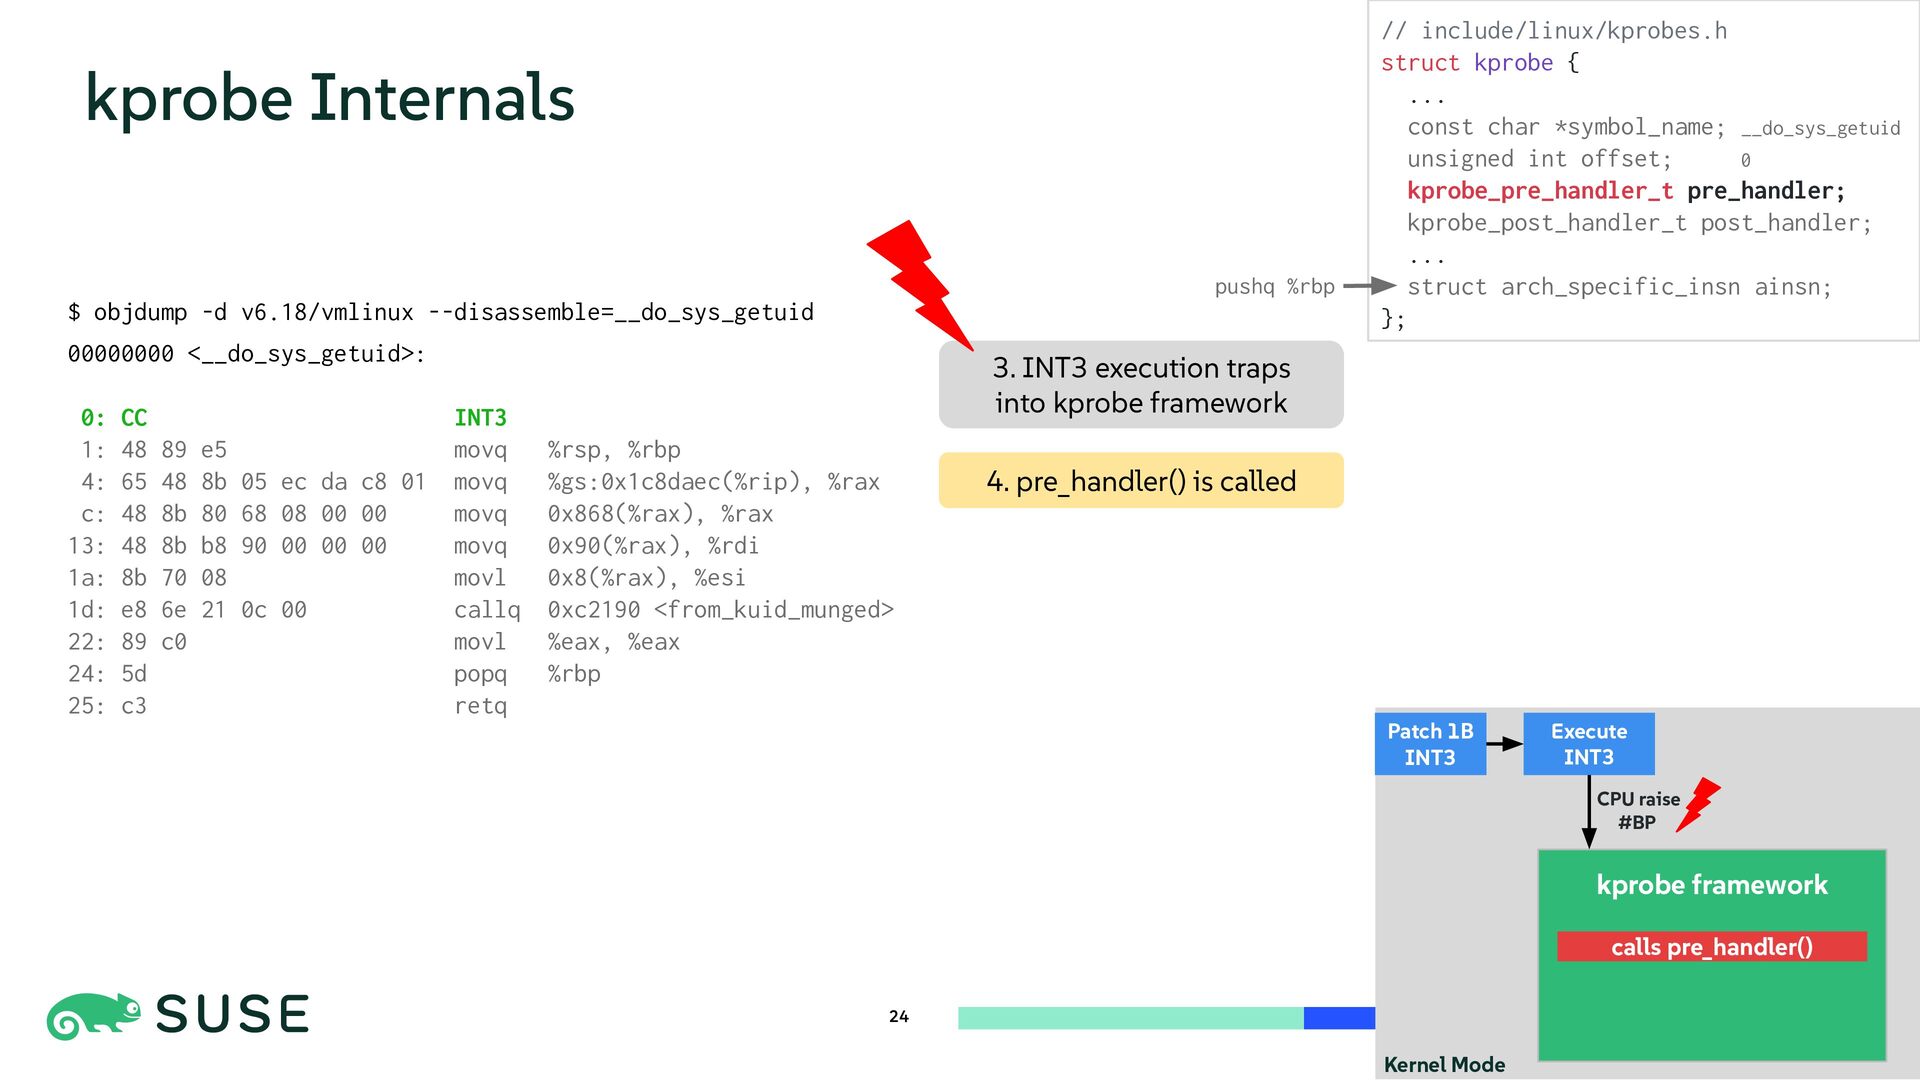
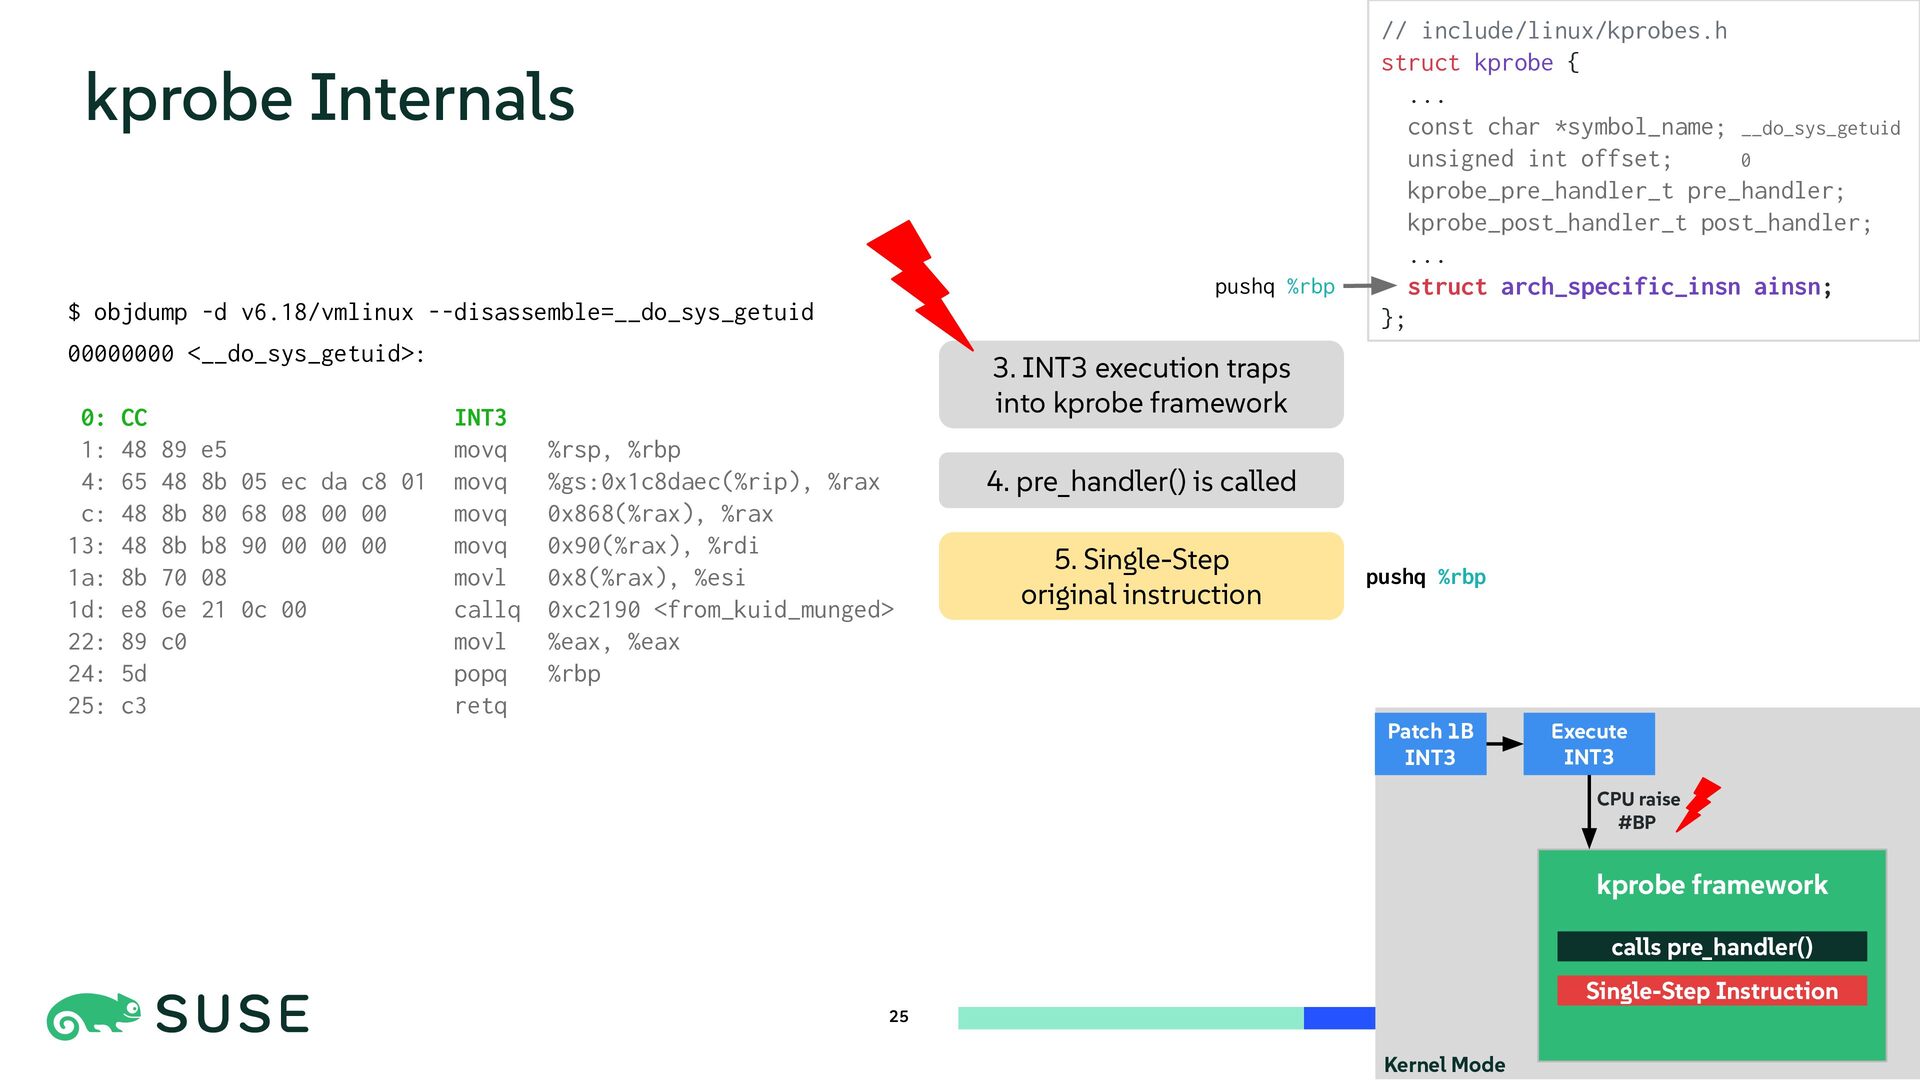
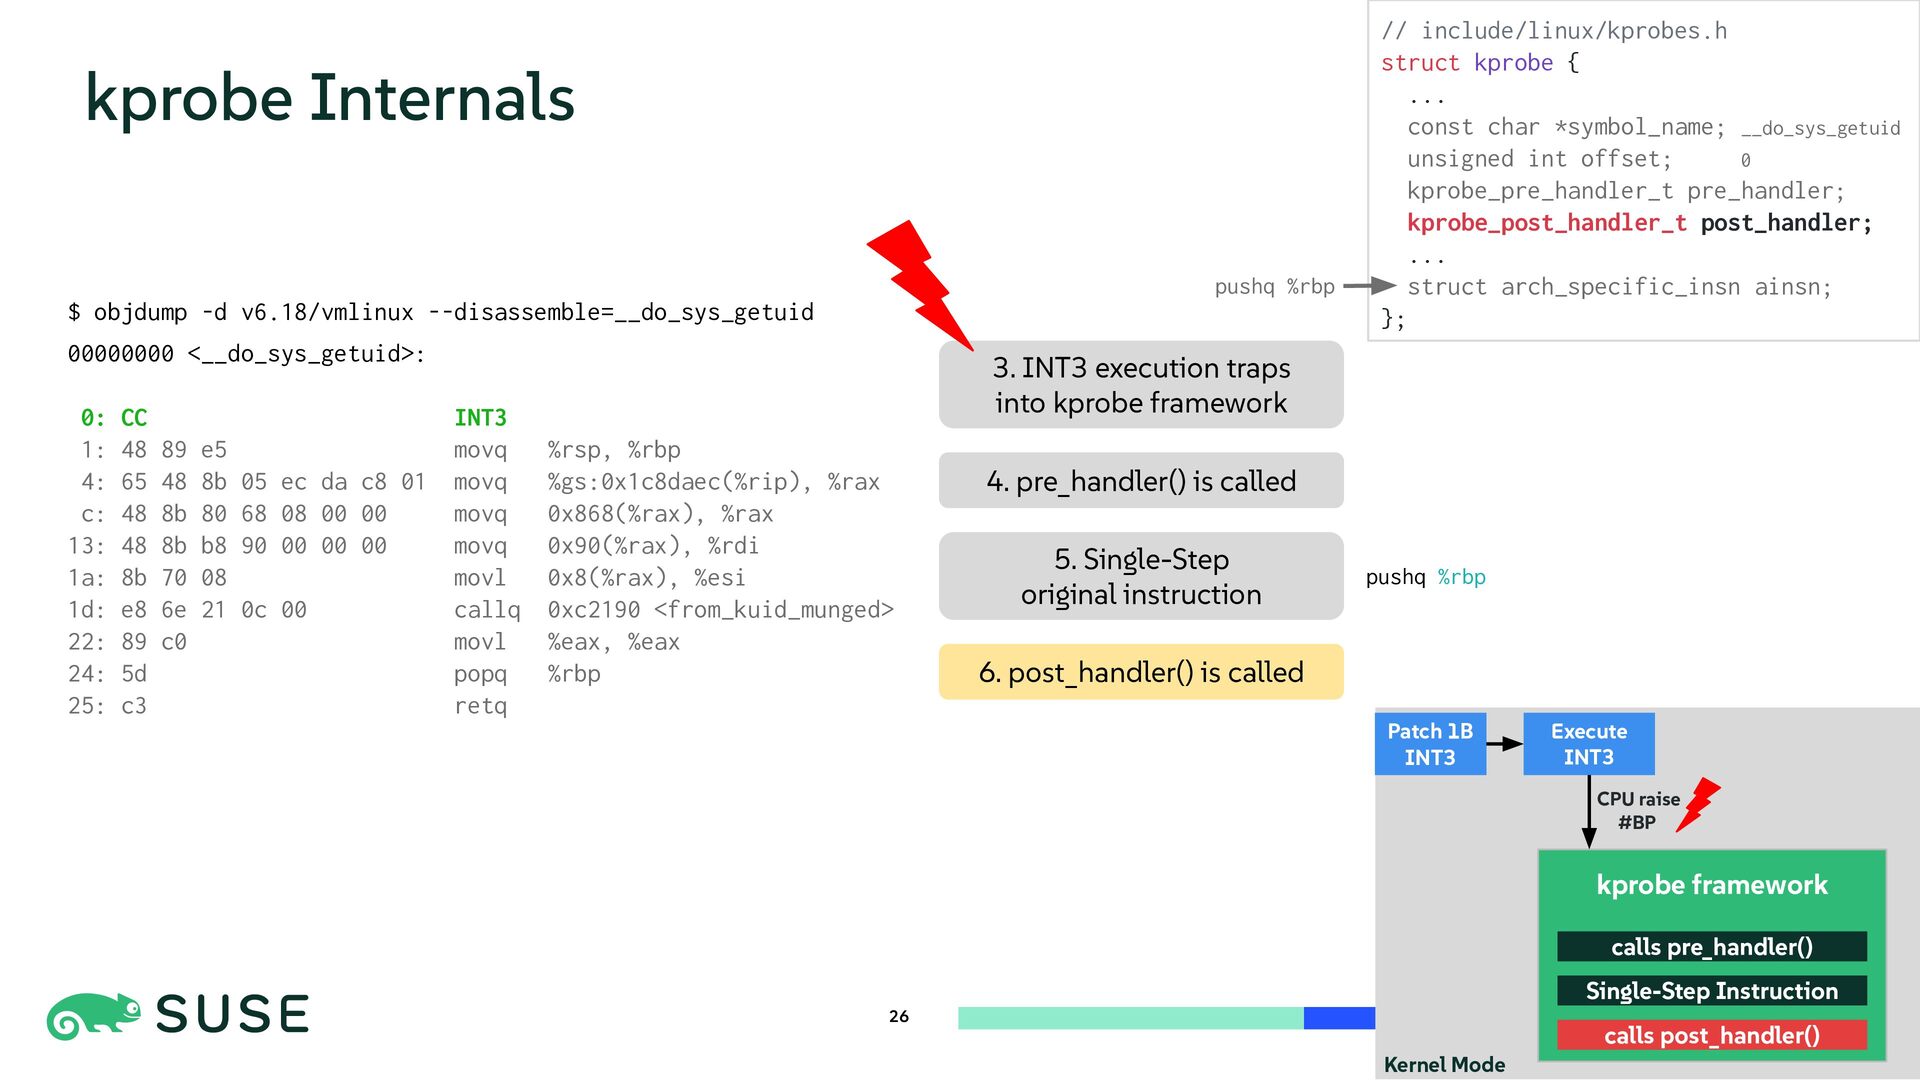
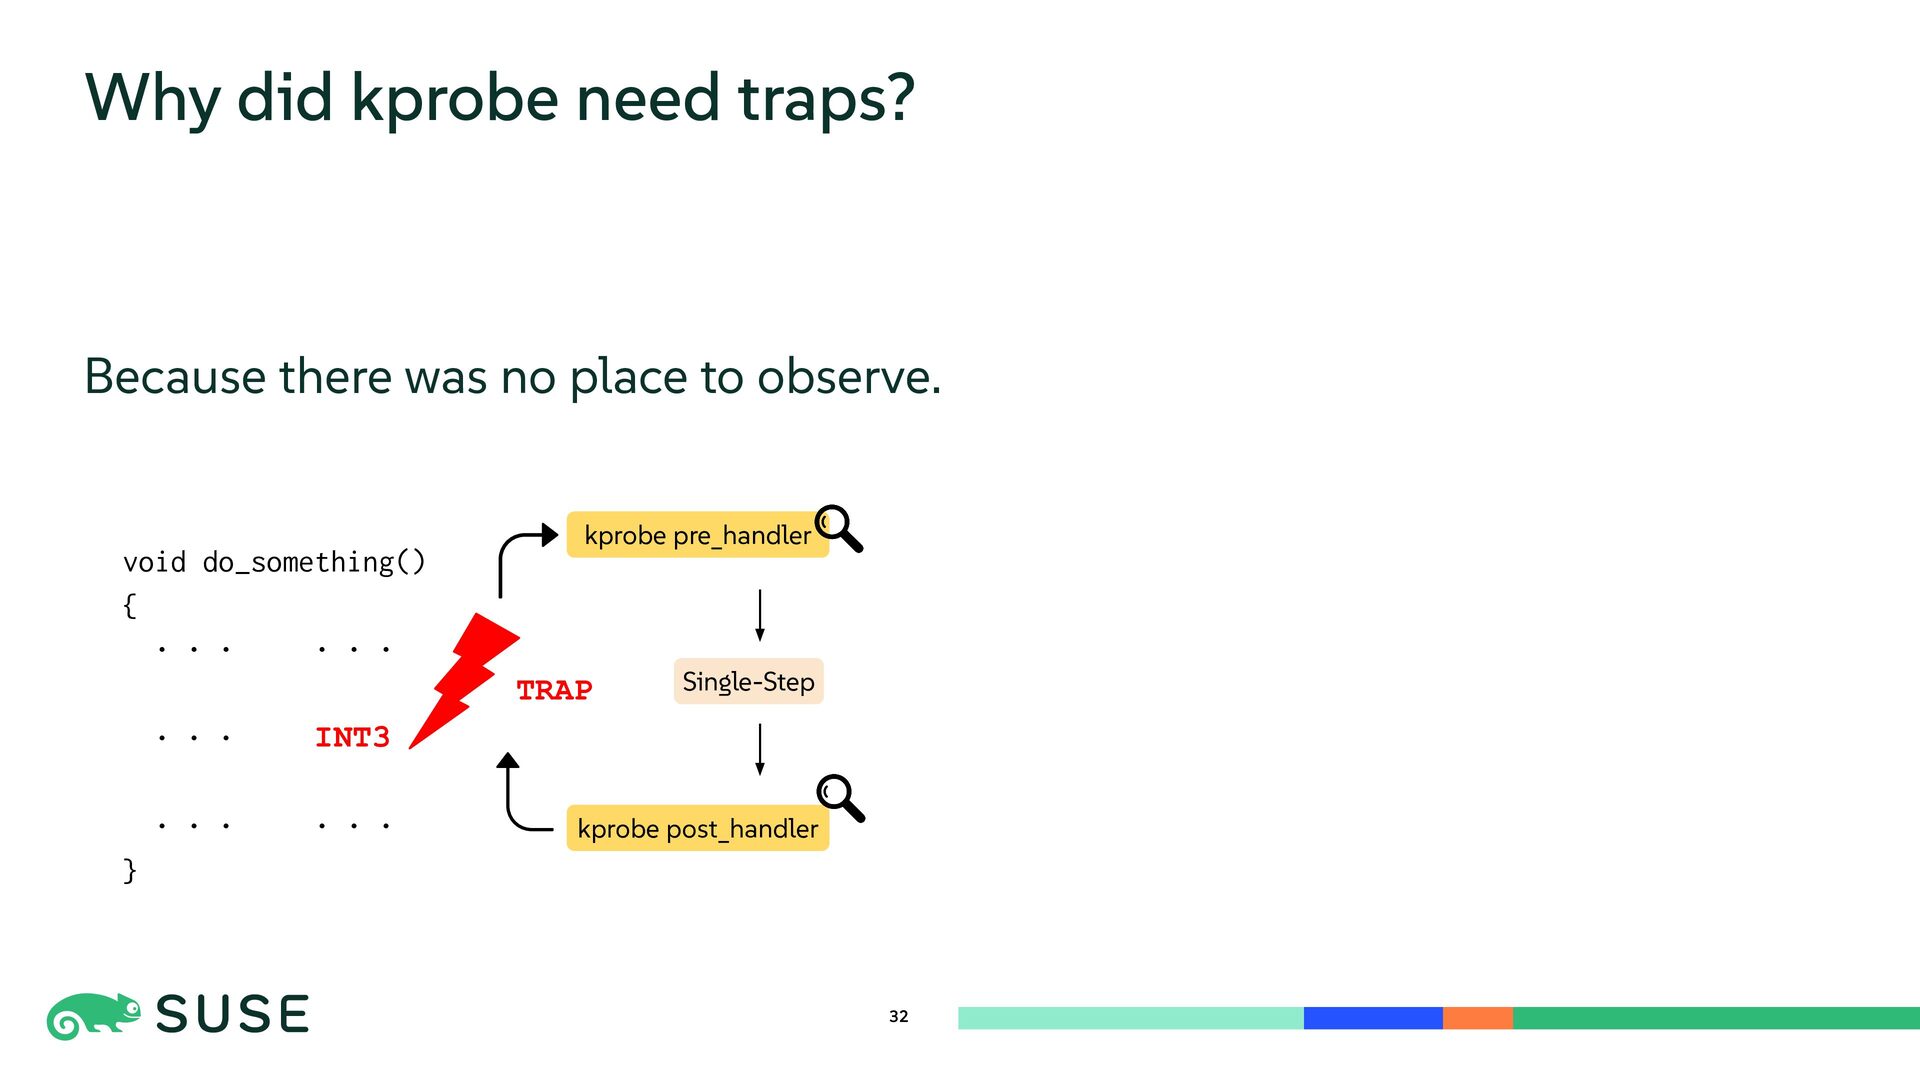
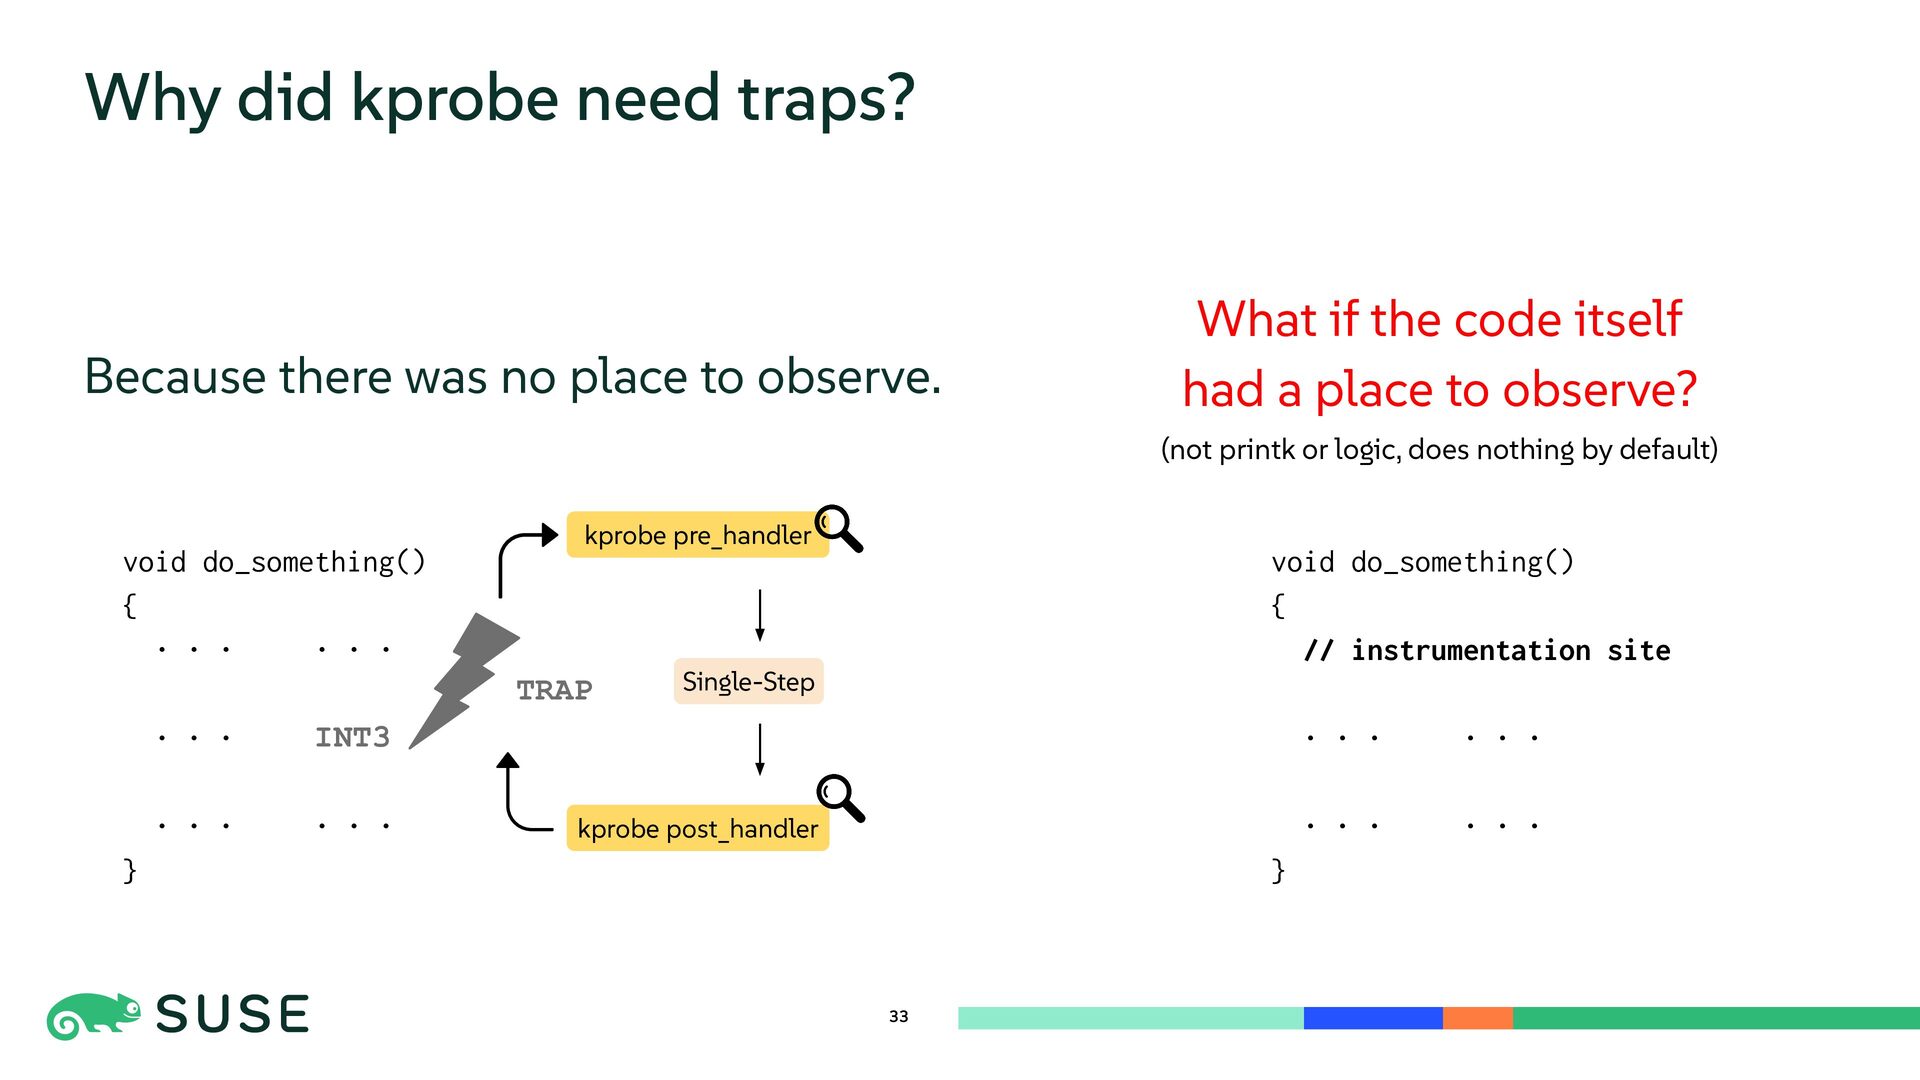
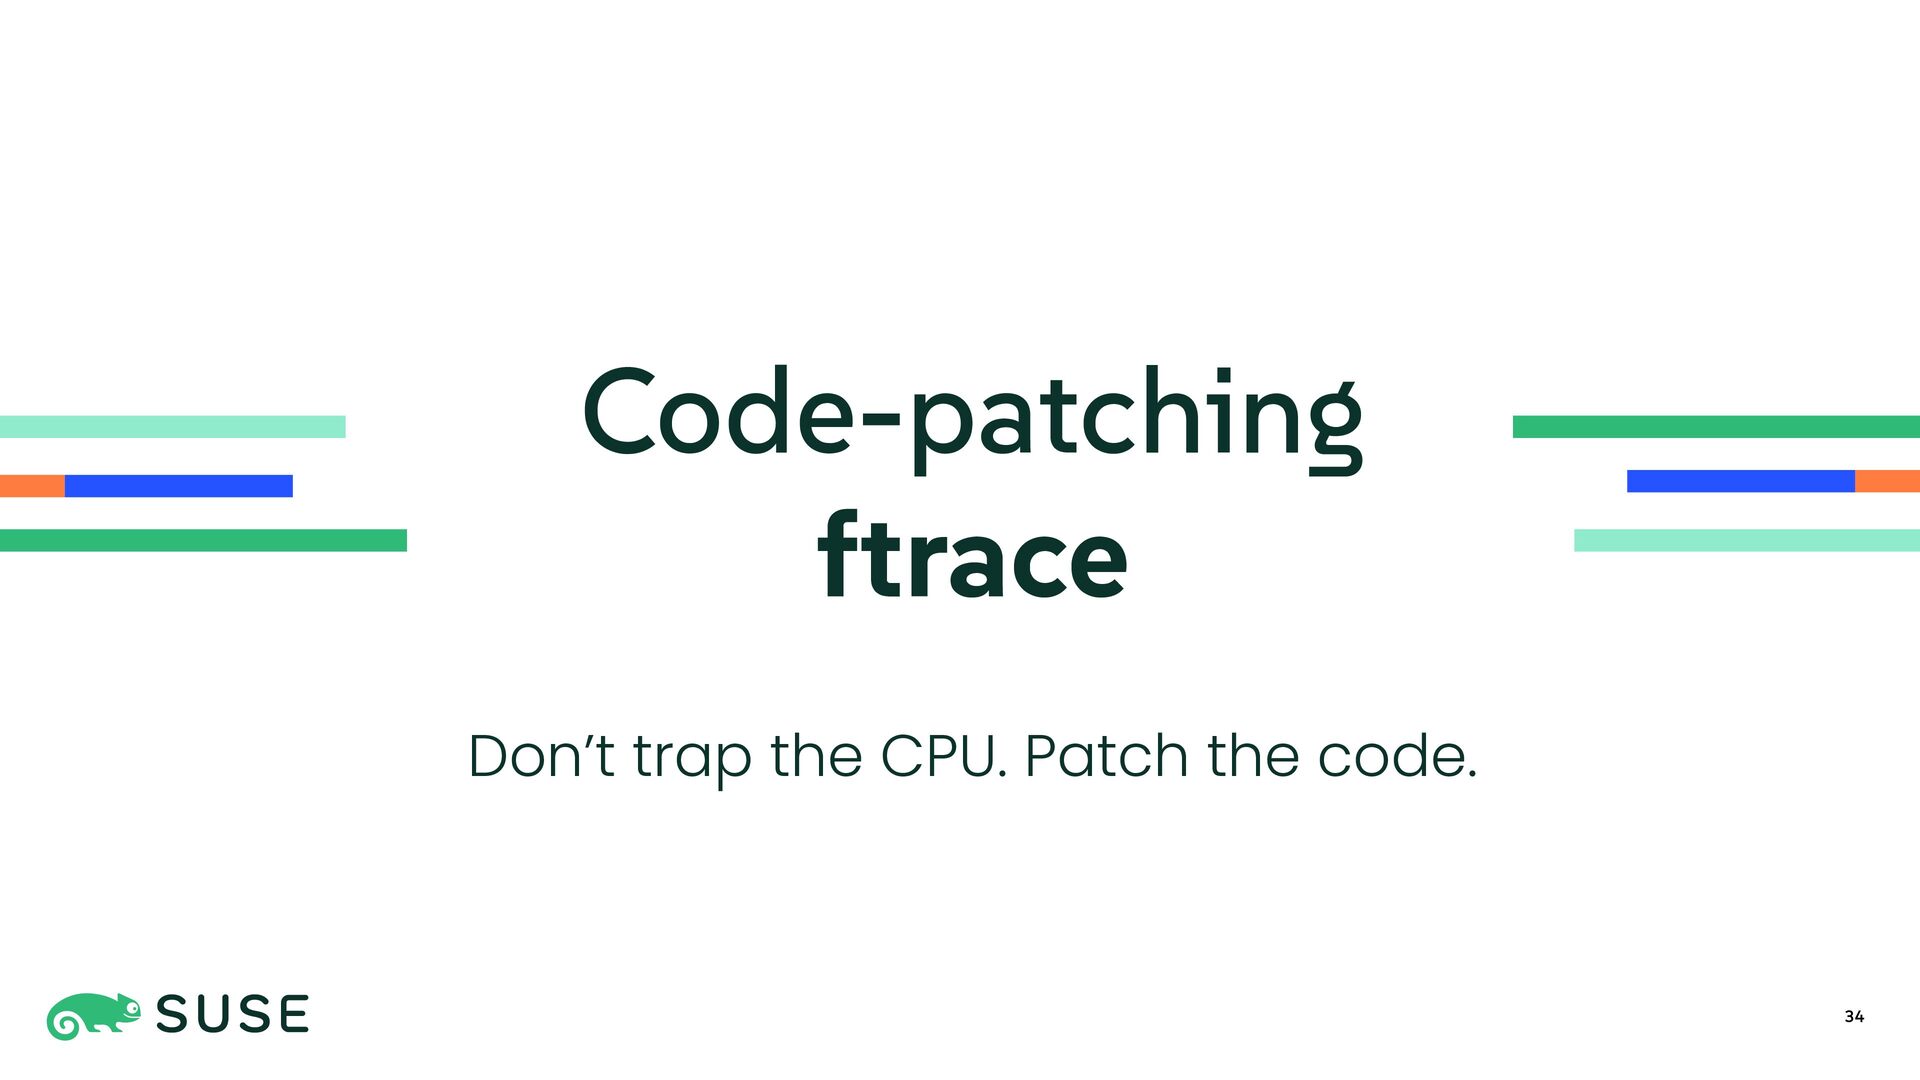
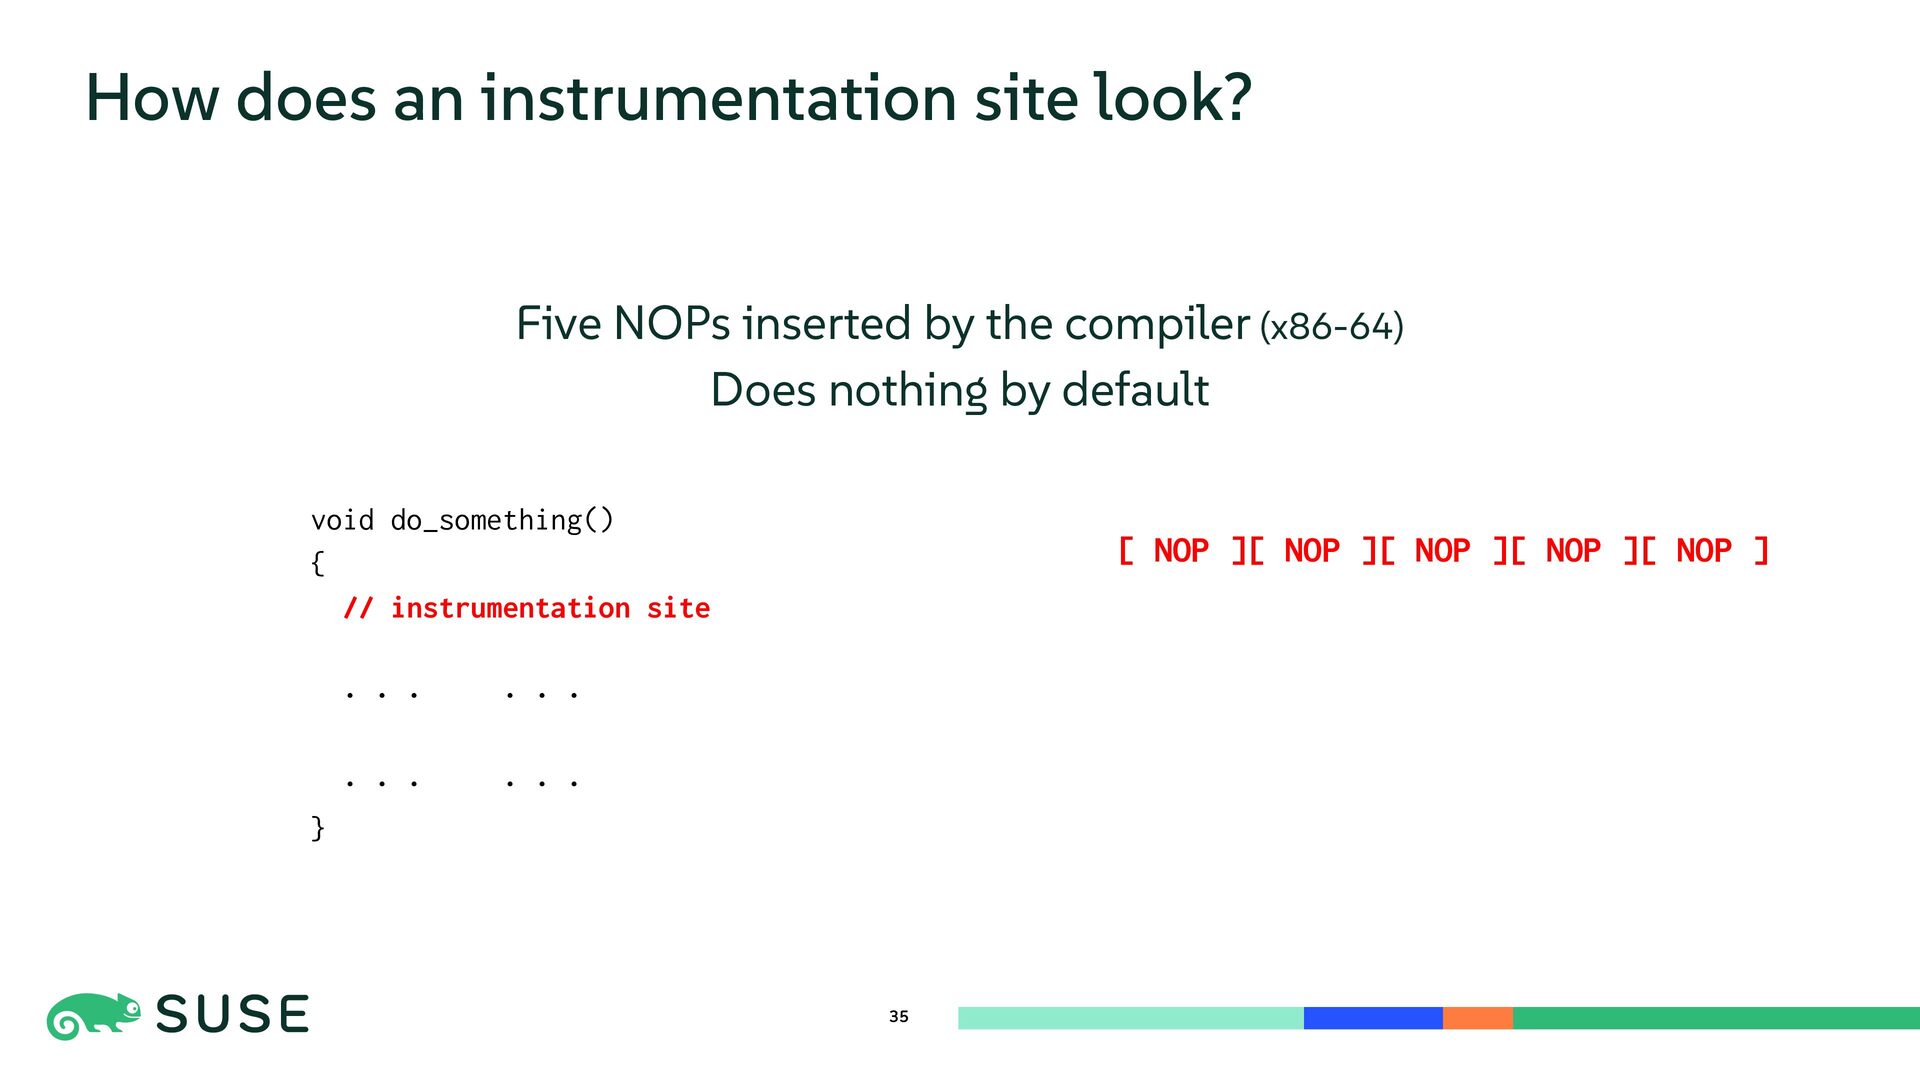
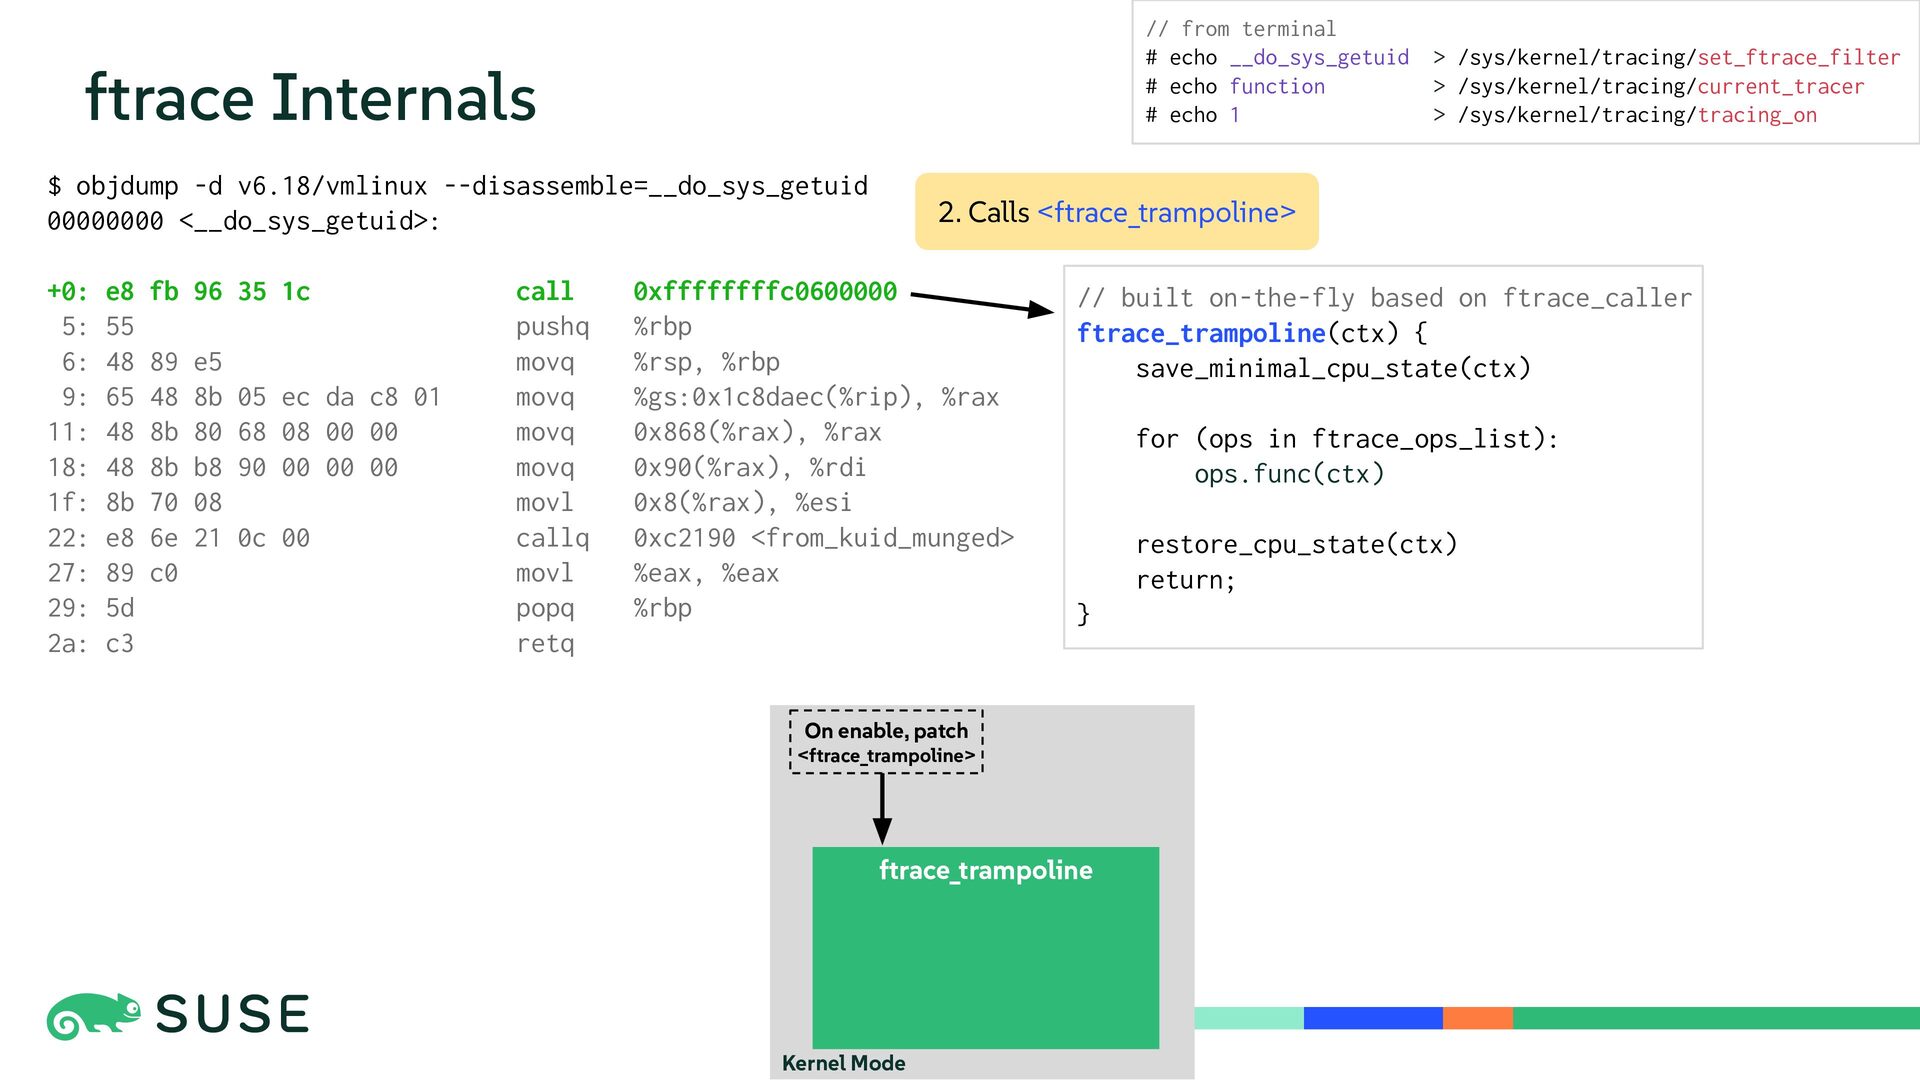
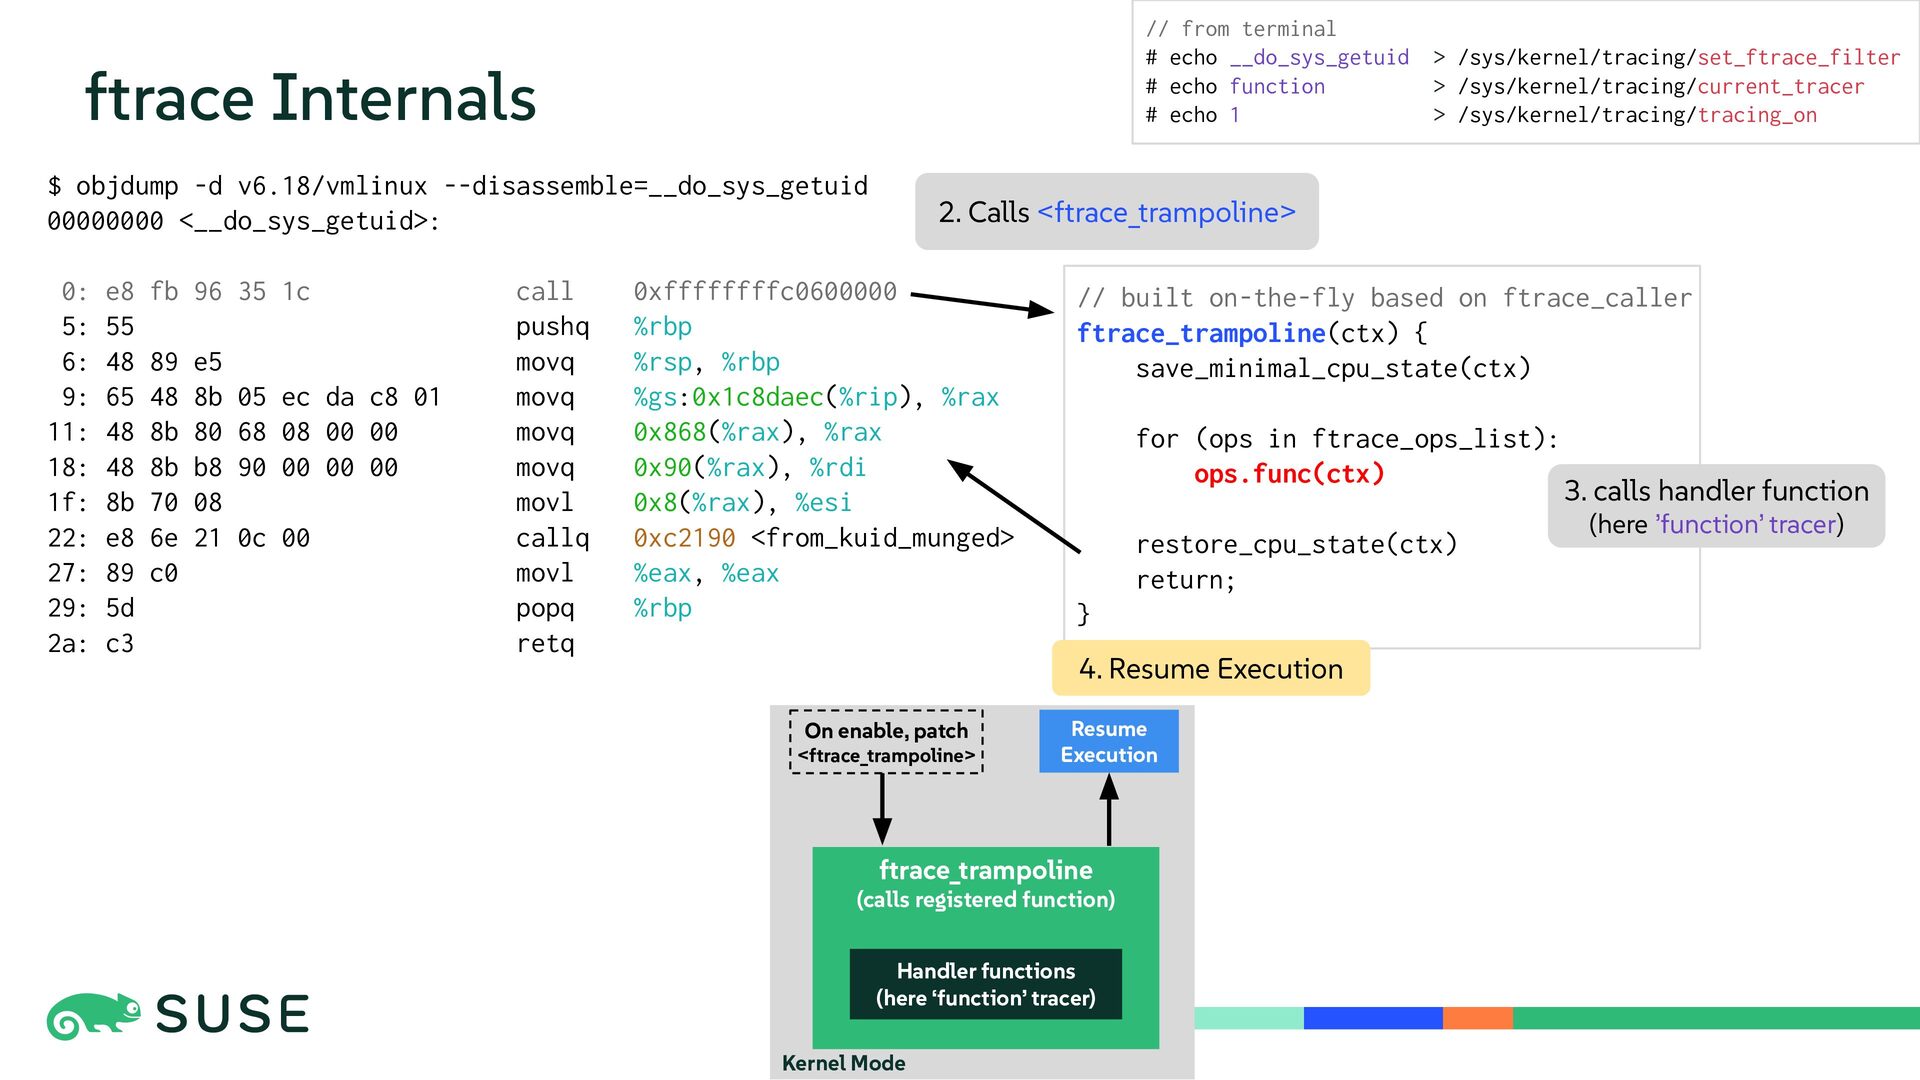
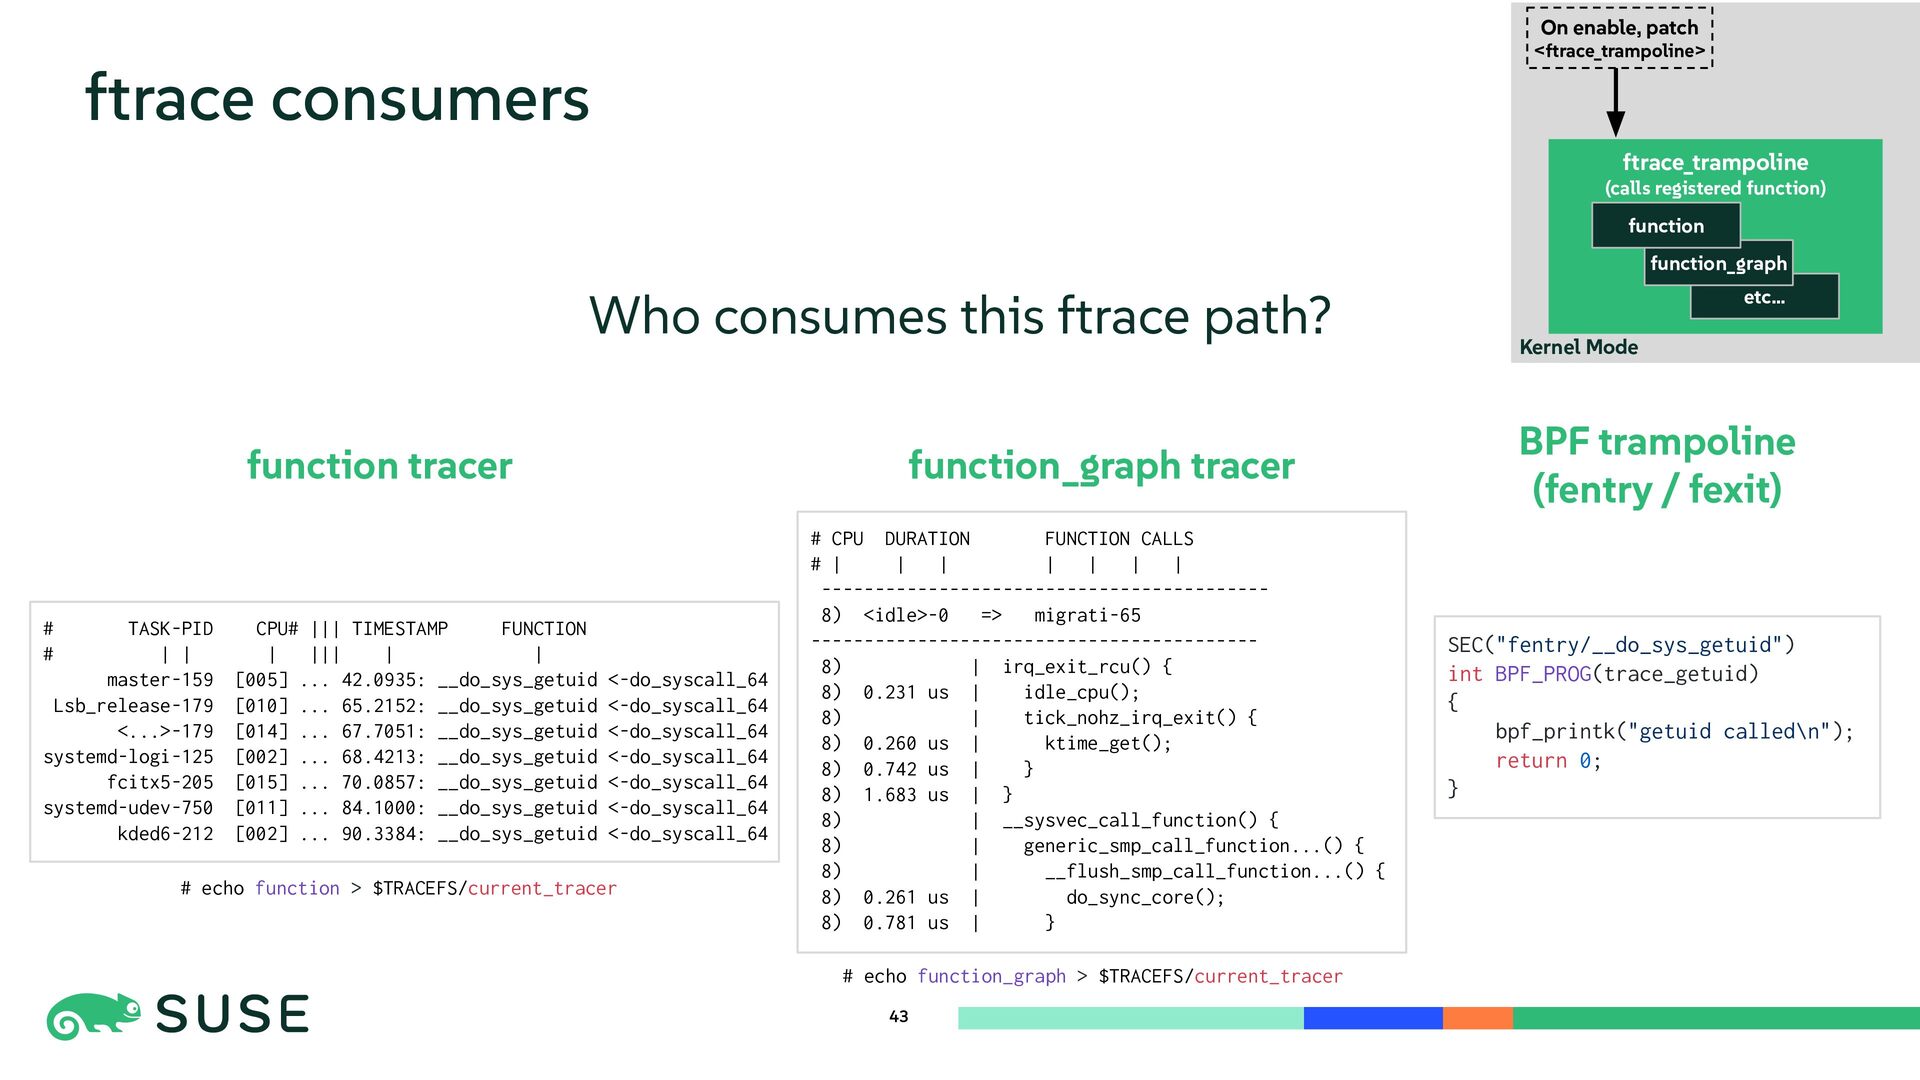
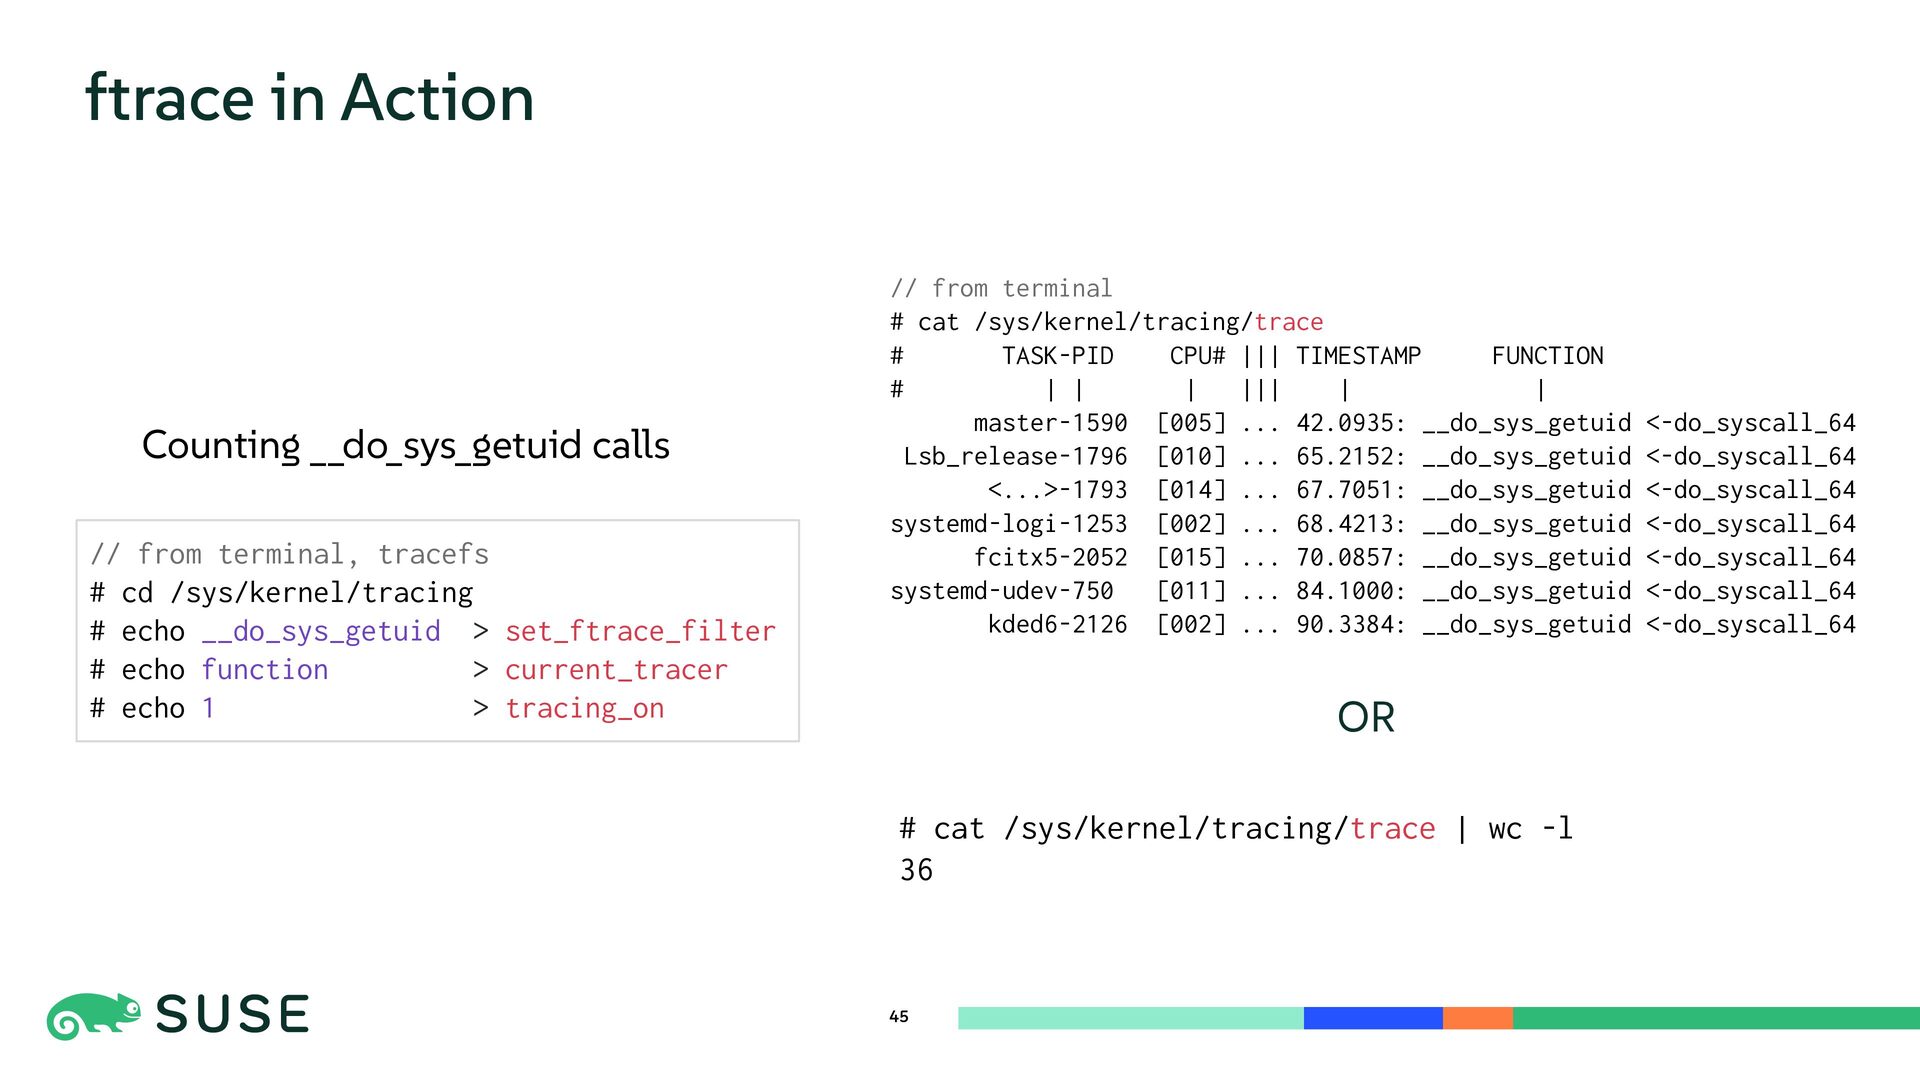
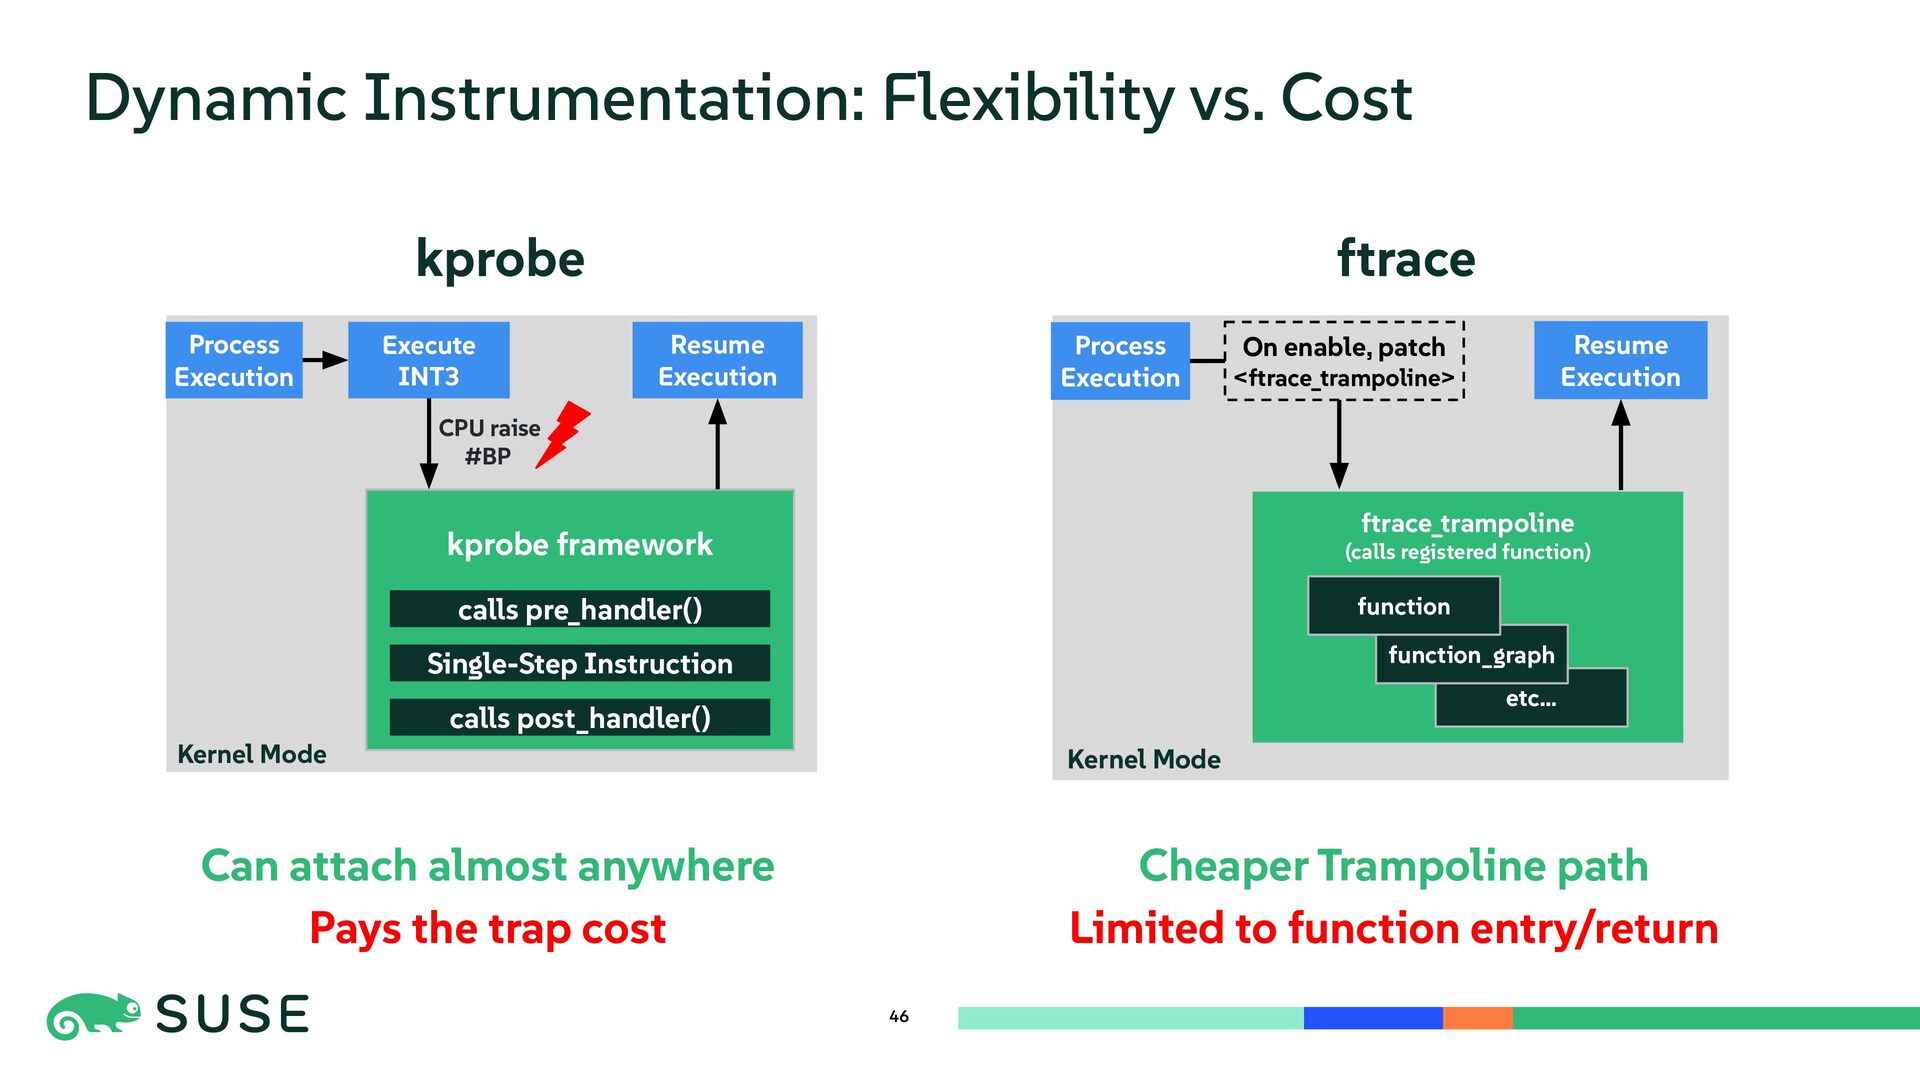
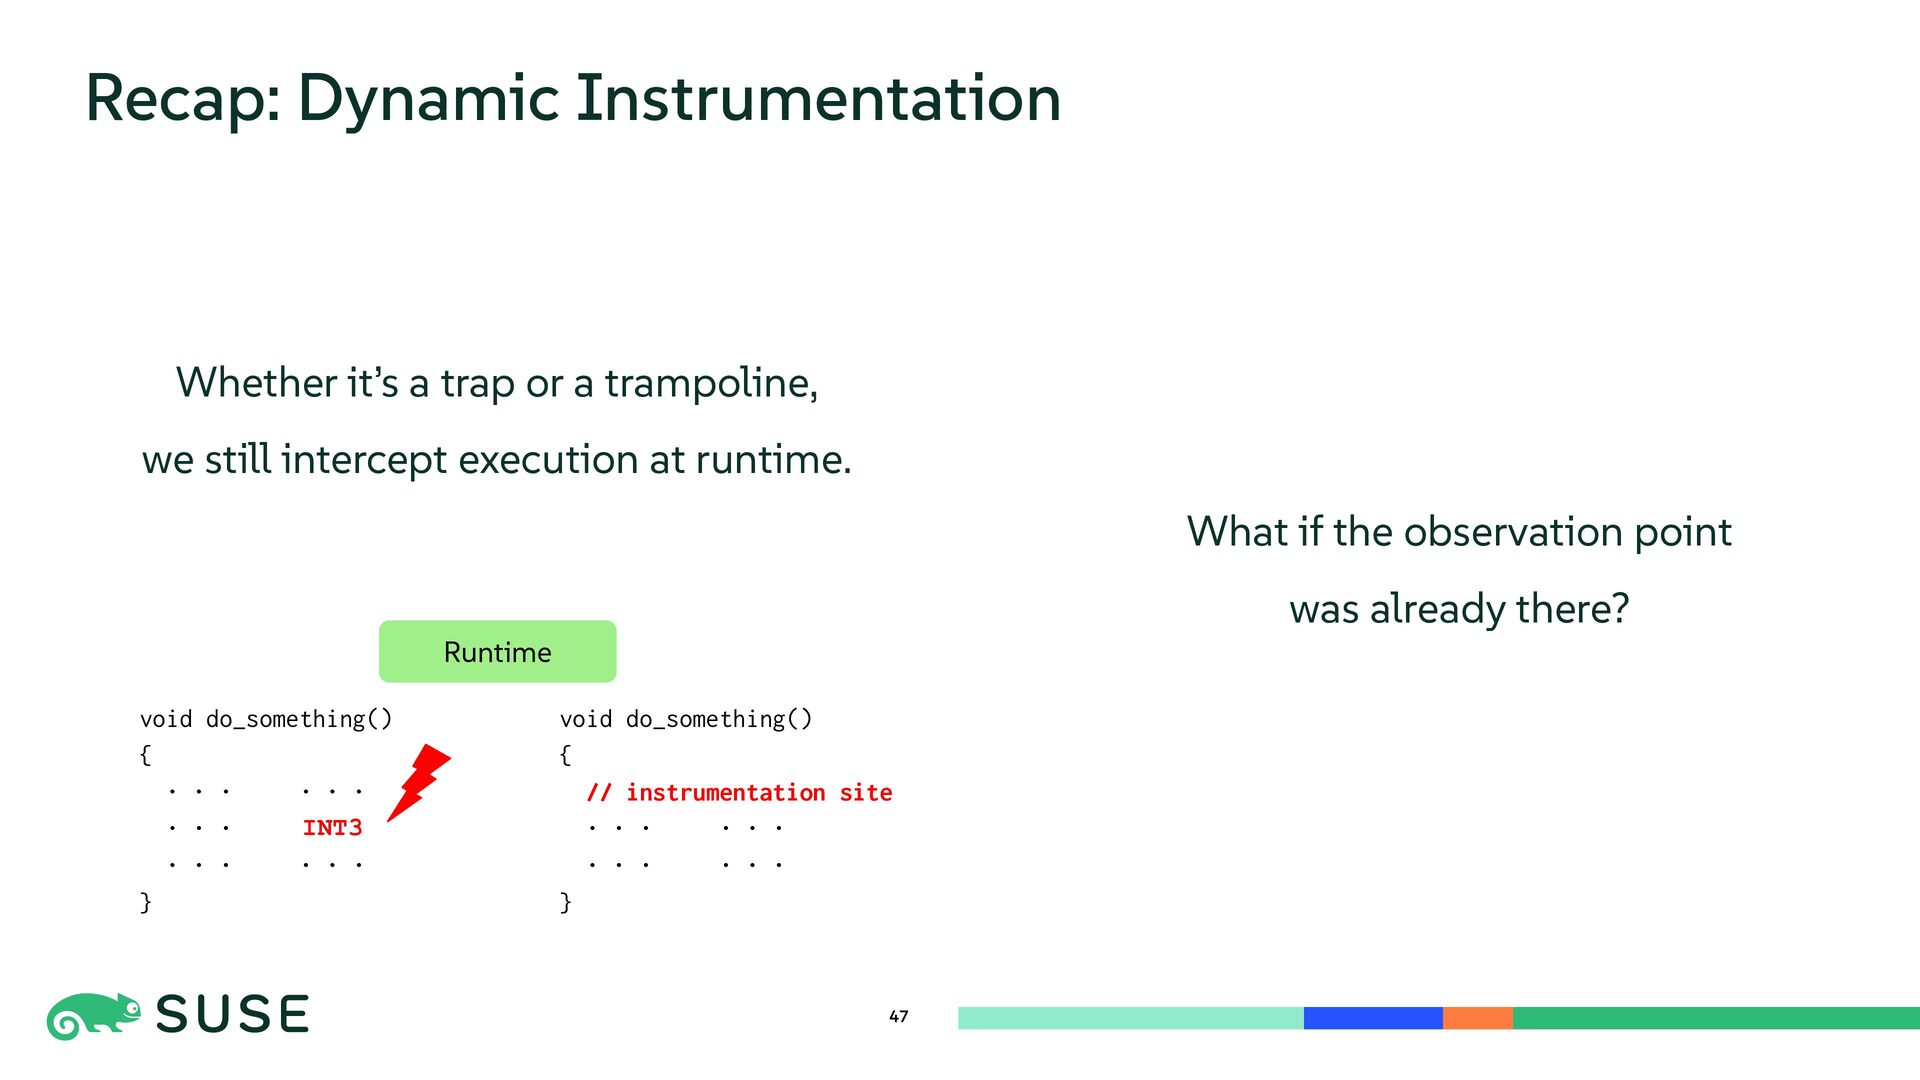
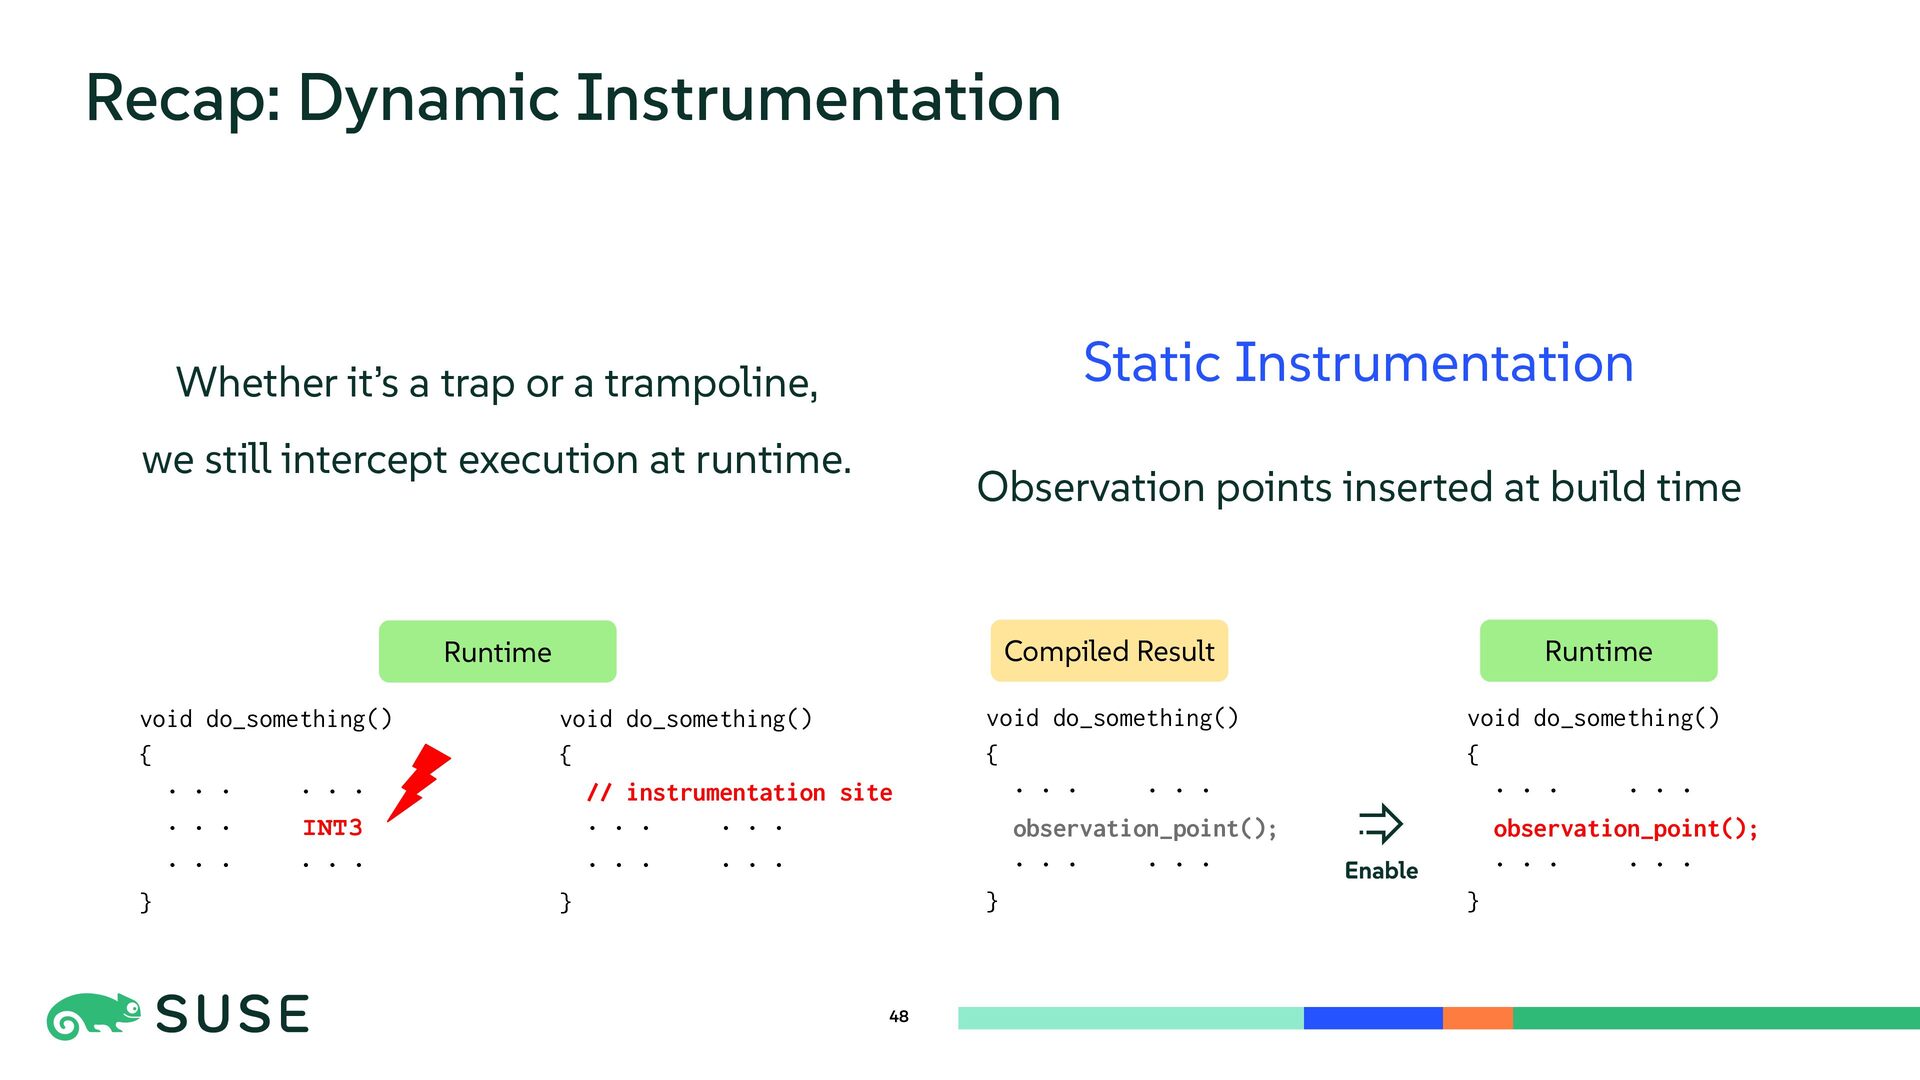
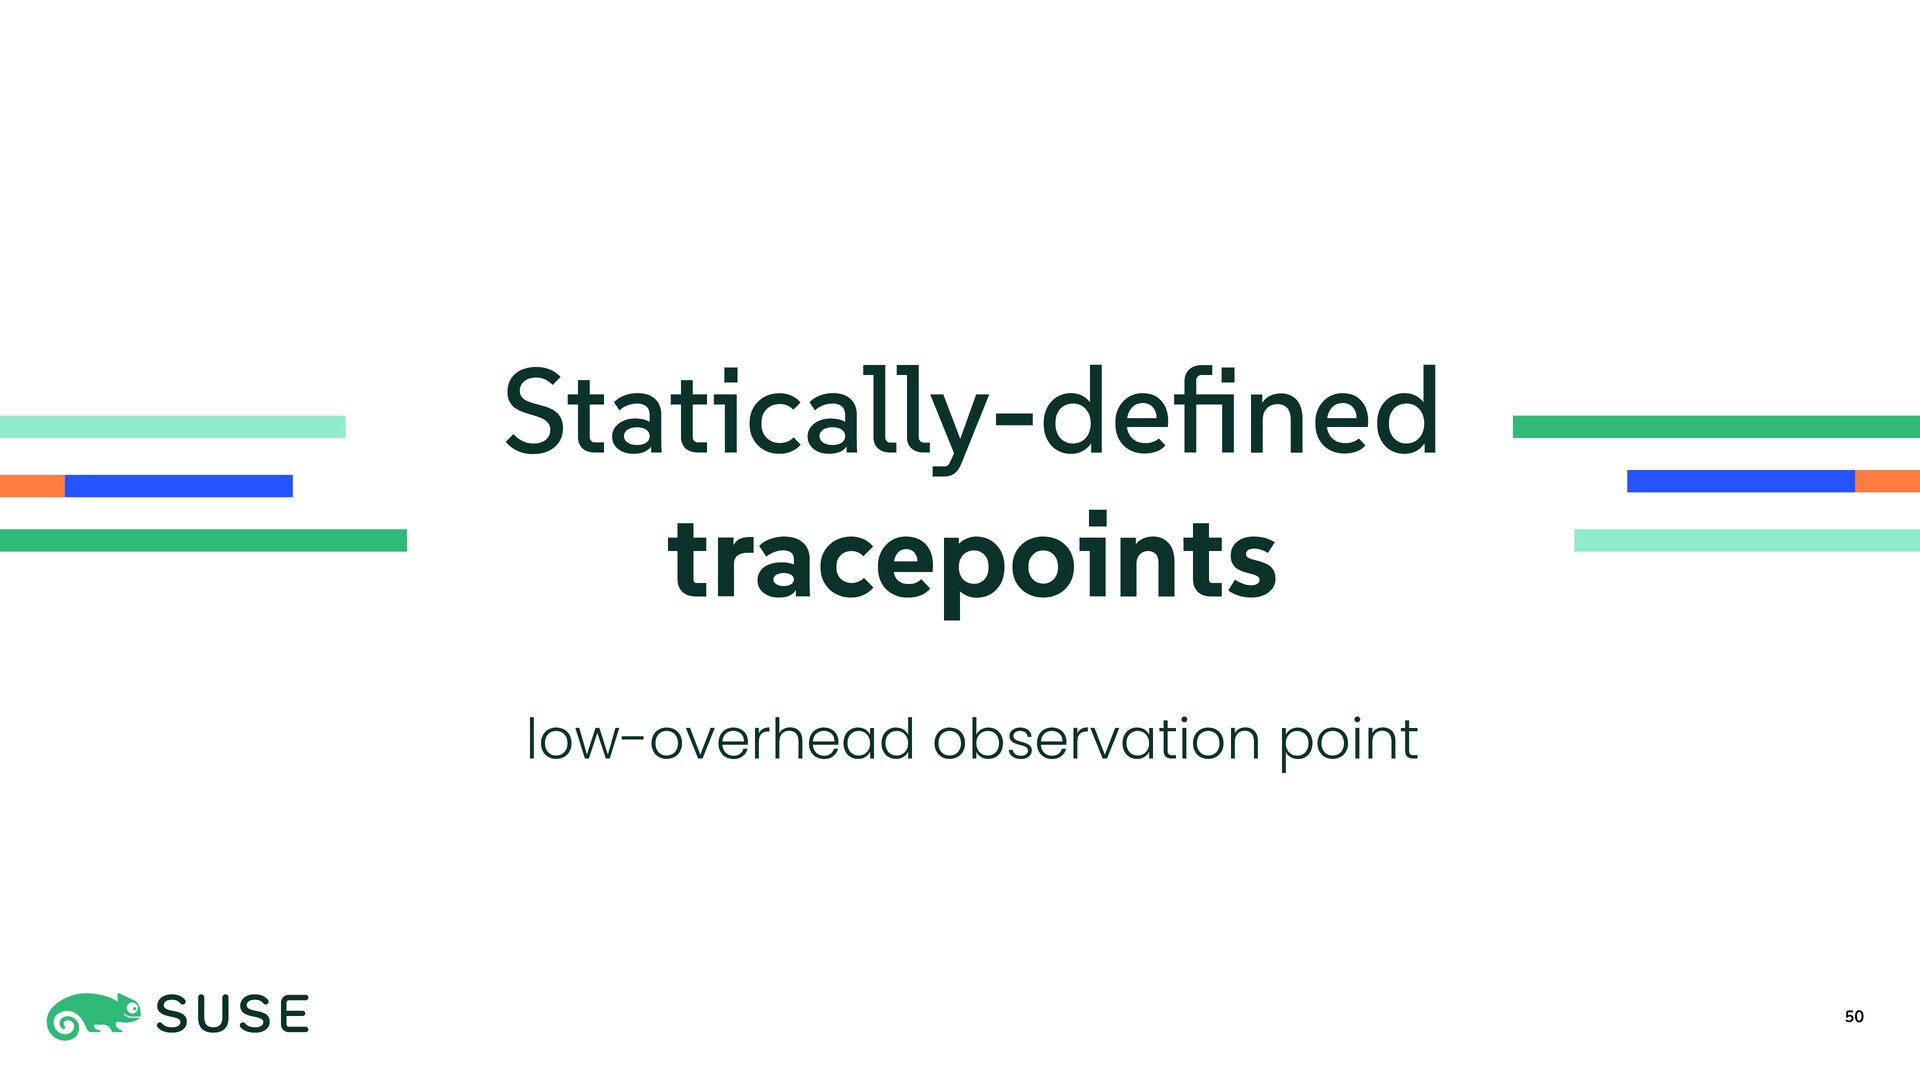
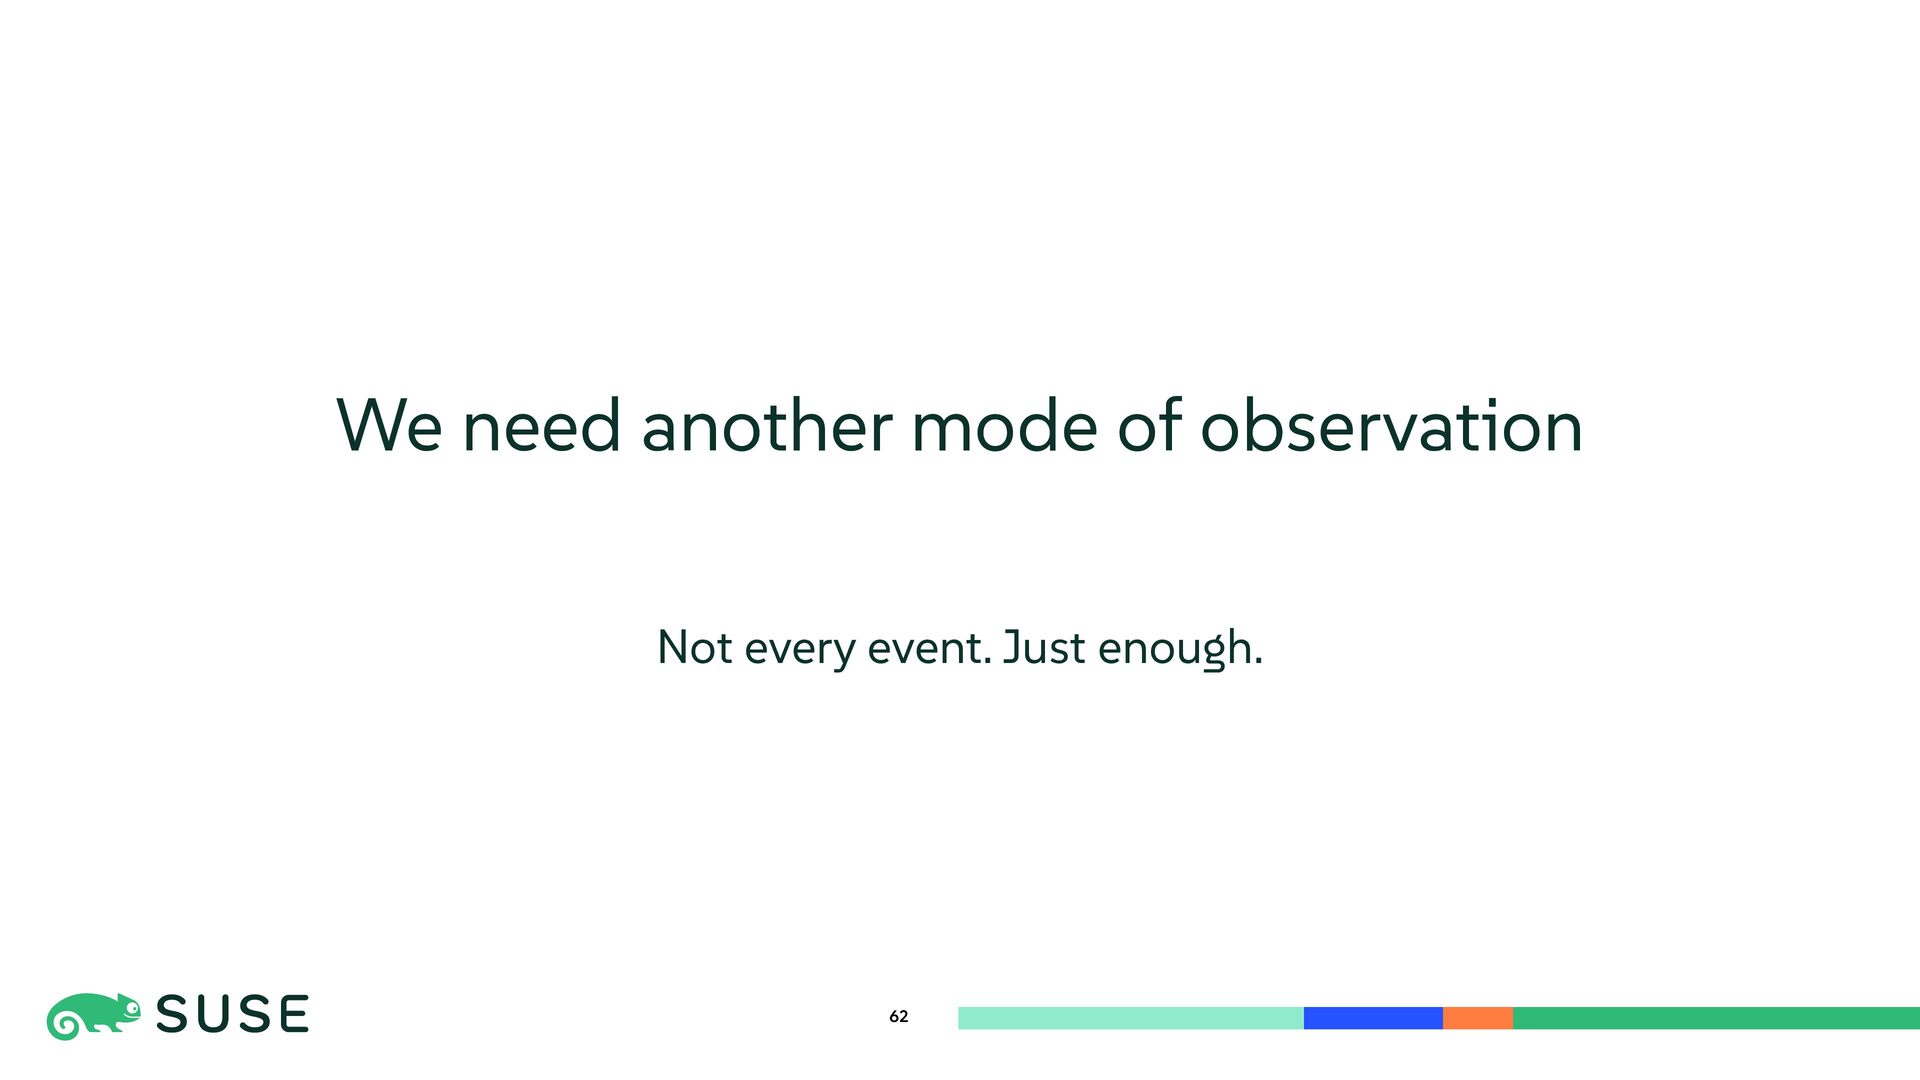
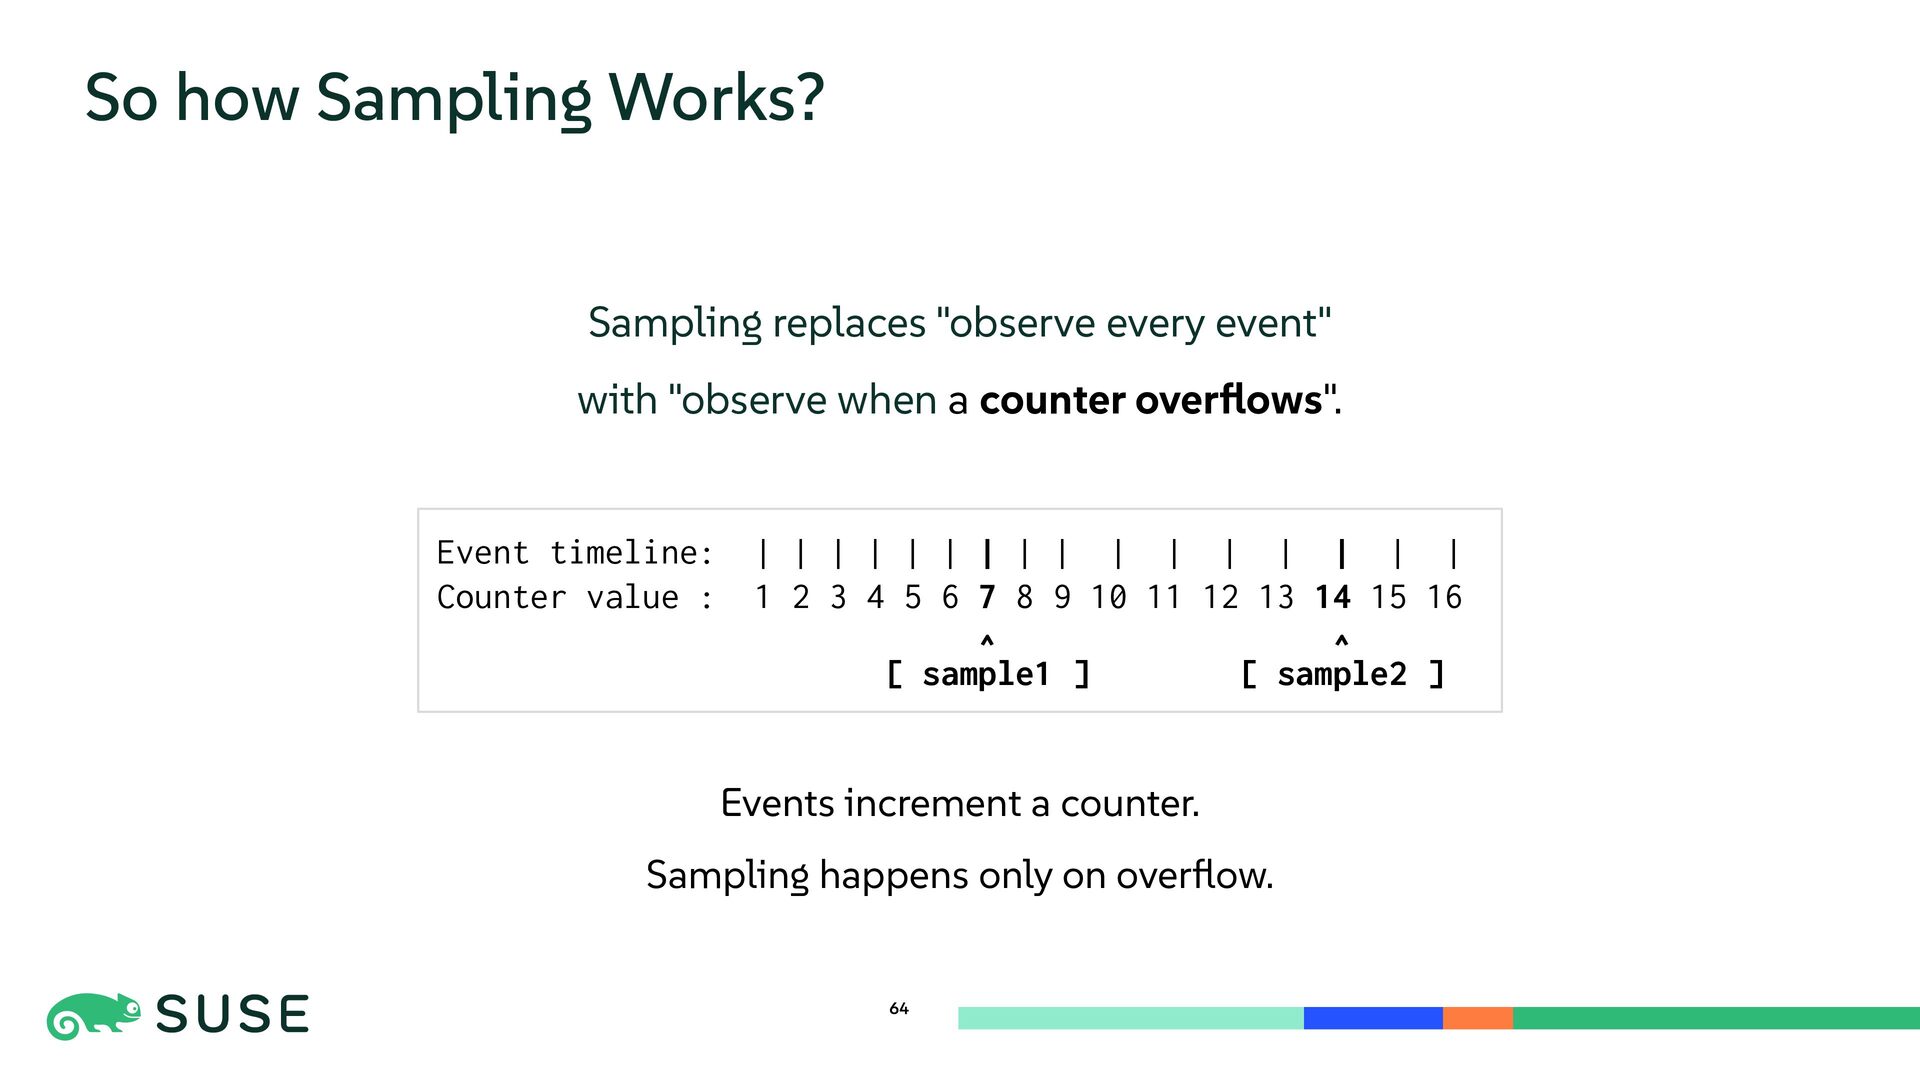
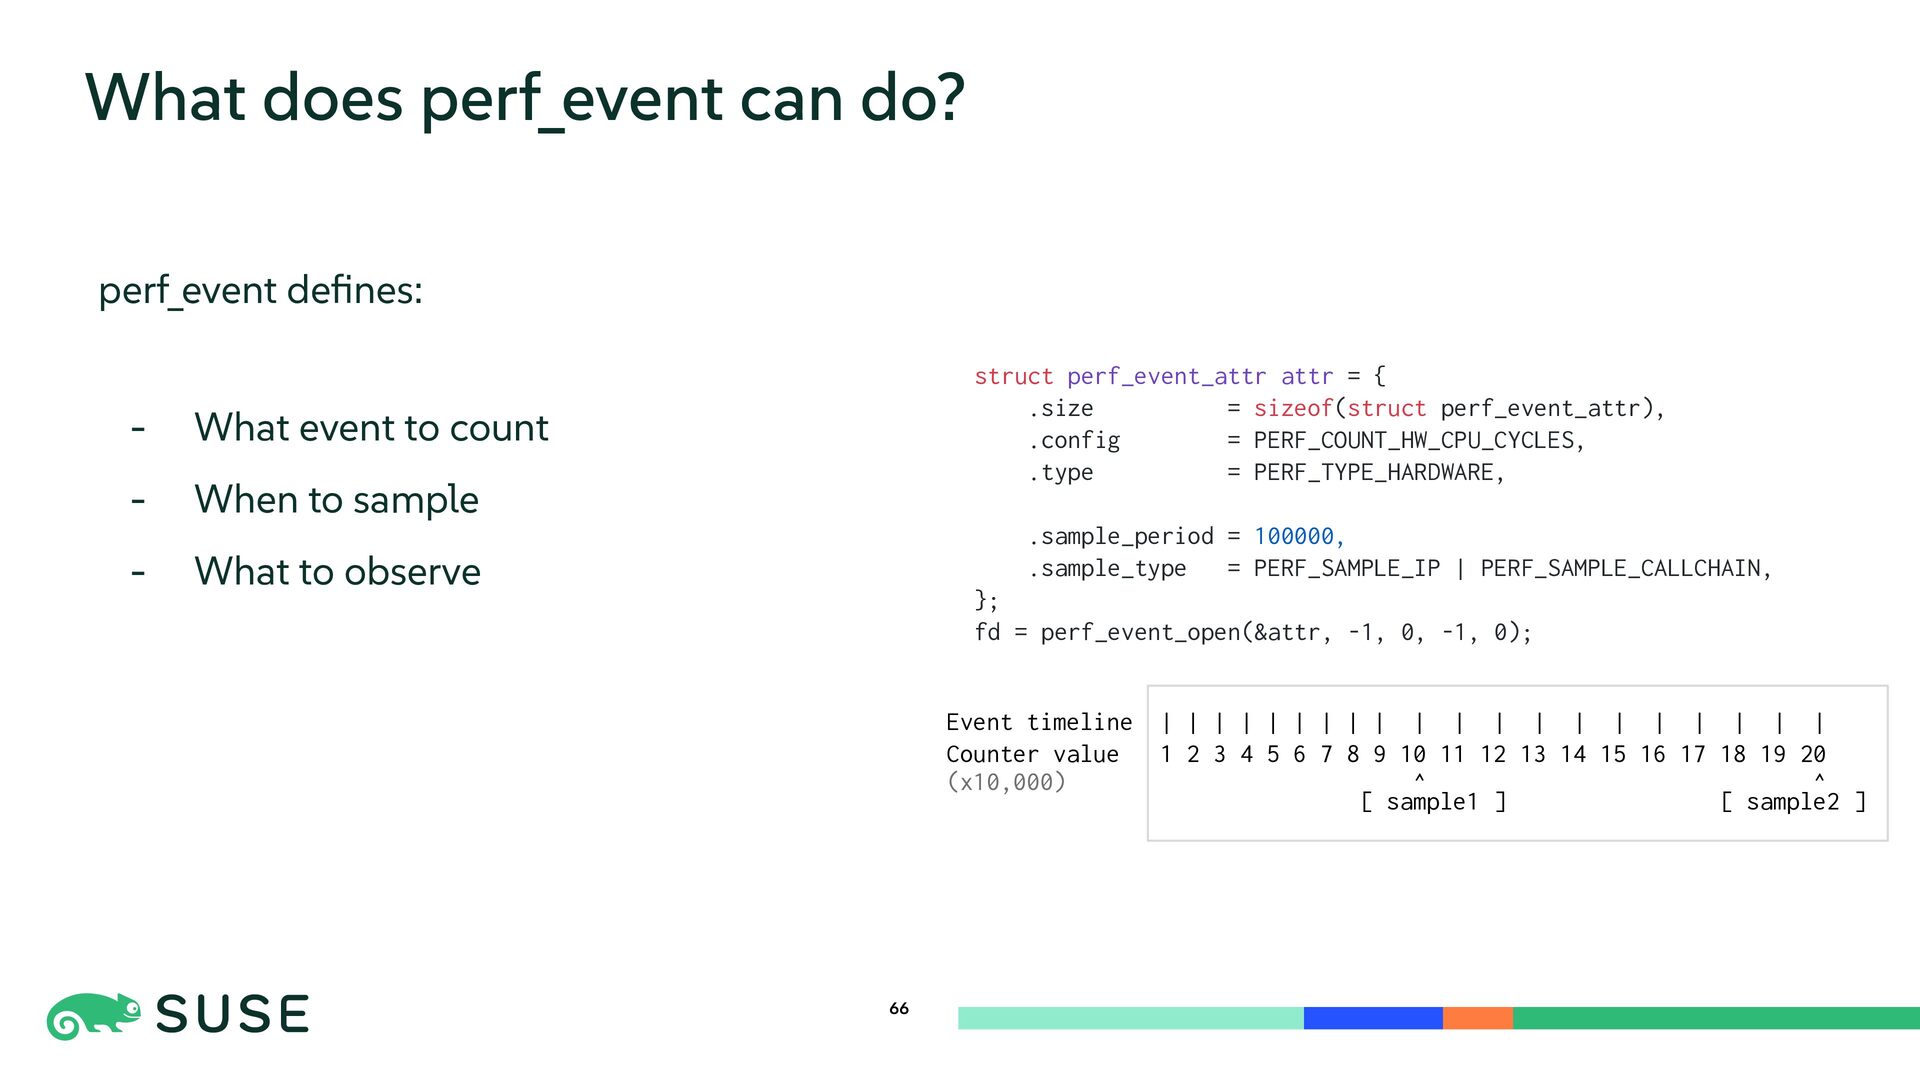
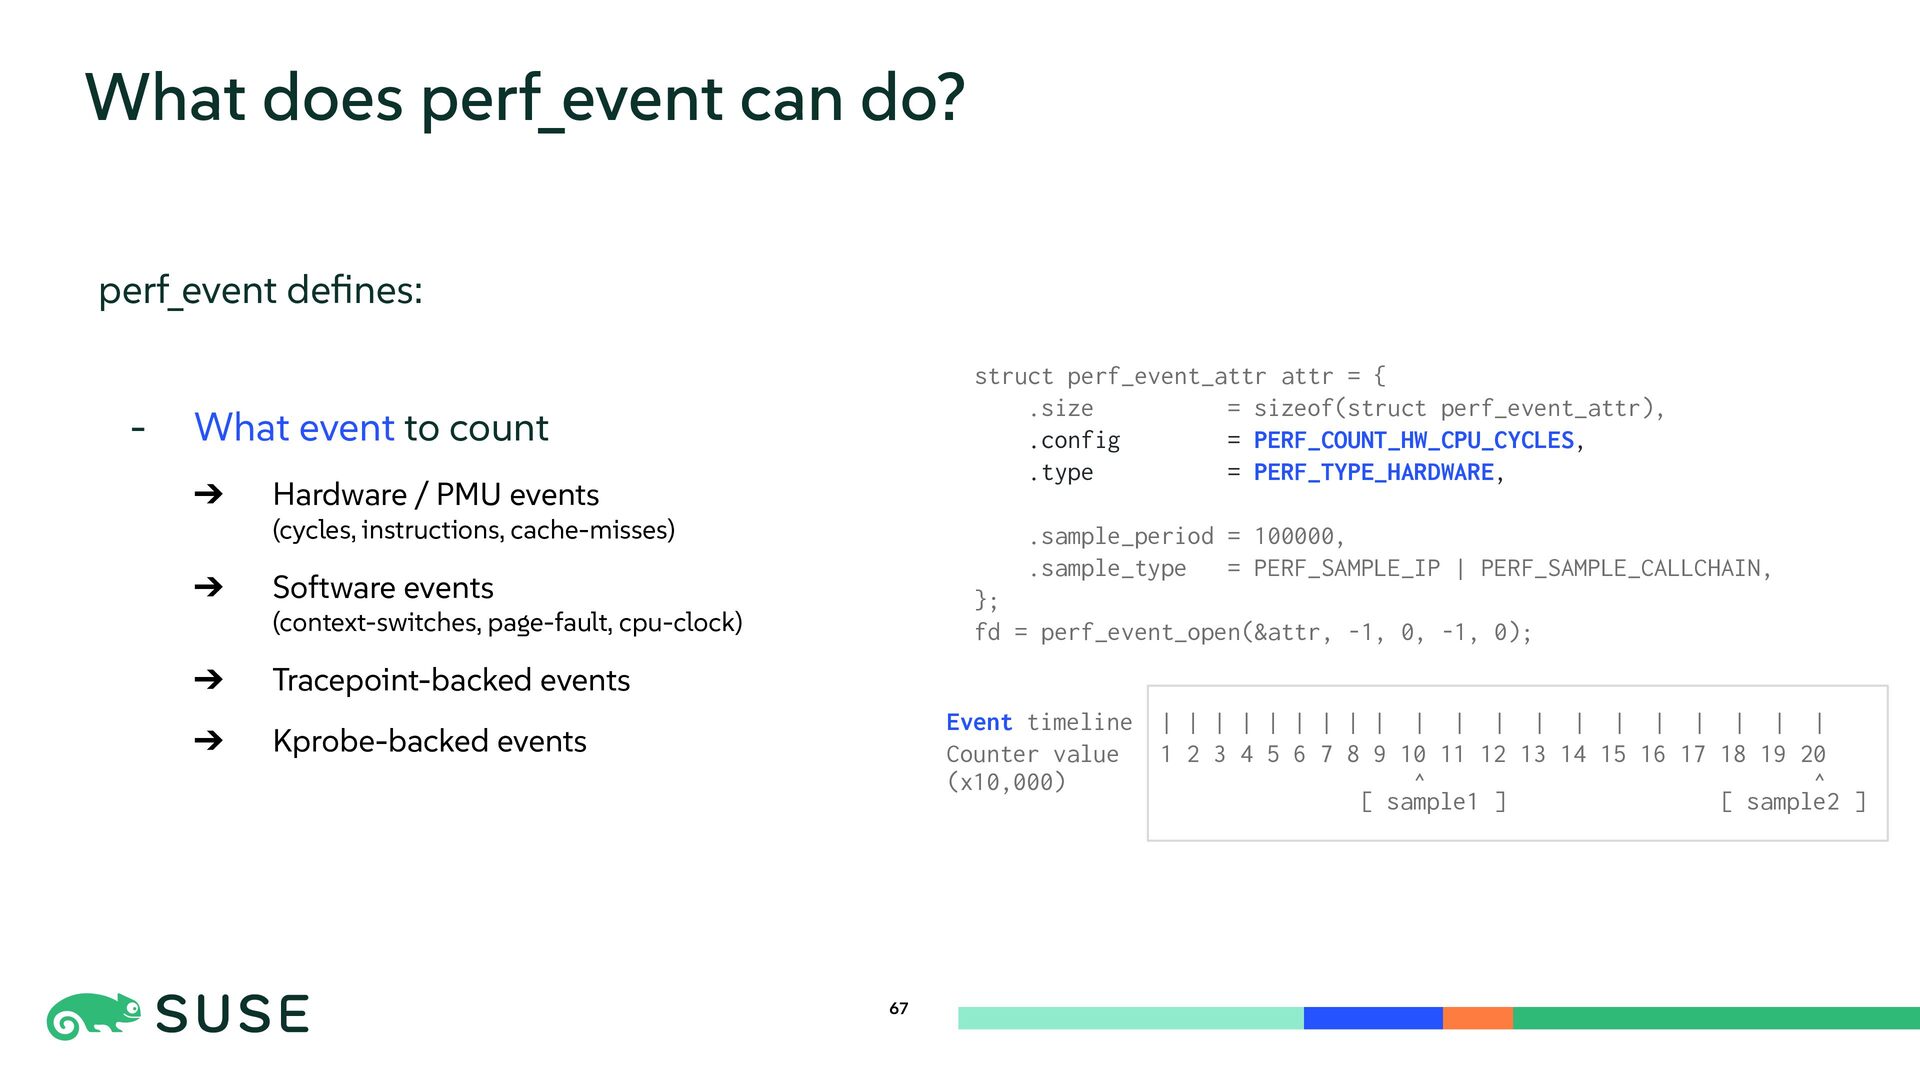
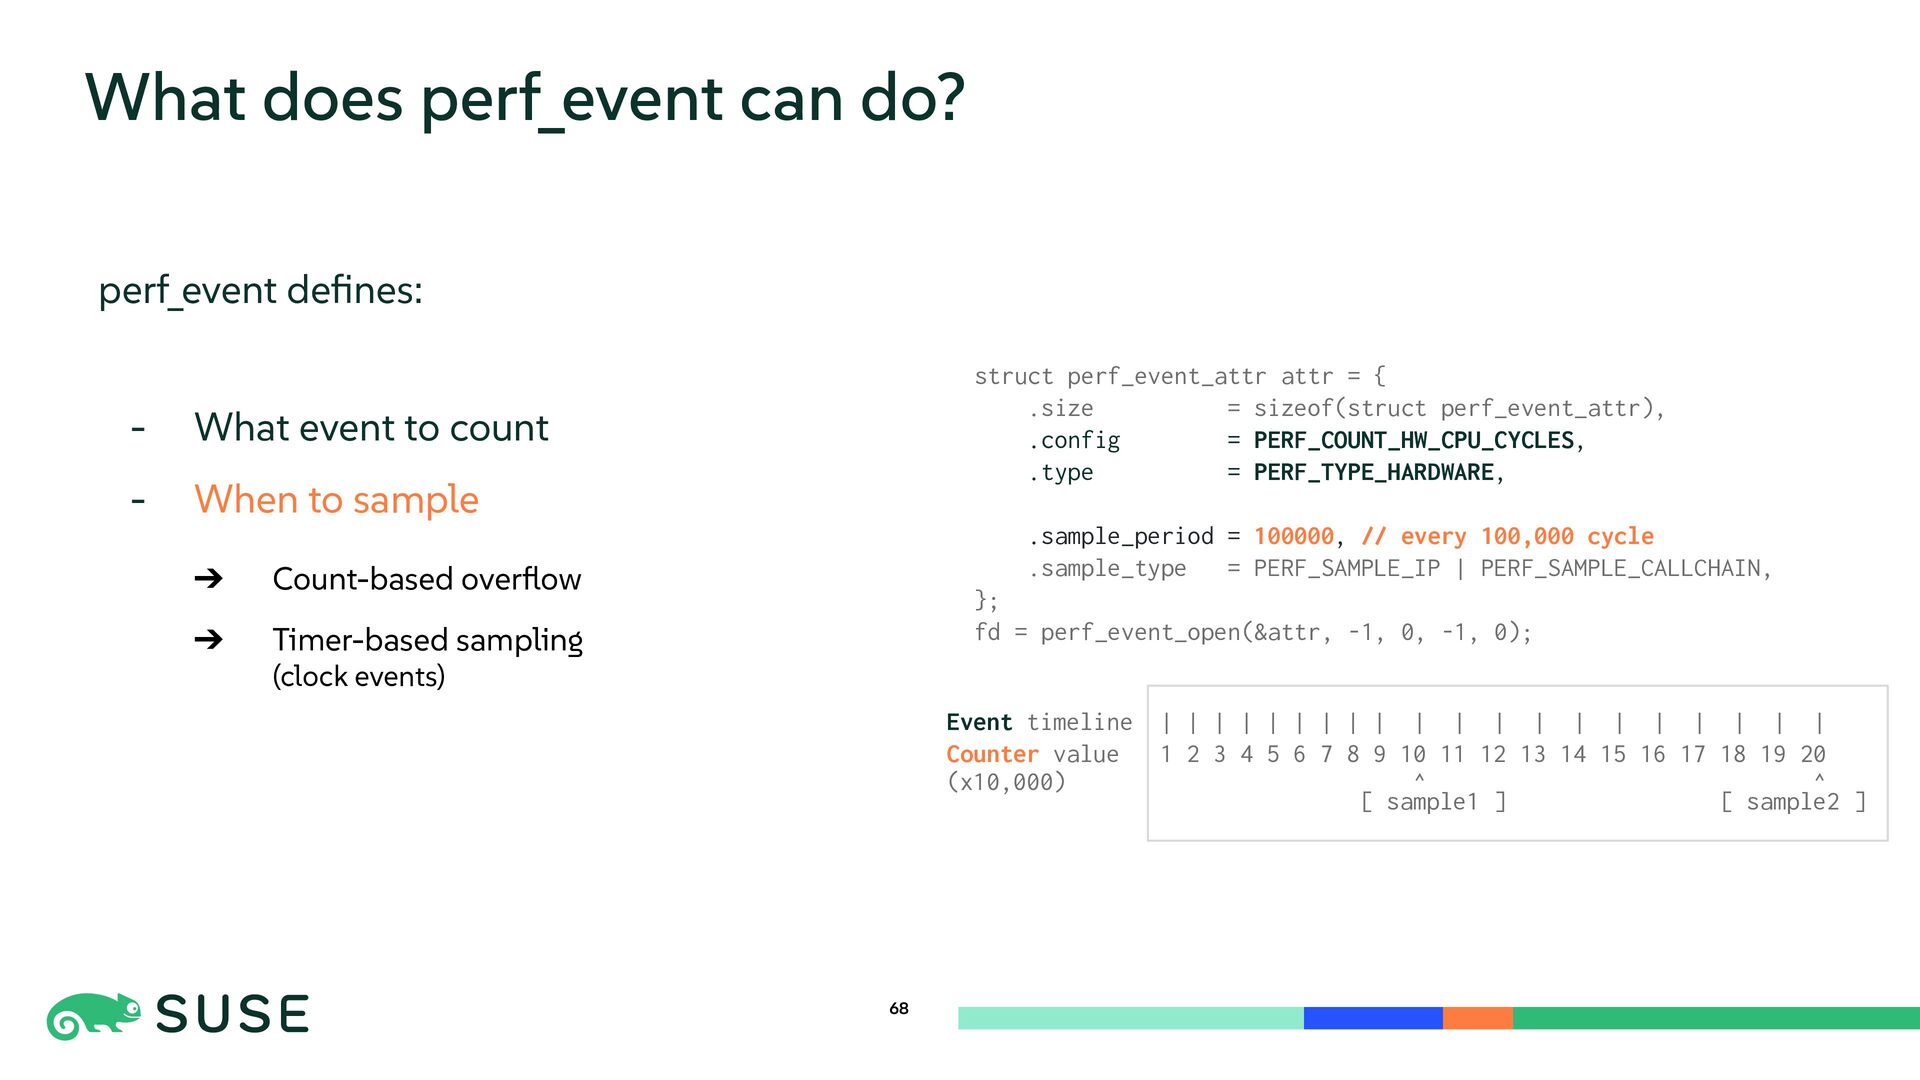
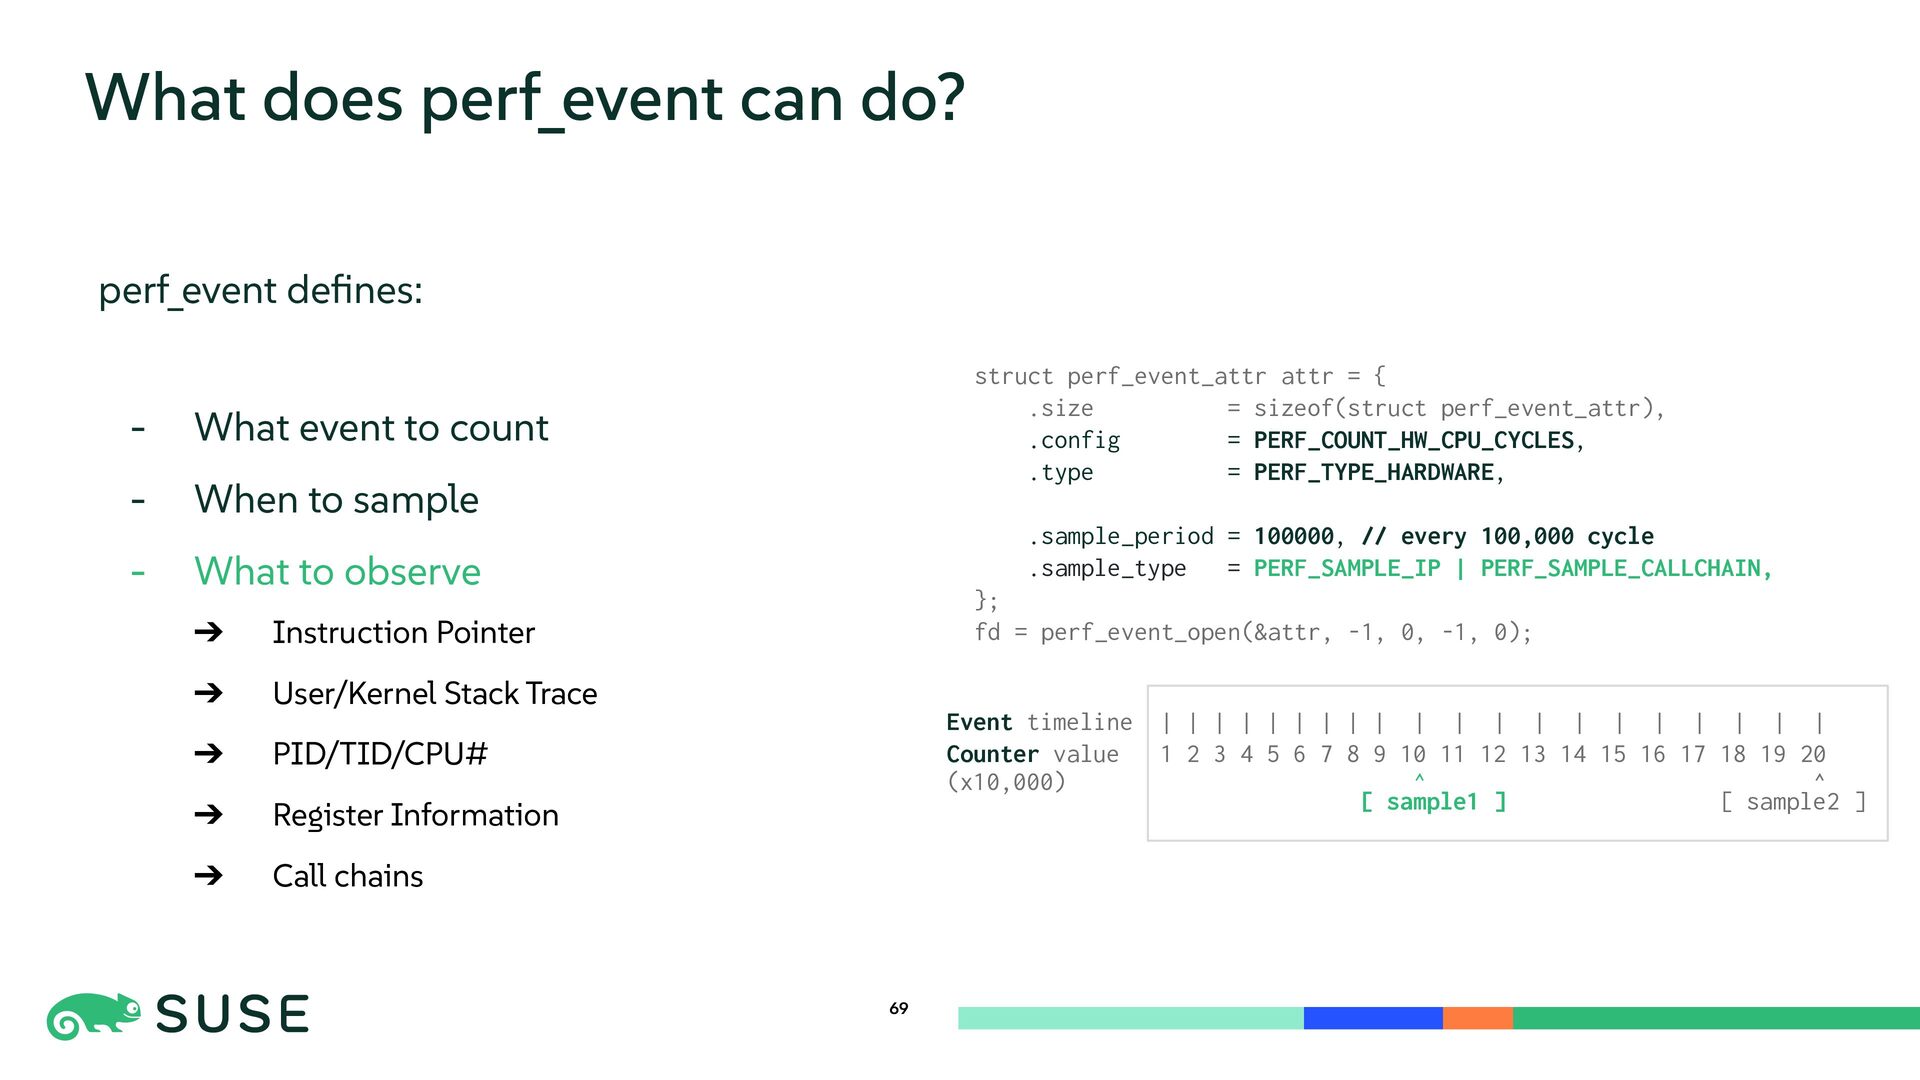
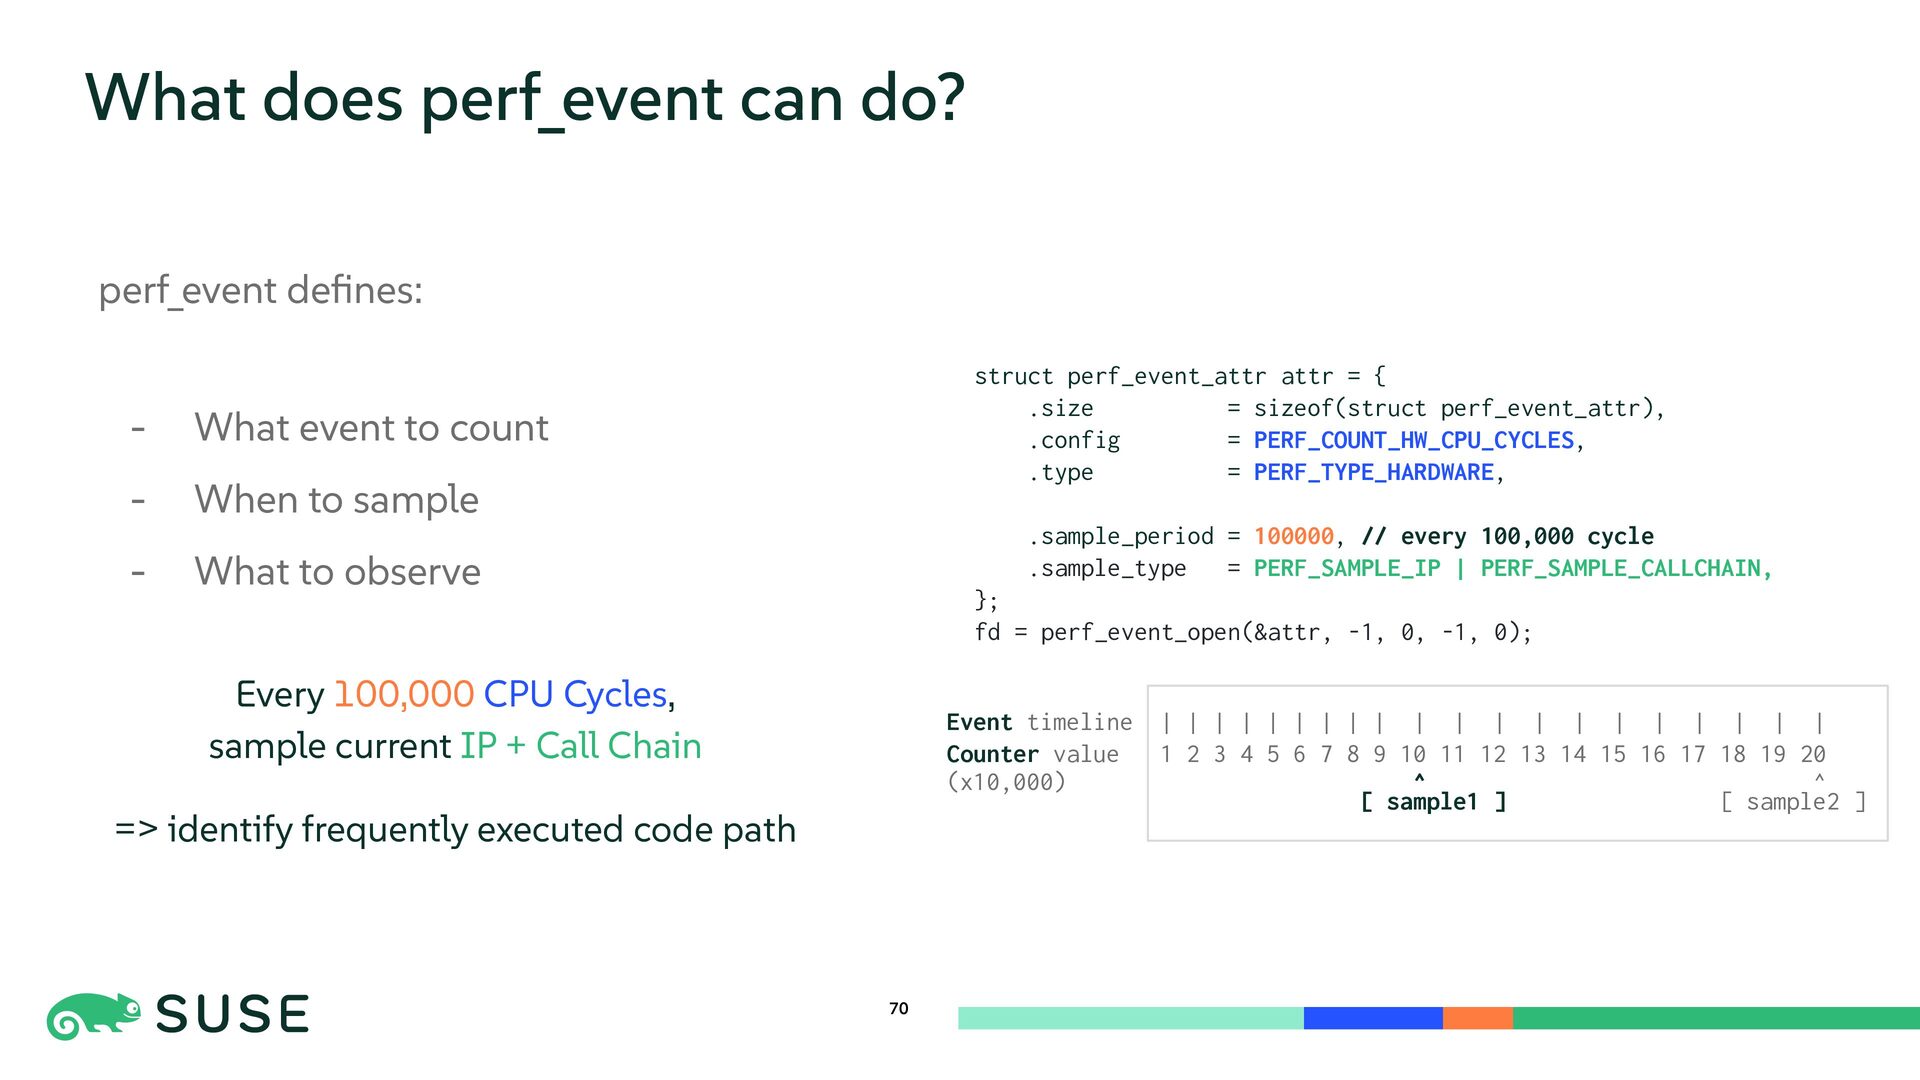
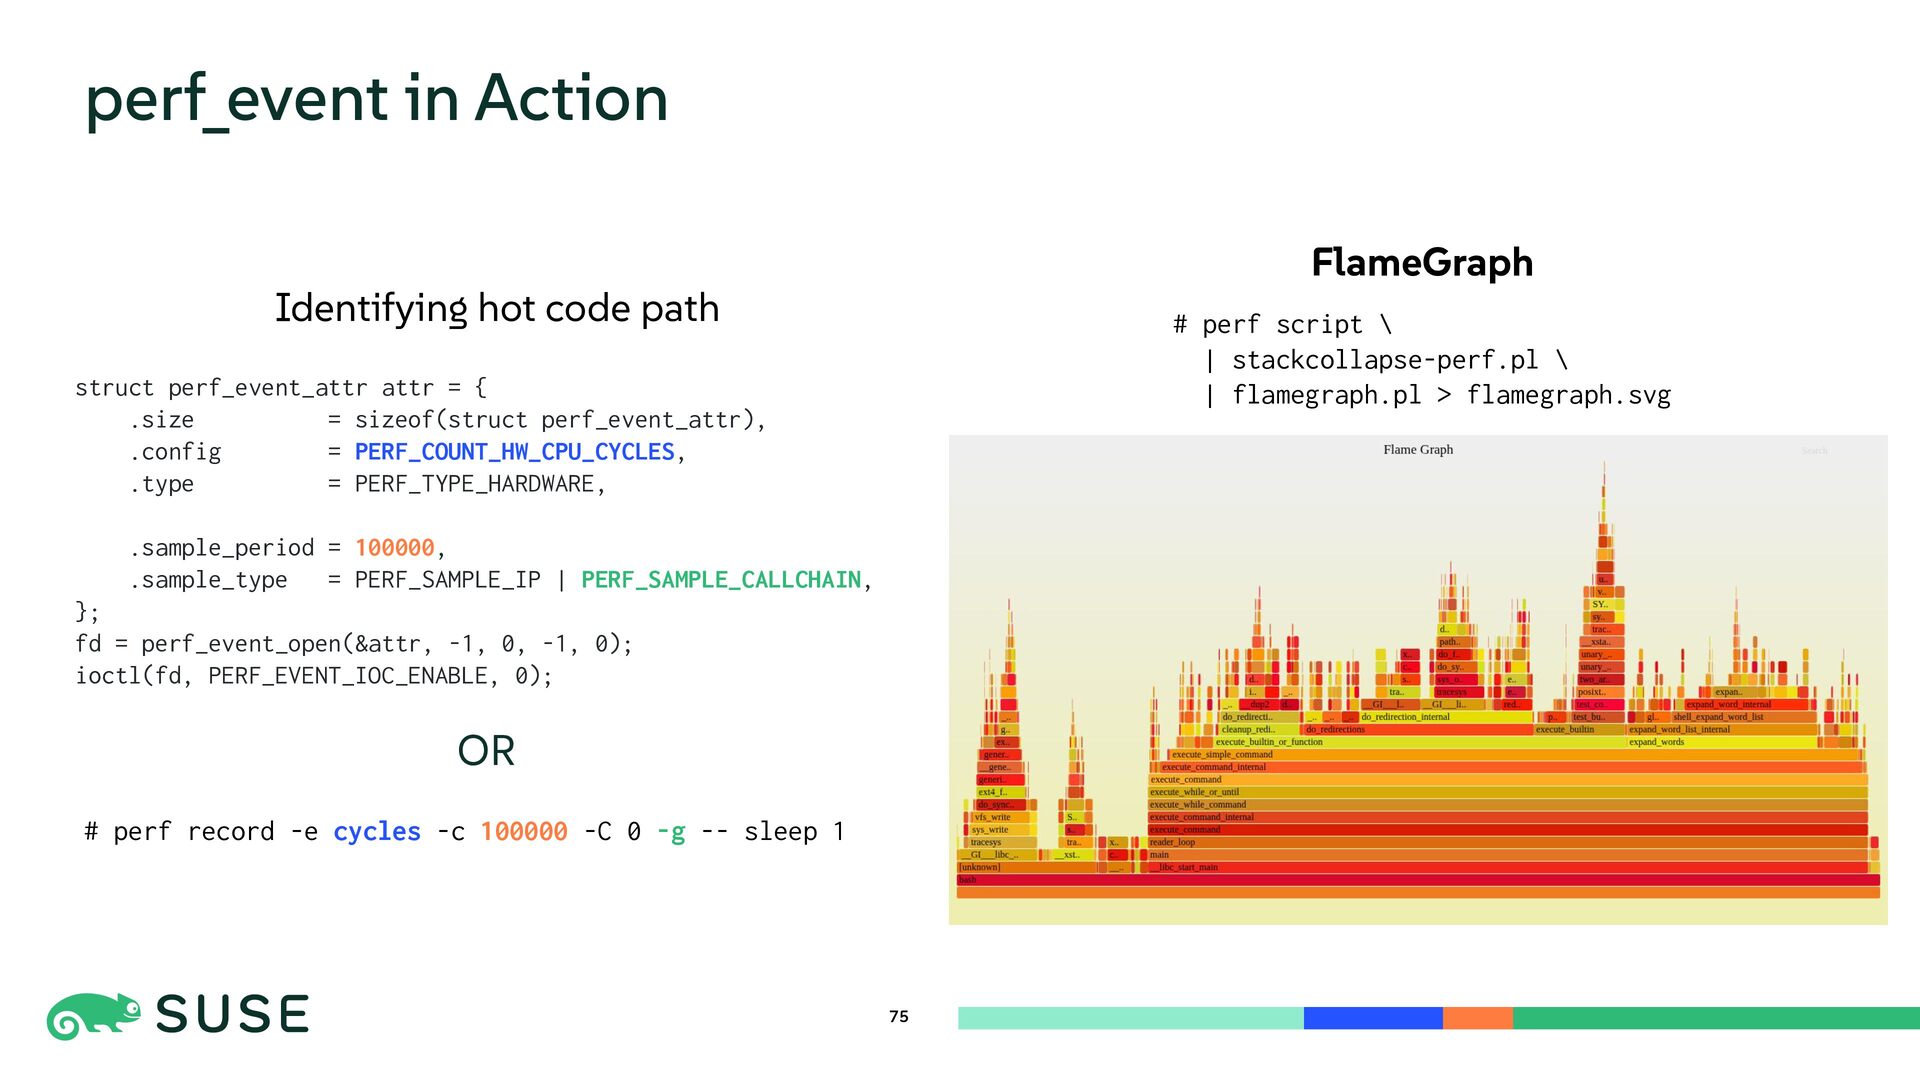
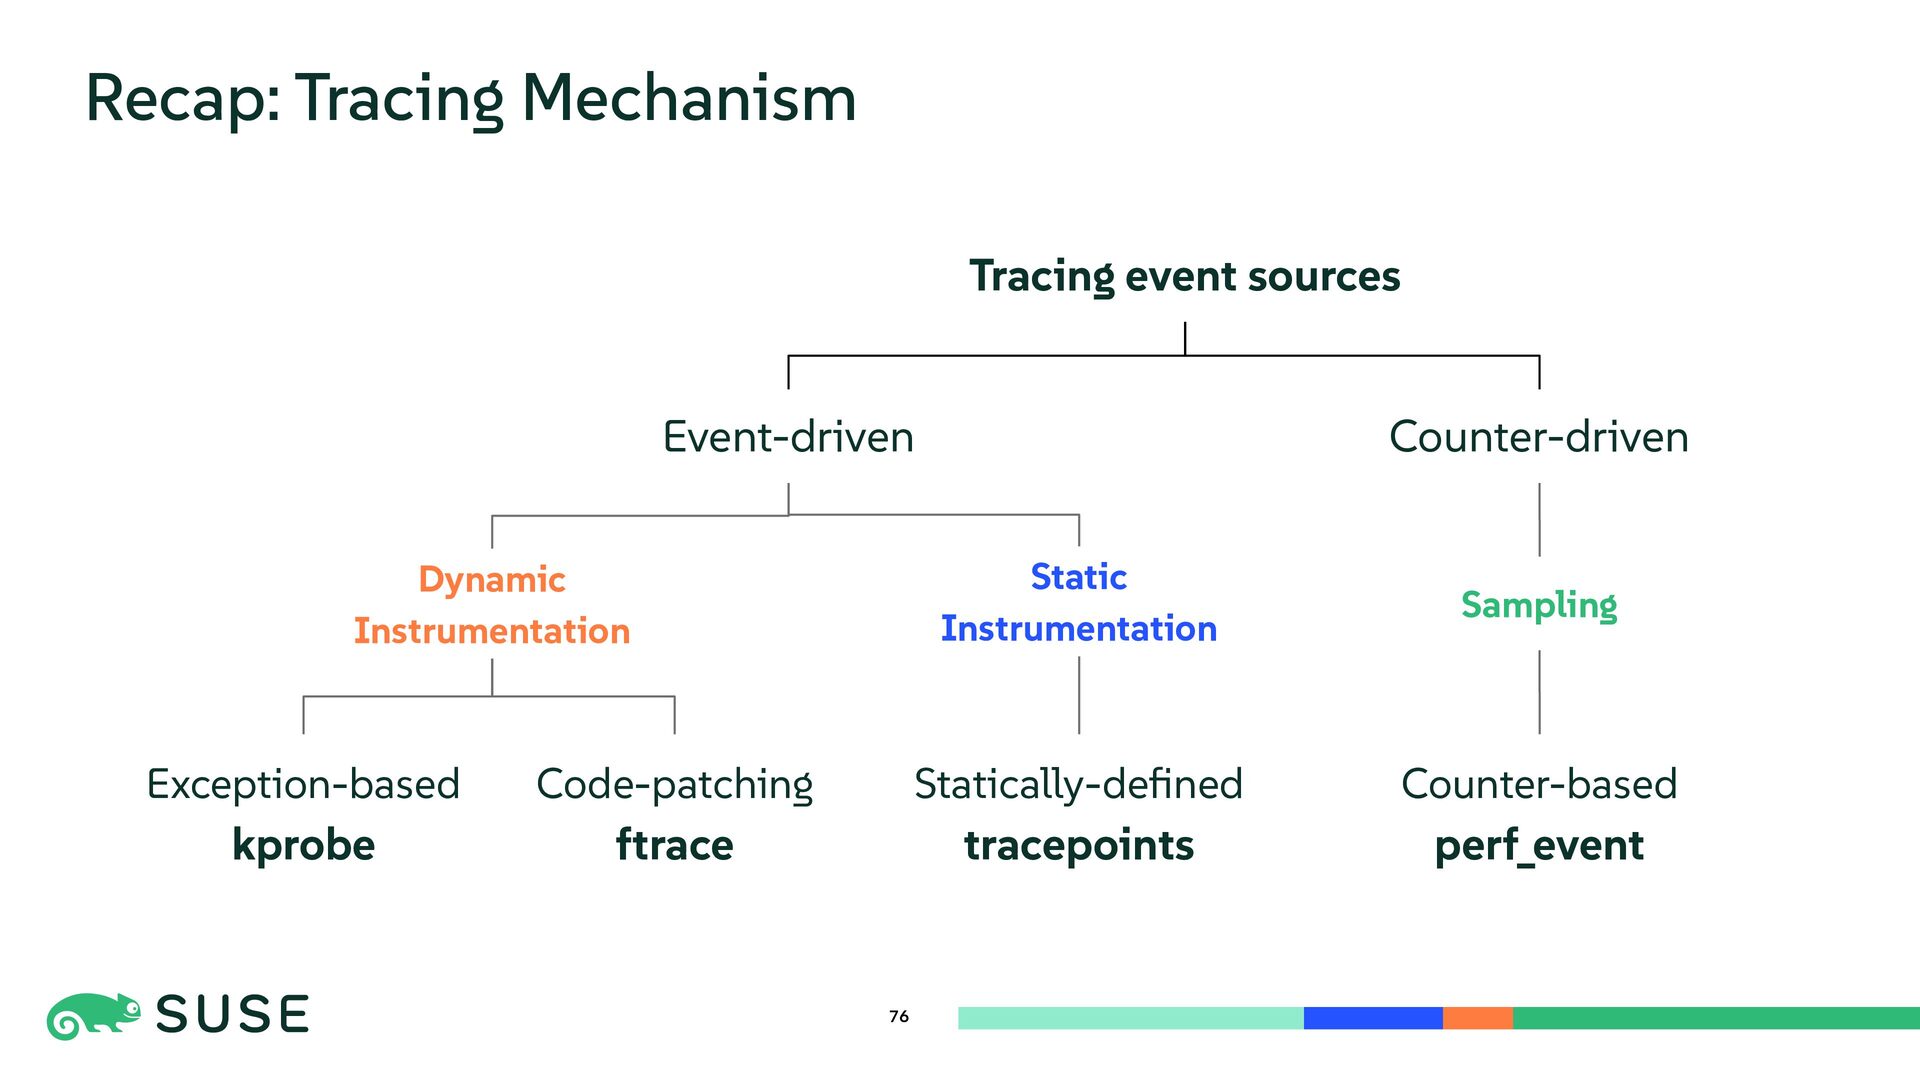
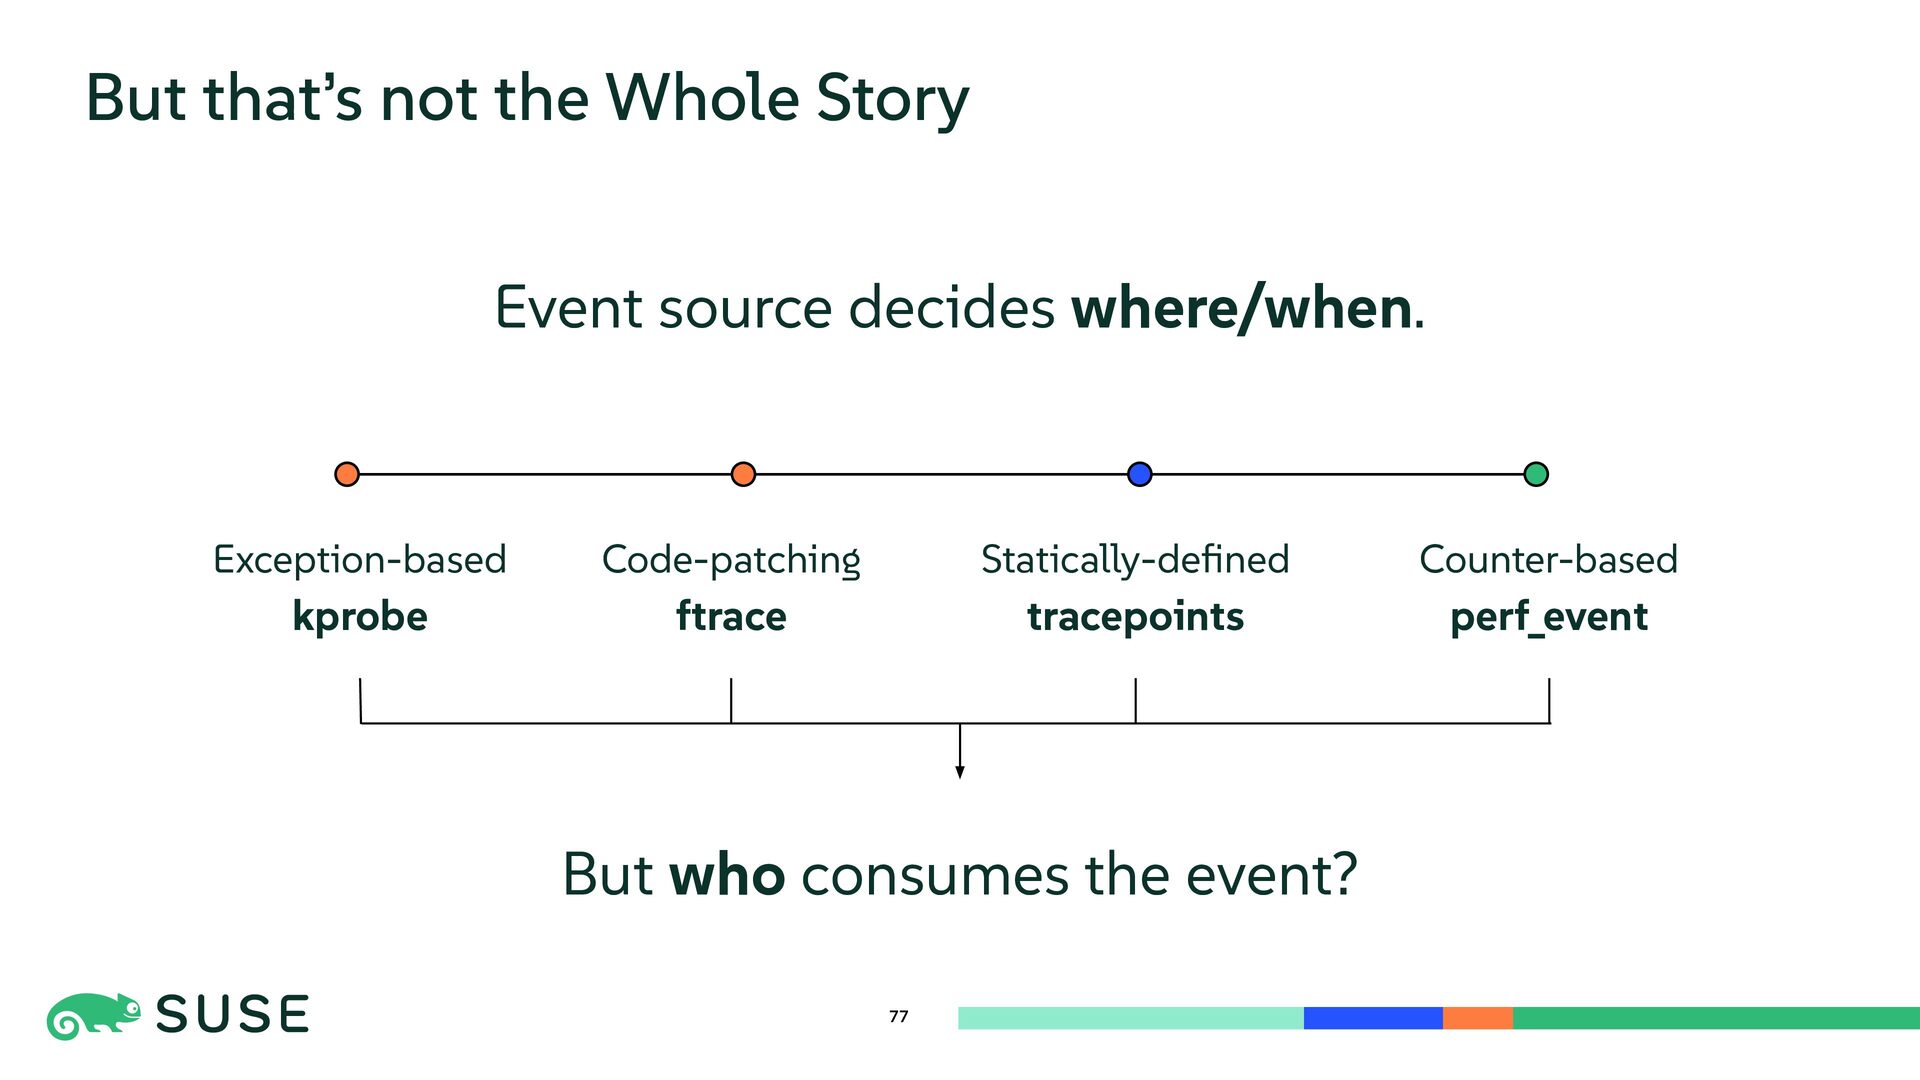
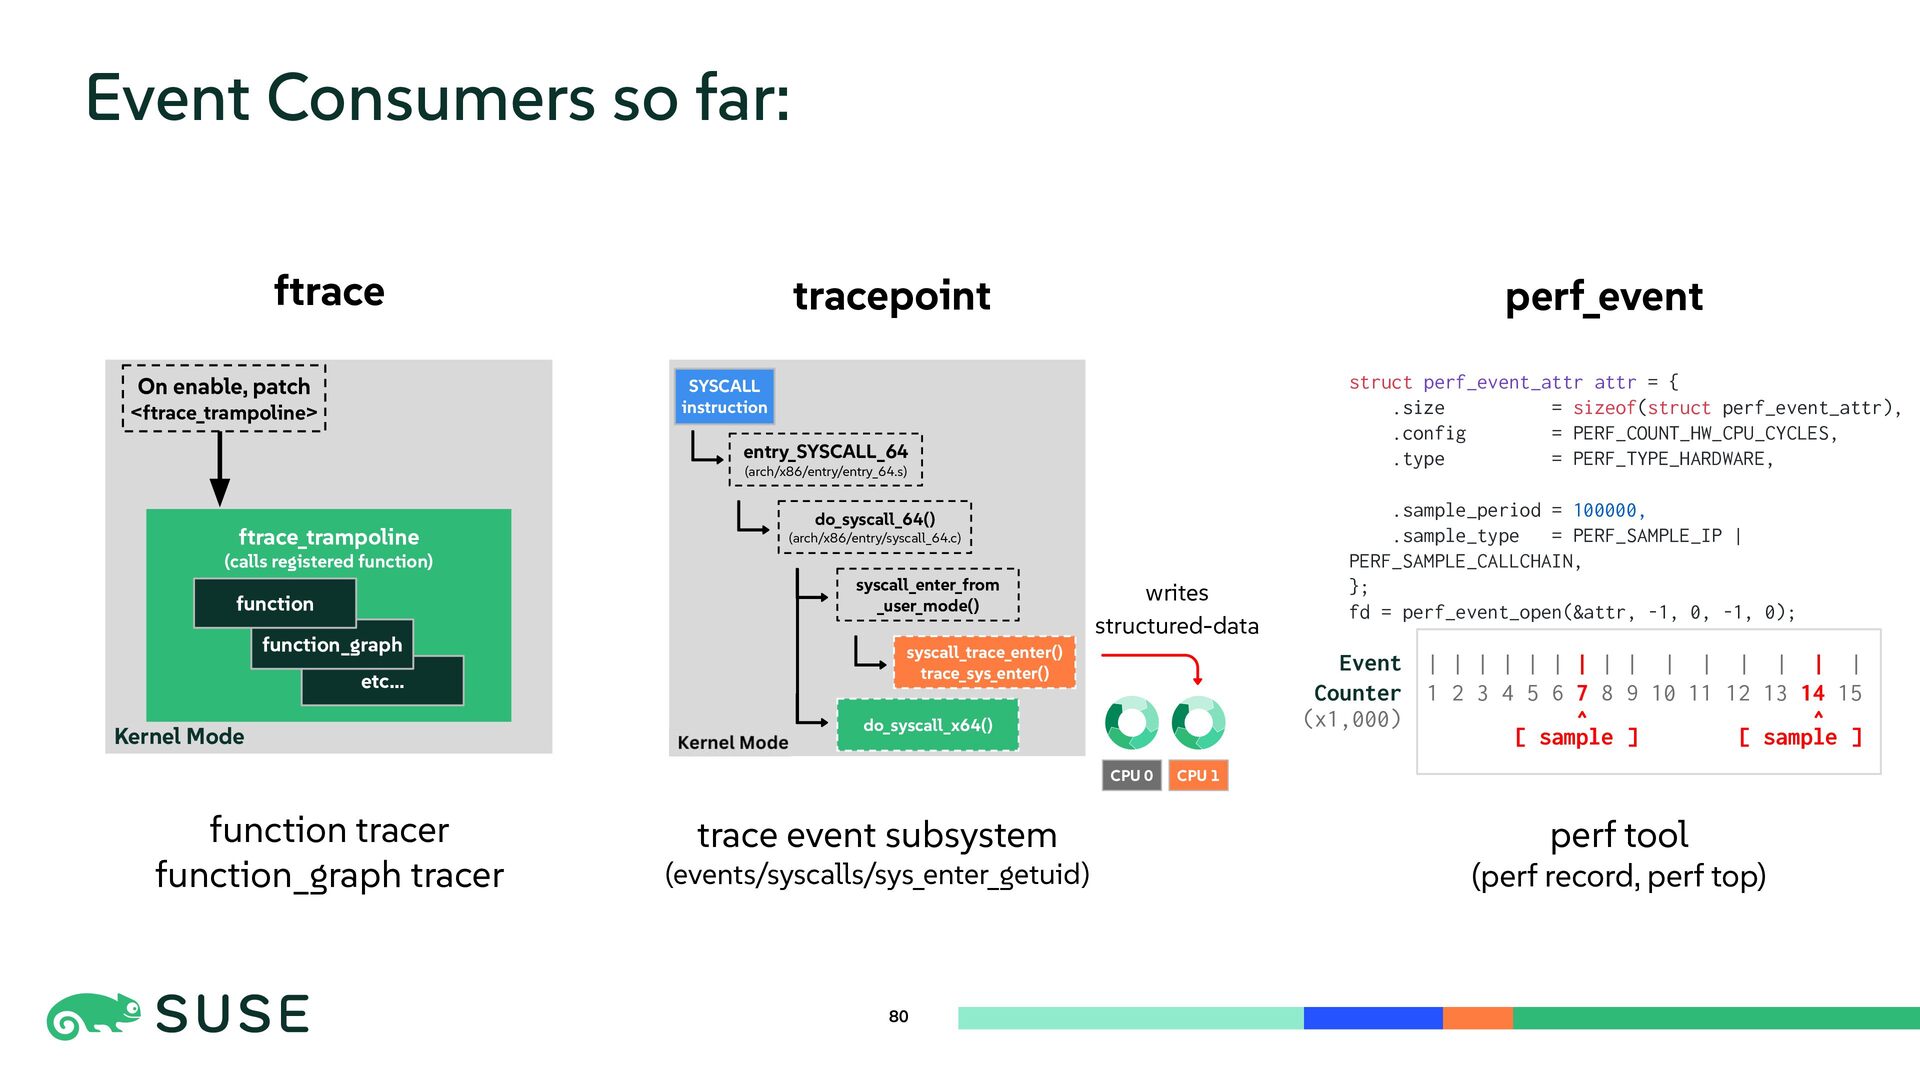
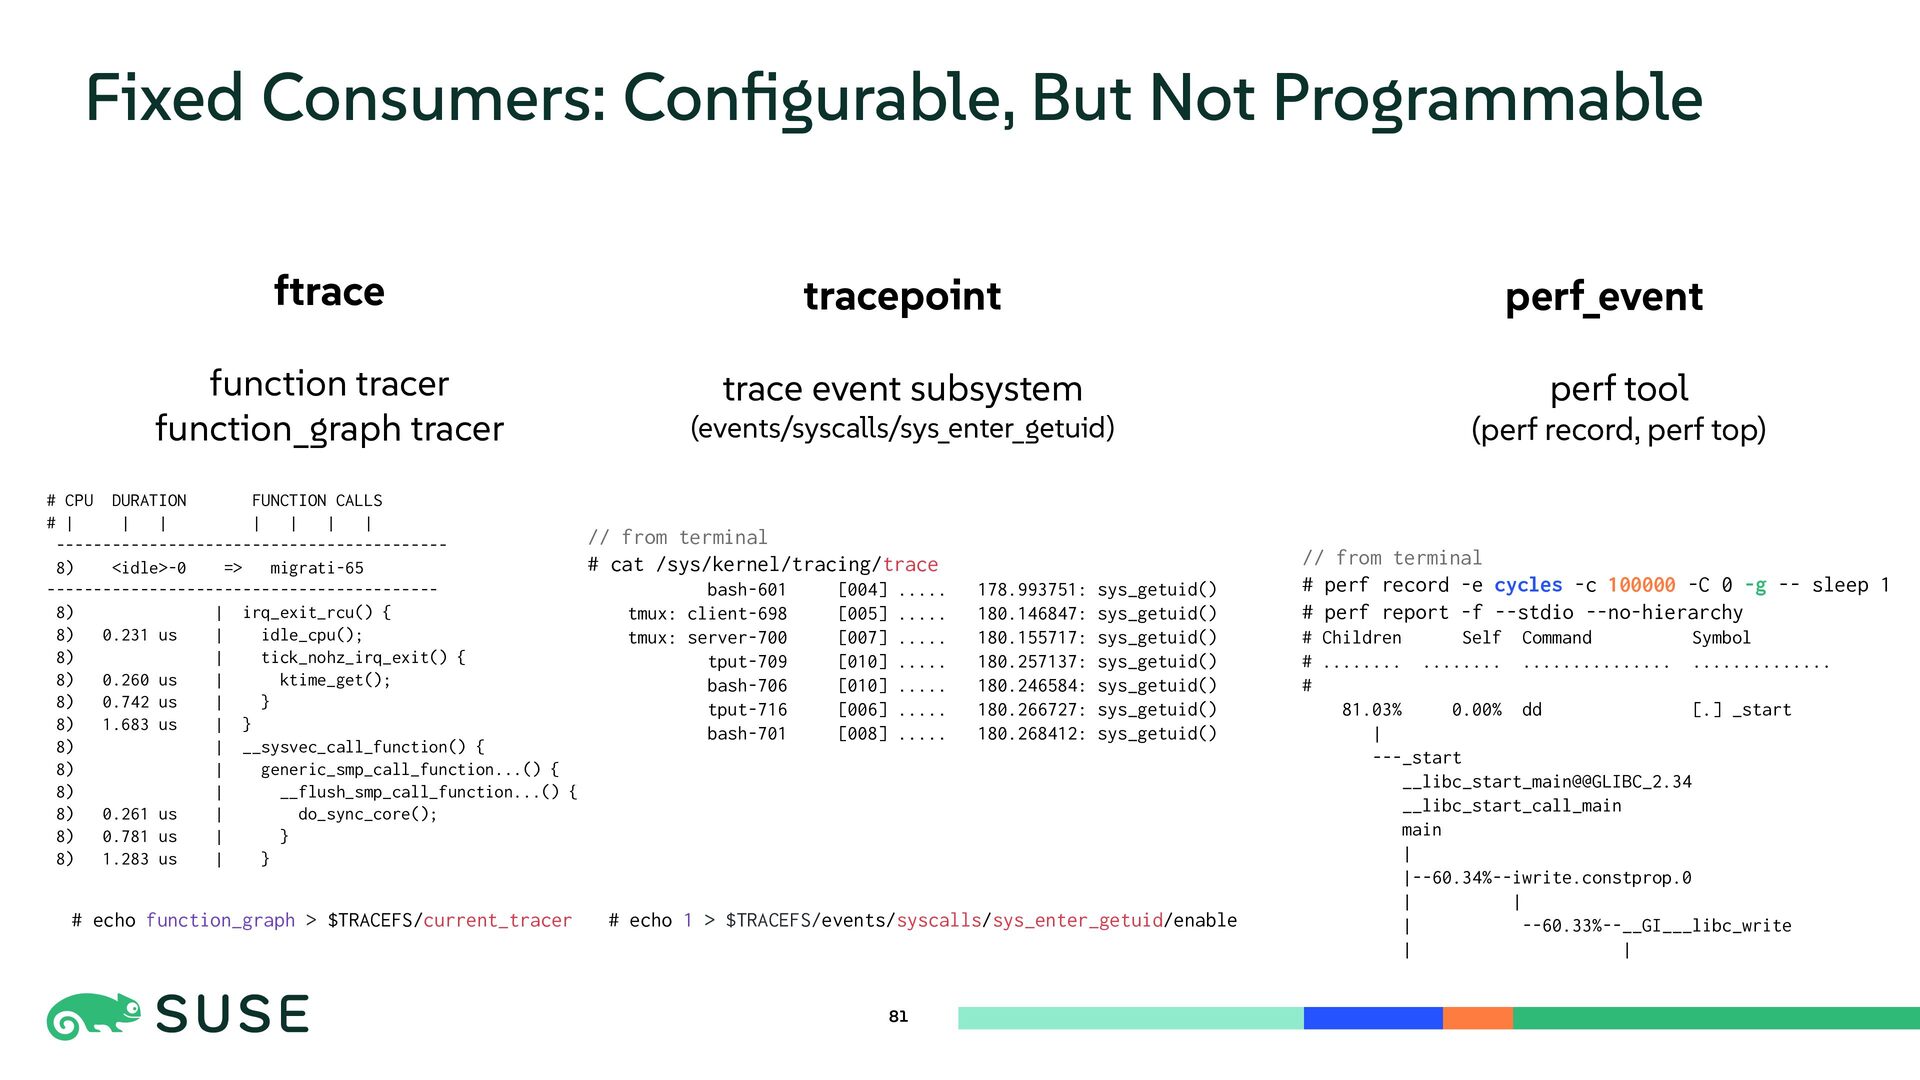
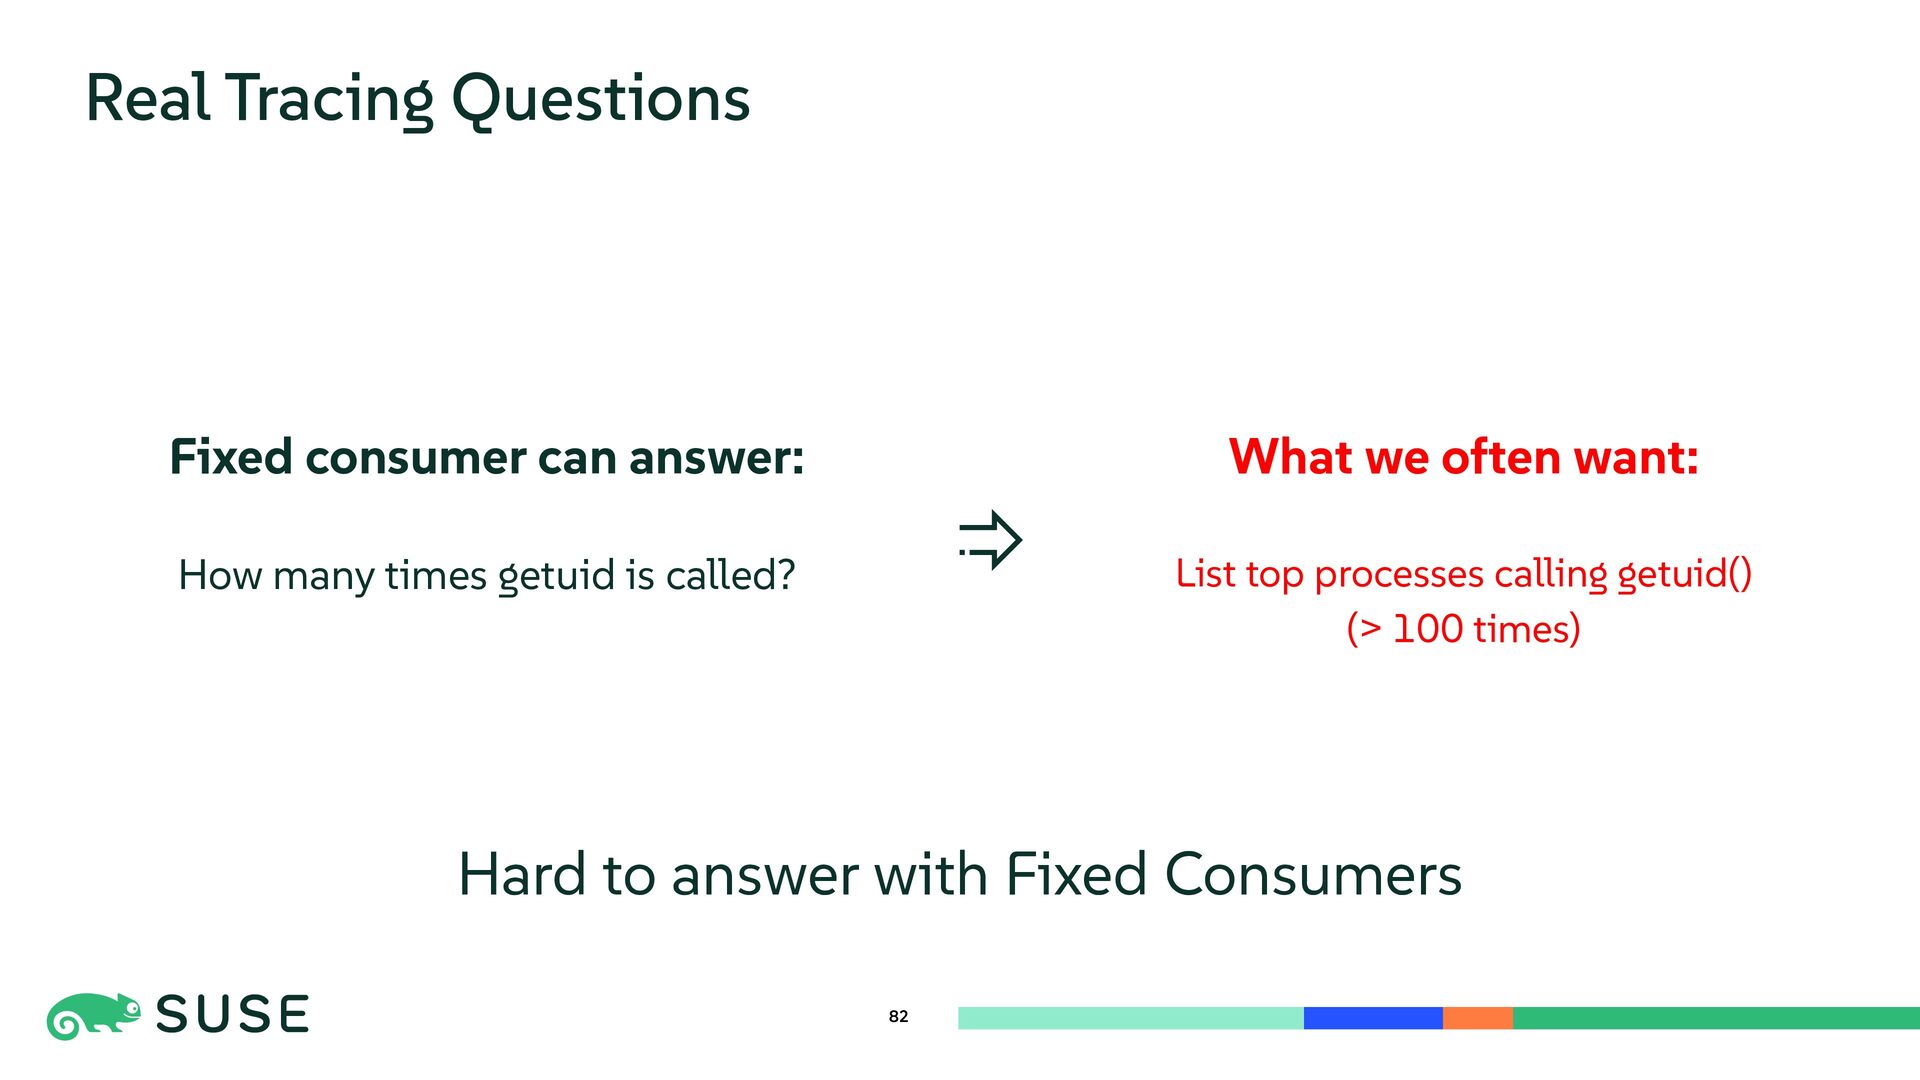
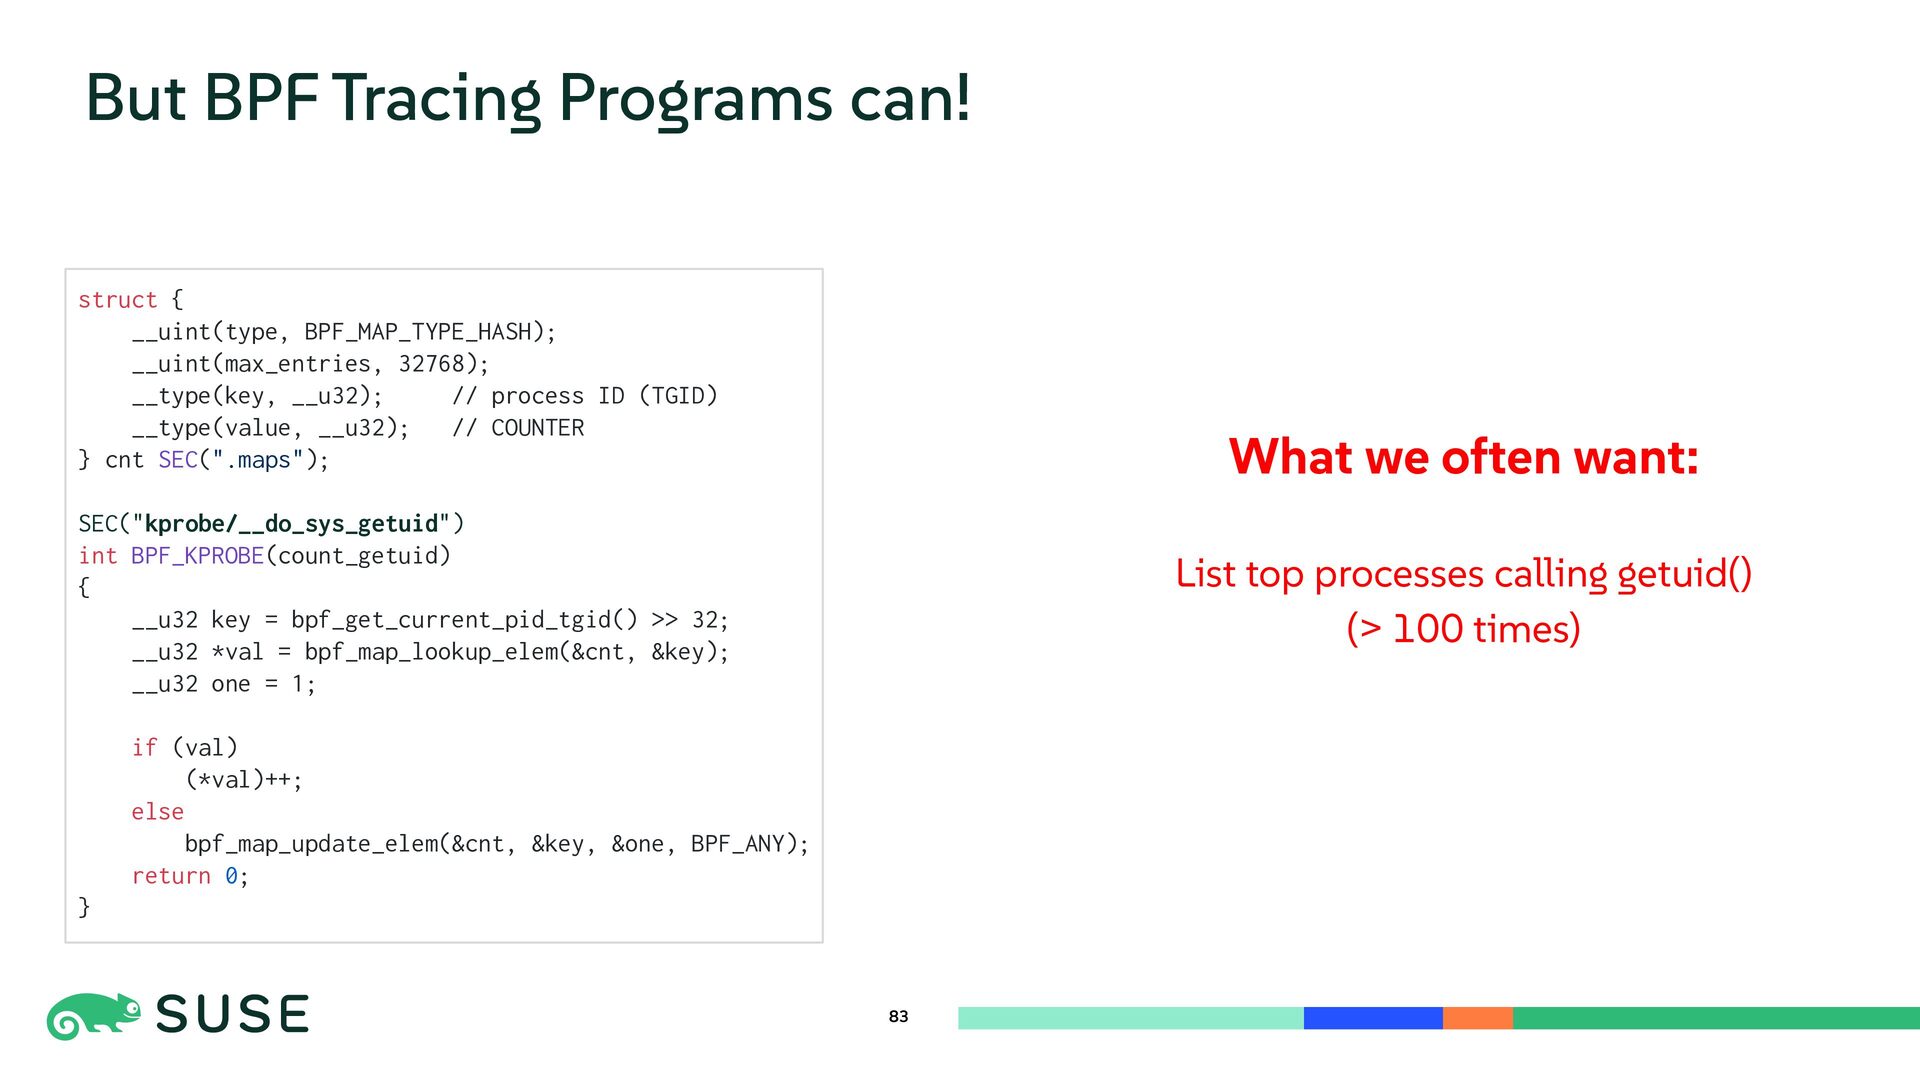
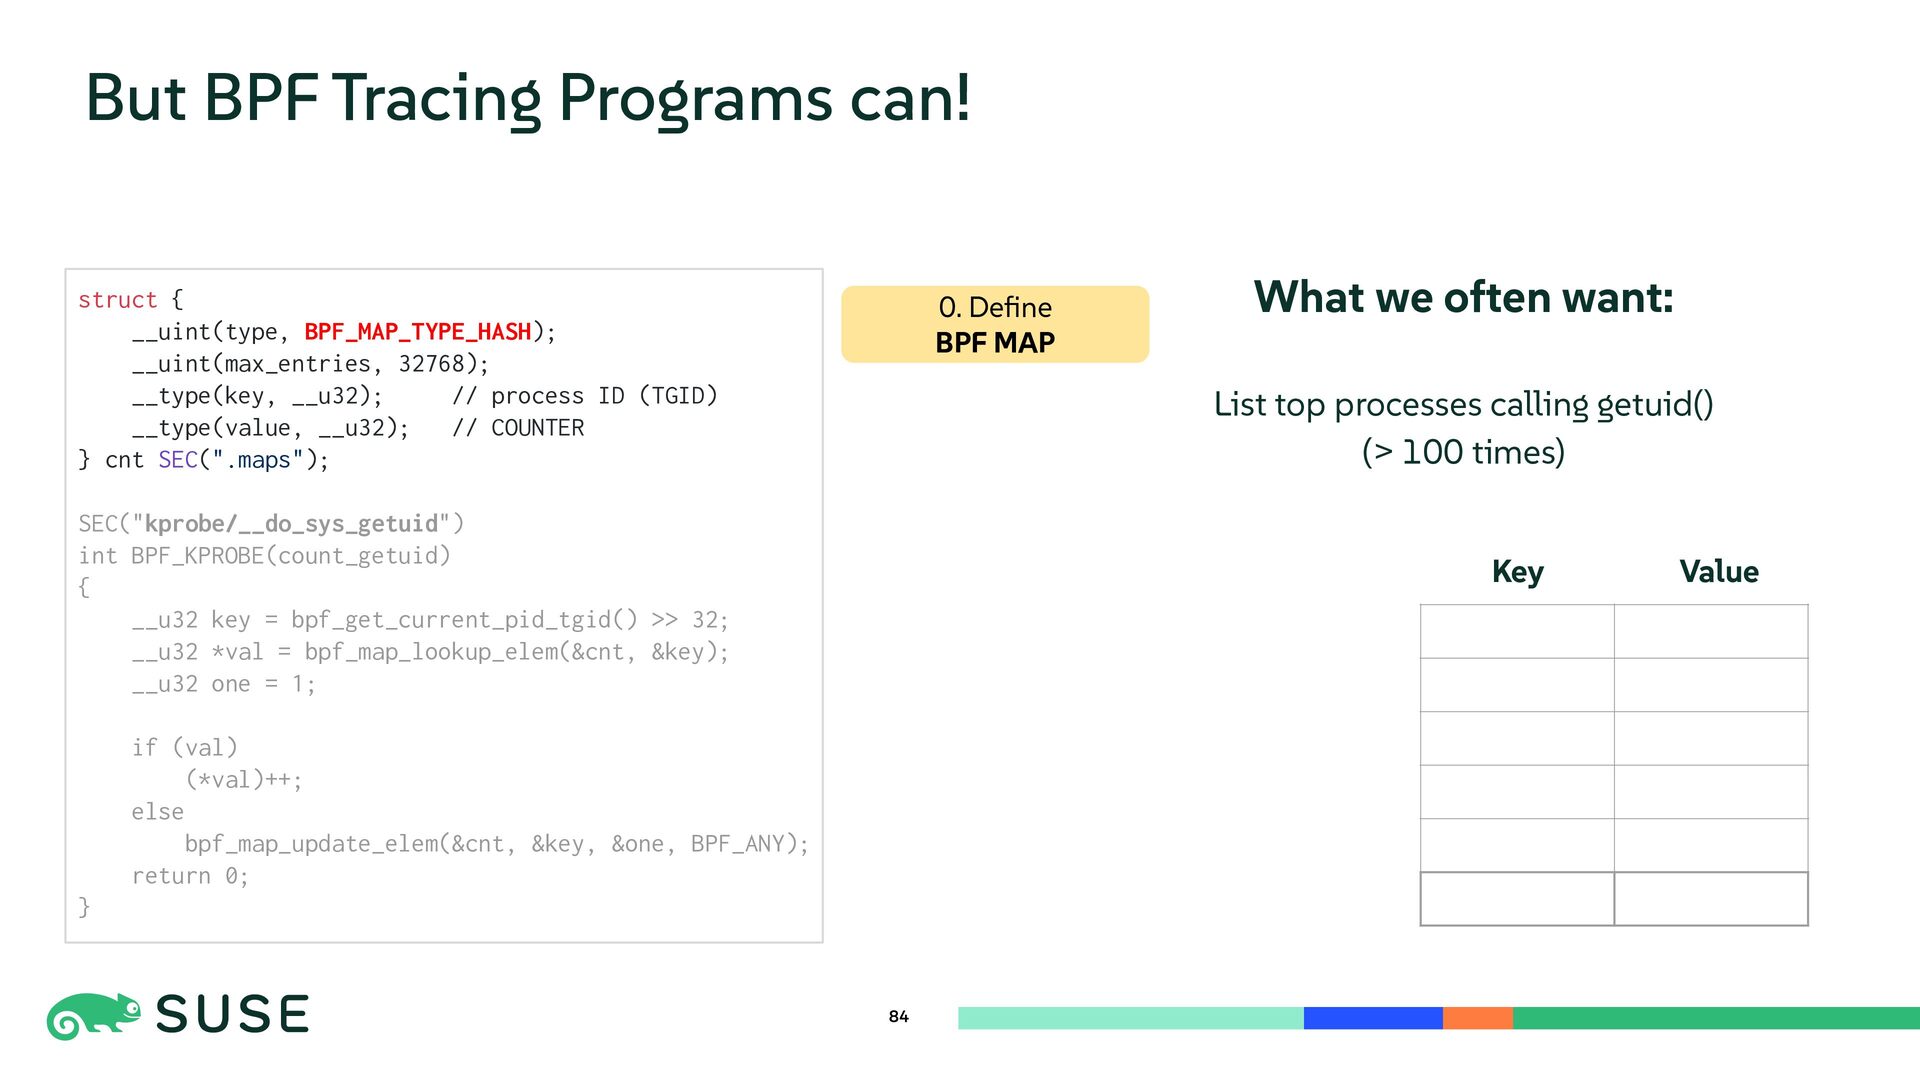
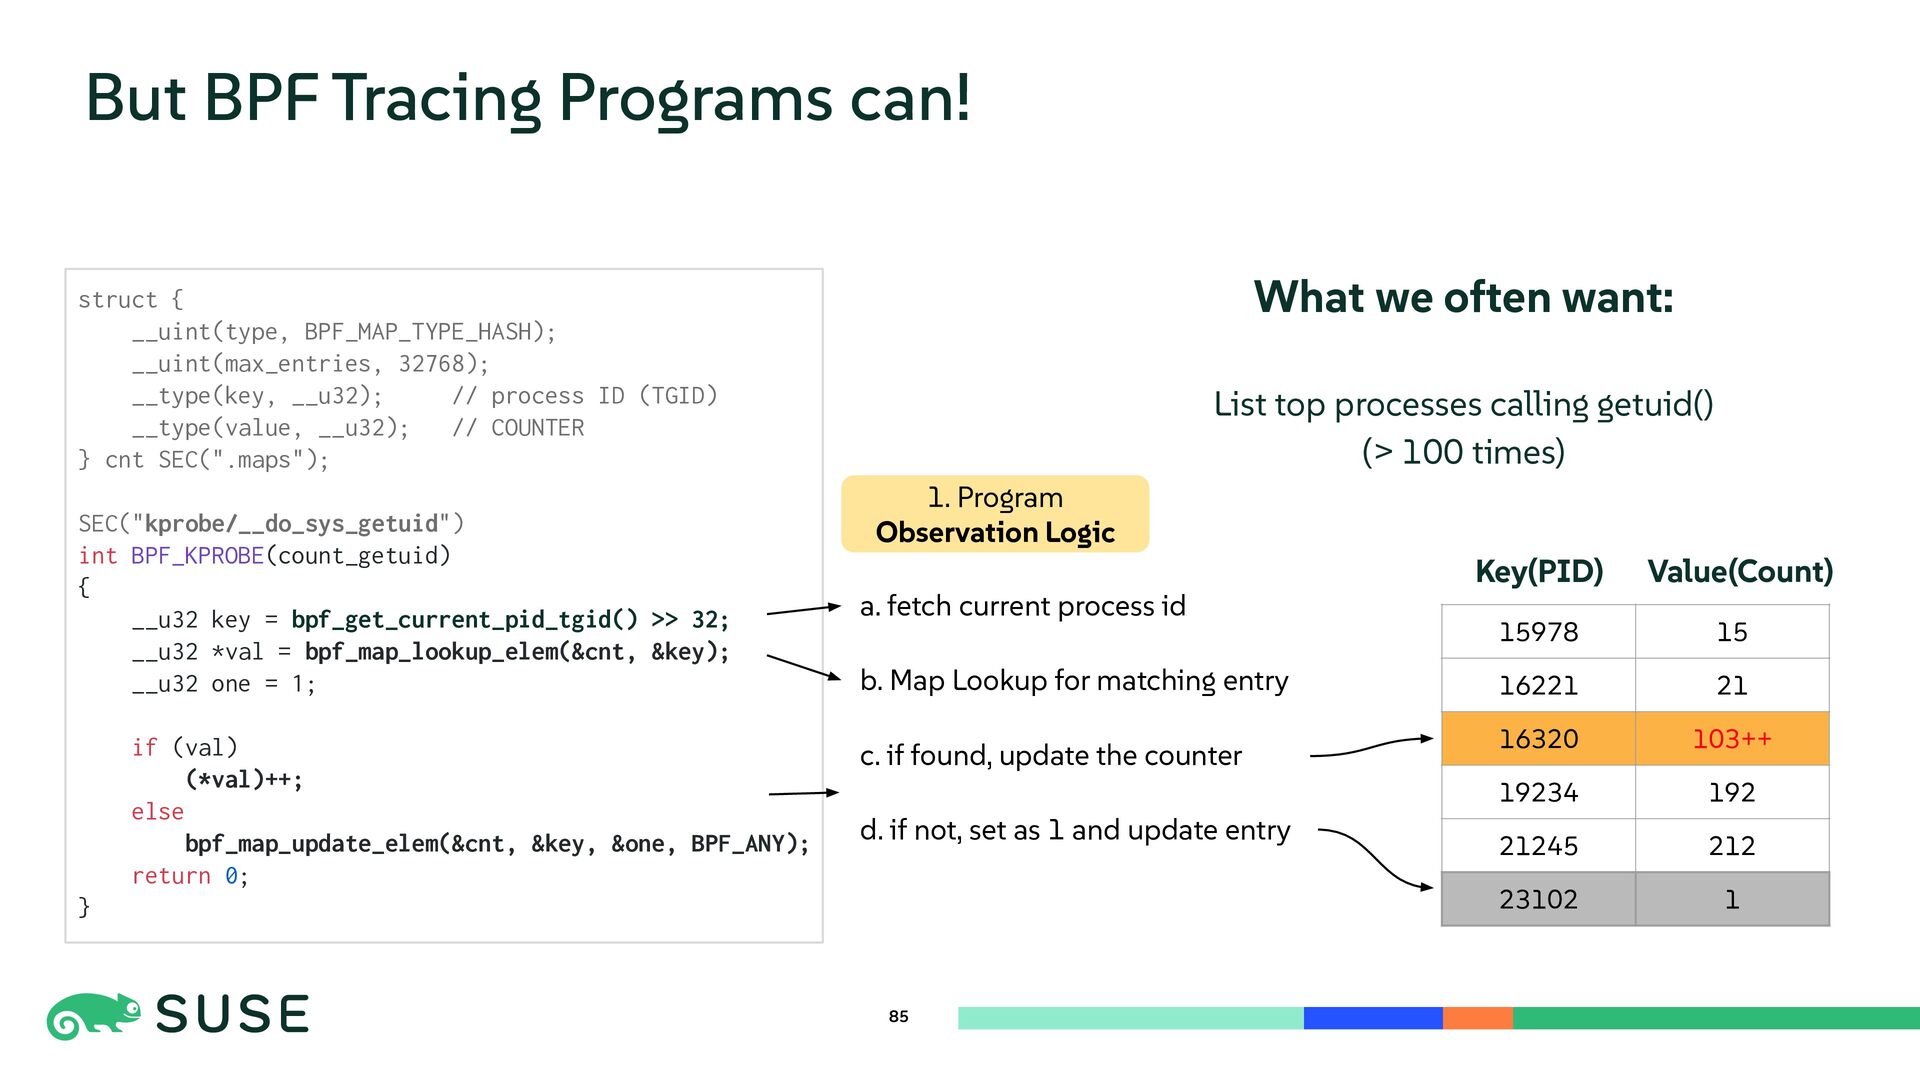
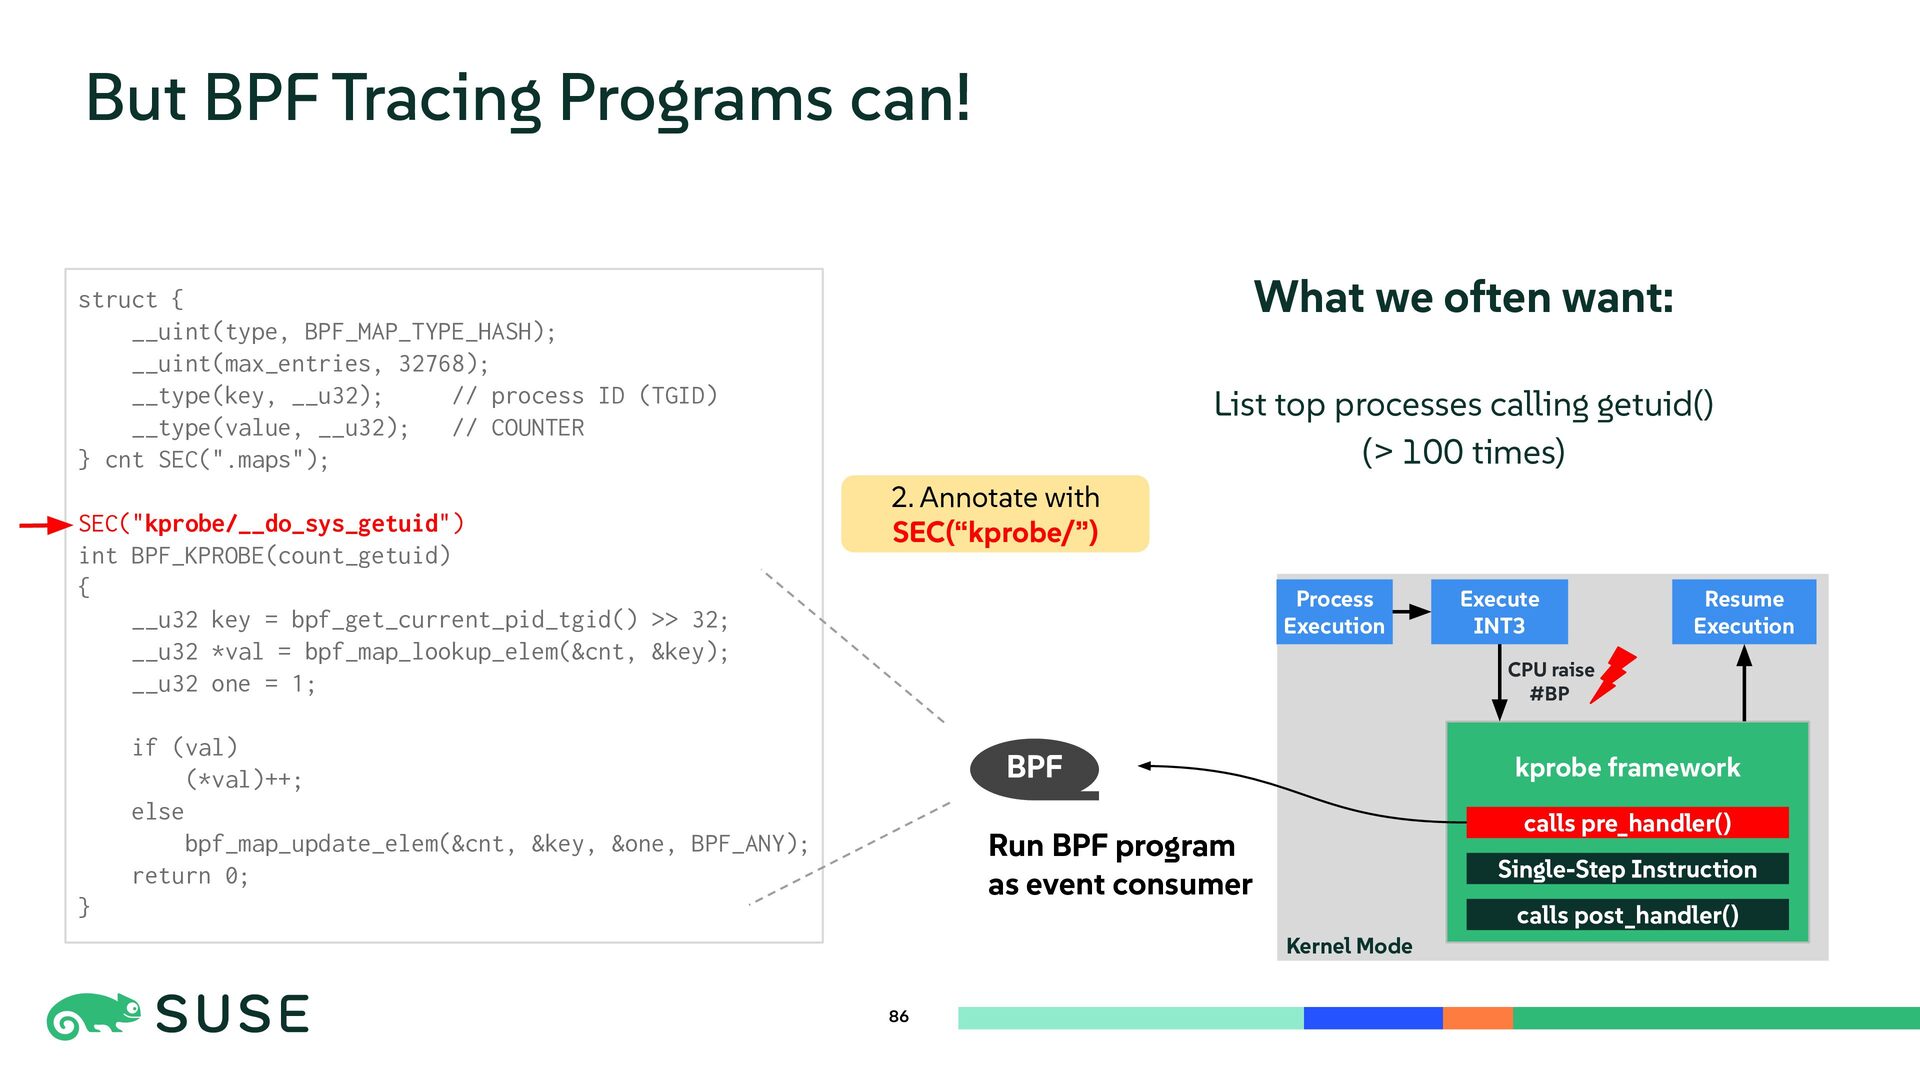
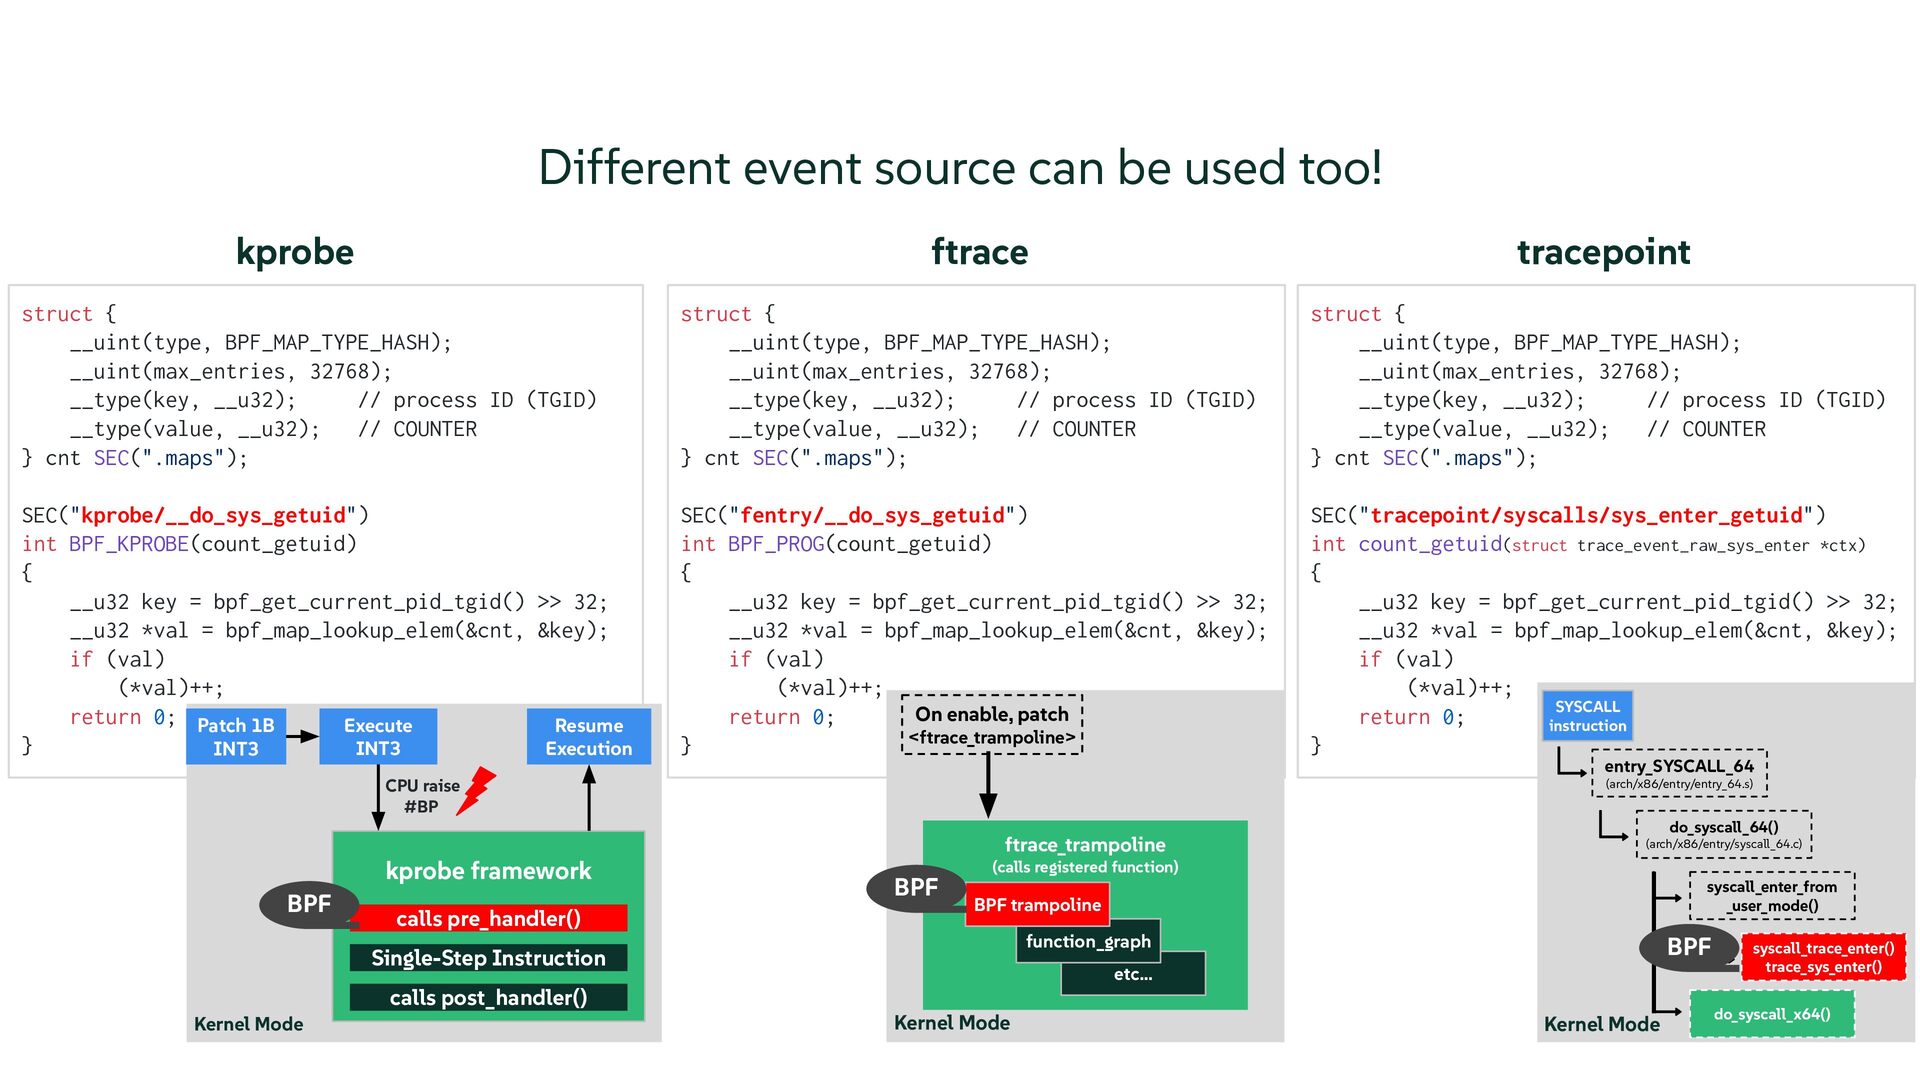
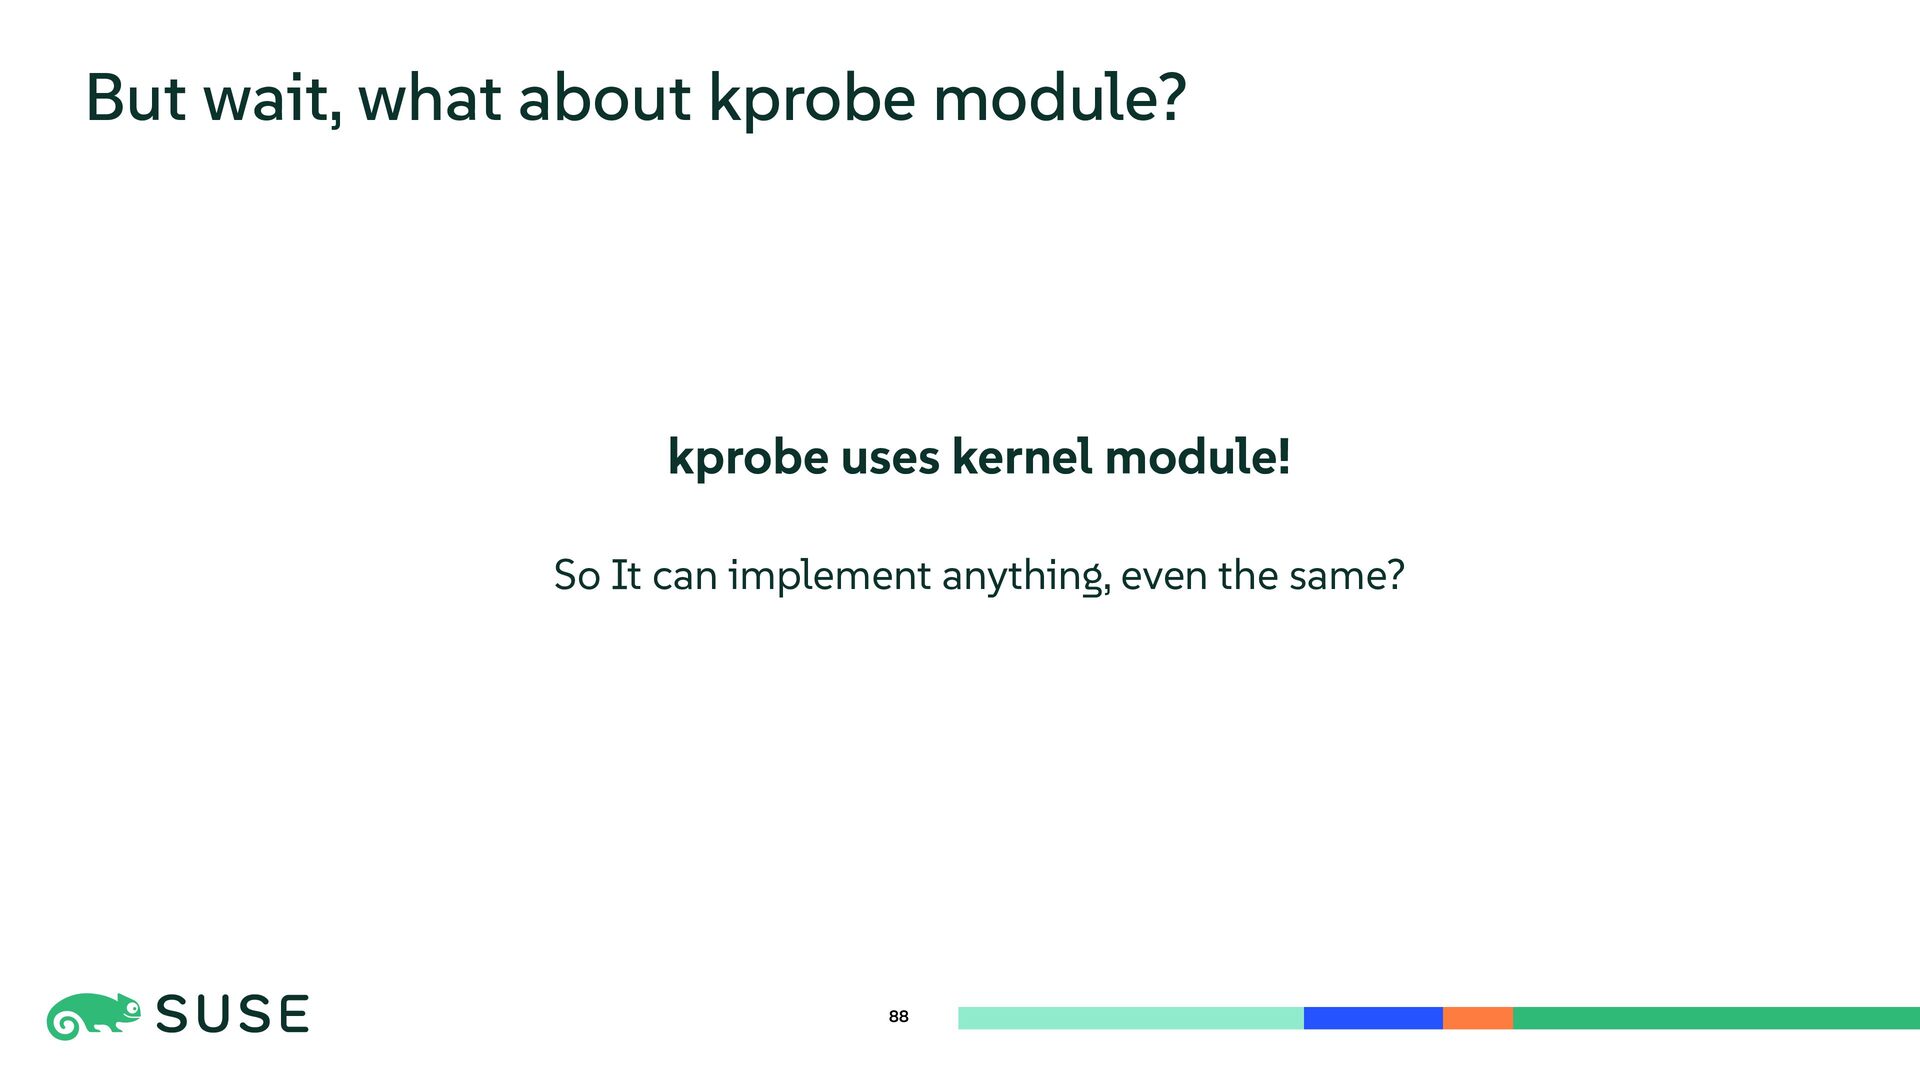
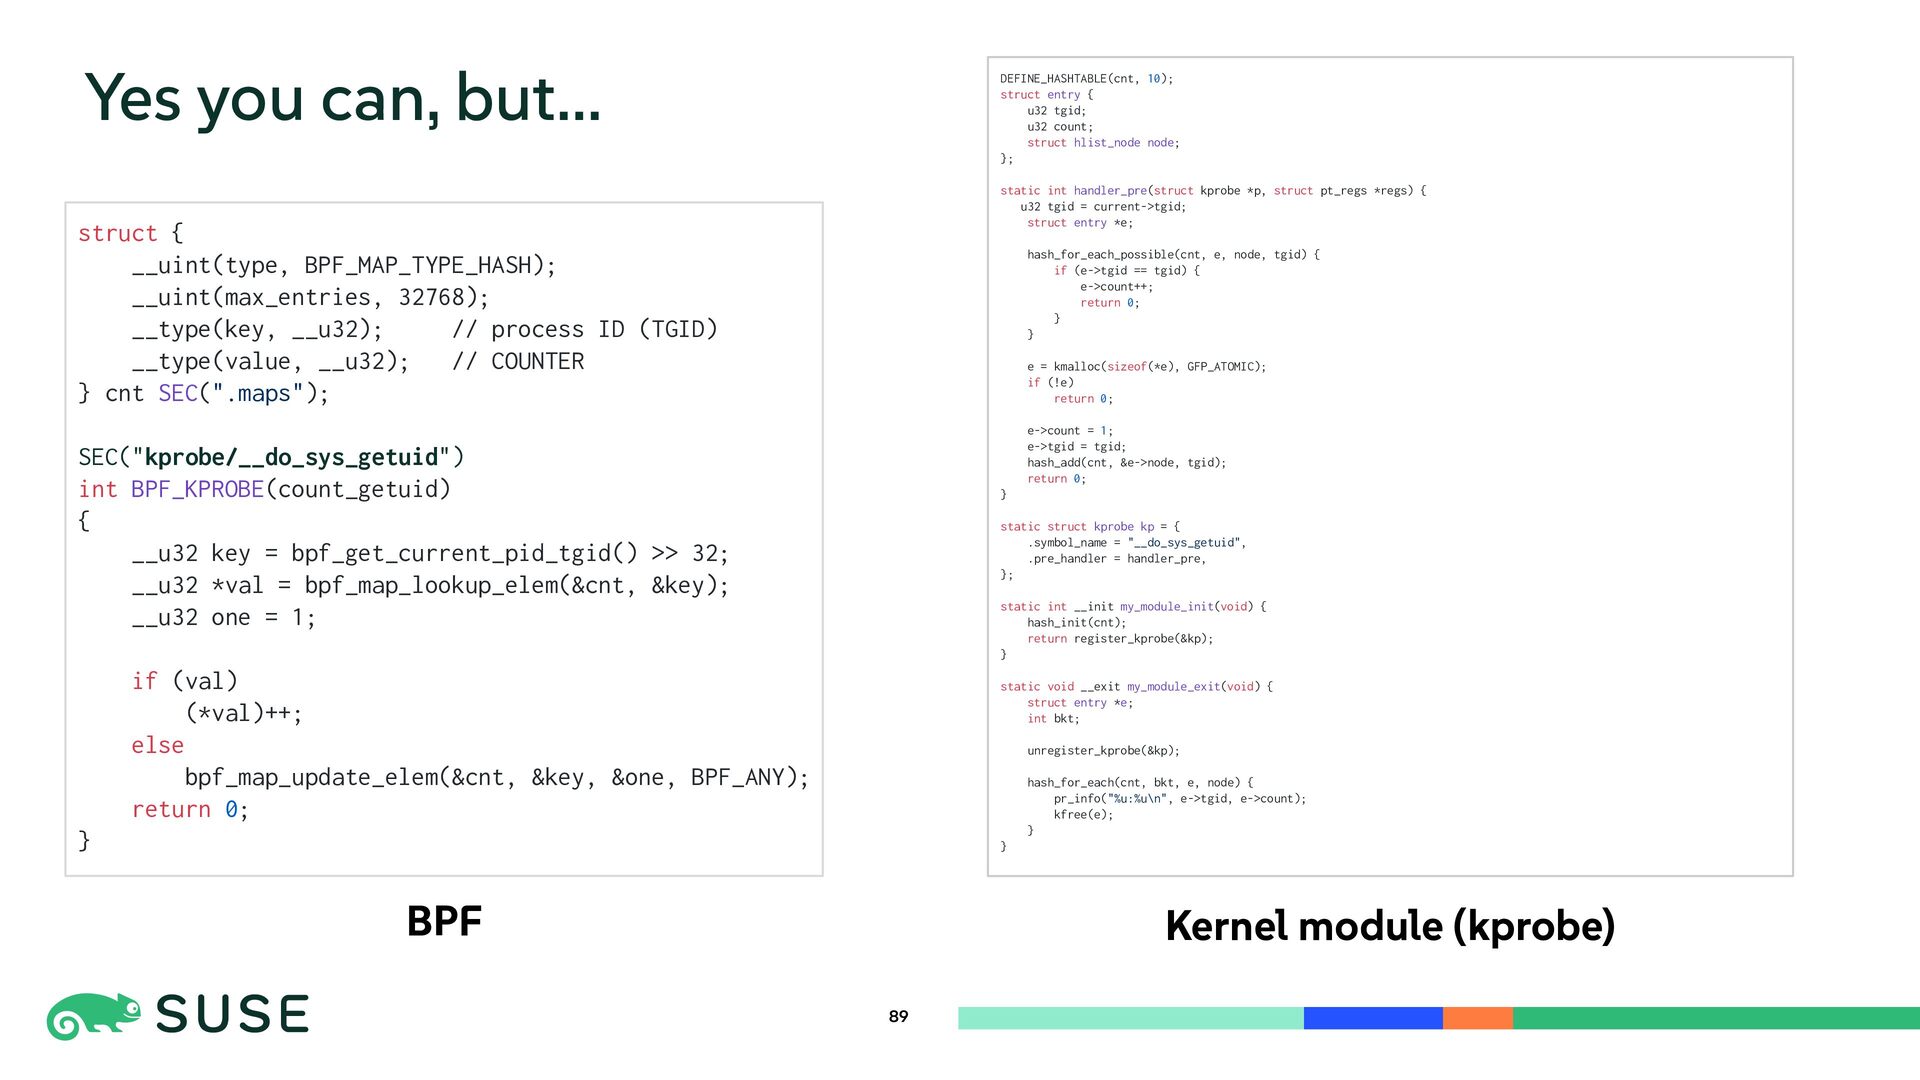
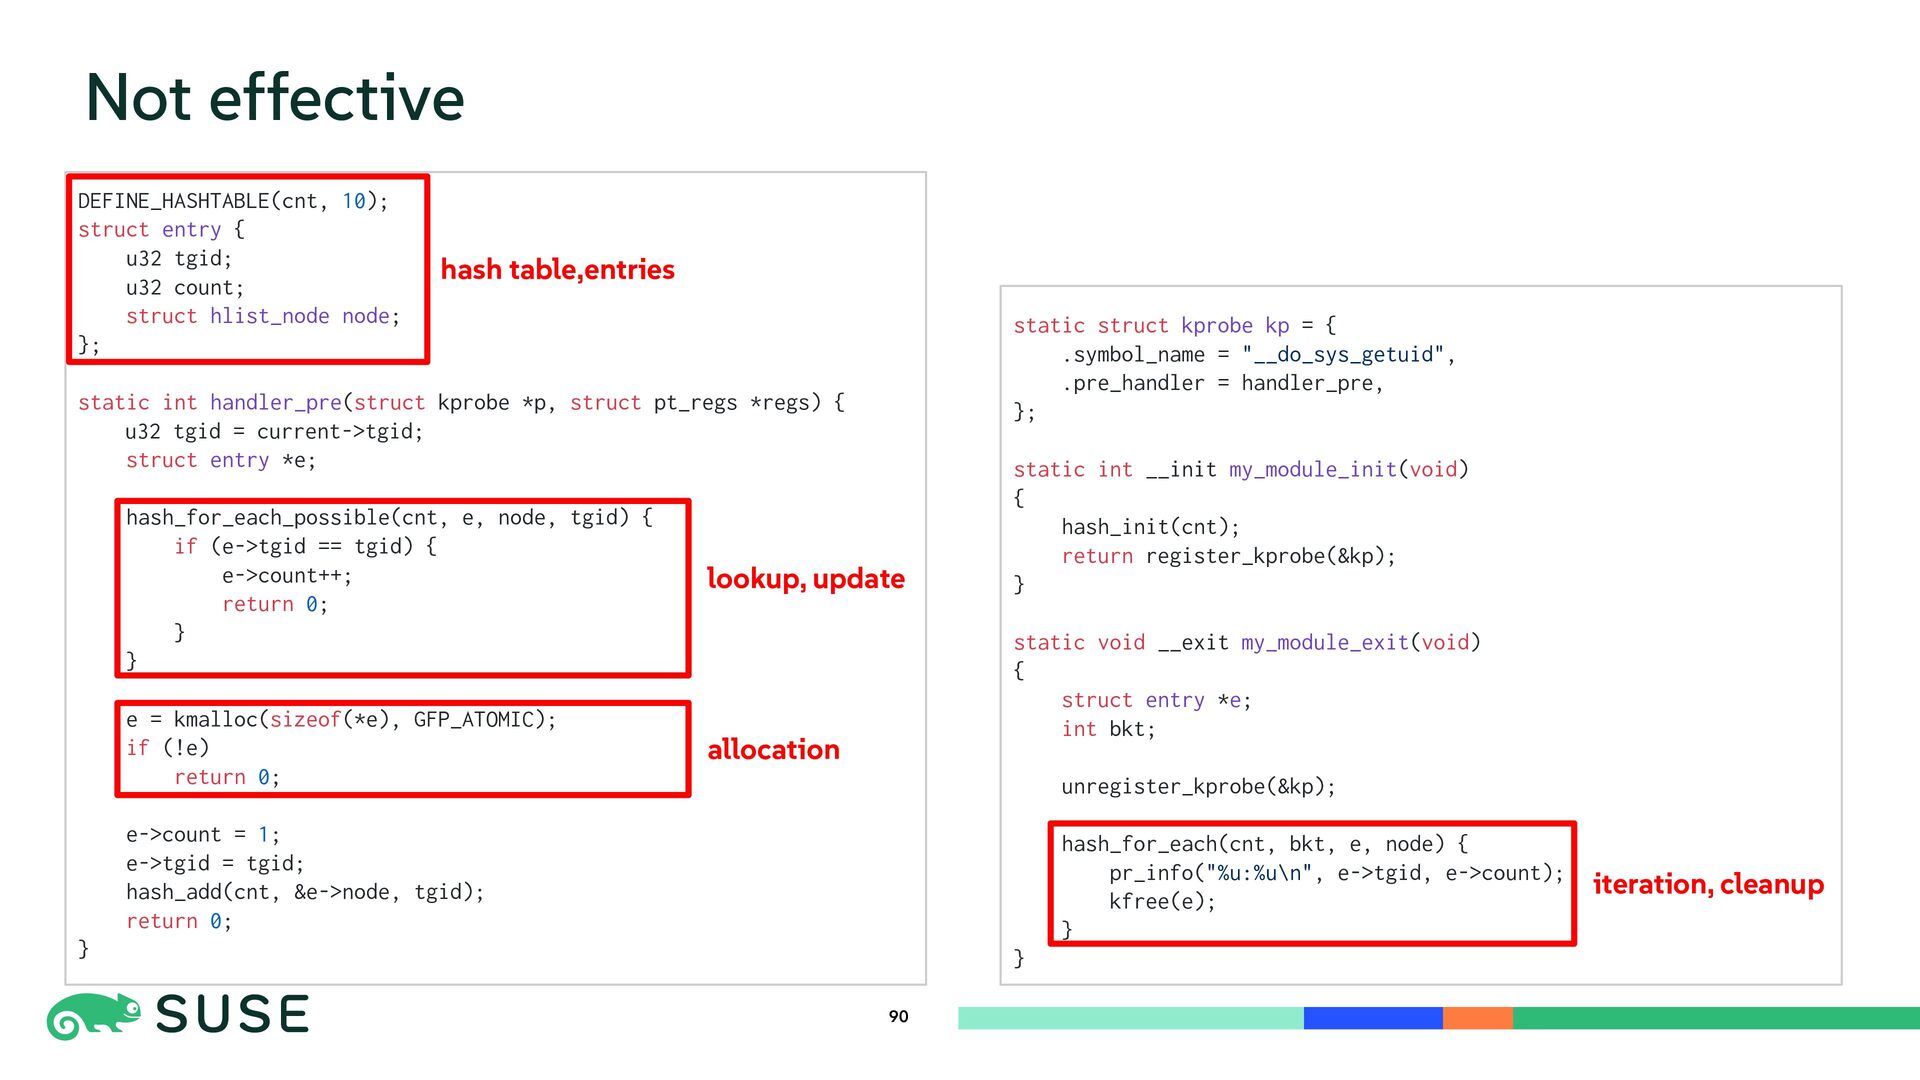
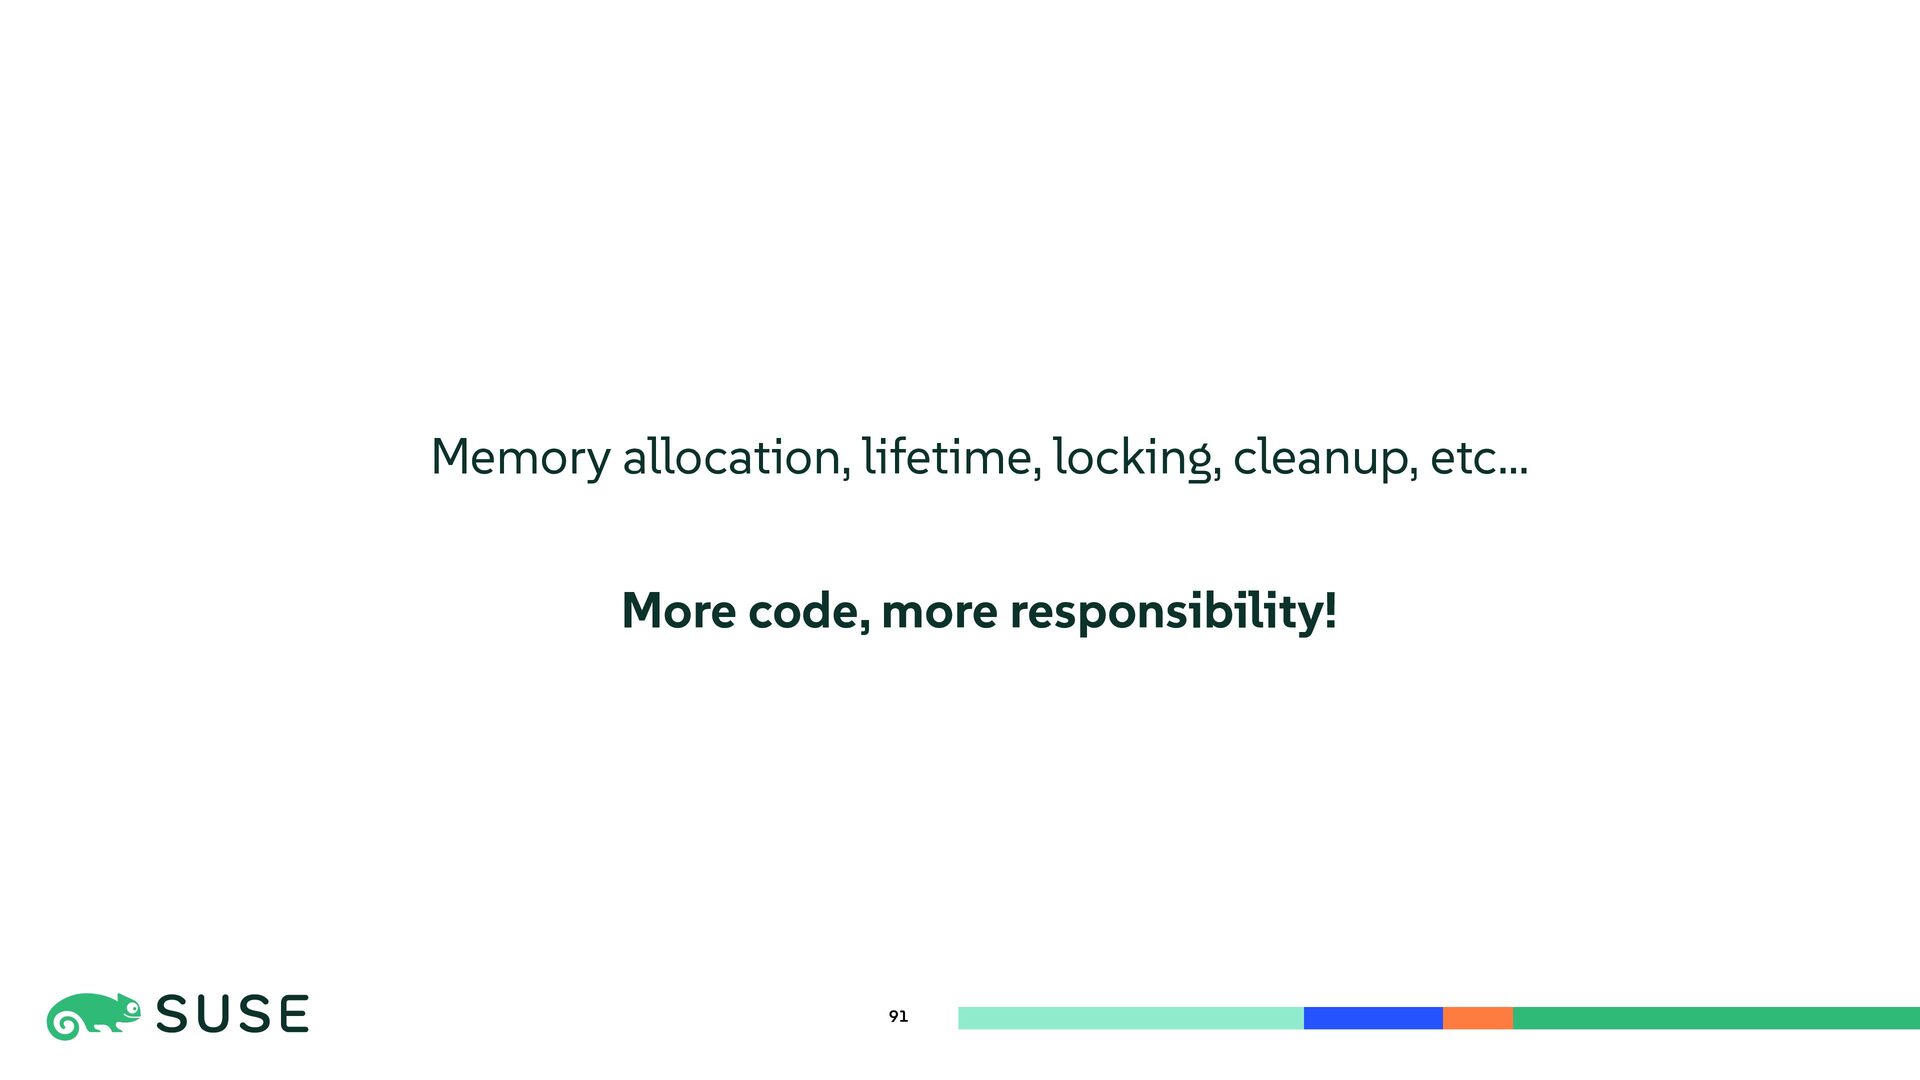
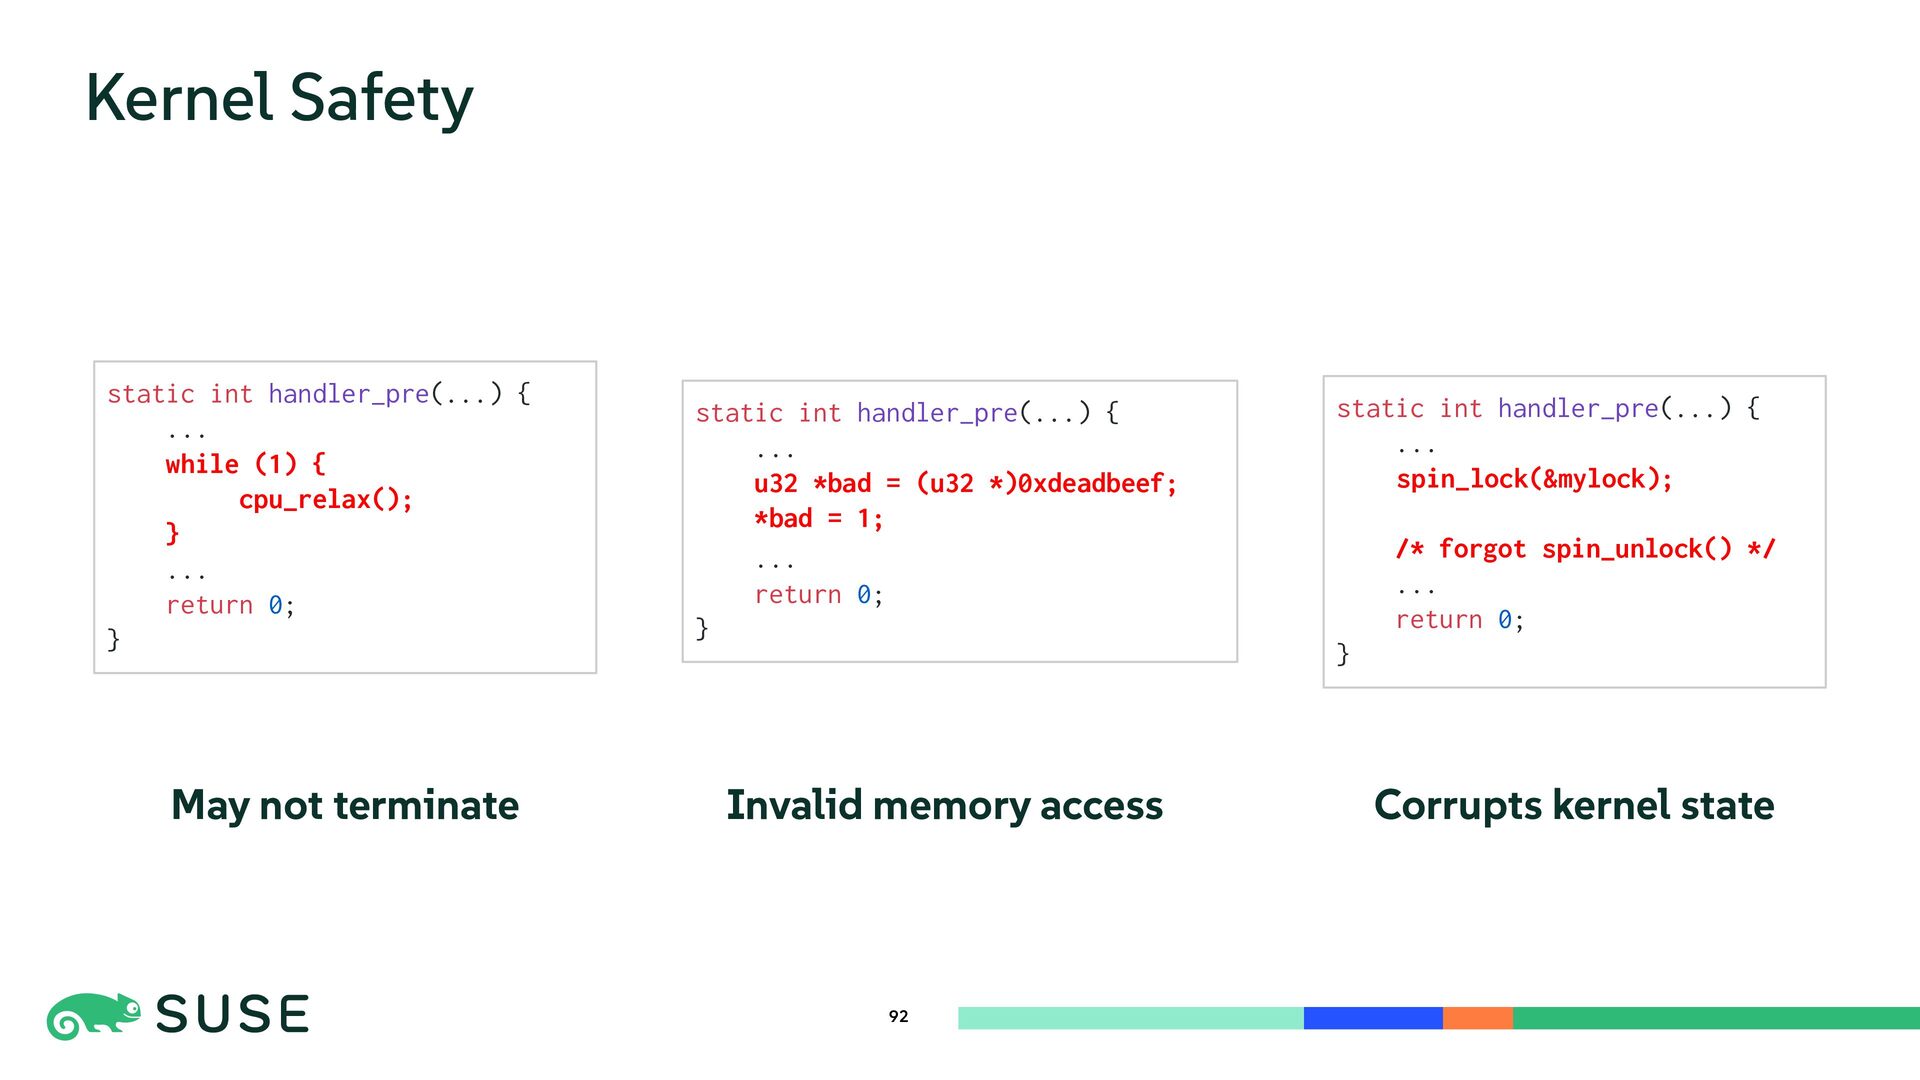
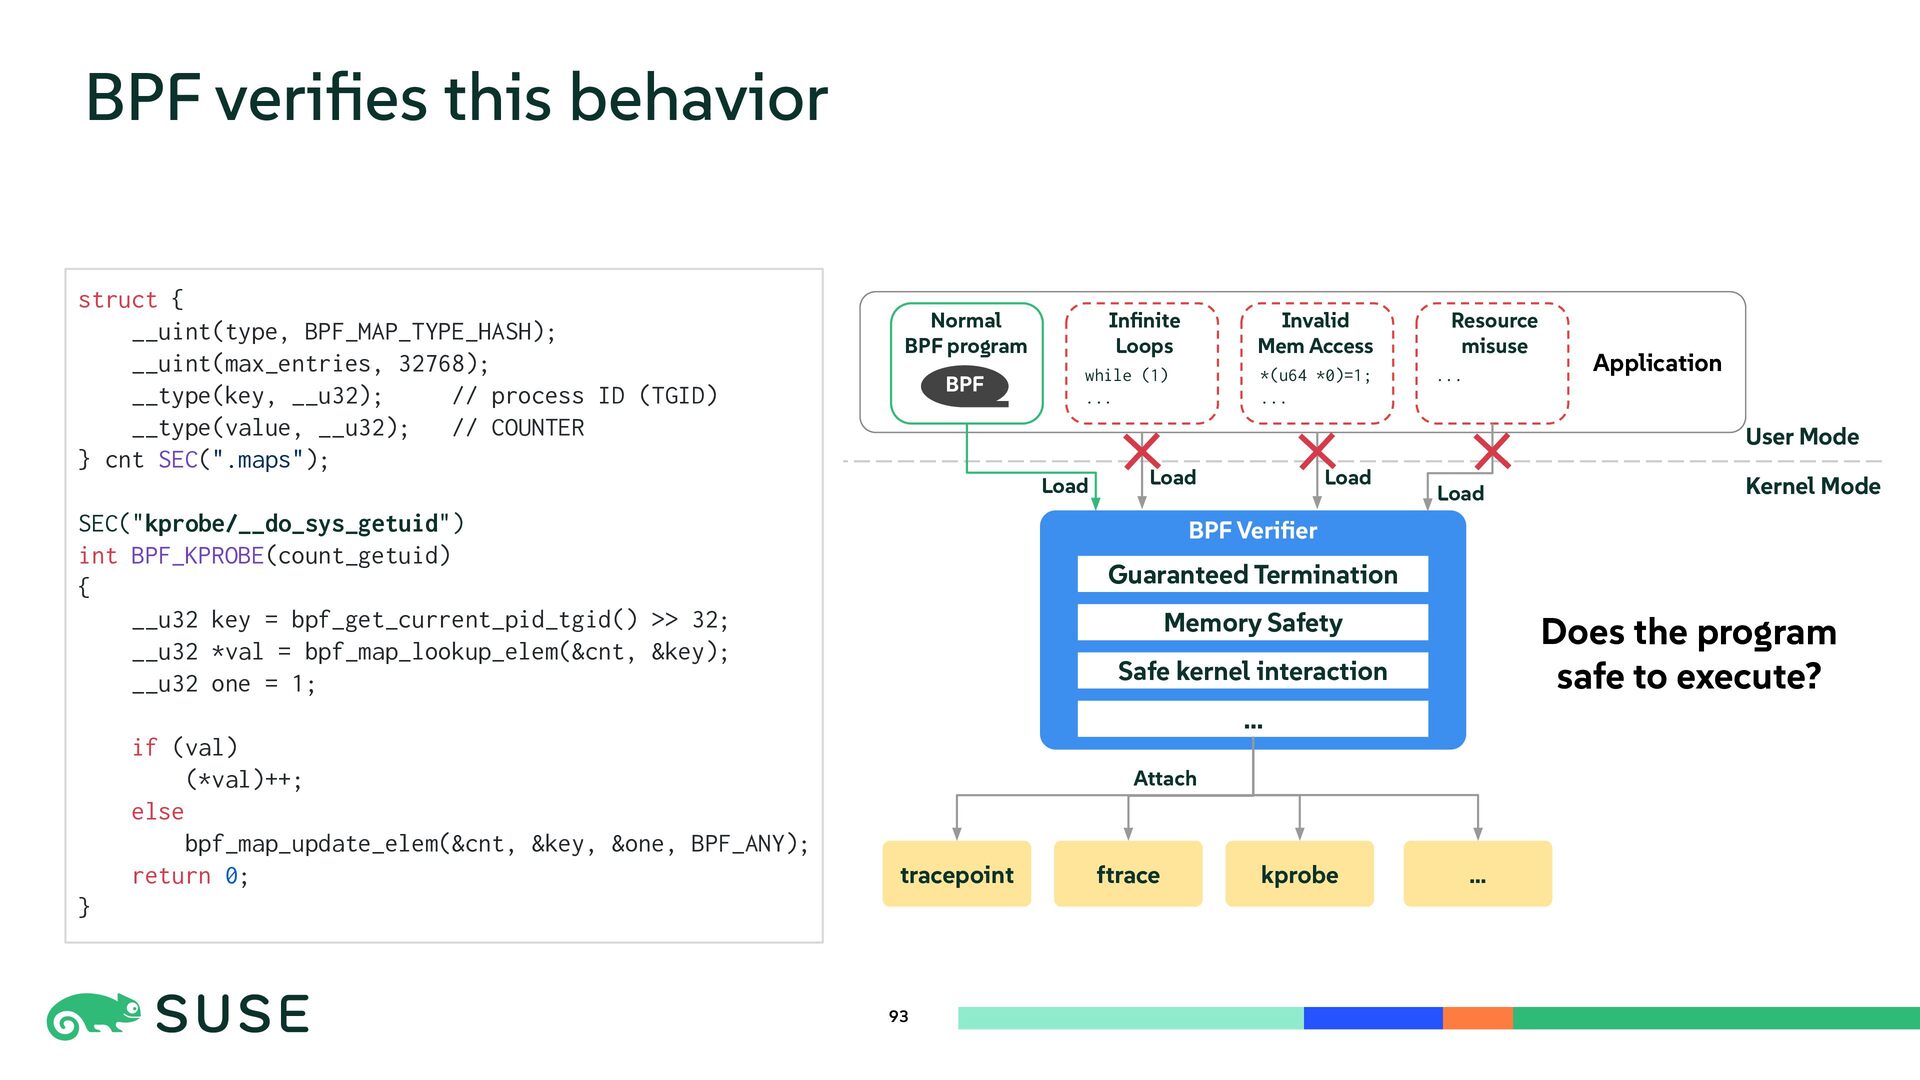
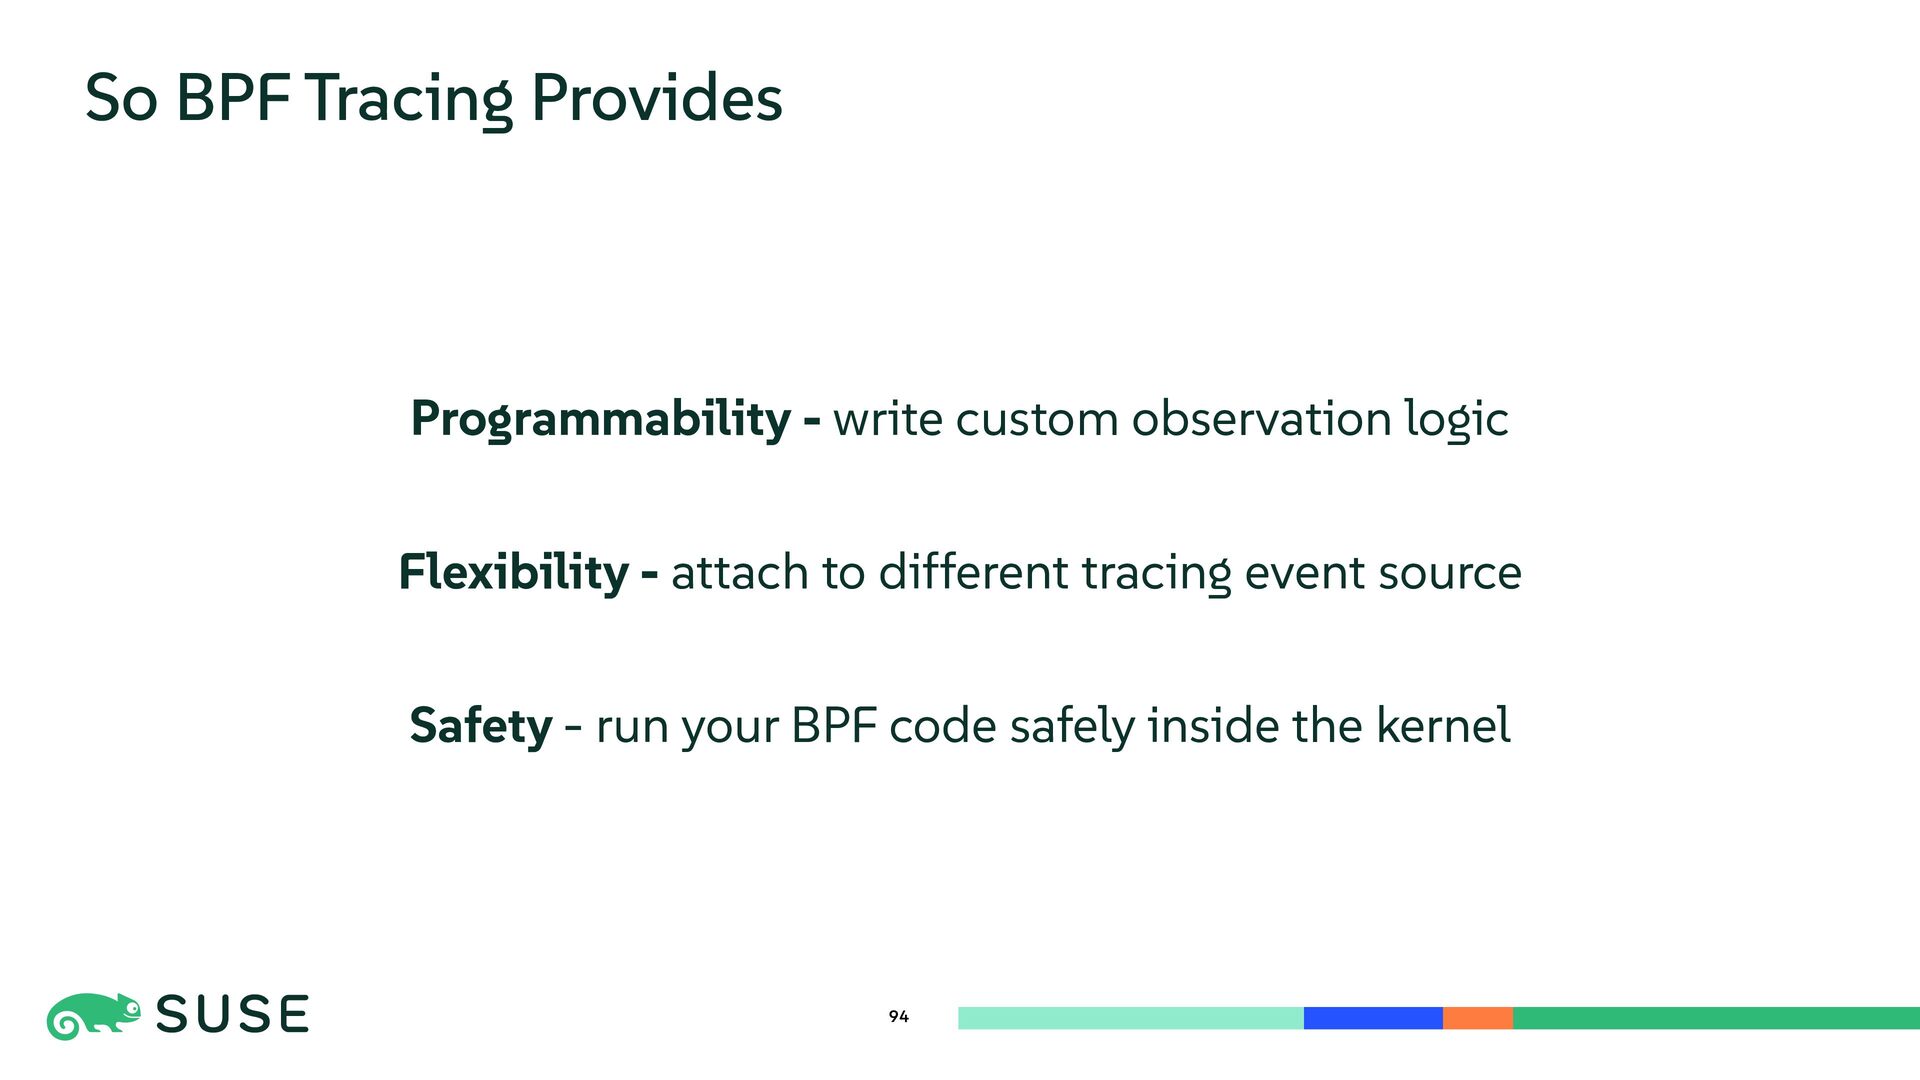
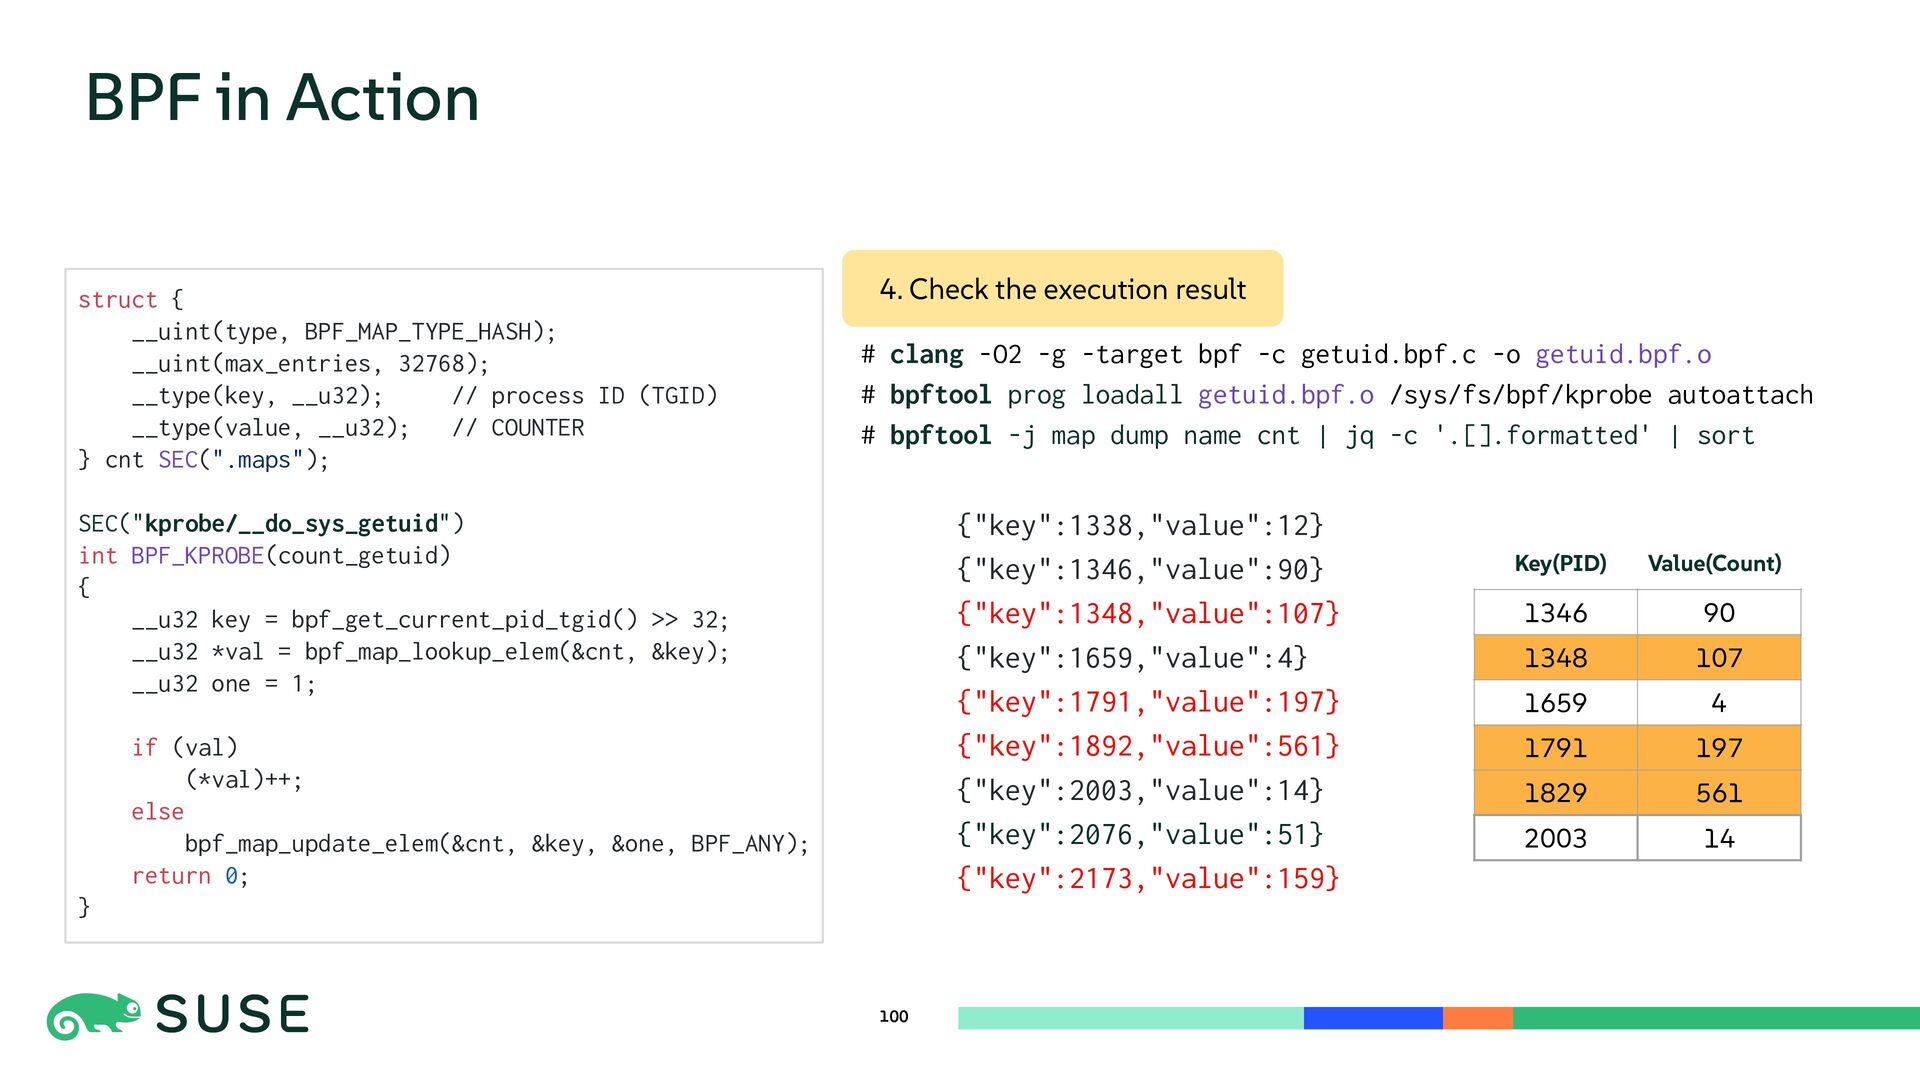
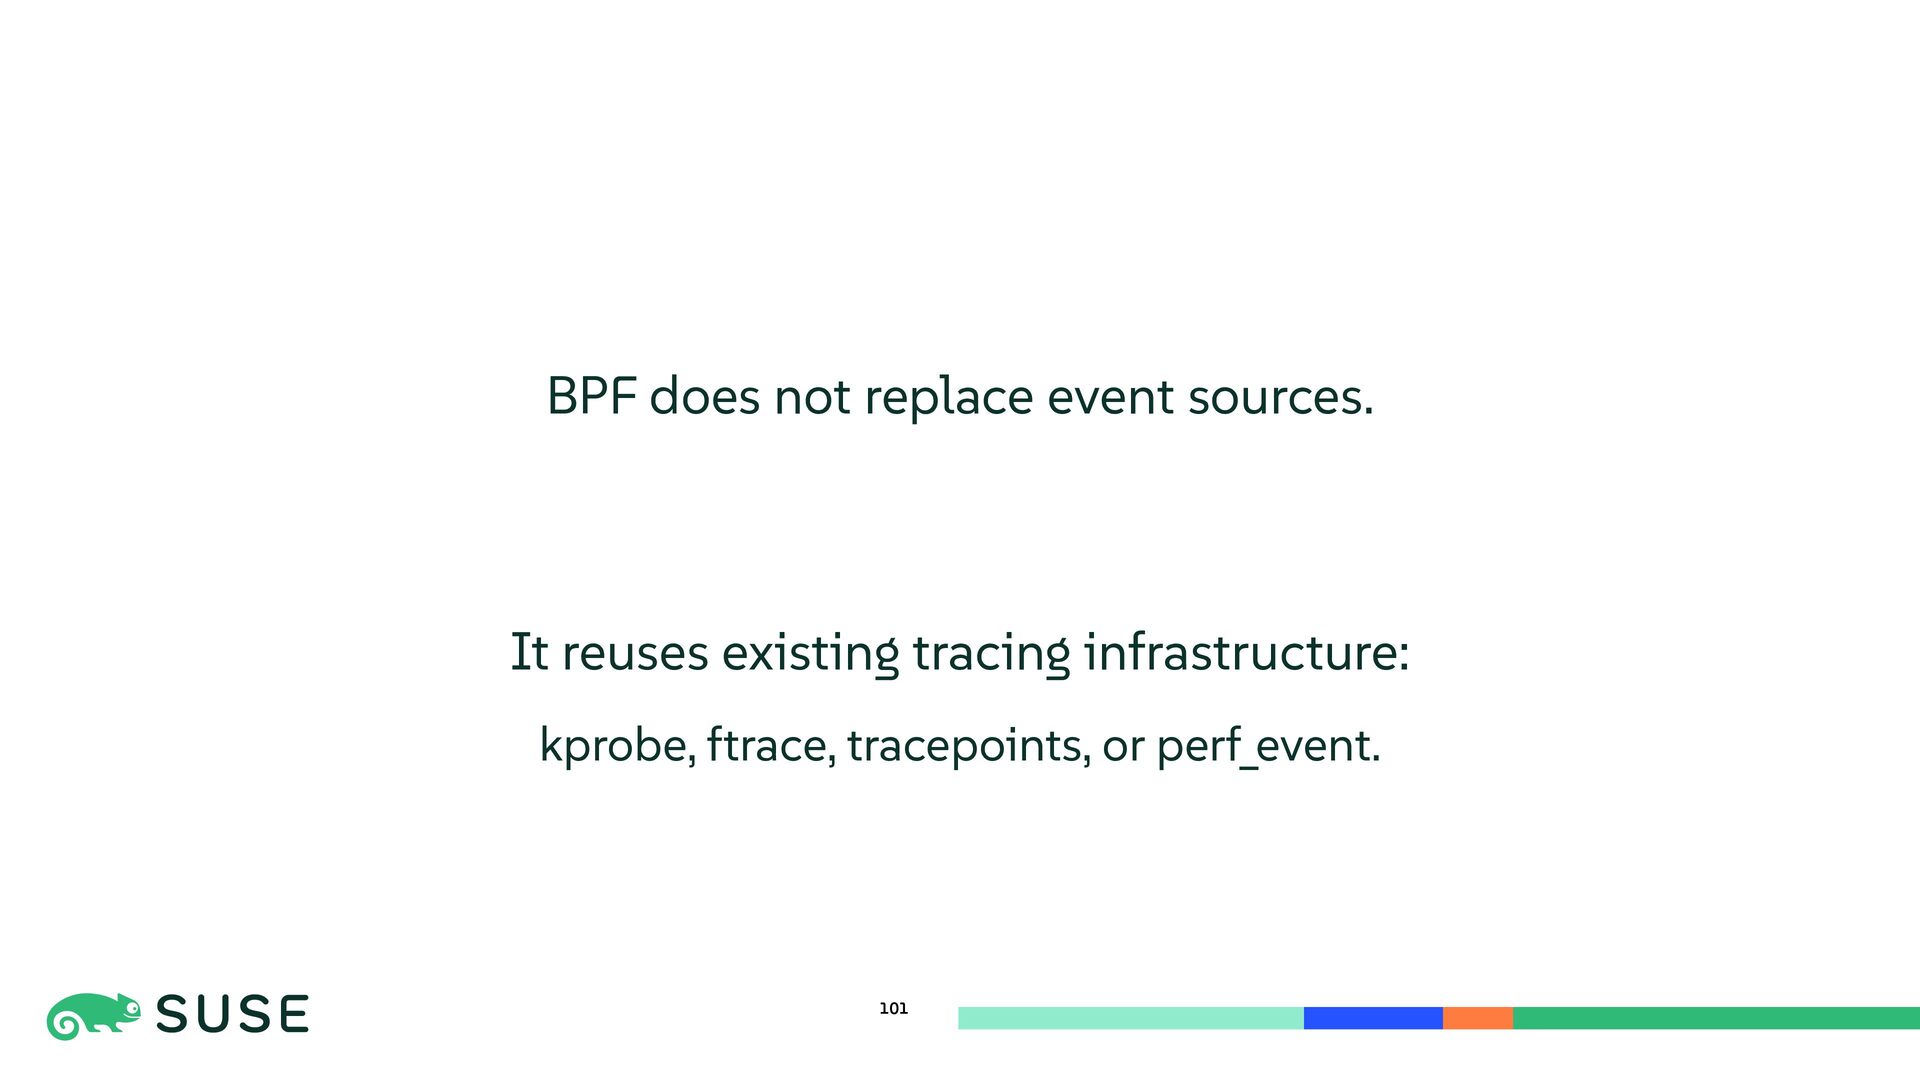
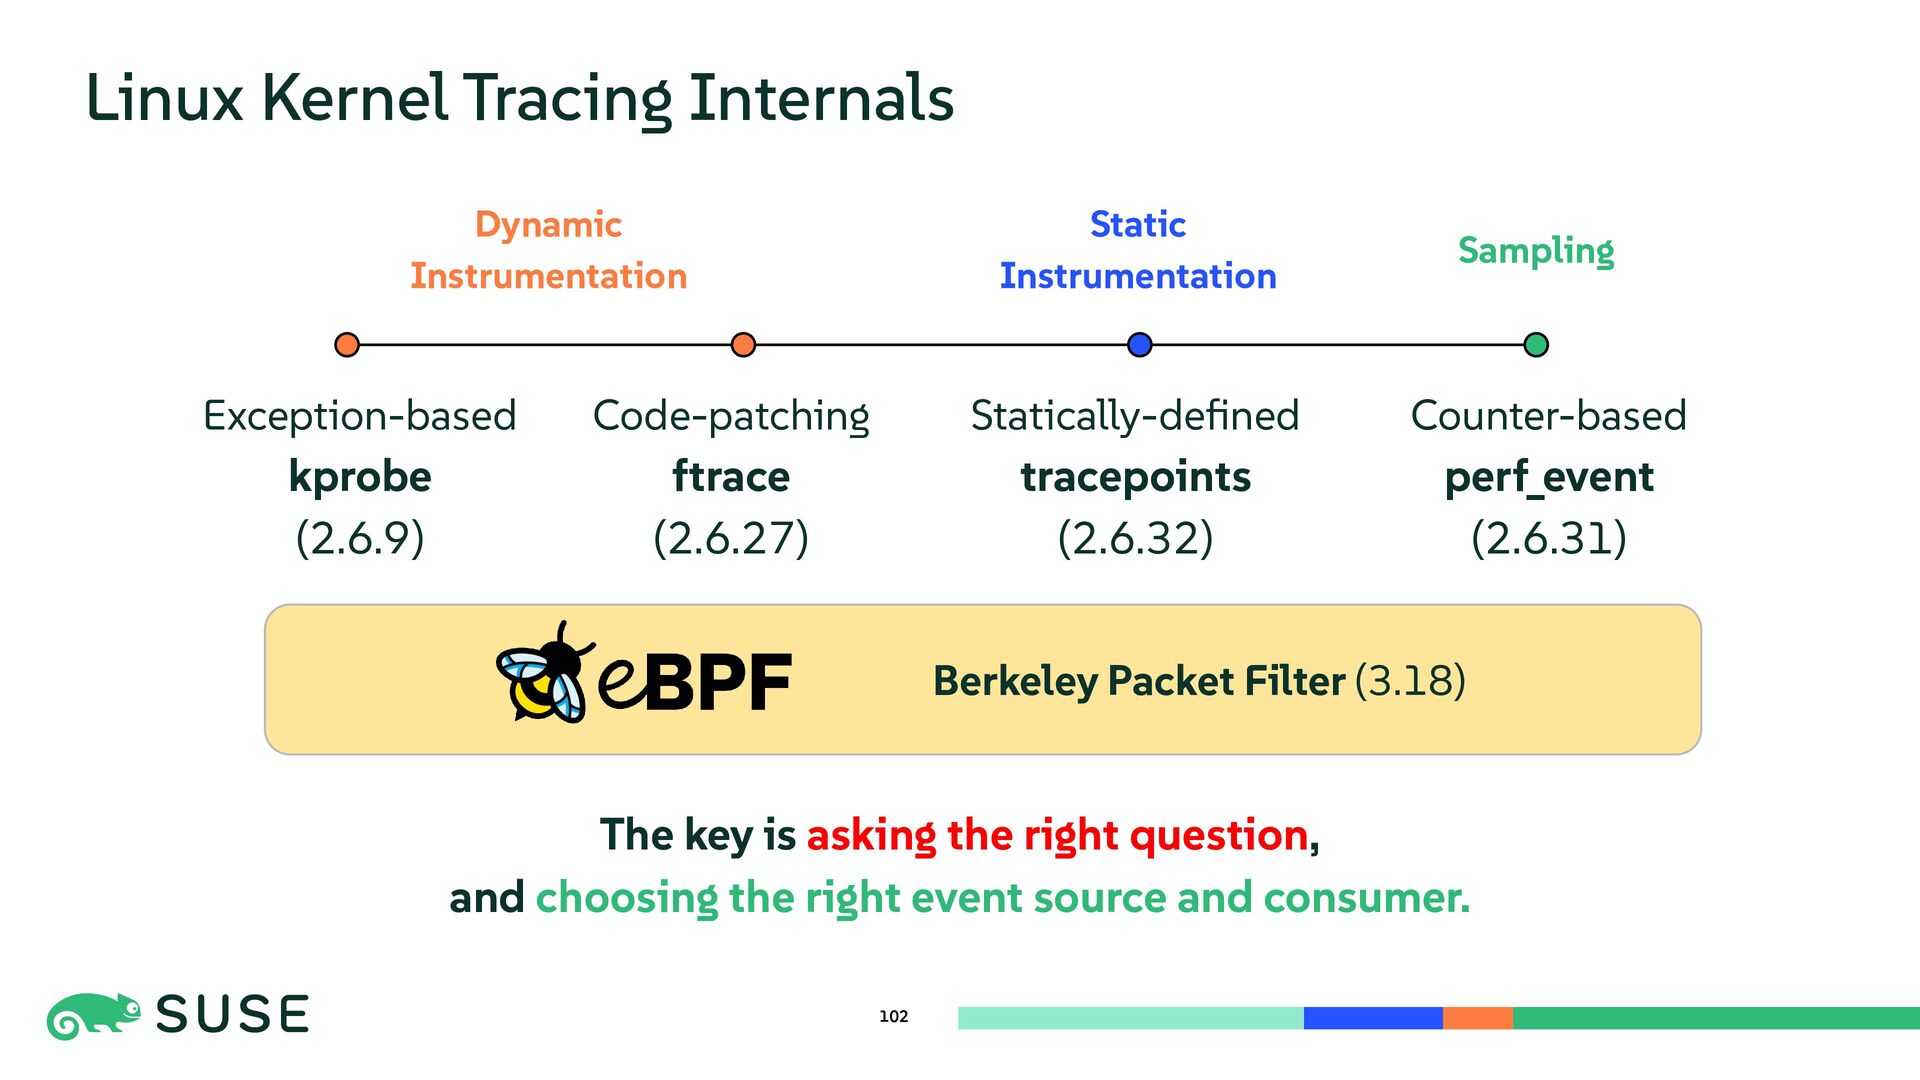
This session dives into the core mechanisms of Linux kernel tracing. We explore dynamic instrumentation such as exception-based kprobe and code-patching ftrace, comparing internals and performance overhead. The talk also covers low-overhead, statically defined tracepoints and counter-based sampling via perf_event. Finally, we introduce BPF as a programmable execution layer that reuses and enhances tracing sources for flexible and efficient kernel observation.
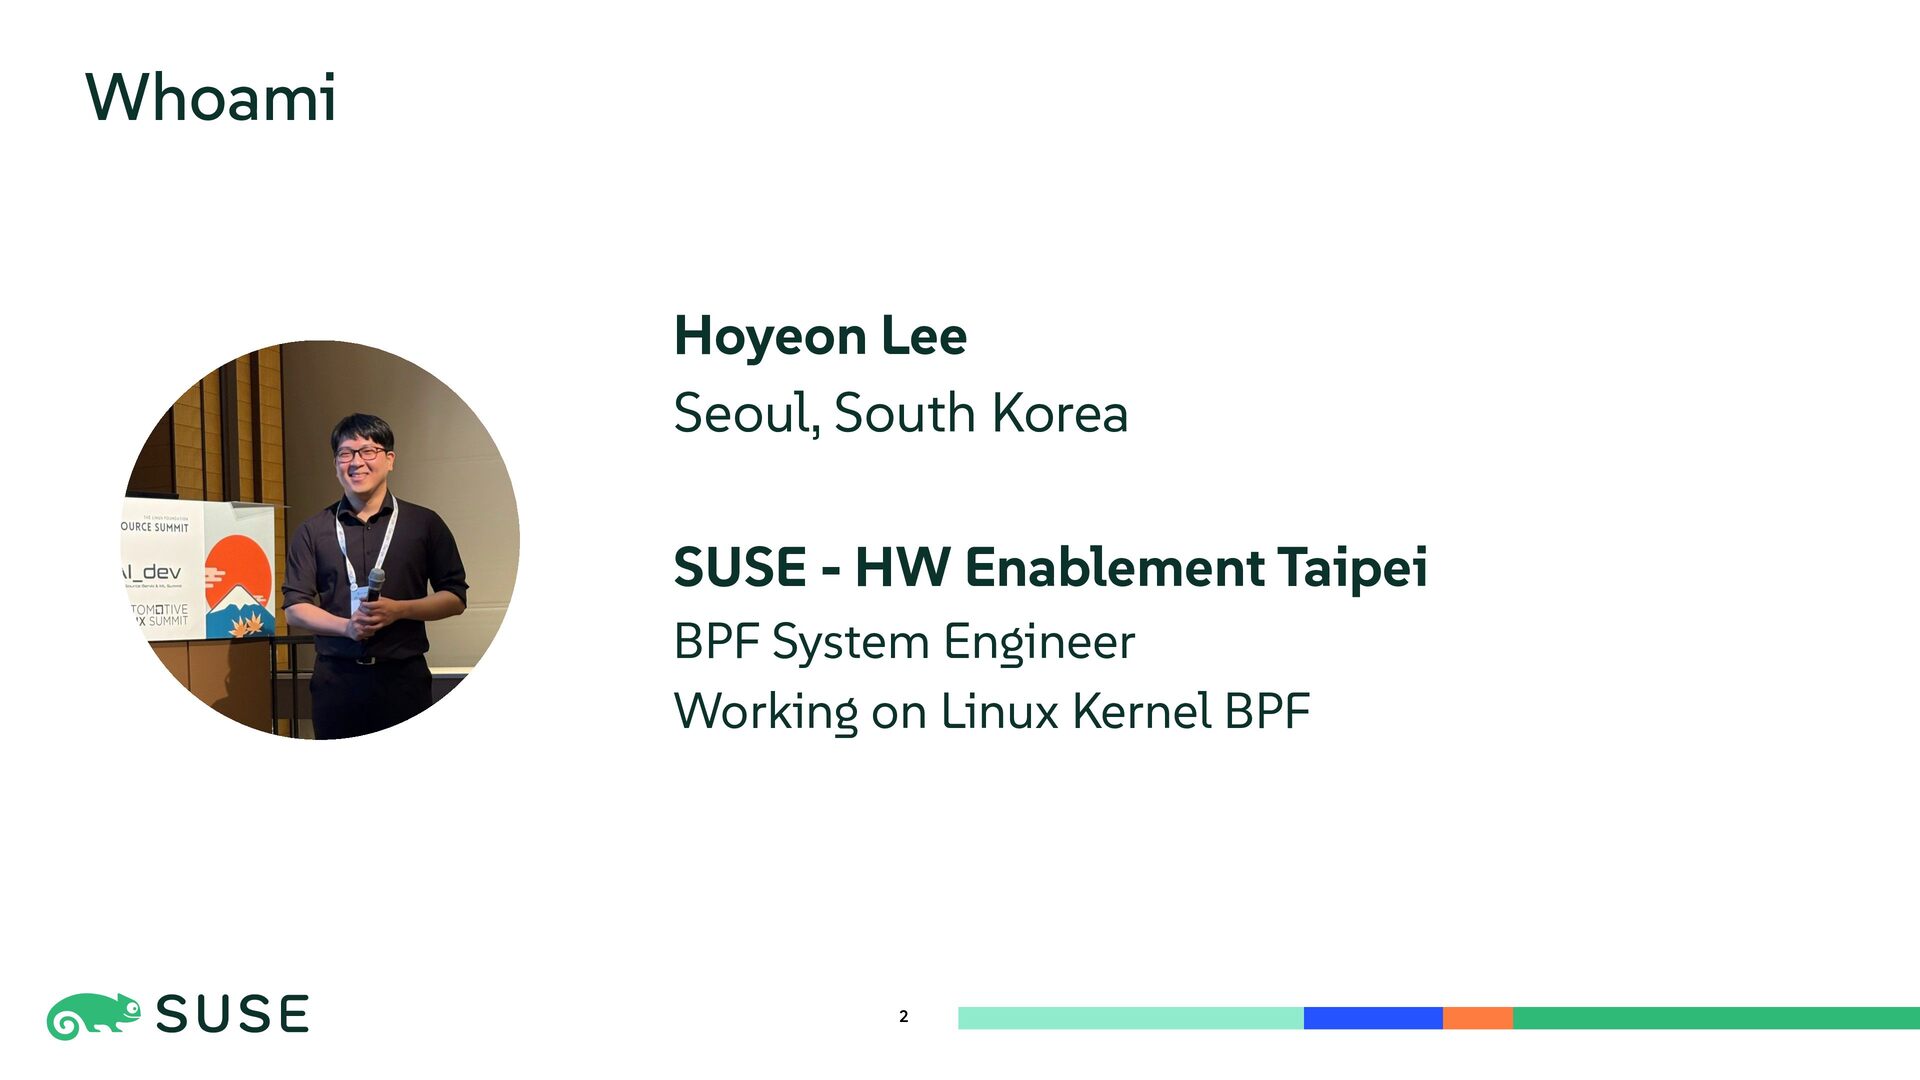
Presented at: SUSE Labs Conference 2026