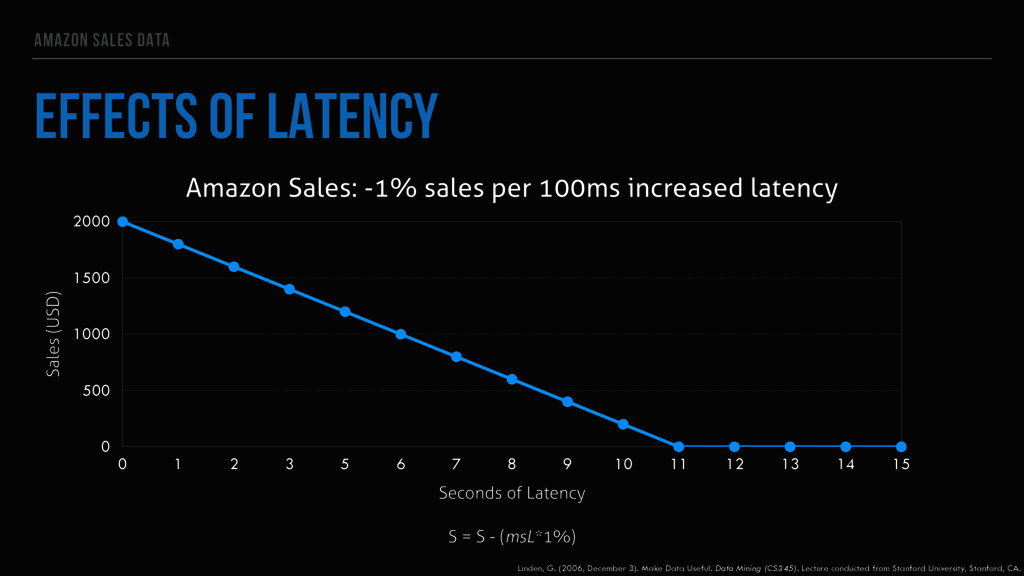
per 100ms increased latency Sales (USD) 0 500 1000 1500 2000 Seconds of Latency 0 1 2 3 5 6 7 8 9 10 11 12 13 14 15 S = S - (msL*1%) Linden, G. (2006, December 3). Make Data Useful. Data Mining (CS345). Lecture conducted from Stanford University, Stanford, CA.
Weeks) % Fewer Searches per Day -1 -0.75 -0.5 -0.25 0 Milliseconds of Additional Latency 50 100 200 400 Schurman, E., Brutlag, J. (2009, June 23). The User and Business Impact of Server Delays, Additional Bytes, and HTTP Chunking in Web Search. O'Reilly Velocity. Lecture conducted from O'Reilly Media, San Jose, CA.
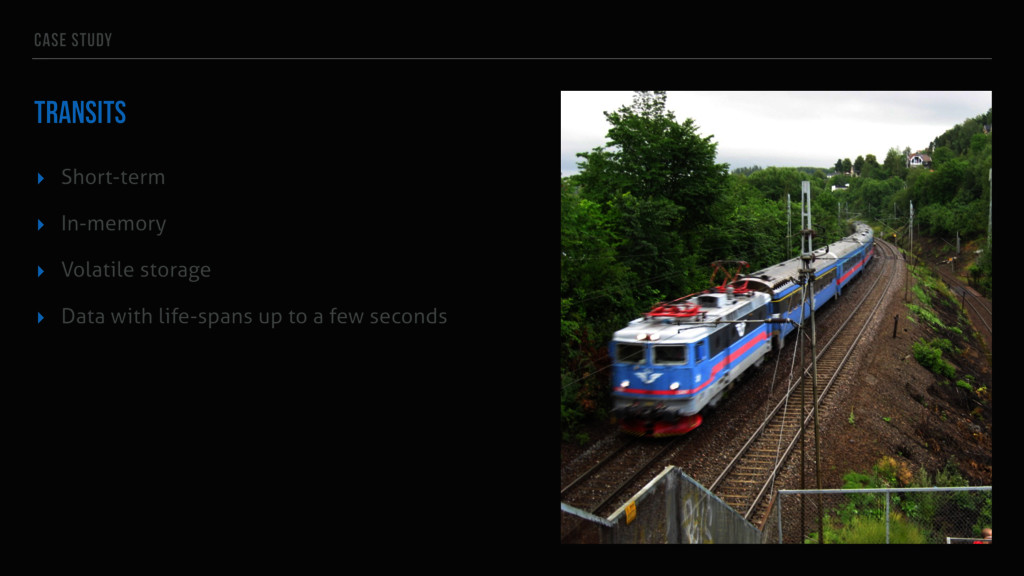
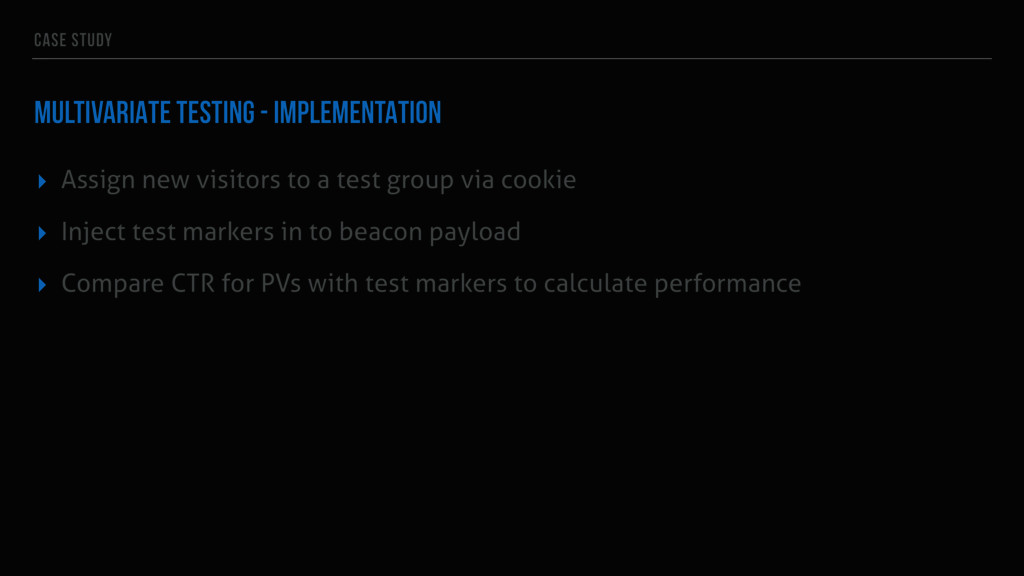
to groups ▸ 1 control group receives unaltered content ▸ 1 or more groups receive altered content ▸ Measure behavioral statistics (CTR, abandon rate, time on page, scroll depth) for each group
- What does the user click on? ▸ Usage patterns - When does the user visit? Where do they come from? ▸ Mouse & attention tracking - What draws the user’s attention? ▸ RUM
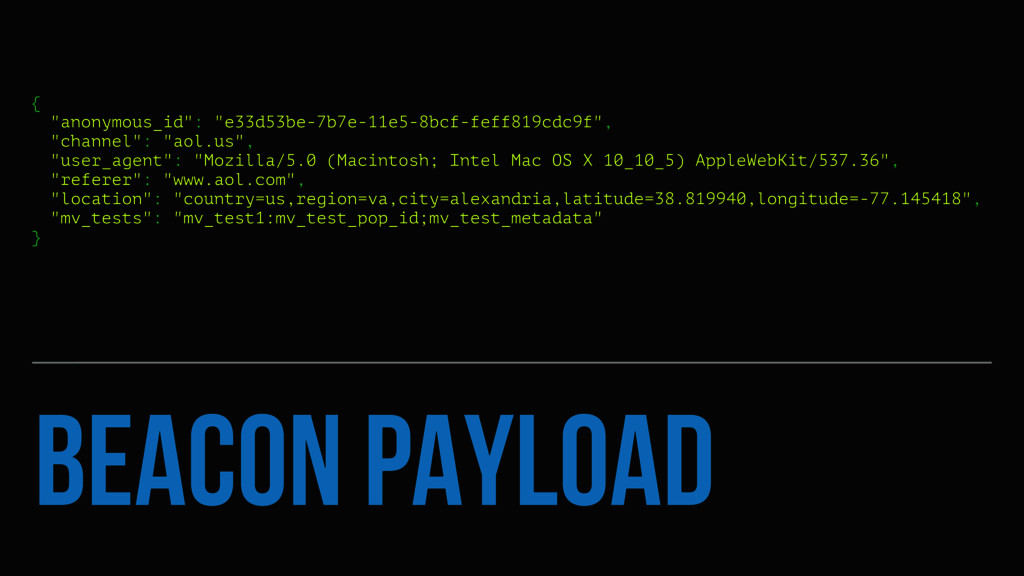
Intel Mac OS X 10_10_5) AppleWebKit/537.36", "referer": "www.aol.com", "location": "country=us,region=va,city=alexandria,latitude=38.819940,longitude=-77.145418", "mv_tests": "mv_test1:mv_test_pop_id;mv_test_metadata" }
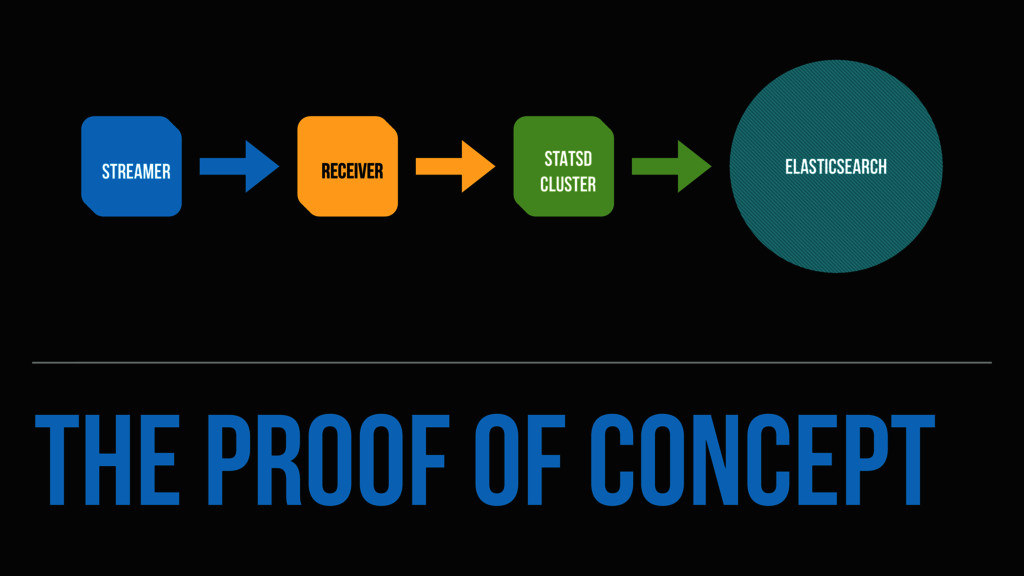
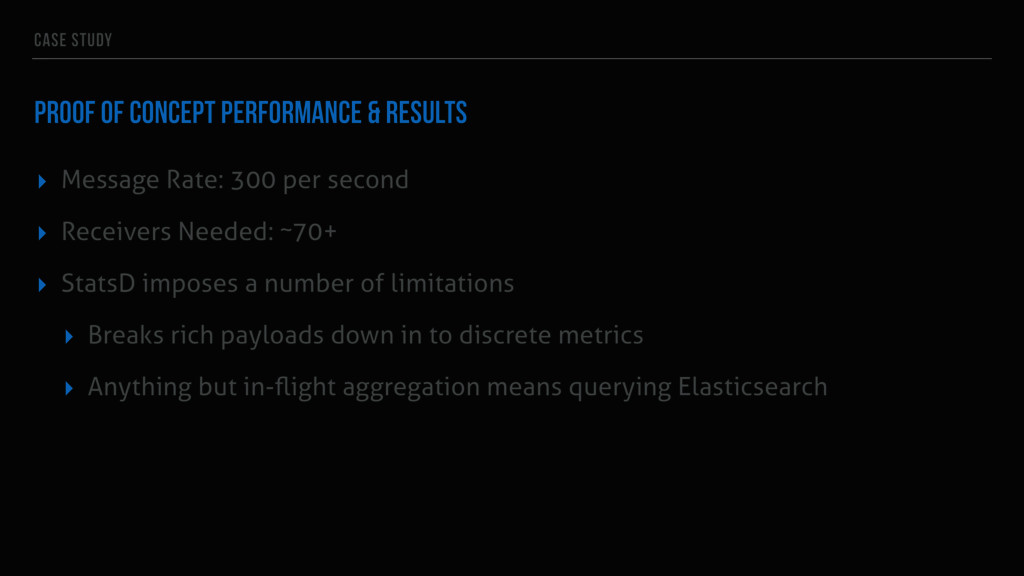
Rate: 300 per second ▸ Receivers Needed: ~70+ ▸ StatsD imposes a number of limitations ▸ Breaks rich payloads down in to discrete metrics ▸ Anything but in-flight aggregation means querying Elasticsearch
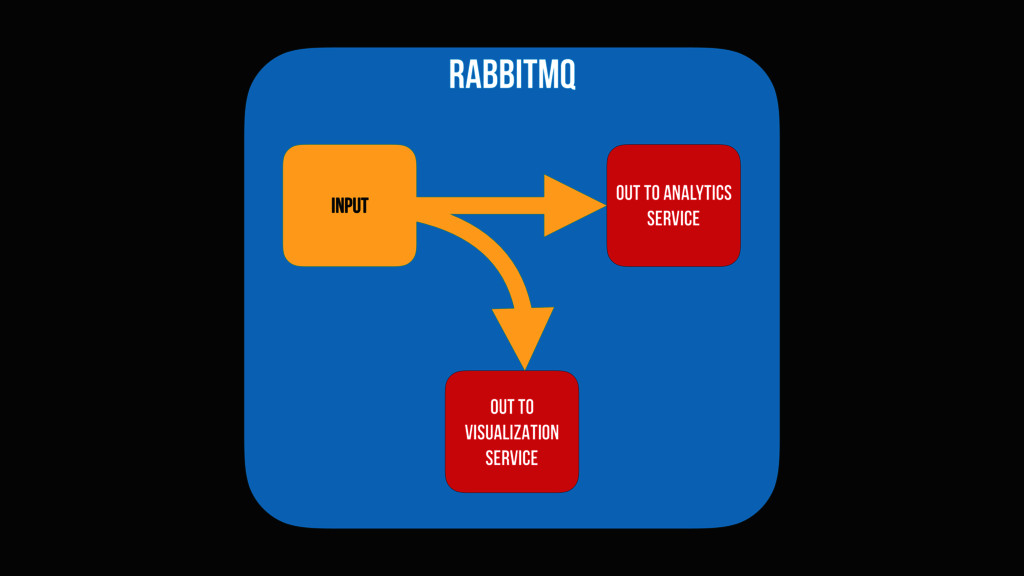
any order. ▸ Some data loss is acceptable. ▸ Consumers may only want small subsets of data ▸ Need to route data to consumers in multiple datacentres / in AWS ▸ Broad support for languages
ours ▸ Federation over at-least-once delivery ▸ Supports complex routing ▸ Allows federation over network boundaries (even when it’s dumb) ▸ Mature clients for our Big Three Stacks (Java, Node.js, PHP) ▸ Big enterprises like stuff with companies behind it
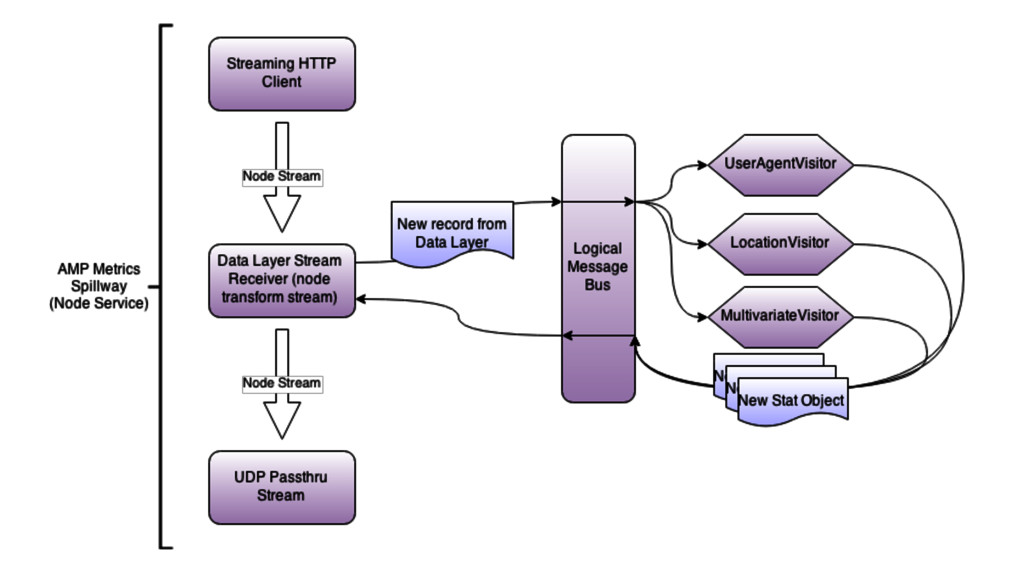
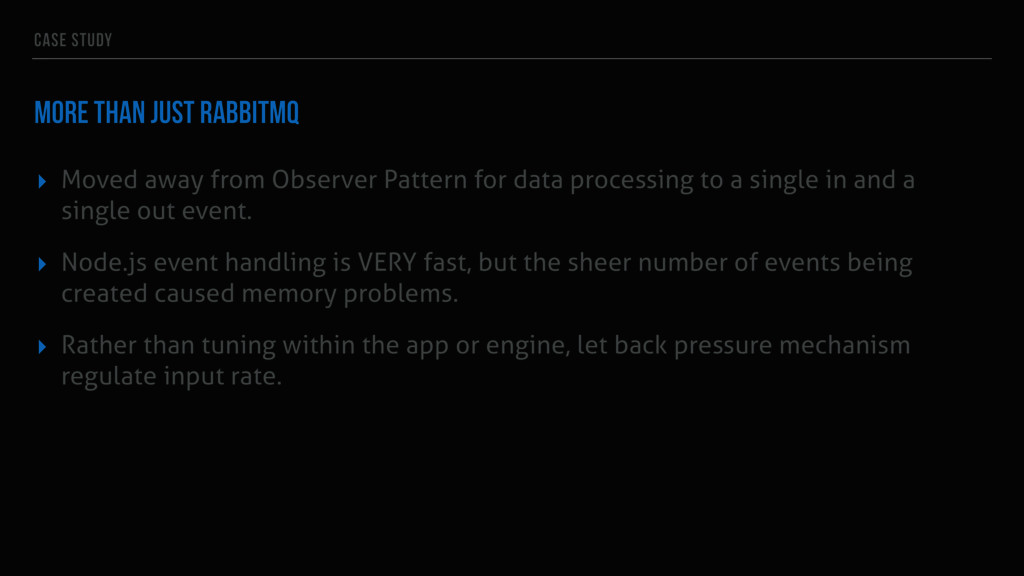
Observer Pattern for data processing to a single in and a single out event. ▸ Node.js event handling is VERY fast, but the sheer number of events being created caused memory problems. ▸ Rather than tuning within the app or engine, let back pressure mechanism regulate input rate.
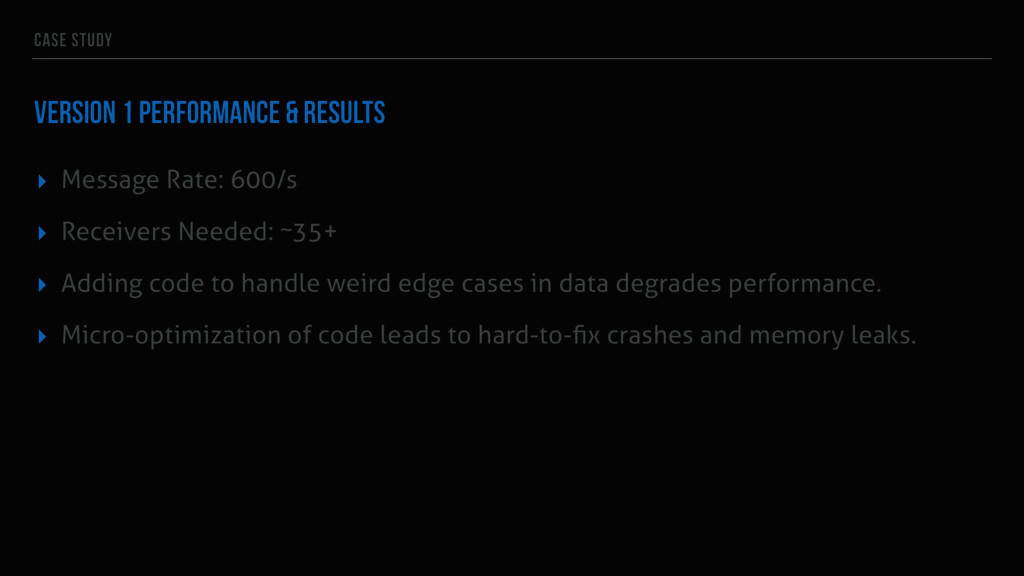
600/s ▸ Receivers Needed: ~35+ ▸ Adding code to handle weird edge cases in data degrades performance. ▸ Micro-optimization of code leads to hard-to-fix crashes and memory leaks.
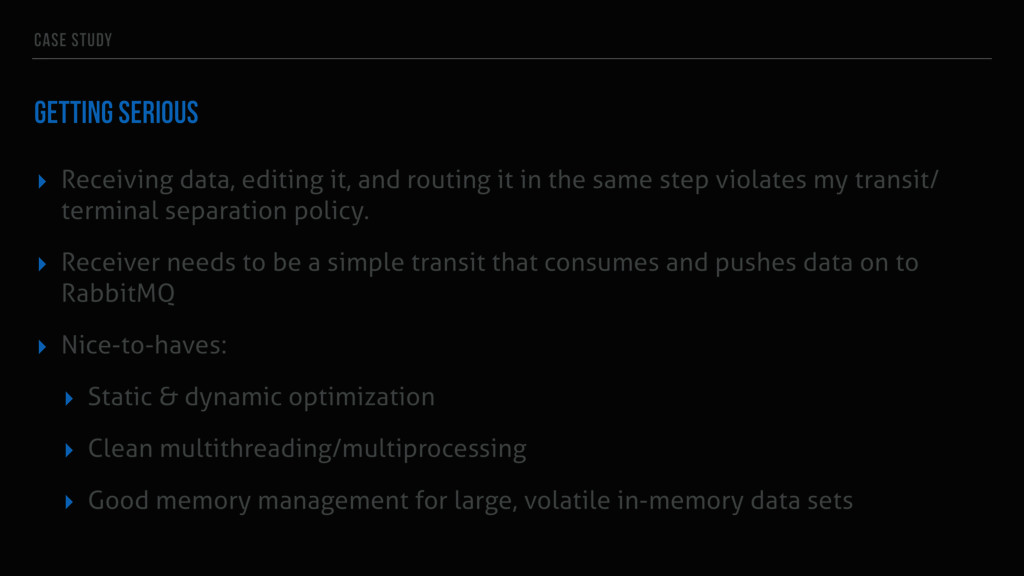
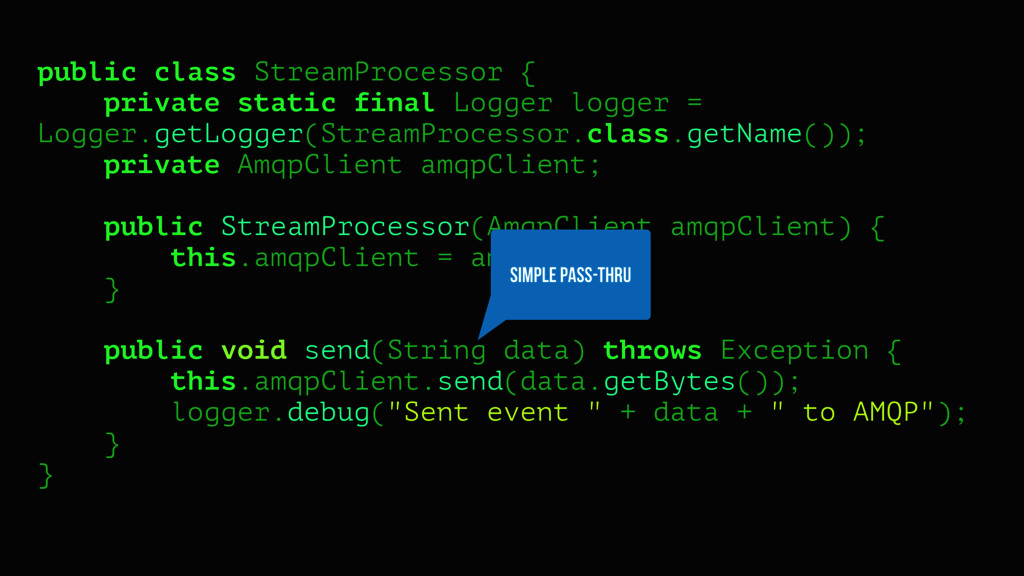
routing it in the same step violates my transit/ terminal separation policy. ▸ Receiver needs to be a simple transit that consumes and pushes data on to RabbitMQ ▸ Nice-to-haves: ▸ Static & dynamic optimization ▸ Clean multithreading/multiprocessing ▸ Good memory management for large, volatile in-memory data sets
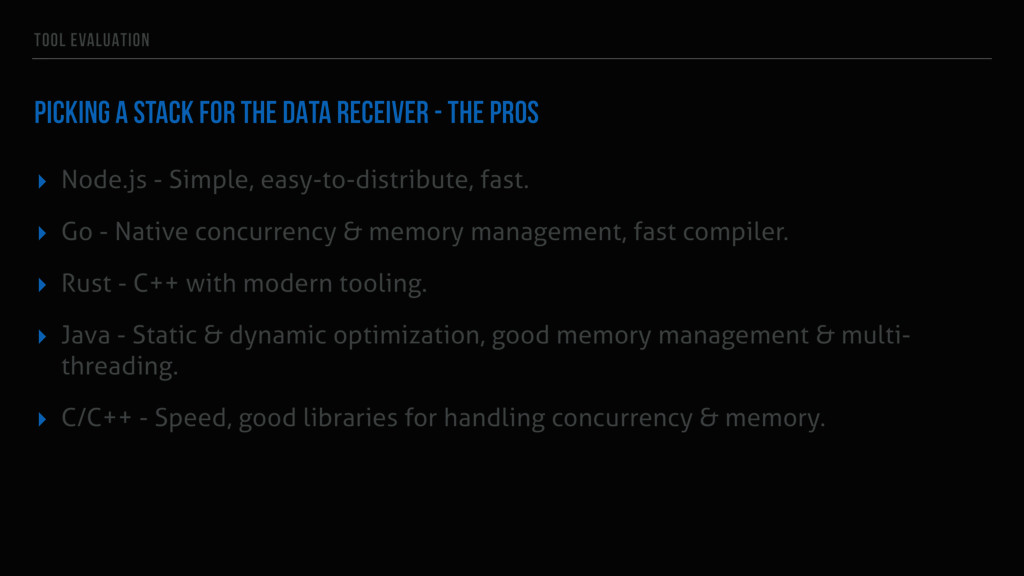
THE CONS ▸ Node.js - Too many instances needed to manage production flow. ▸ Go - No one on my team has any familiarity. ▸ Rust - No one on my team has any desire to have any familiarity. ▸ Java - All the cool kids will pick on me. ▸ C/C++ - I like myself too much.
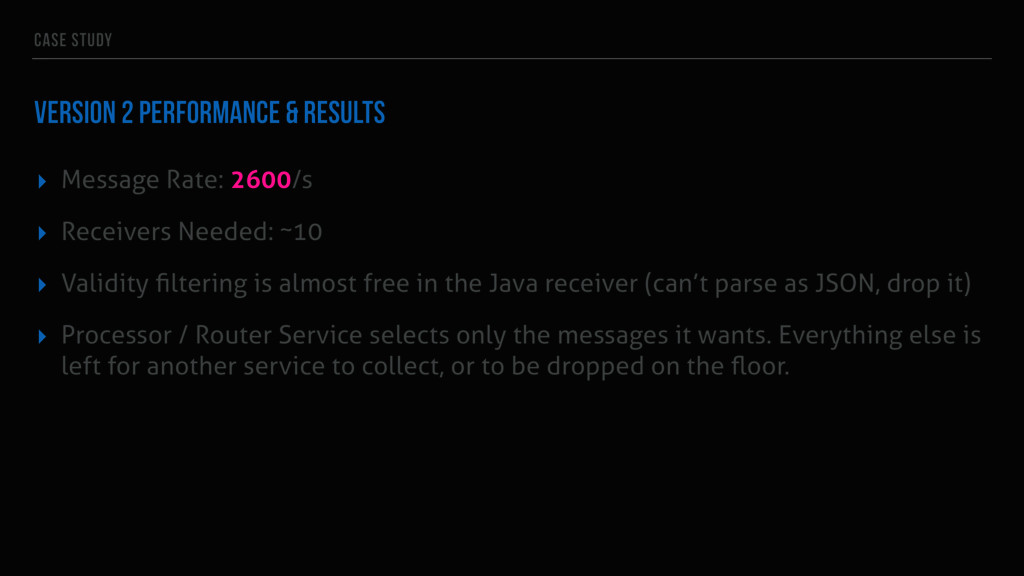
2600/s ▸ Receivers Needed: ~10 ▸ Validity filtering is almost free in the Java receiver (can’t parse as JSON, drop it) ▸ Processor / Router Service selects only the messages it wants. Everything else is left for another service to collect, or to be dropped on the floor.
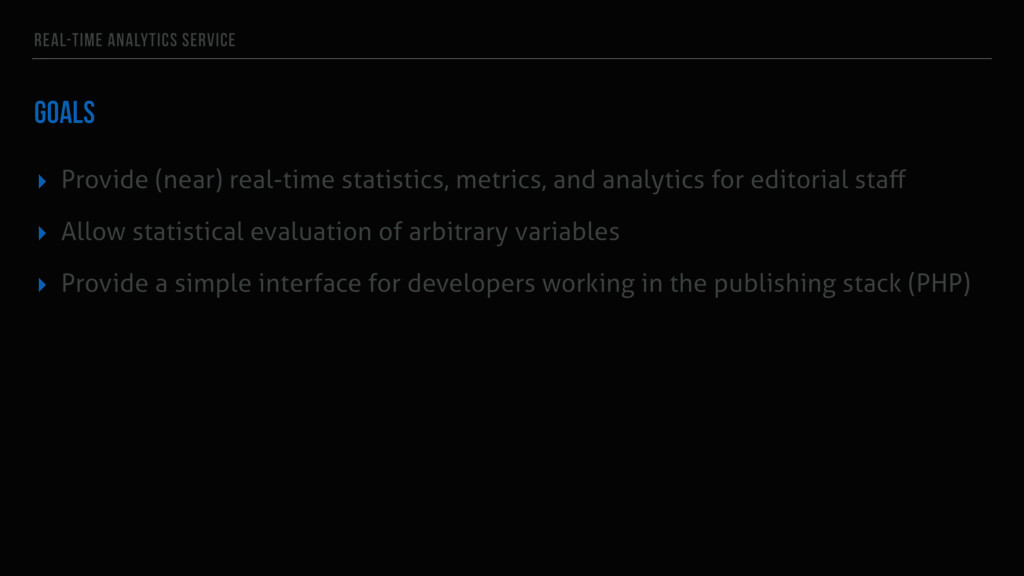
and analytics for editorial staff ▸ Allow statistical evaluation of arbitrary variables ▸ Provide a simple interface for developers working in the publishing stack (PHP)
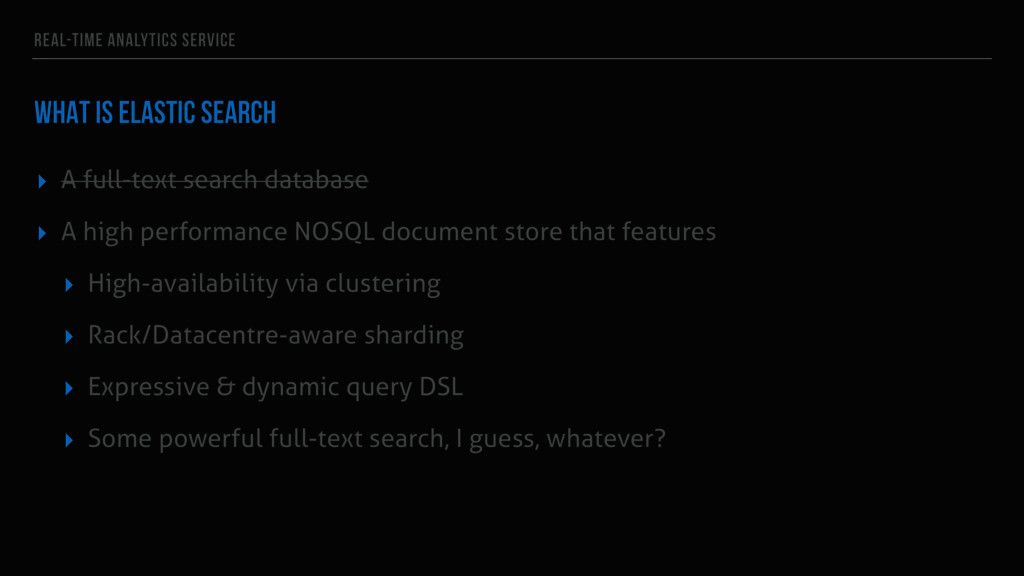
search database ▸ A high performance NOSQL document store that features ▸ High-availability via clustering ▸ Rack/Datacentre-aware sharding ▸ Expressive & dynamic query DSL ▸ Some powerful full-text search, I guess, whatever?
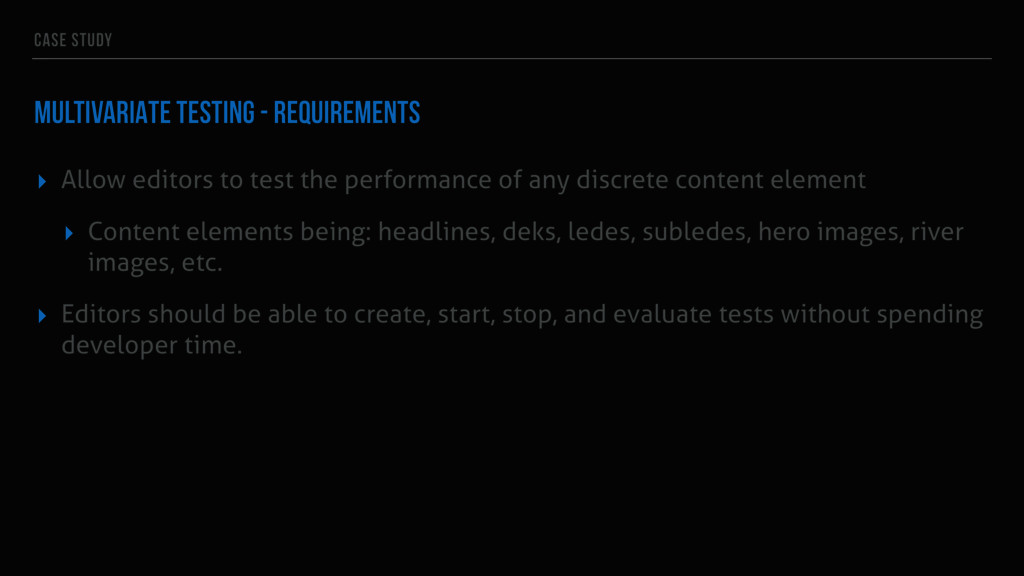
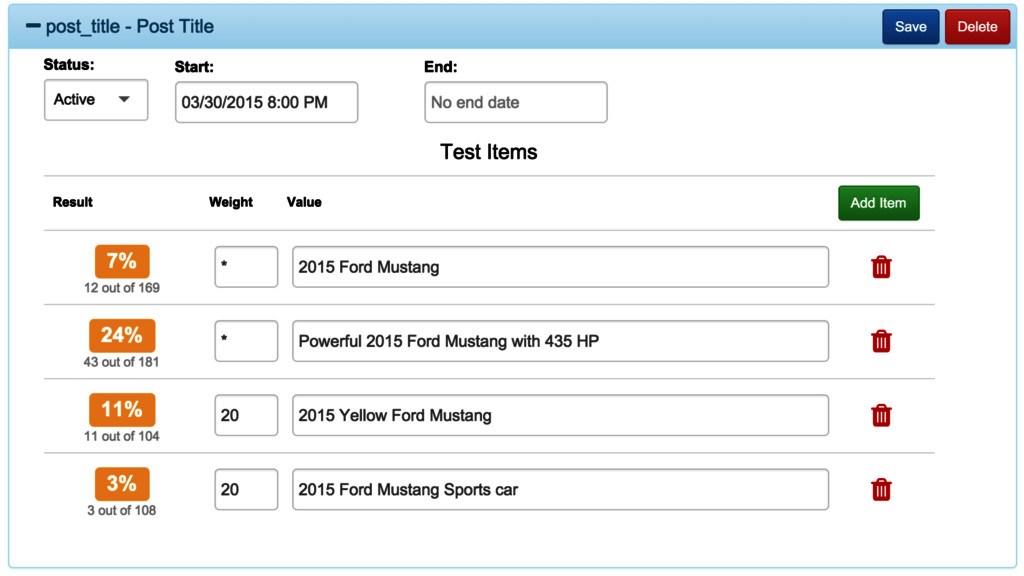
test the performance of any discrete content element ▸ Content elements being: headlines, deks, ledes, subledes, hero images, river images, etc. ▸ Editors should be able to create, start, stop, and evaluate tests without spending developer time.
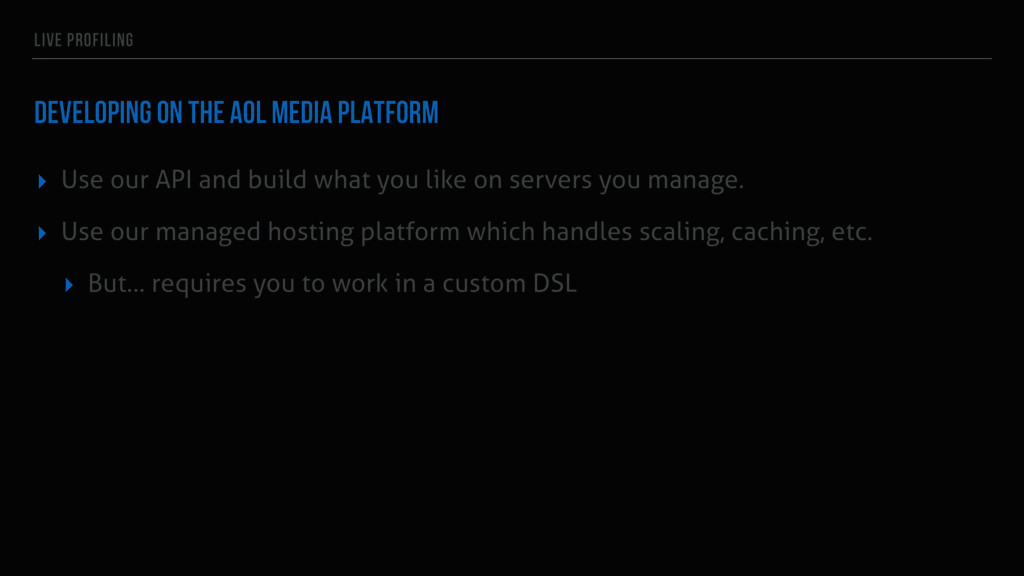
our API and build what you like on servers you manage. ▸ Use our managed hosting platform which handles scaling, caching, etc. ▸ But… requires you to work in a custom DSL
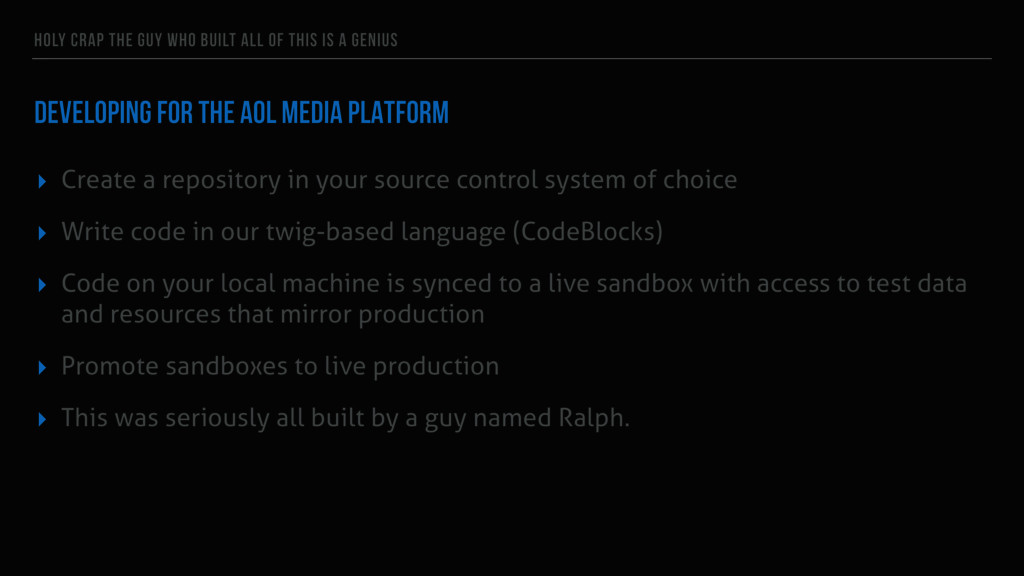
A GENIUS DEVELOPING FOR THE AOL MEDIA PLATFORM ▸ Create a repository in your source control system of choice ▸ Write code in our twig-based language (CodeBlocks) ▸ Code on your local machine is synced to a live sandbox with access to test data and resources that mirror production ▸ Promote sandboxes to live production ▸ This was seriously all built by a guy named Ralph.
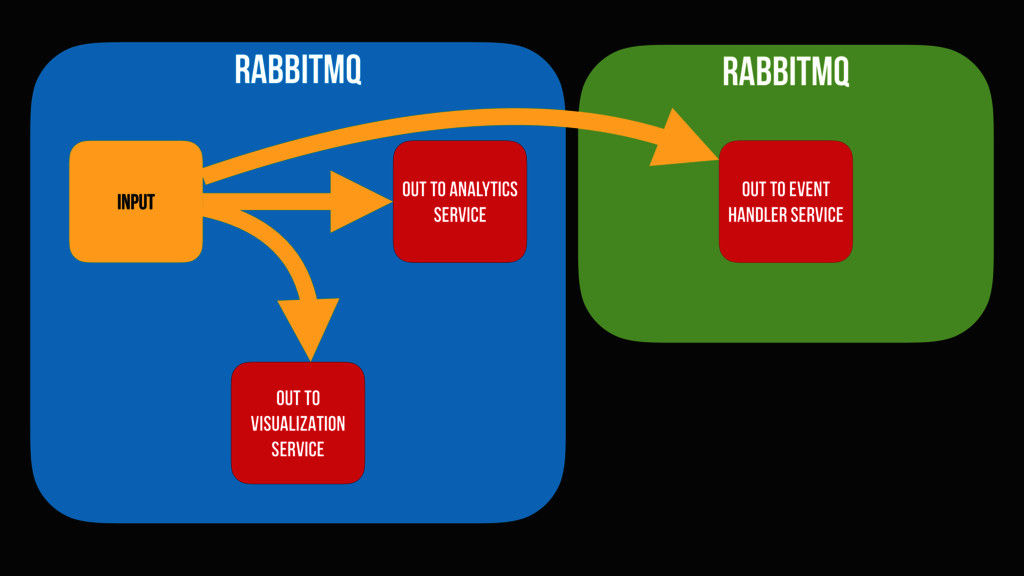
QUERY PARAM RENDER SERVER ACTIVATES PROFILING EVENT MESSAGES ARE TAGGED WITH SESSION ID RABBITMQ ROUTES TAGGED MESSAGES TO PROFILER SERVICE DEV’S PROFILER CONSOLE CONNECTS TO PROFILER SERVICE PROFILER SERVICE WAITS FOR MESSAGES MESSAGES ARE RECEIVED AND RENDERED IN THE CONSOLE
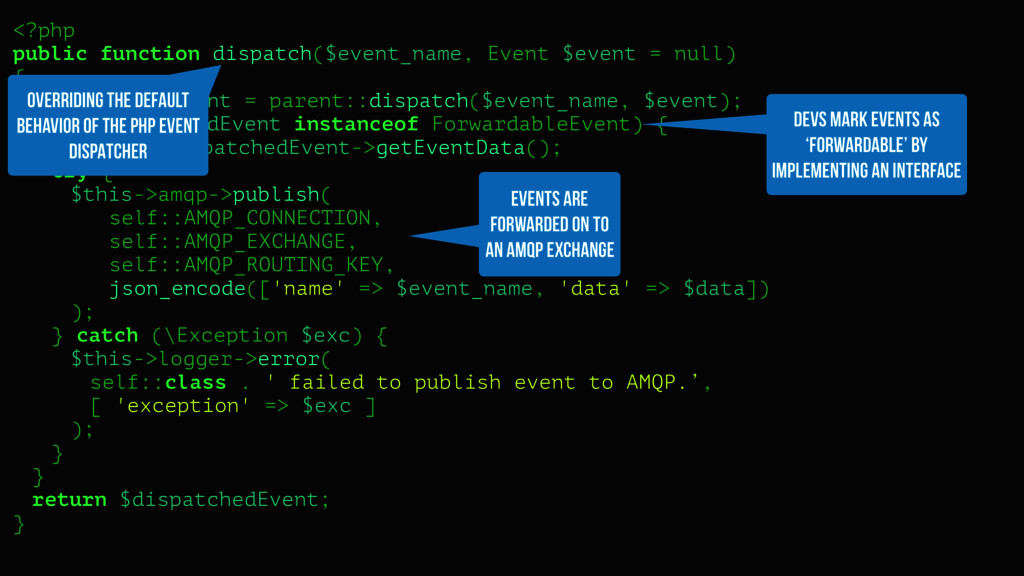
THERE ▸ Allow devs to dispatch “native” events in one stack and observe them in another ▸ The PHP CMS uses the Symfony EventDispatcher to trigger an event in Node.js ▸ Distributed event handling without PHP workers ▸ Event-driven search indexing (no rivers or crons)
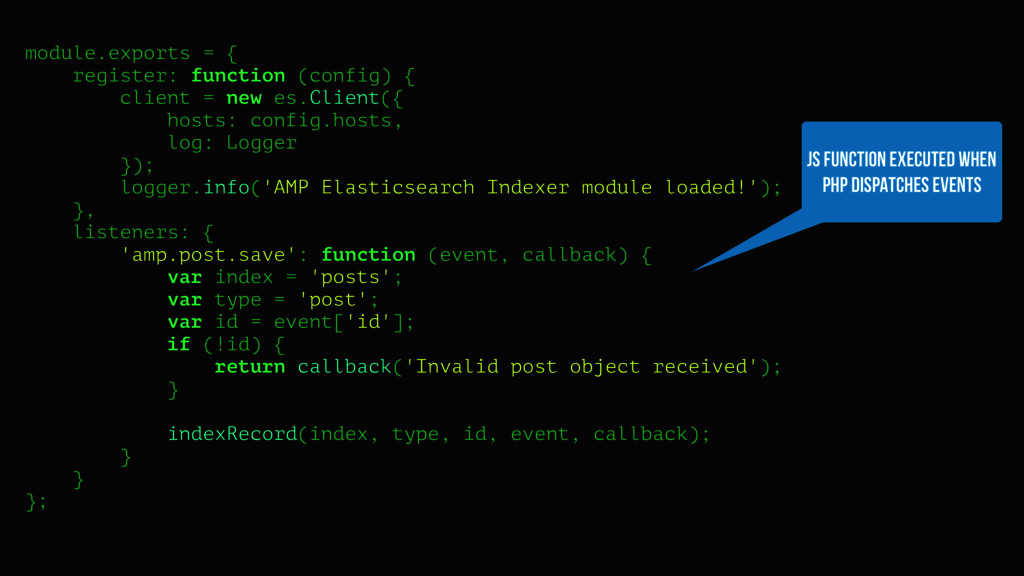
es.Client({ hosts: config.hosts, log: Logger }); logger.info('AMP Elasticsearch Indexer module loaded!'); }, listeners: { 'amp.post.save': function (event, callback) { var index = 'posts'; var type = 'post'; var id = event['id']; if (!id) { return callback('Invalid post object received'); } indexRecord(index, type, id, event, callback); } } }; JS FUNCTION EXECUTED WHEN PHP DISPATCHES EVENTS
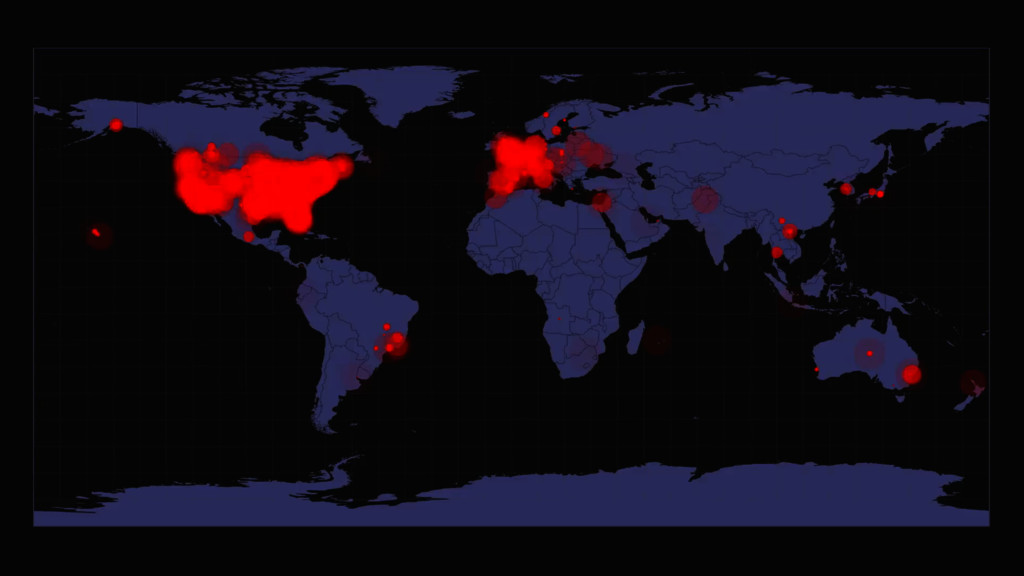
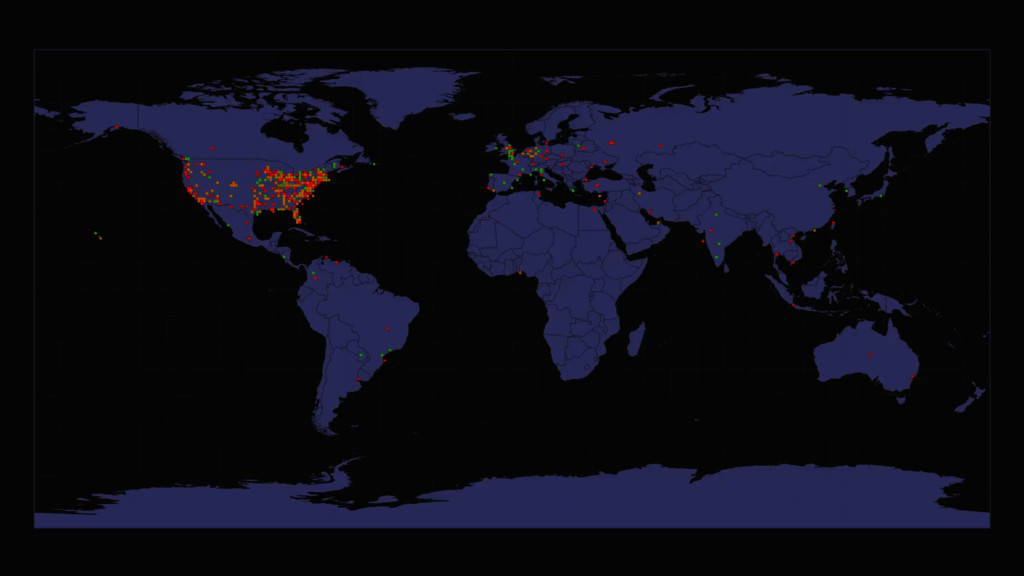
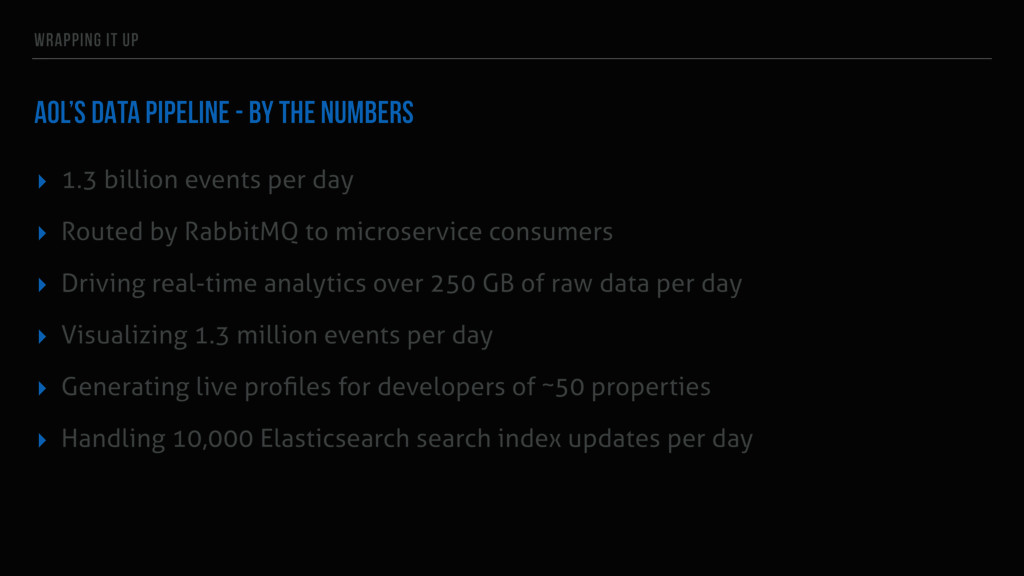
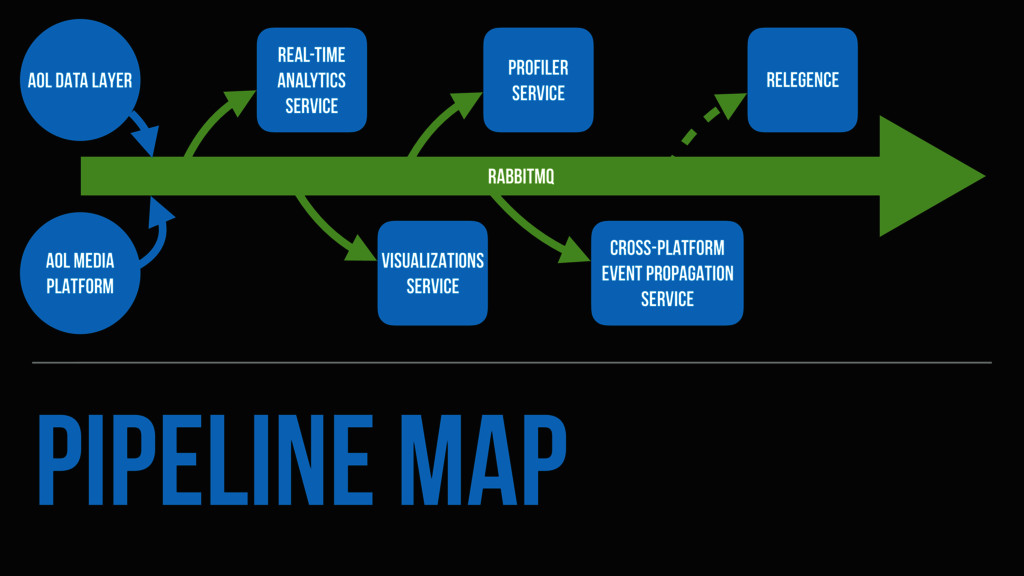
▸ 1.3 billion events per day ▸ Routed by RabbitMQ to microservice consumers ▸ Driving real-time analytics over 250 GB of raw data per day ▸ Visualizing 1.3 million events per day ▸ Generating live profiles for developers of ~50 properties ▸ Handling 10,000 Elasticsearch search index updates per day
![var elasticsearch = require('elasticsearch'); var client = new elasticsearch.Client({hosts: ['http://localhost:9200']});](https://files.speakerdeck.com/presentations/fb39cc6608a94a689d5b9aaef8958970/slide_71.jpg)
![<?php $params = []; $params['type'] = 'stat'; $params['index'] = isset($args->search_index)](https://files.speakerdeck.com/presentations/fb39cc6608a94a689d5b9aaef8958970/slide_72.jpg)
![function plot(point) { var points = svg.selectAll("circle") .data([point], function(d) {](https://files.speakerdeck.com/presentations/fb39cc6608a94a689d5b9aaef8958970/slide_83.jpg)