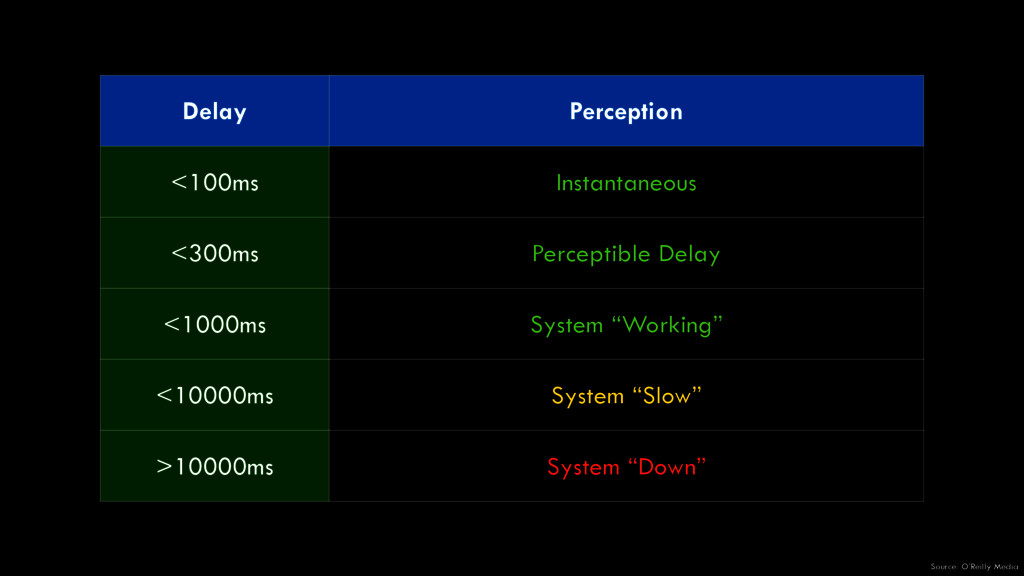
latency Sales (USD) 0 500 1000 1500 2000 Seconds of Latency 0 1 2 3 5 6 7 8 9 10 11 12 13 14 15 S = S - (msL*1%) Linden, G. (2006, December 3). Make Data Useful. Data Mining (CS345). Lecture conducted from Stanford University, Stanford, CA.
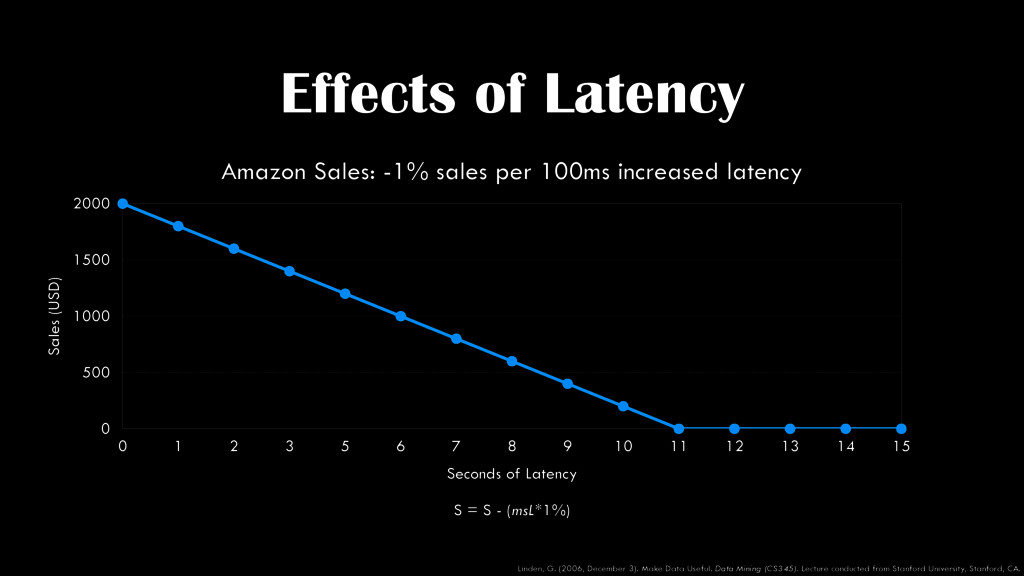
Searches per Day -1 -0.75 -0.5 -0.25 0 Milliseconds of Additional Latency 50 100 200 400 Schurman, E., Brutlag, J. (2009, June 23). The User and Business Impact of Server Delays, Additional Bytes, and HTTP Chunking in Web Search. O'Reilly Velocity. Lecture conducted from O'Reilly Media, San Jose, CA.
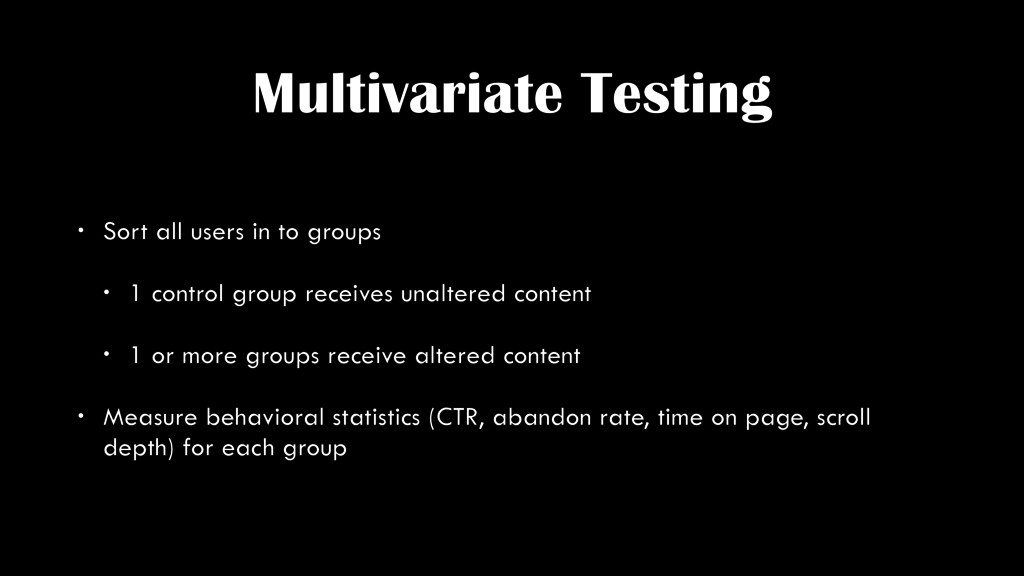
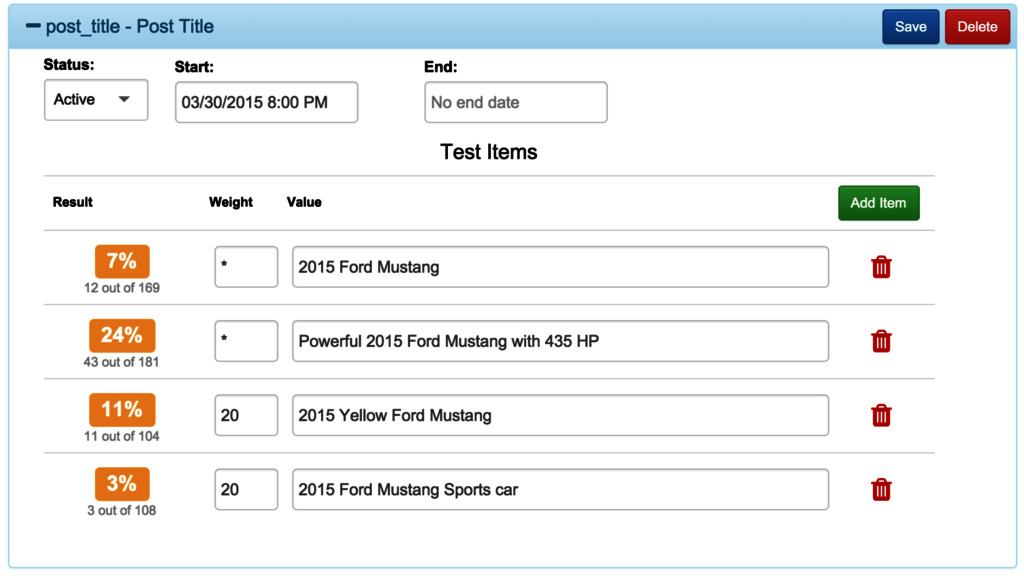
1 control group receives unaltered content • 1 or more groups receive altered content • Measure behavioral statistics (CTR, abandon rate, time on page, scroll depth) for each group
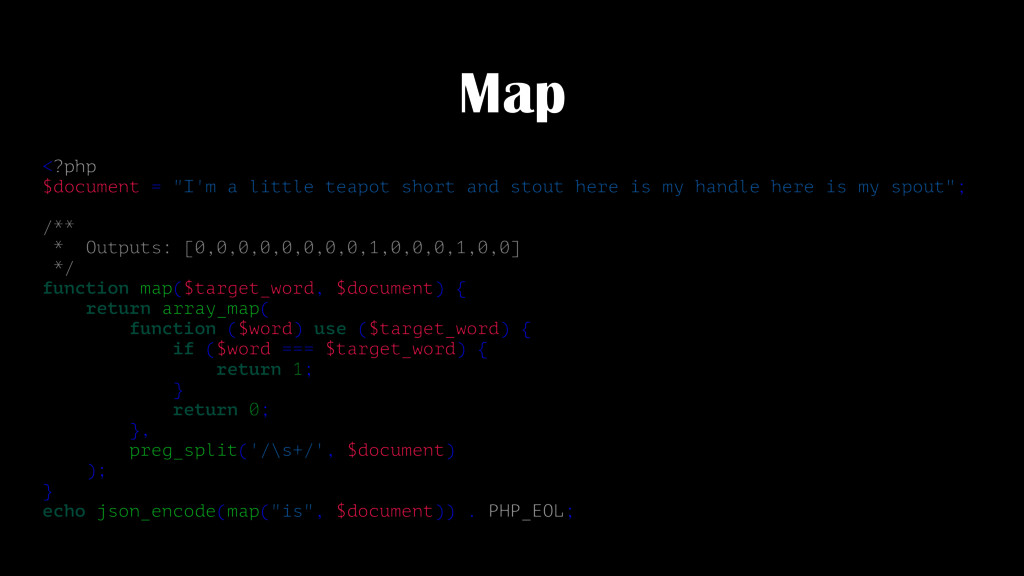
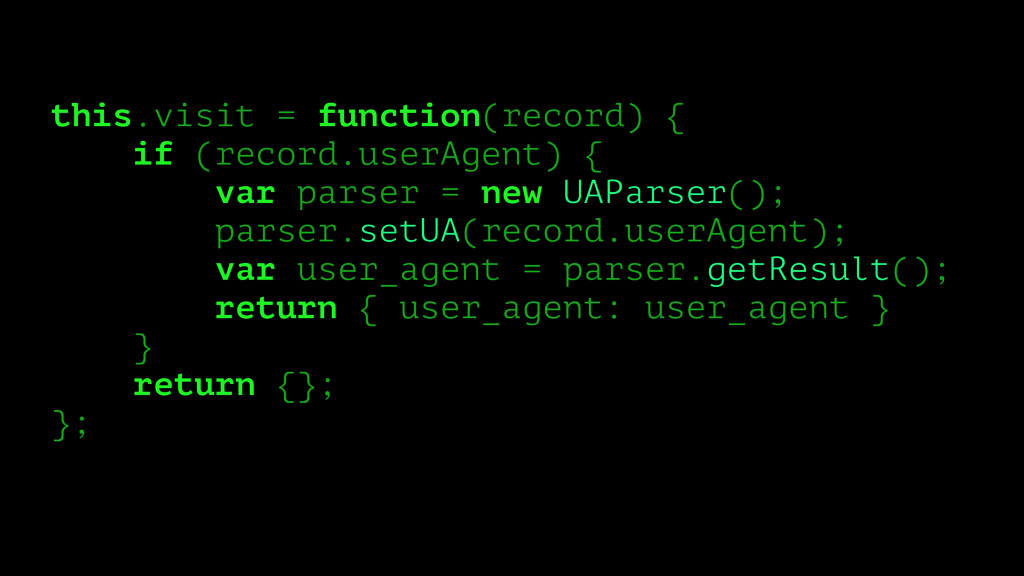
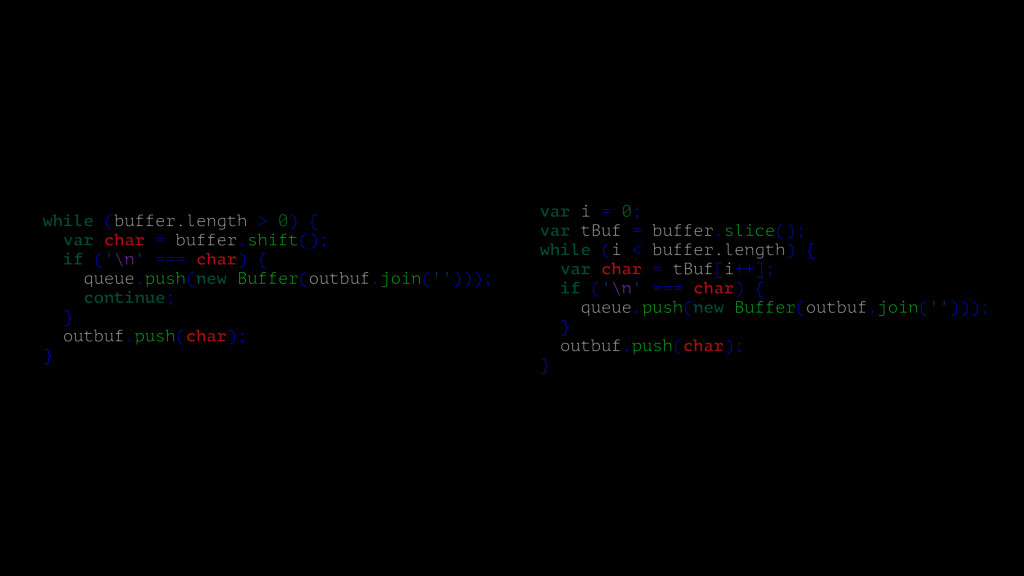
stout here is my handle here is my spout"; /** * Outputs: [0,0,0,0,0,0,0,0,1,0,0,0,1,0,0] */ function map($target_word, $document) { return array_map( function ($word) use ($target_word) { if ($word === $target_word) { return 1; } return 0; }, preg_split('/\s+/', $document) ); } echo json_encode(map("is", $document)) . PHP_EOL;
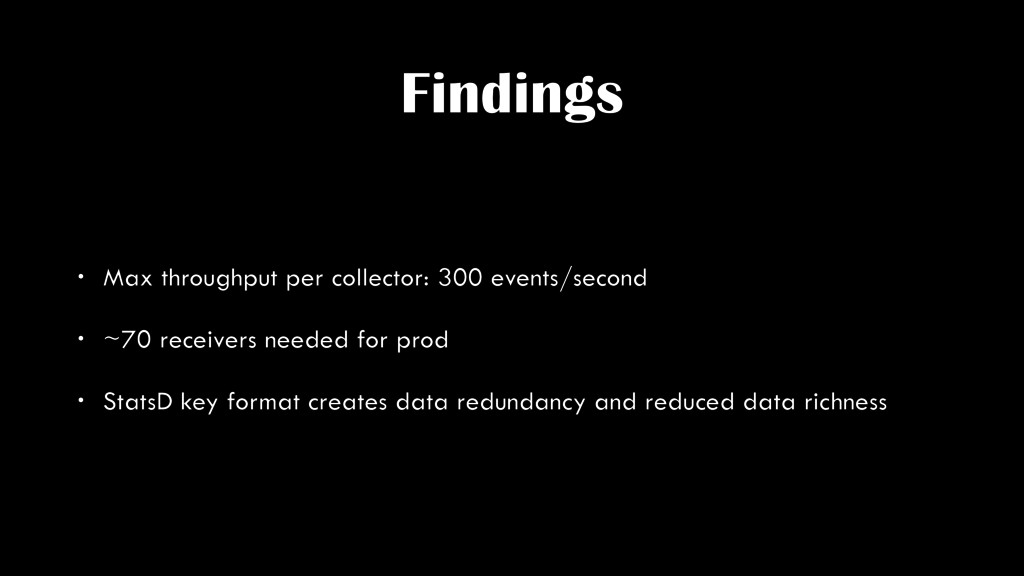
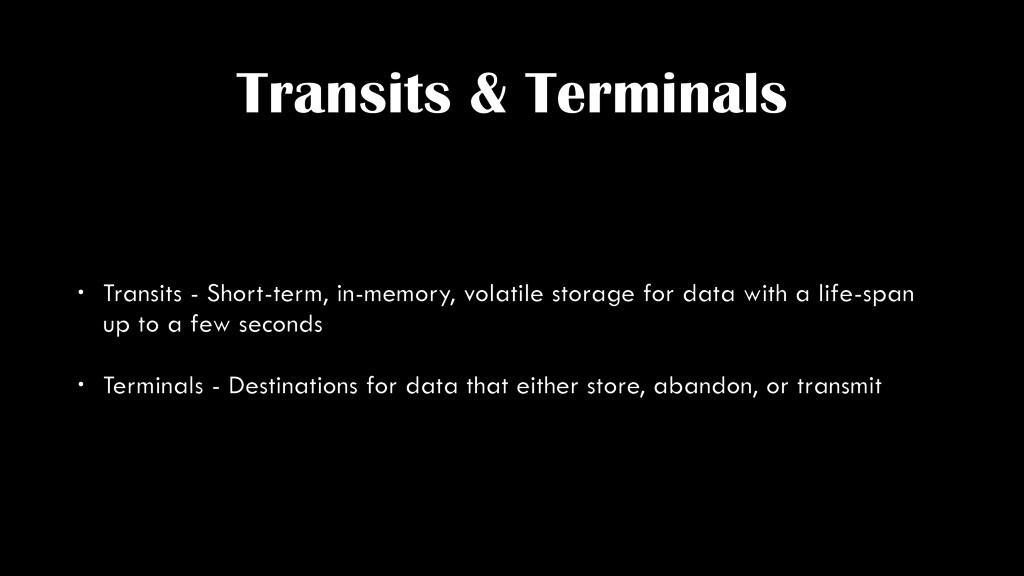
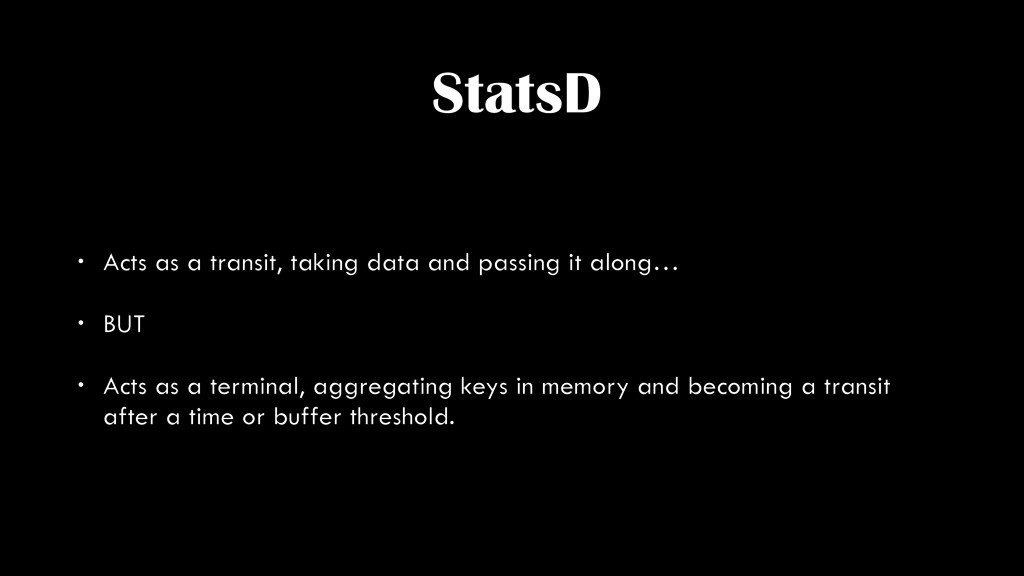
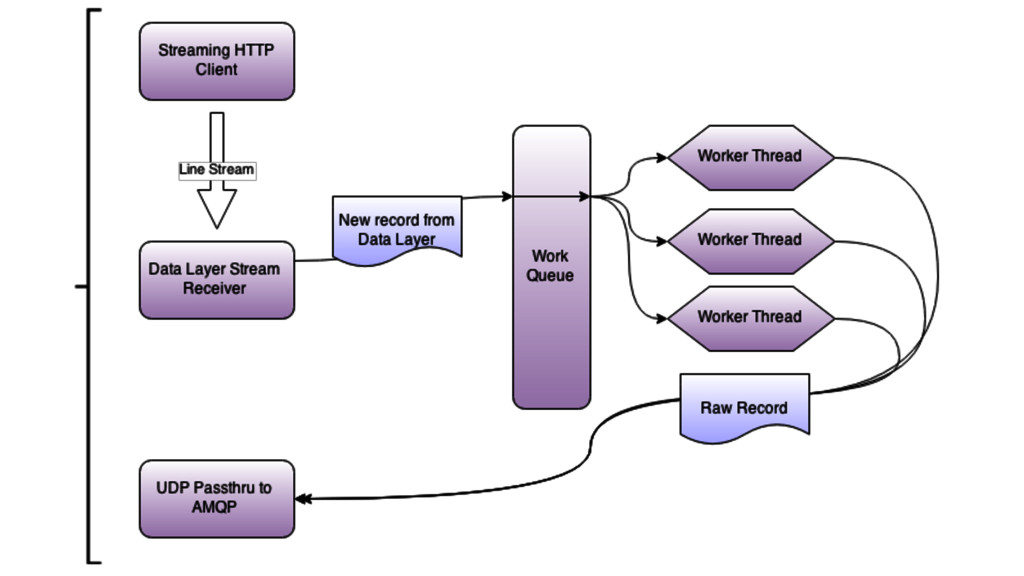
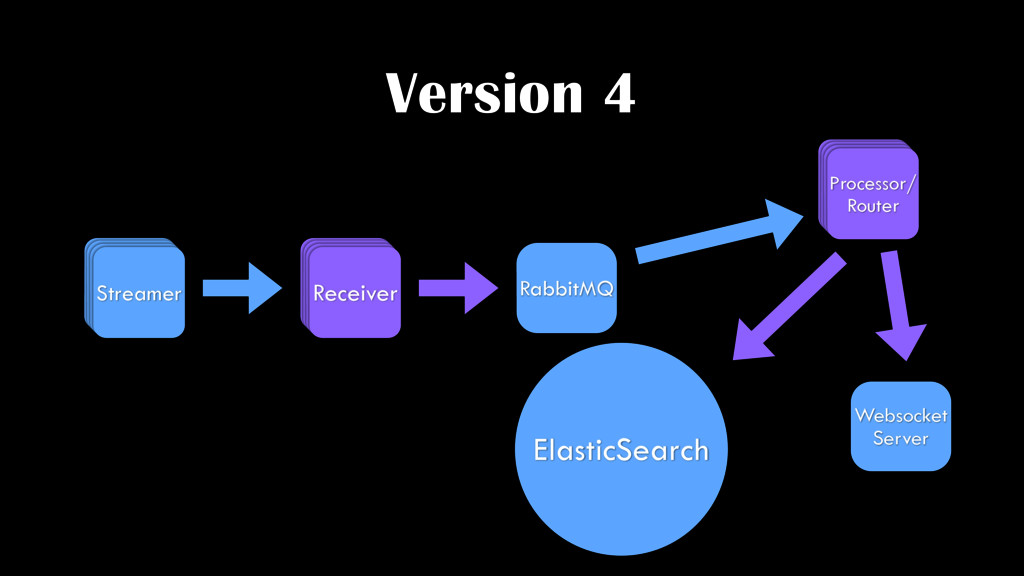
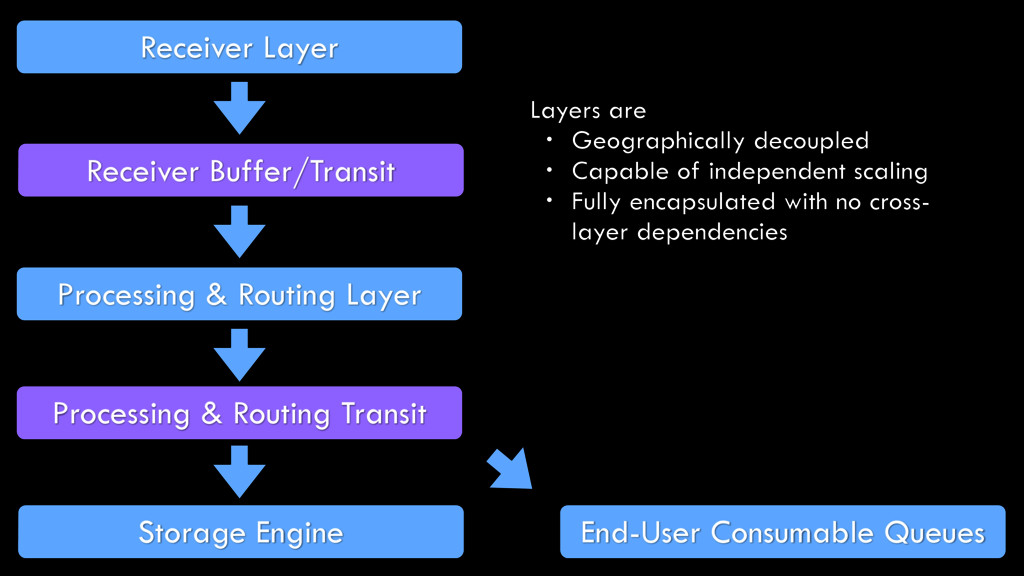
worker pool with large memory buffers • Static & dynamic optimization • Efficient memory management for extremely volatile in-memory data • Eliminate any processing overhead. Receiver must be a Transit
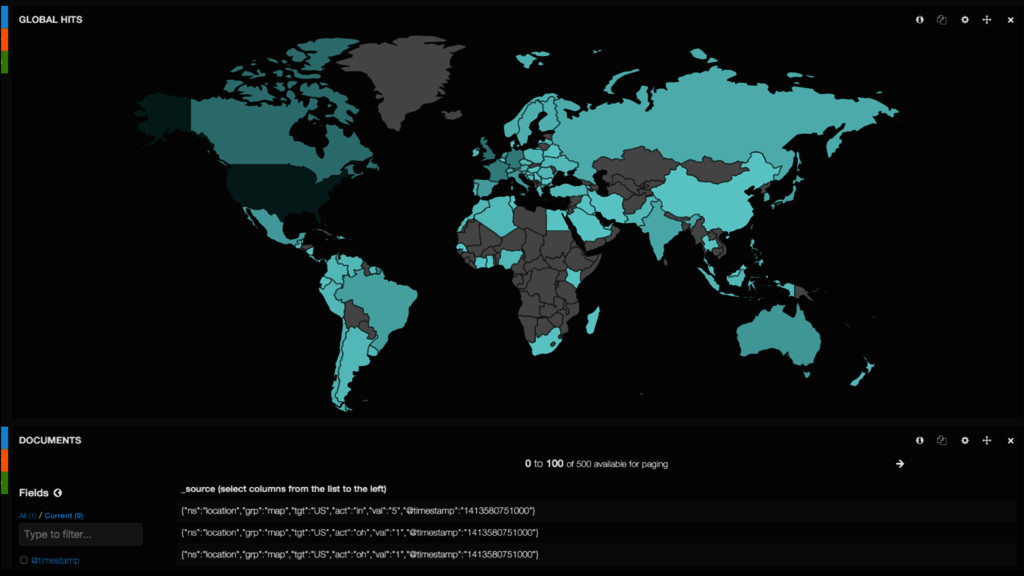
tablet in portrait mode within 10 miles of Denton, TX? • What is the average time from start of page-load to first click for readers on linux desktops between 3am and 5am? • Given two sets of link texts, which has the higher CTR for a randomized sample of readers on tablet devices?
![Reduce <?php $data = [0,0,0,0,0,0,0,0,1,0,0,0,1,0,0]; /** * Outputs: 2 */](https://files.speakerdeck.com/presentations/1a0f02653de848efbf08be237623db3e/slide_33.jpg)
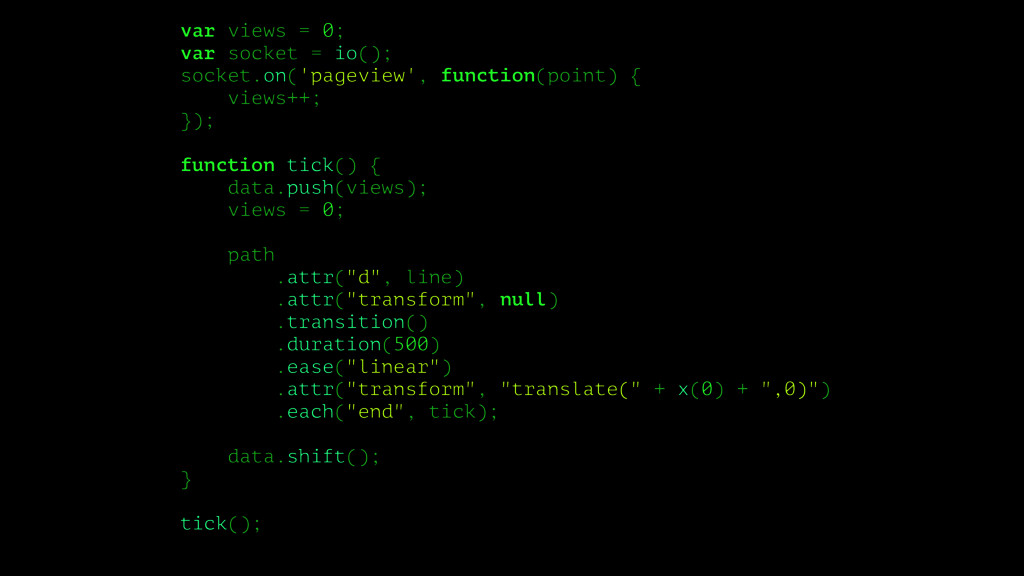
![function plot(point) { var points = svg.selectAll("circle") .data([point], function(d) {](https://files.speakerdeck.com/presentations/1a0f02653de848efbf08be237623db3e/slide_78.jpg)