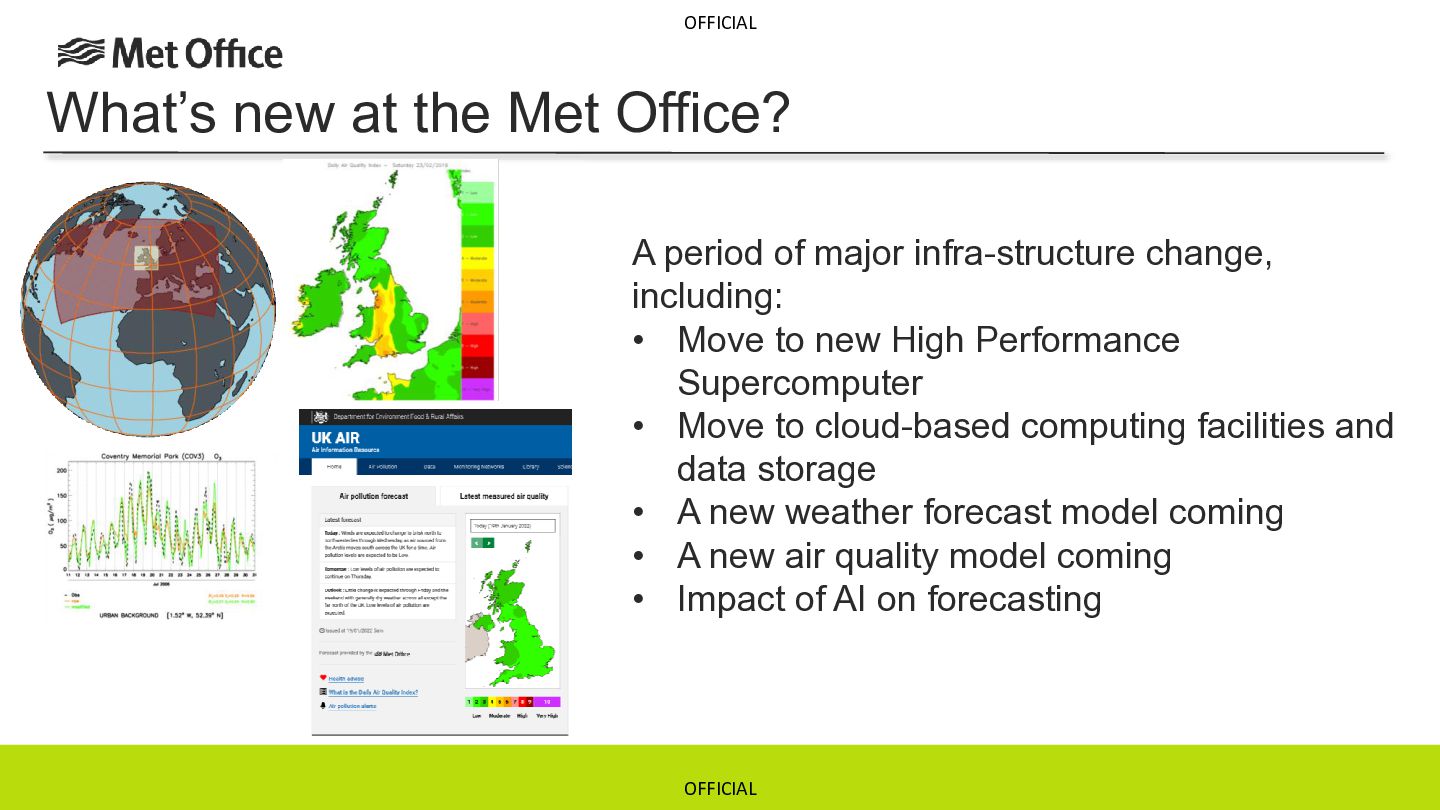
major infra-structure change, including: • Move to new High Performance Supercomputer • Move to cloud-based computing facilities and data storage • A new weather forecast model coming • A new air quality model coming • Impact of AI on forecasting OFFICIAL
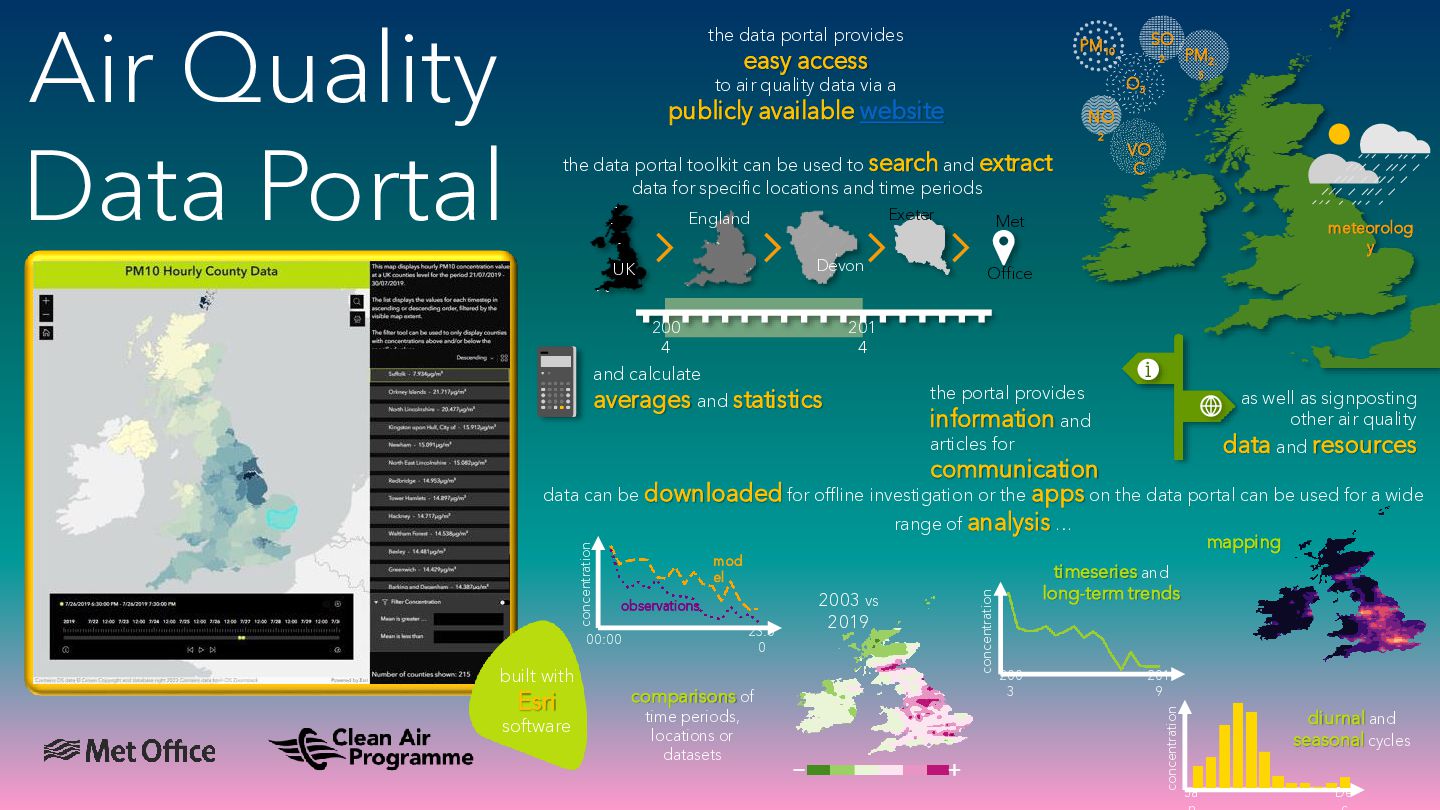
website the data portal toolkit can be used to search and extract data for specific locations and time periods Exeter 5 VO C Met Devon 200 4 PM2. NO 2 UK 2 O3 to air quality data via a England SO PM10 easy access meteorolog y Office 201 4 and calculate averages and statistics the portal provides as well as signposting other air quality information and data and resources communication data can be downloaded for offline investigation or the apps on the data portal can be used for a wide range of analysis … mapping mod el 23:0 0 Esri software comparisons of time periods, locations or datasets − + timeseries and long-term trends 200 3 201 9 concentration observations 00:00 built with 2003 vs 2019 concentration concentration articles for diurnal and seasonal cycles Ja De
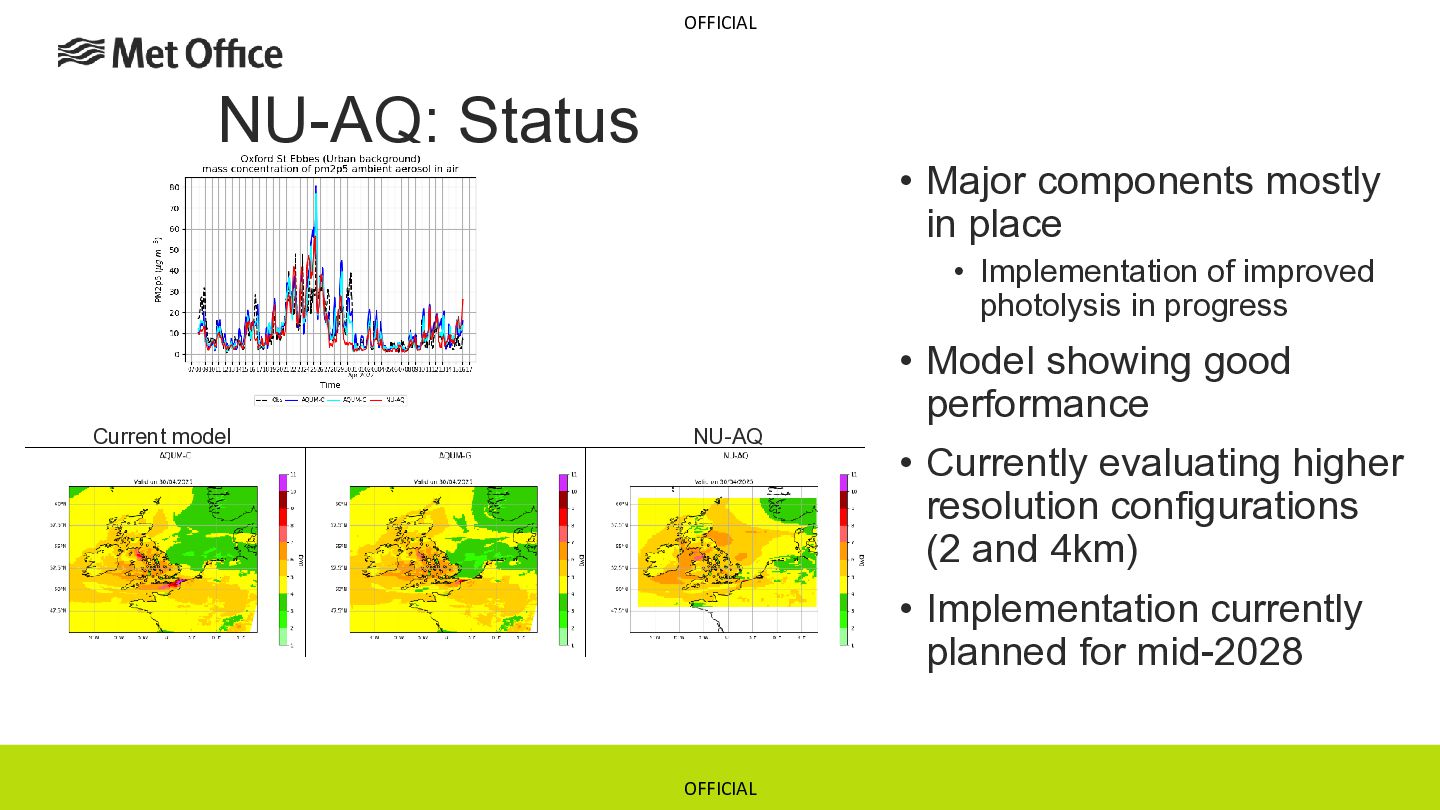
Implementation of improved photolysis in progress Current model NU-AQ OFFICIAL • Model showing good performance • Currently evaluating higher resolution configurations (2 and 4km) • Implementation currently planned for mid-2028
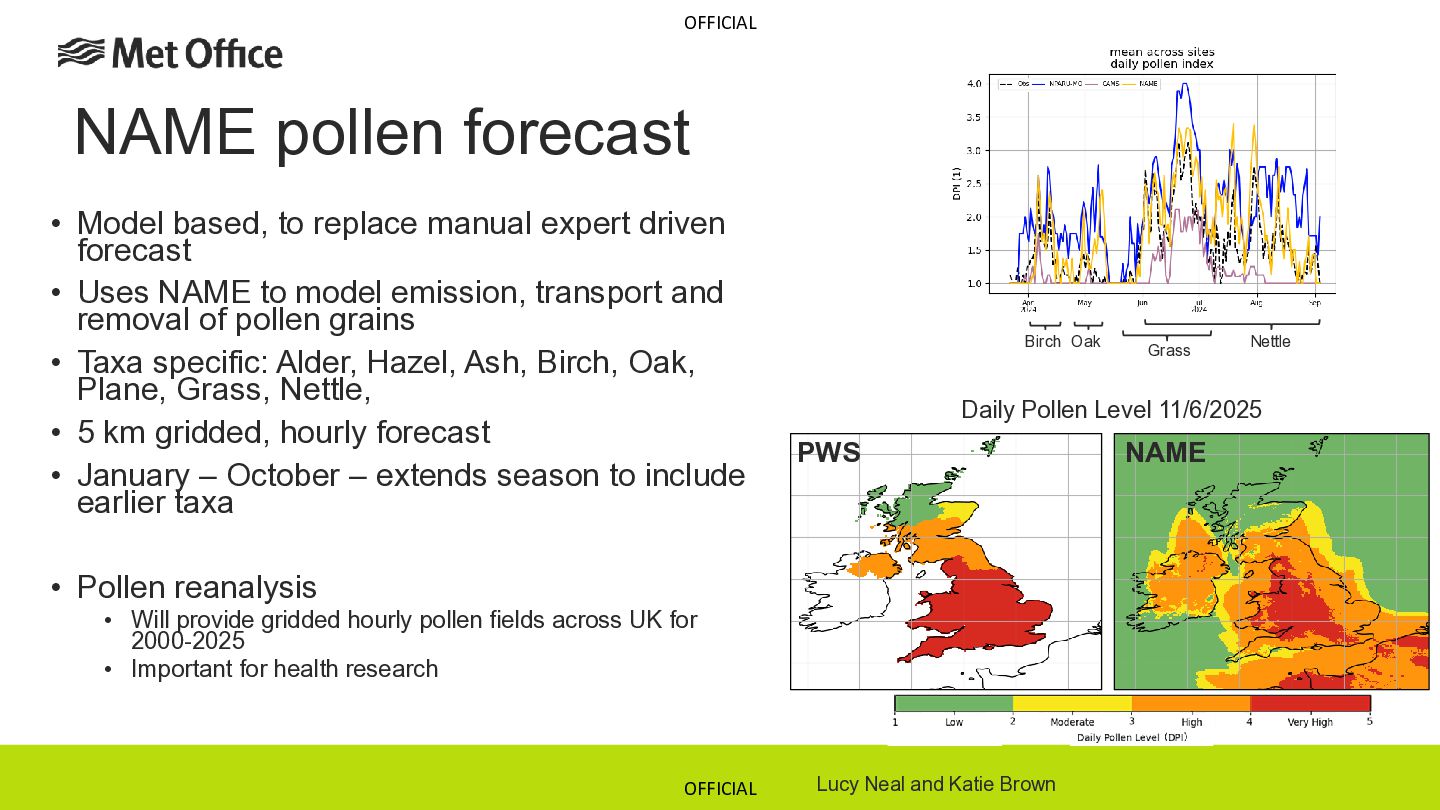
expert driven forecast • Uses NAME to model emission, transport and removal of pollen grains • Taxa specific: Alder, Hazel, Ash, Birch, Oak, Plane, Grass, Nettle, • 5 km gridded, hourly forecast • January – October – extends season to include earlier taxa Birch Oak Nettle Daily Pollen Level 11/6/2025 PWS • Pollen reanalysis • Will provide gridded hourly pollen fields across UK for 2000-2025 • Important for health research OFFICIAL Grass Lucy Neal and Katie Brown NAME
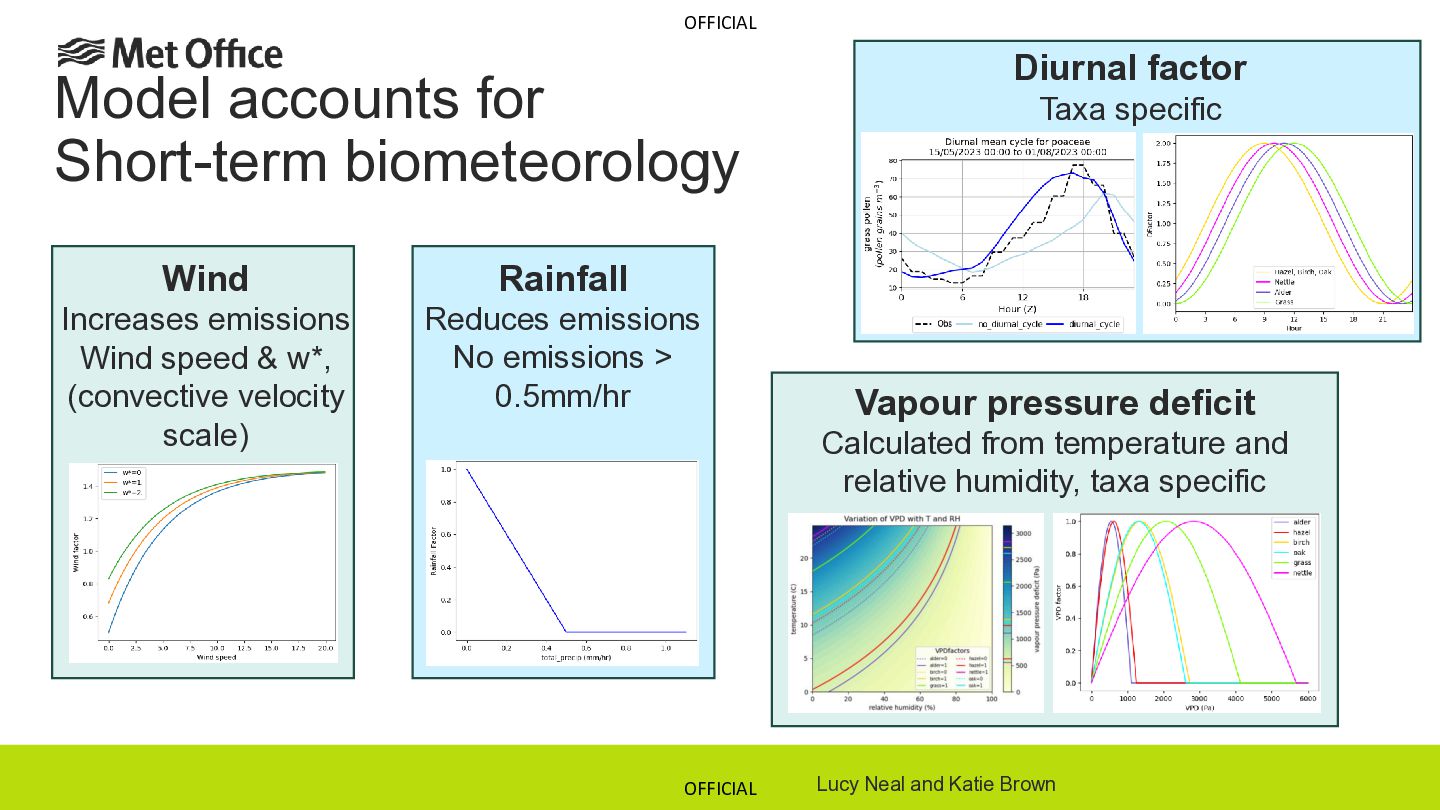
Wind speed & w*, (convective velocity scale) Reduces emissions No emissions > 0.5mm/hr Diurnal factor Taxa specific Vapour pressure deficit Calculated from temperature and relative humidity, taxa specific OFFICIAL Lucy Neal and Katie Brown
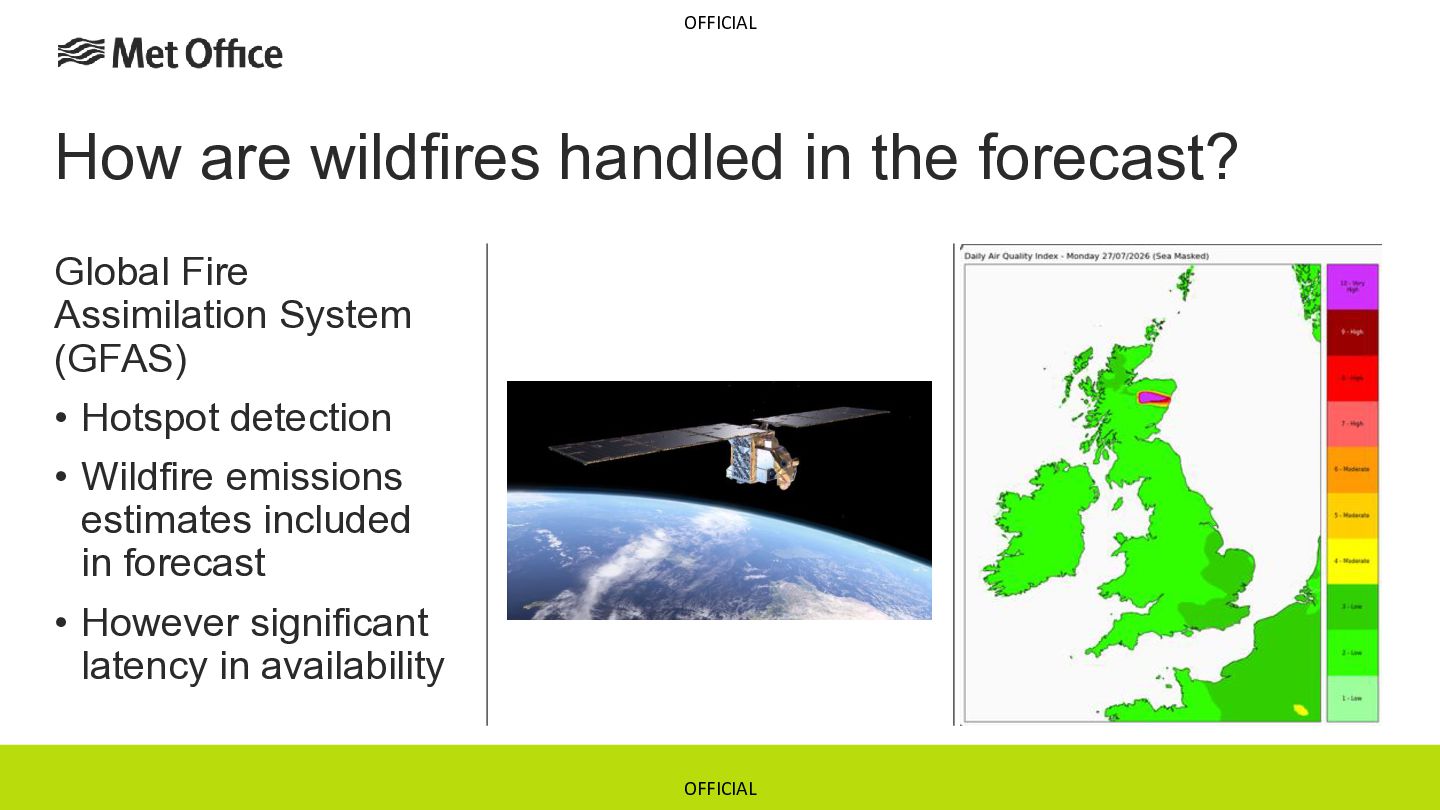
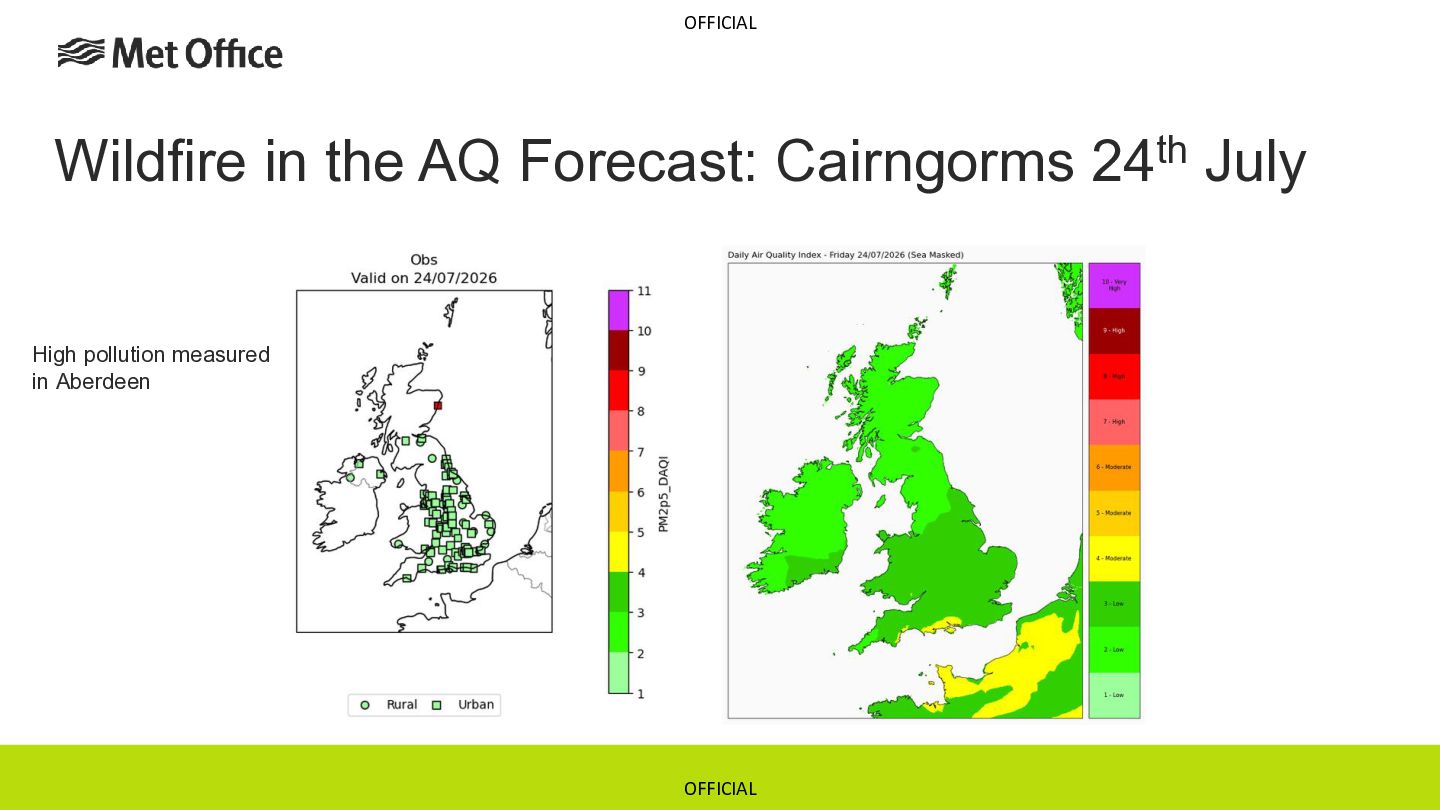
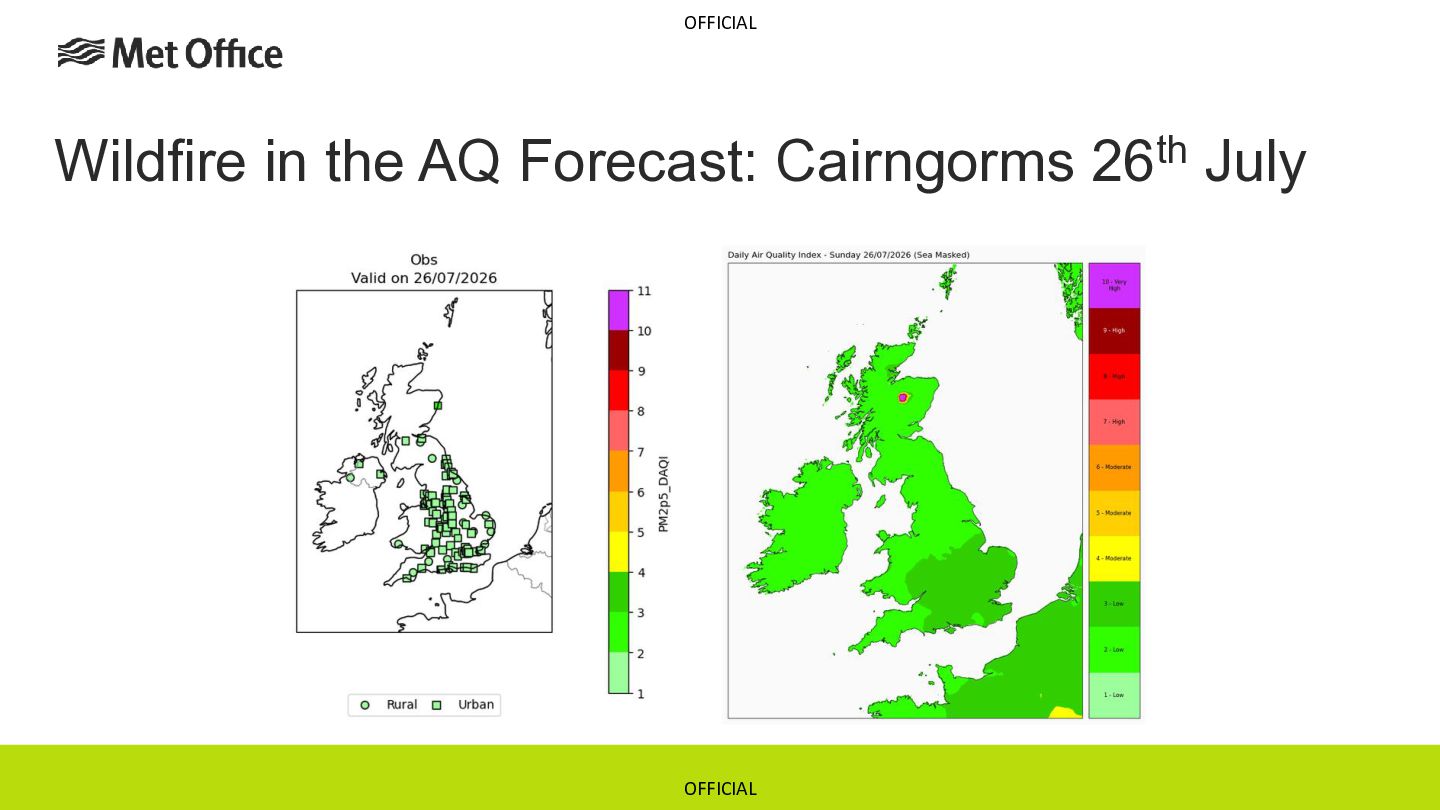
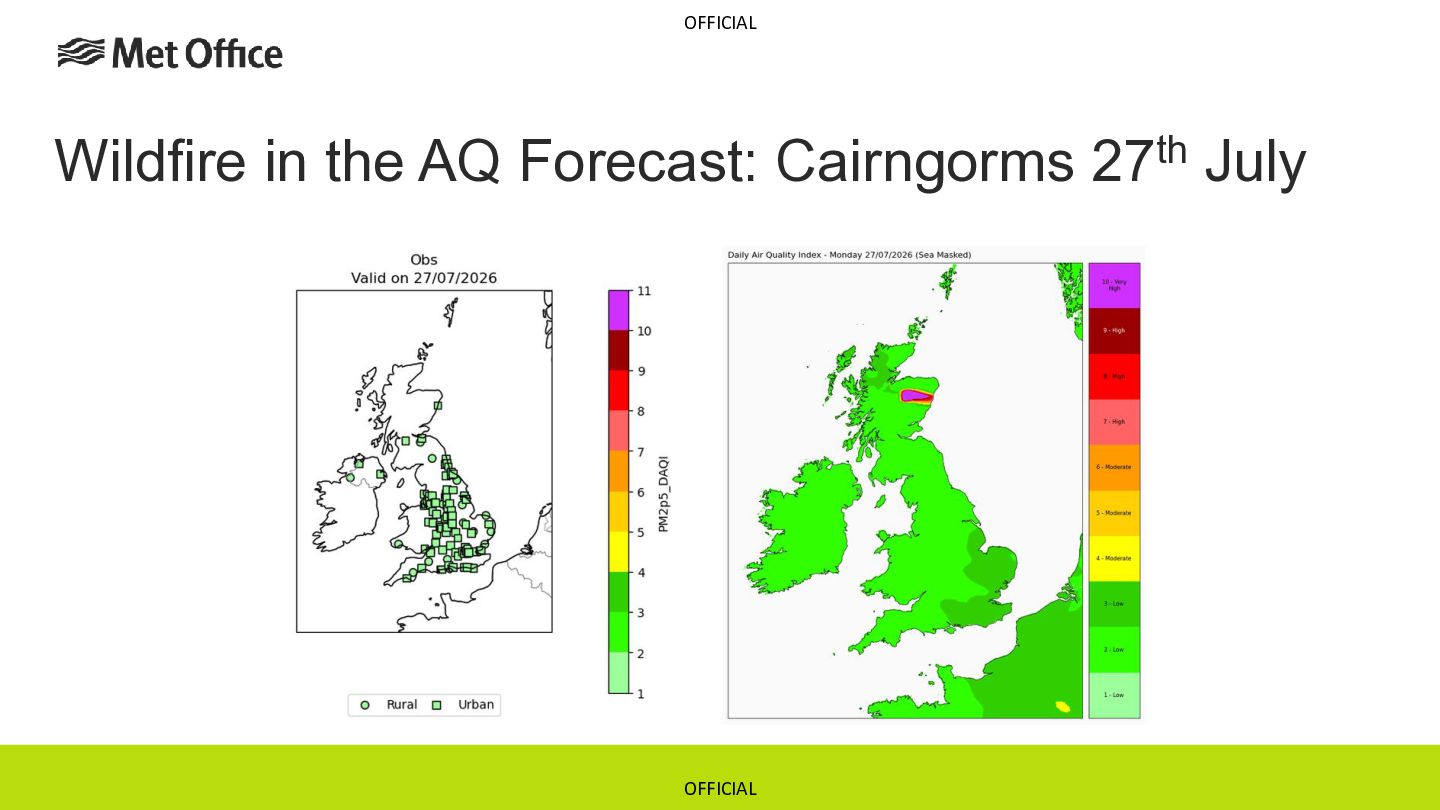
Assimilation System (GFAS) • Hotspot detection • Wildfire emissions estimates included in forecast • However significant latency in availability OFFICIAL
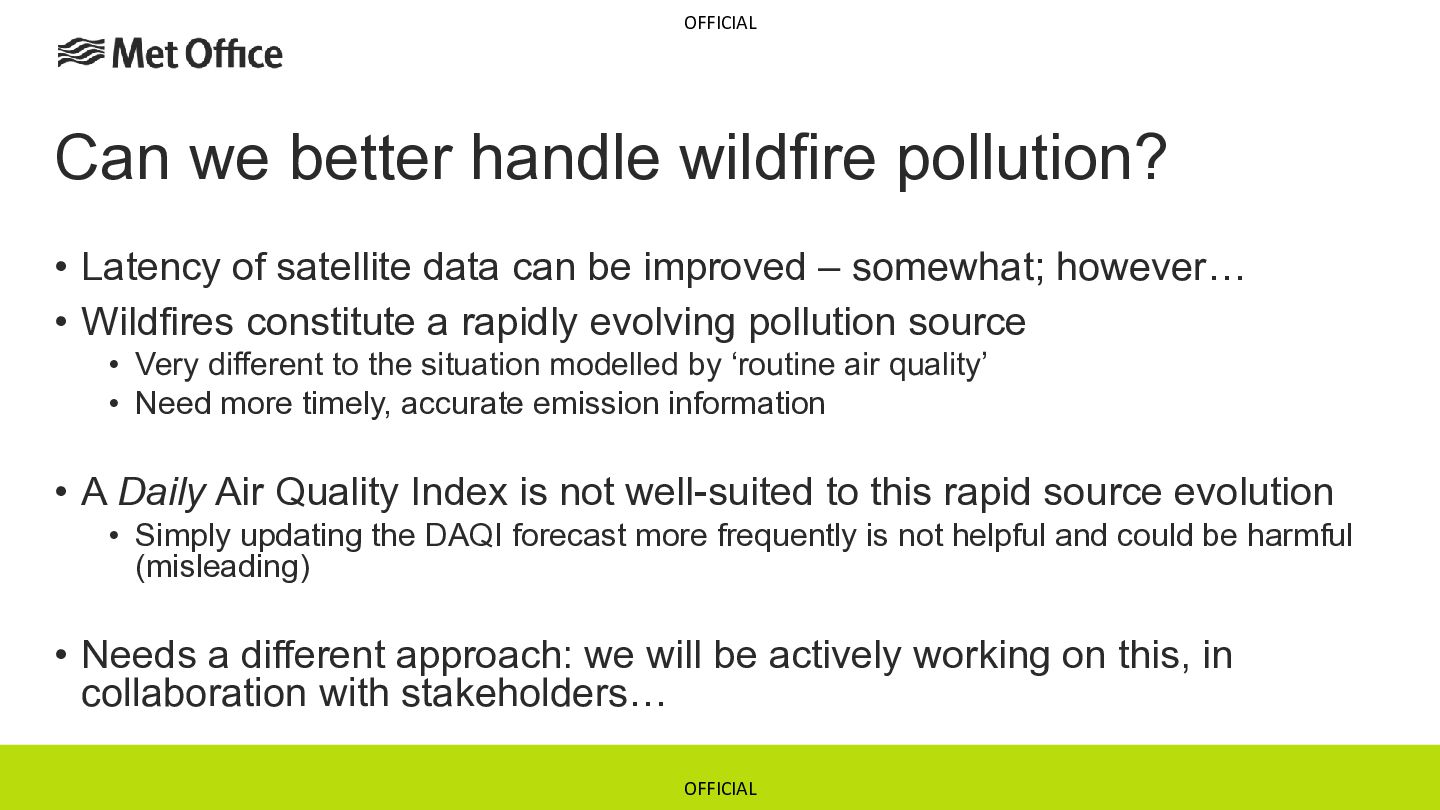
satellite data can be improved – somewhat; however… • Wildfires constitute a rapidly evolving pollution source • Very different to the situation modelled by ‘routine air quality’ • Need more timely, accurate emission information • A Daily Air Quality Index is not well-suited to this rapid source evolution • Simply updating the DAQI forecast more frequently is not helpful and could be harmful (misleading) • Needs a different approach: we will be actively working on this, in collaboration with stakeholders… OFFICIAL
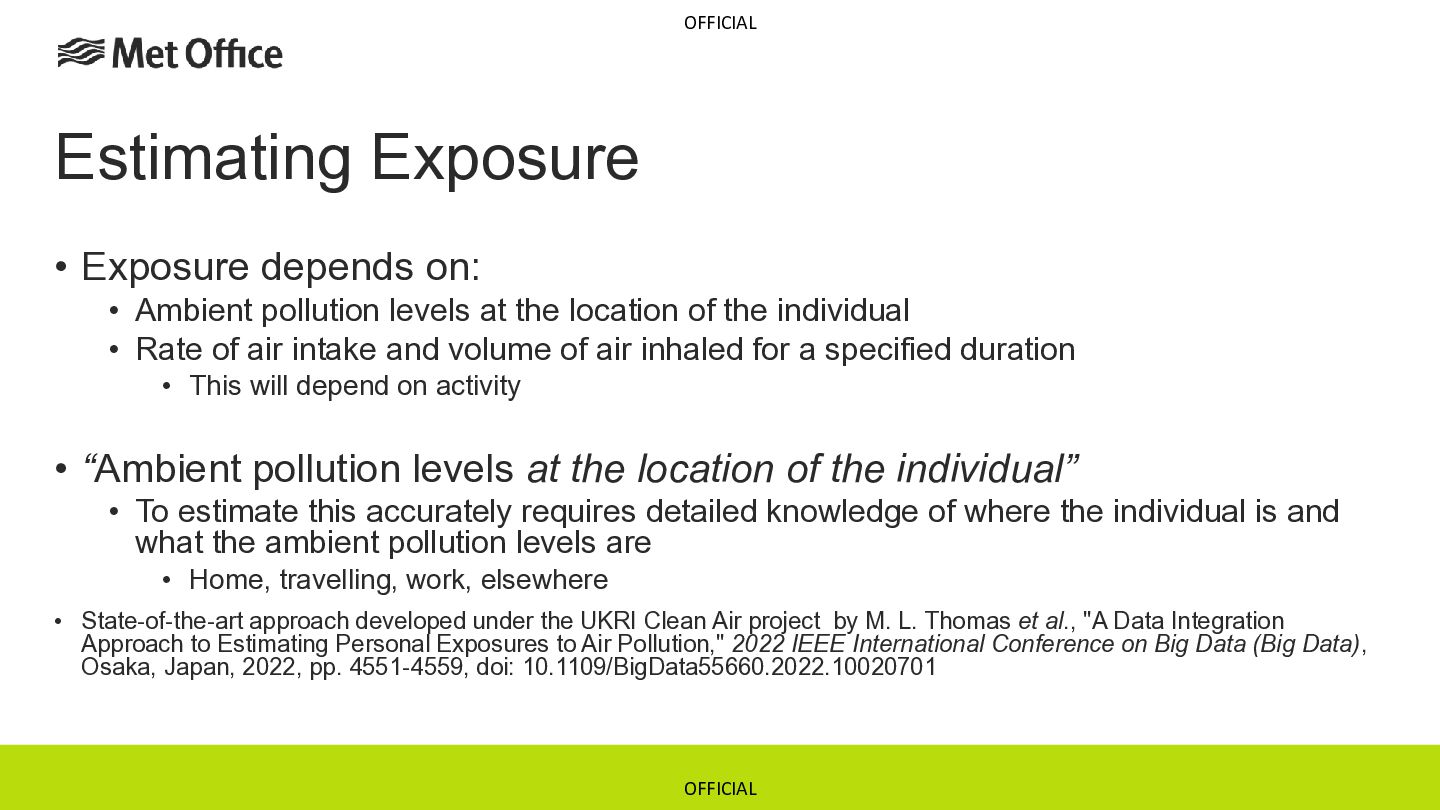
levels at the location of the individual • Rate of air intake and volume of air inhaled for a specified duration • This will depend on activity • “Ambient pollution levels at the location of the individual” • To estimate this accurately requires detailed knowledge of where the individual is and what the ambient pollution levels are • Home, travelling, work, elsewhere • State-of-the-art approach developed under the UKRI Clean Air project by M. L. Thomas et al., "A Data Integration Approach to Estimating Personal Exposures to Air Pollution," 2022 IEEE International Conference on Big Data (Big Data), Osaka, Japan, 2022, pp. 4551-4559, doi: 10.1109/BigData55660.2022.10020701 OFFICIAL
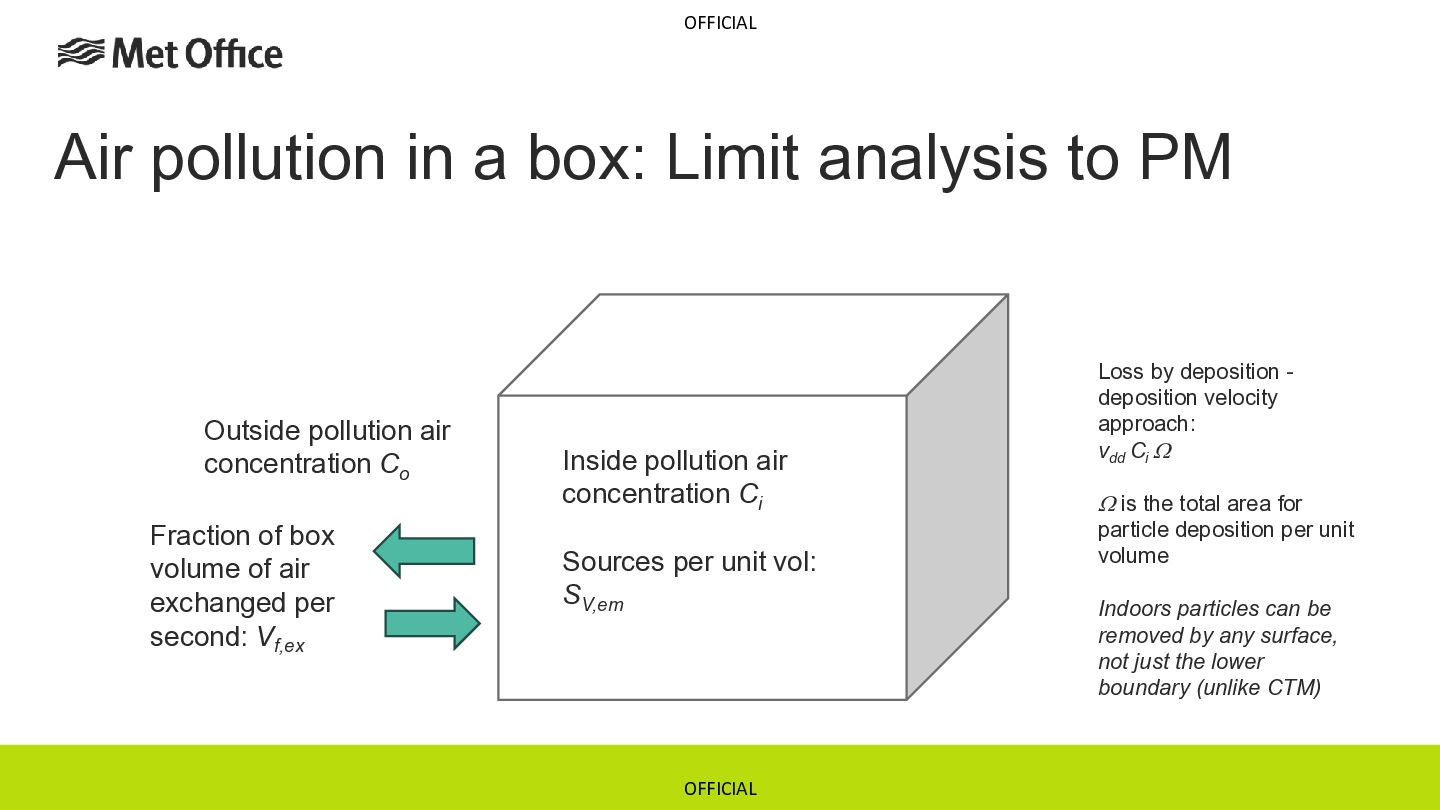
Outside pollution air concentration Co Fraction of box volume of air exchanged per second: Vf,ex Inside pollution air concentration Ci Sources per unit vol: SV,em OFFICIAL Loss by deposition deposition velocity approach: vdd Ci is the total area for particle deposition per unit volume Indoors particles can be removed by any surface, not just the lower boundary (unlike CTM)
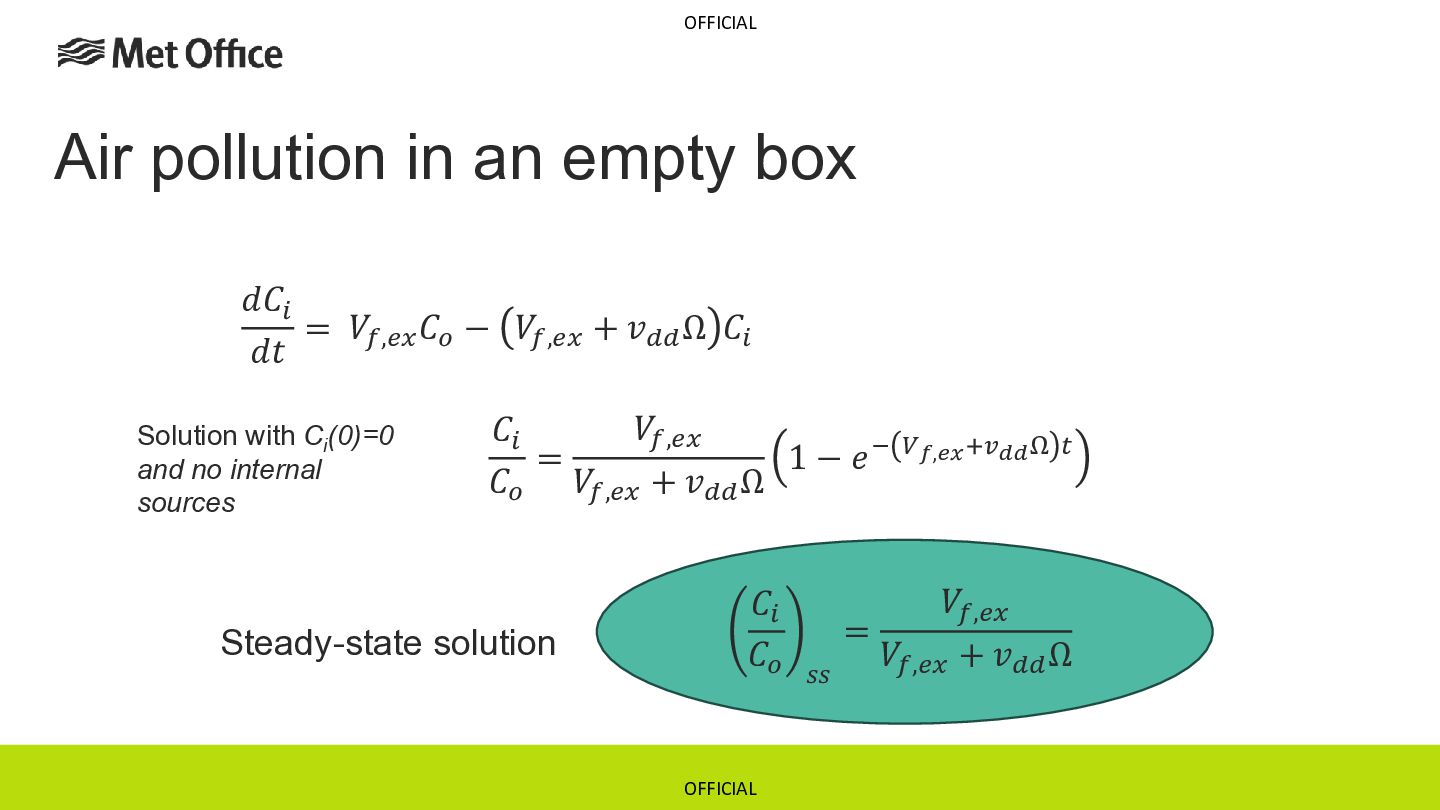
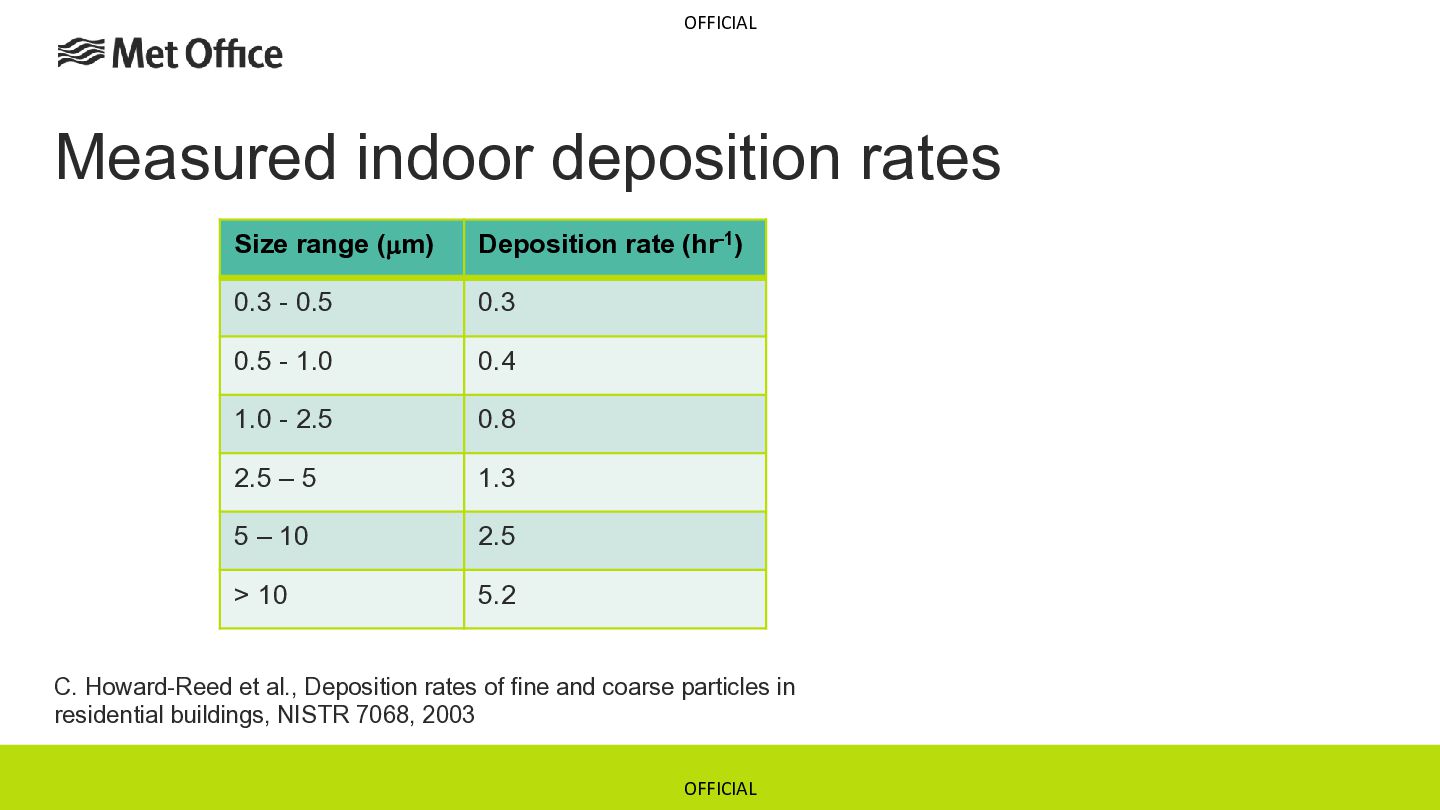
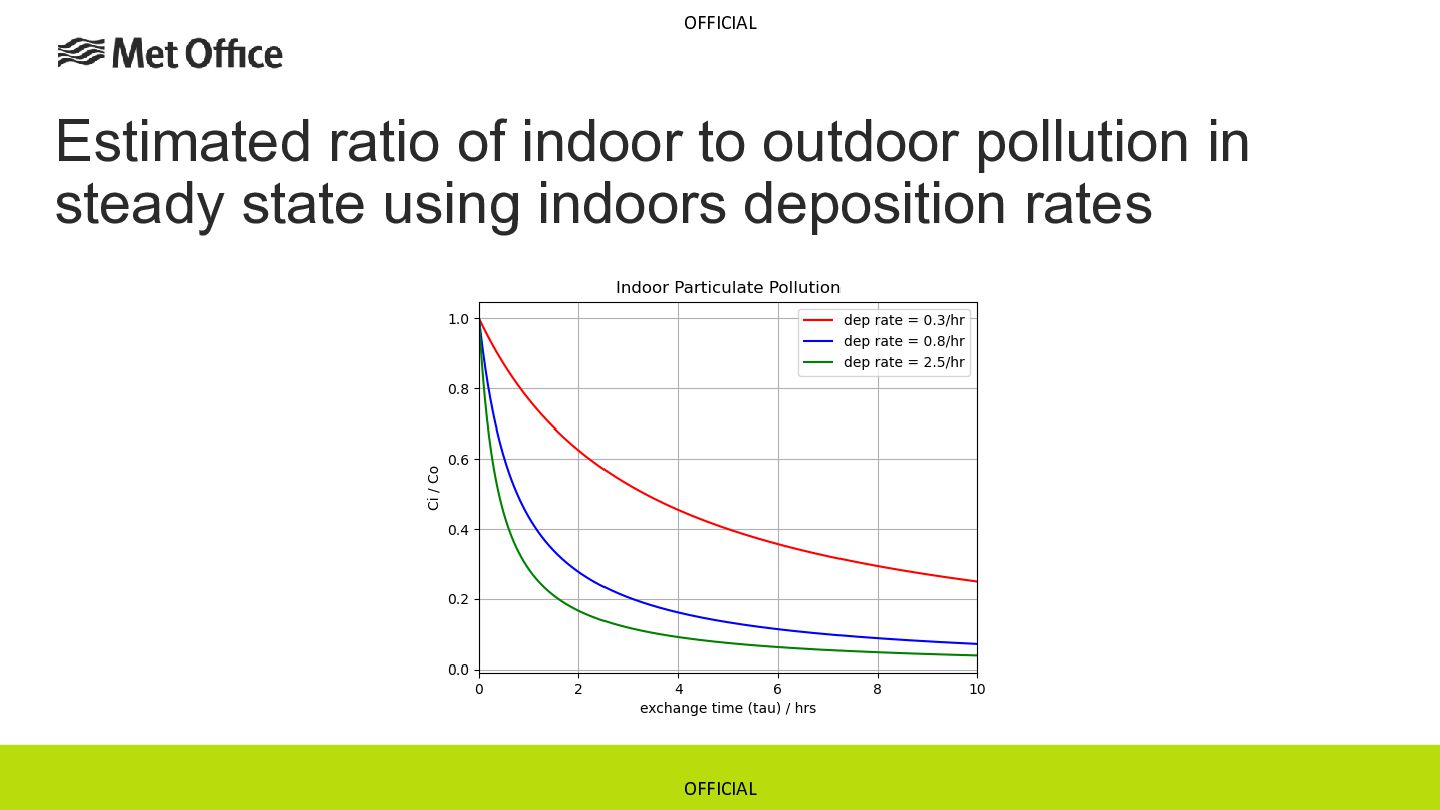
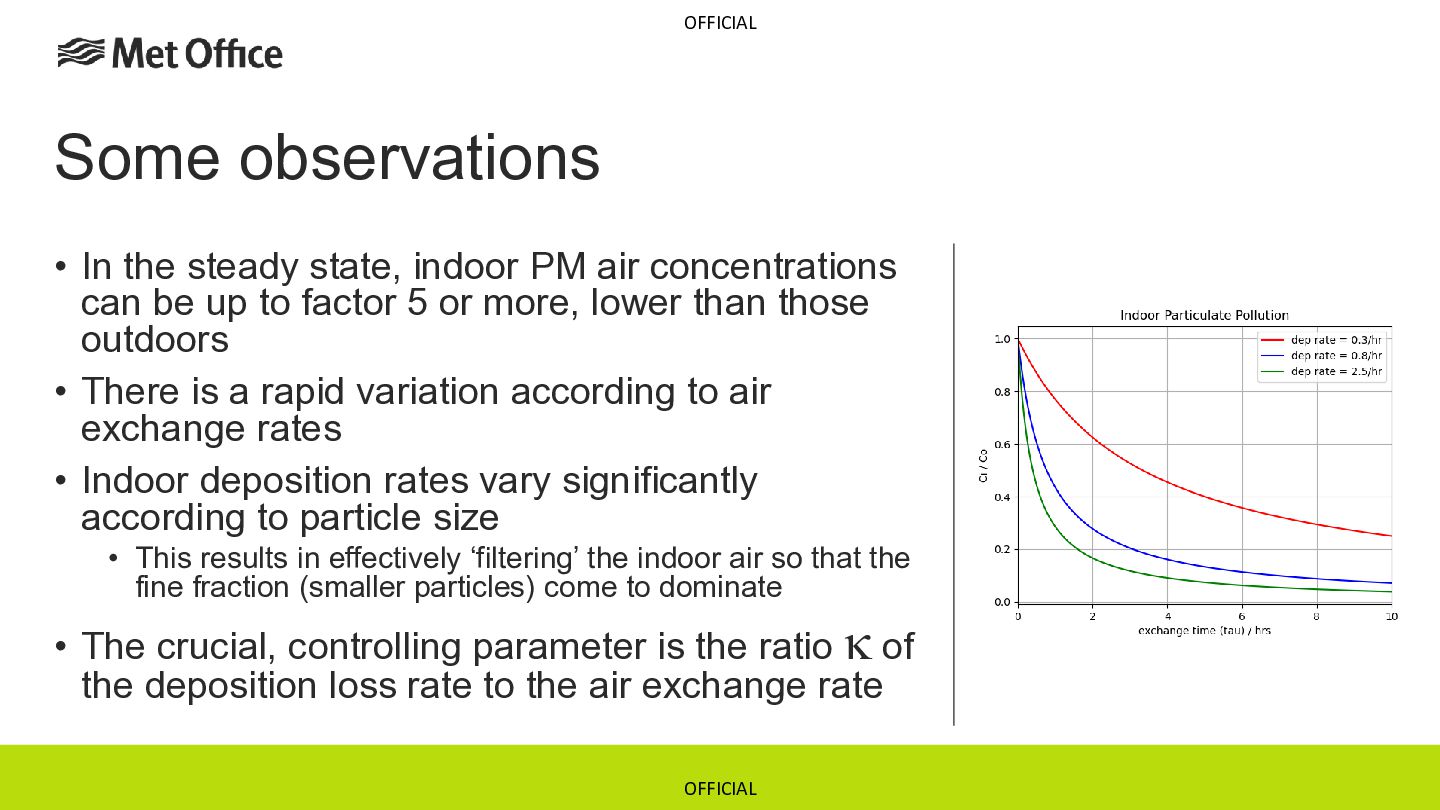
air concentrations can be up to factor 5 or more, lower than those outdoors • There is a rapid variation according to air exchange rates • Indoor deposition rates vary significantly according to particle size • This results in effectively ‘filtering’ the indoor air so that the fine fraction (smaller particles) come to dominate • The crucial, controlling parameter is the ratio k of the deposition loss rate to the air exchange rate OFFICIAL
air concentrations can give rise to very different indoor personal exposure contributions • Outside of controlled studies, the air exchange rates for individuals are unknown. For modelling study groups it is necessary to average over an assumed distribution of values • This additional uncertainty is likely comparable to, or greater than, the spatial averaging which occurs in outdoors air quality models • We haven’t even attempted to account for uncertainty due to indoor sources… • The indoors shift of the particle size distribution resulting from sizedependent loss rates may be significant OFFICIAL


 iesevents
 katiecoart
 brad_frost
 eileencodes
 reverentgeek
 palkan
 ammeep
 mlcsv
 techseoconnect
 rabernat
 garrettdimon
 sachag
 lara