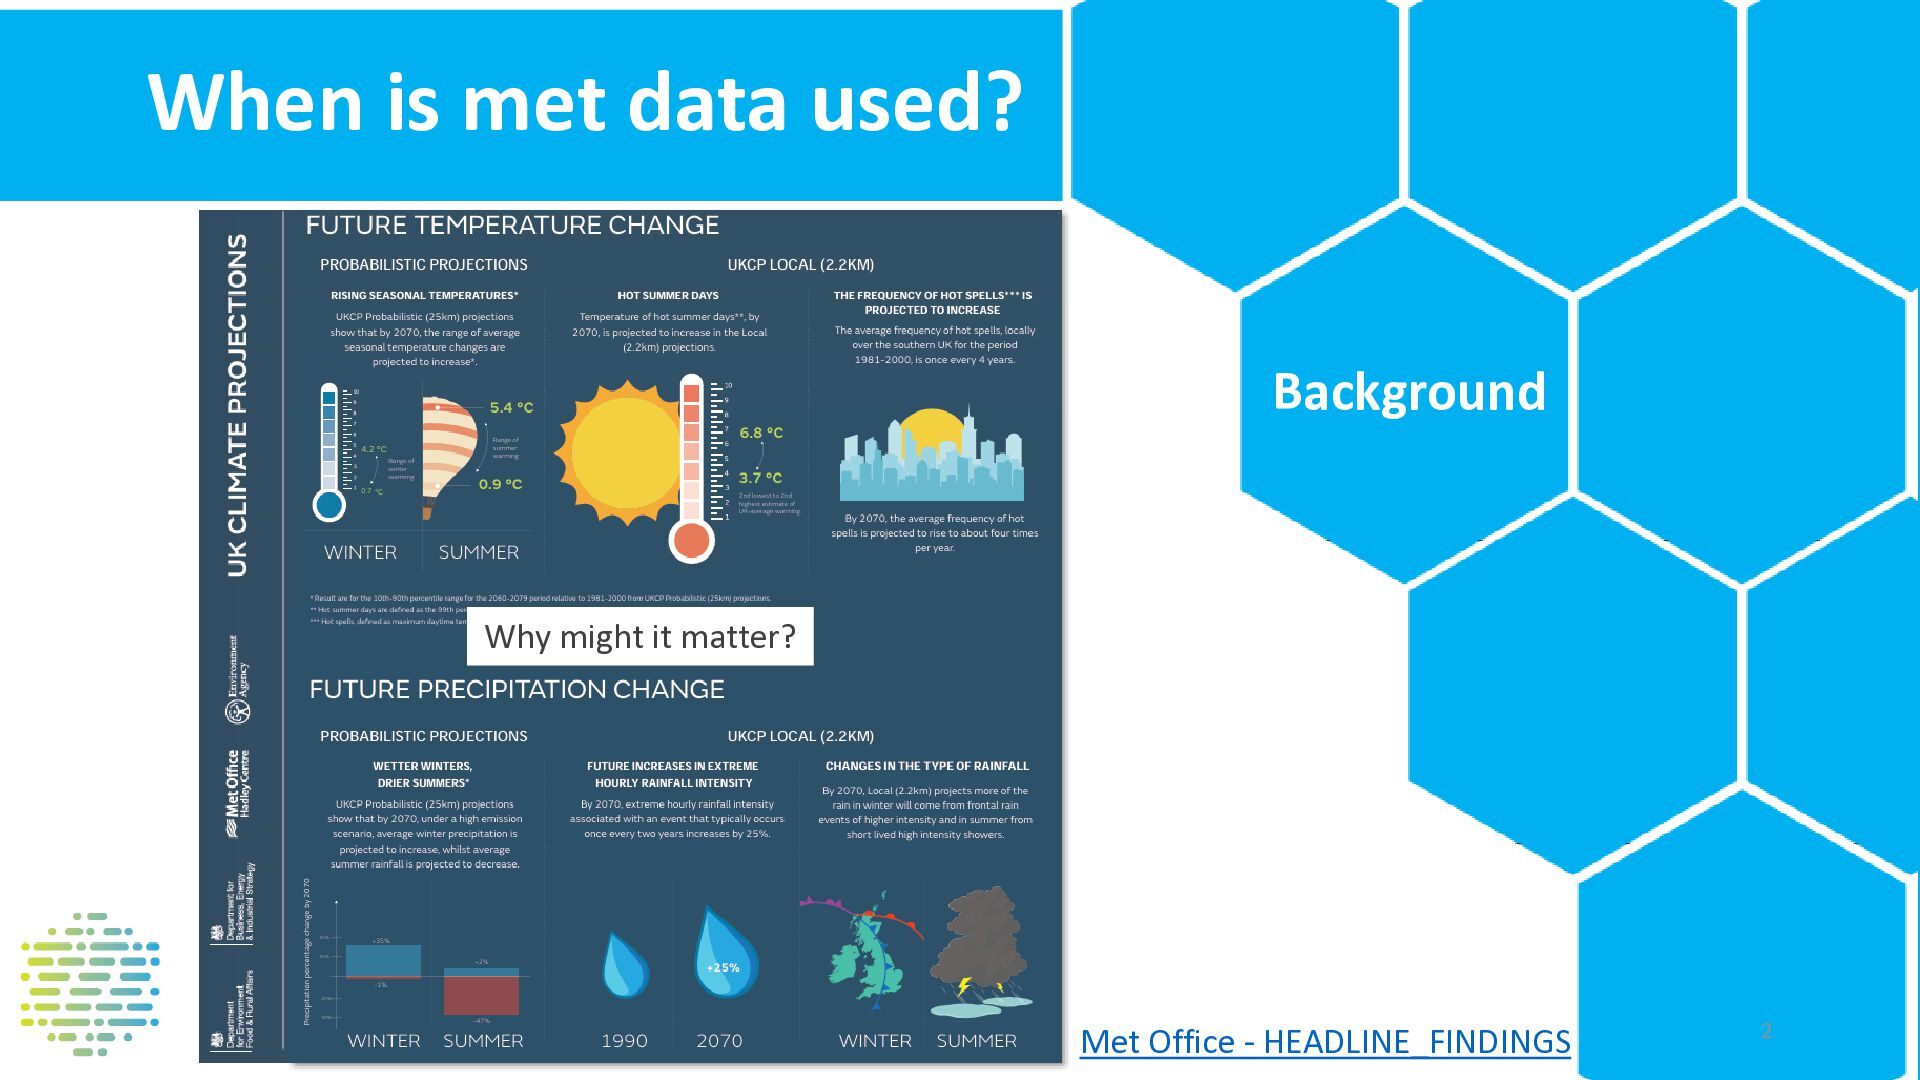
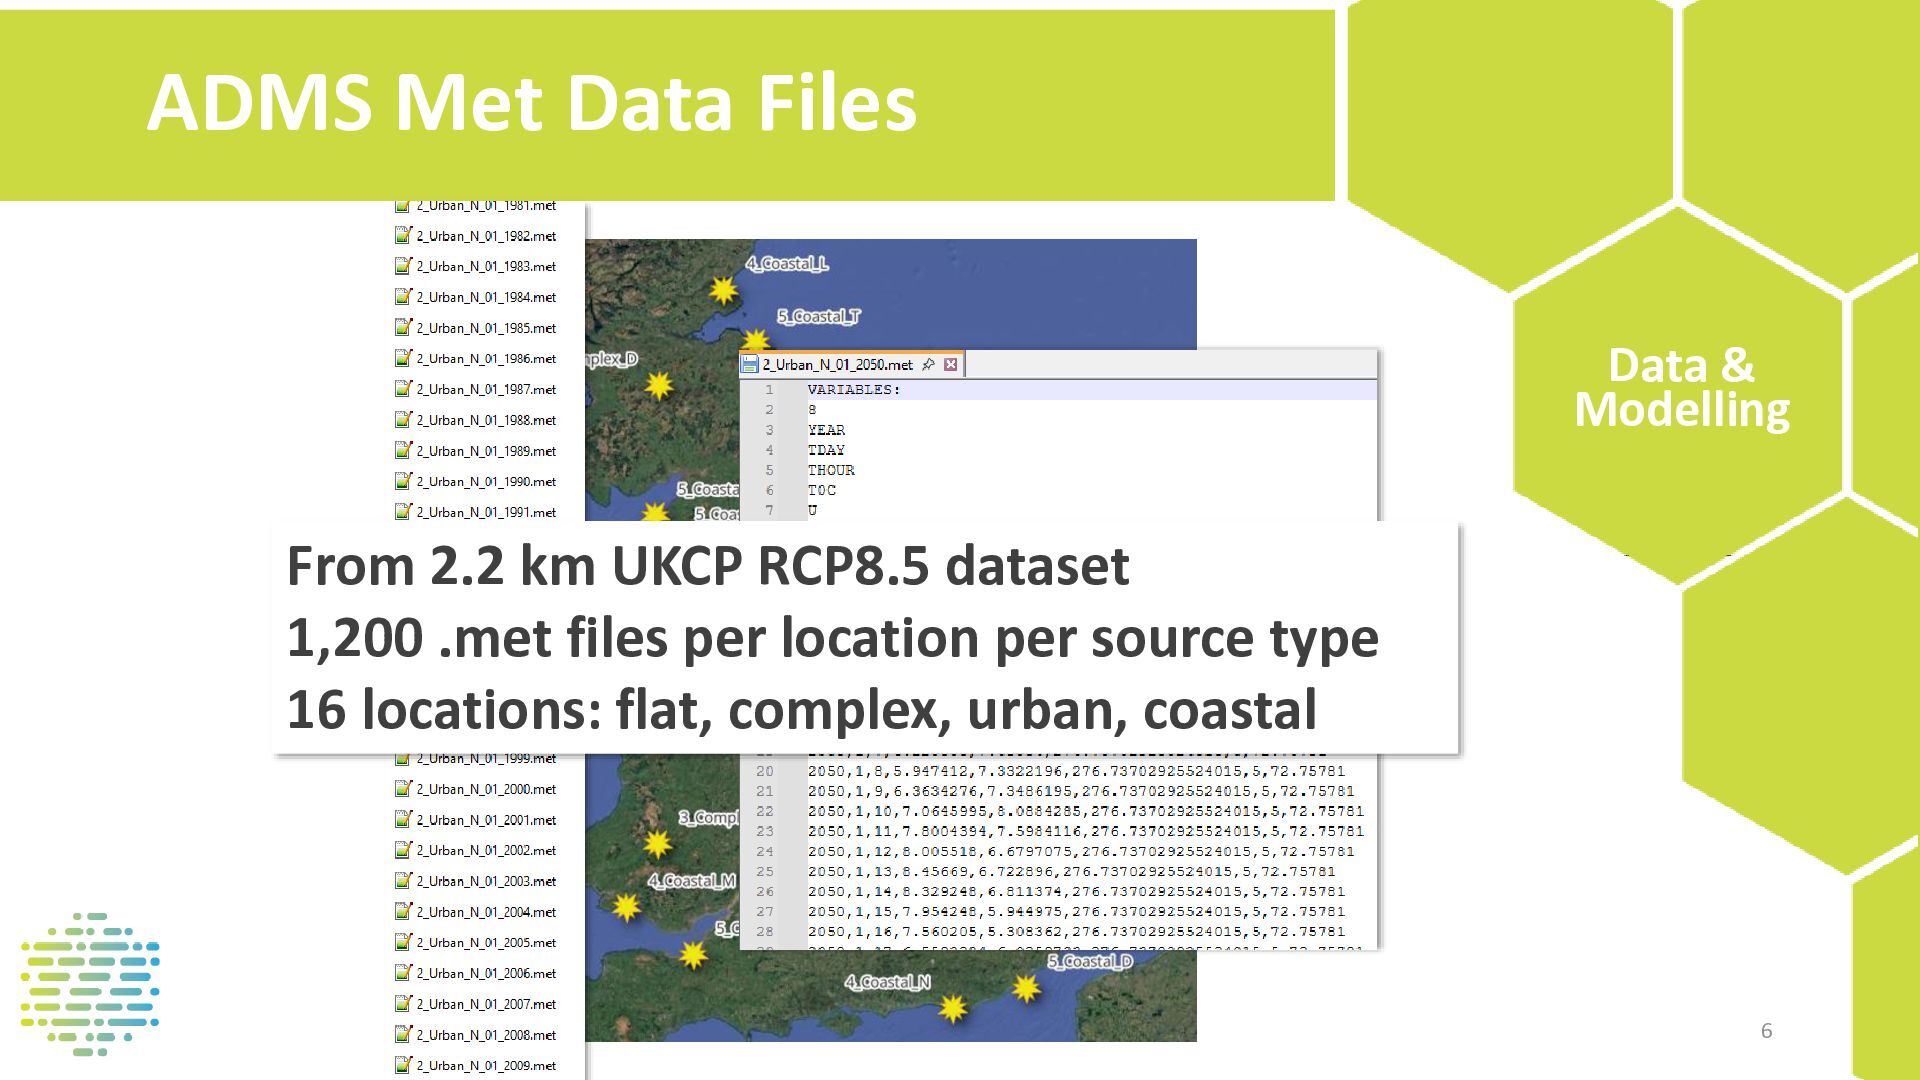
permitting – 5 years) Why mightplanning it matter? assessments • Modelling to support • E.g. EIA and standalone • Current approach is to use historic obs data. Met Office - HEADLINE_FINDINGS 2
projections Background • Use climate projections indexed from current observations • Use a standard dataset and apply uplift factors for inter-year variability and climate change We have run met data for sites in the UK from 1976 to 2025 - Tested whether there is a climate signal in observed data. - Tested whether 5 years is the correct number to account for inter-year variation and whether it matters which 5 years they are. Not presented today! Focus is on the Met Office’s UKCPs. 3
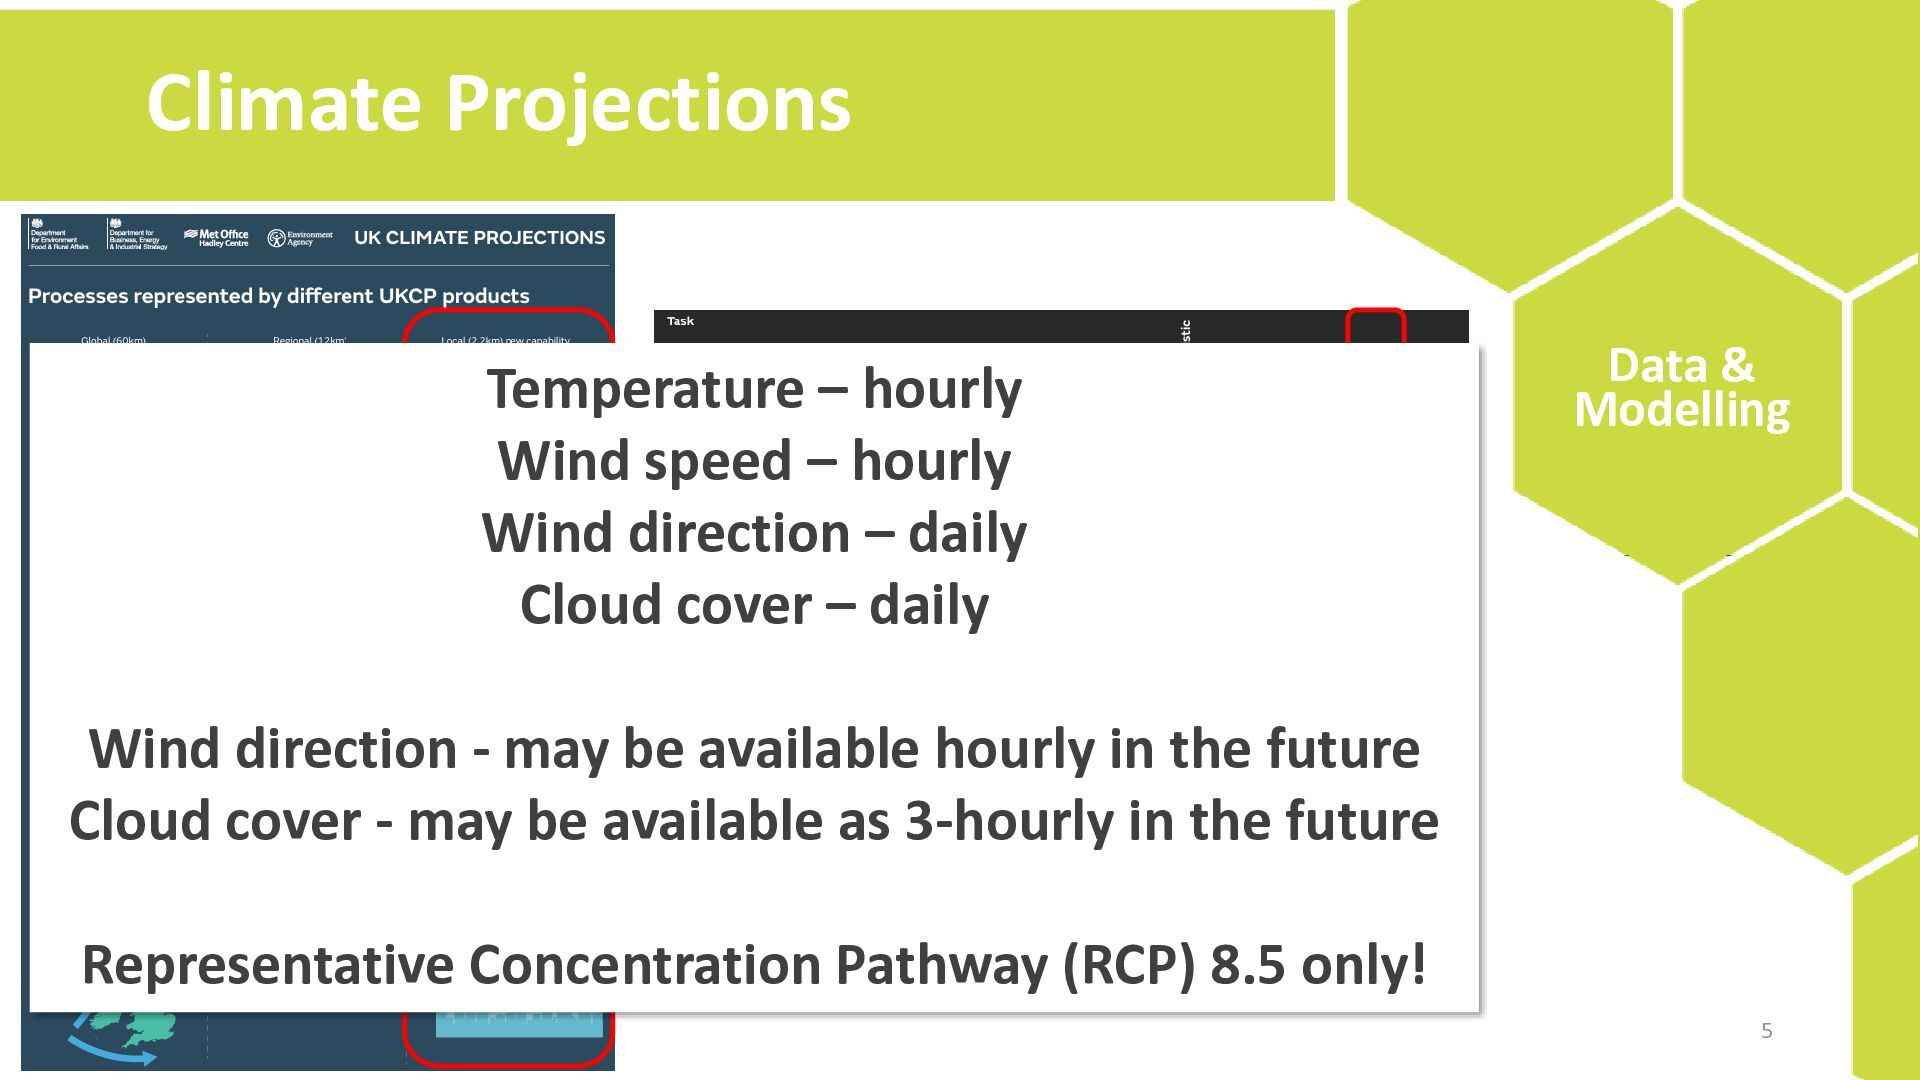
direction – daily Cloud cover – daily Data & Modelling Wind direction - may be available hourly in the future Cloud cover - may be available as 3-hourly in the future Representative Concentration Pathway (RCP) 8.5 only! 5
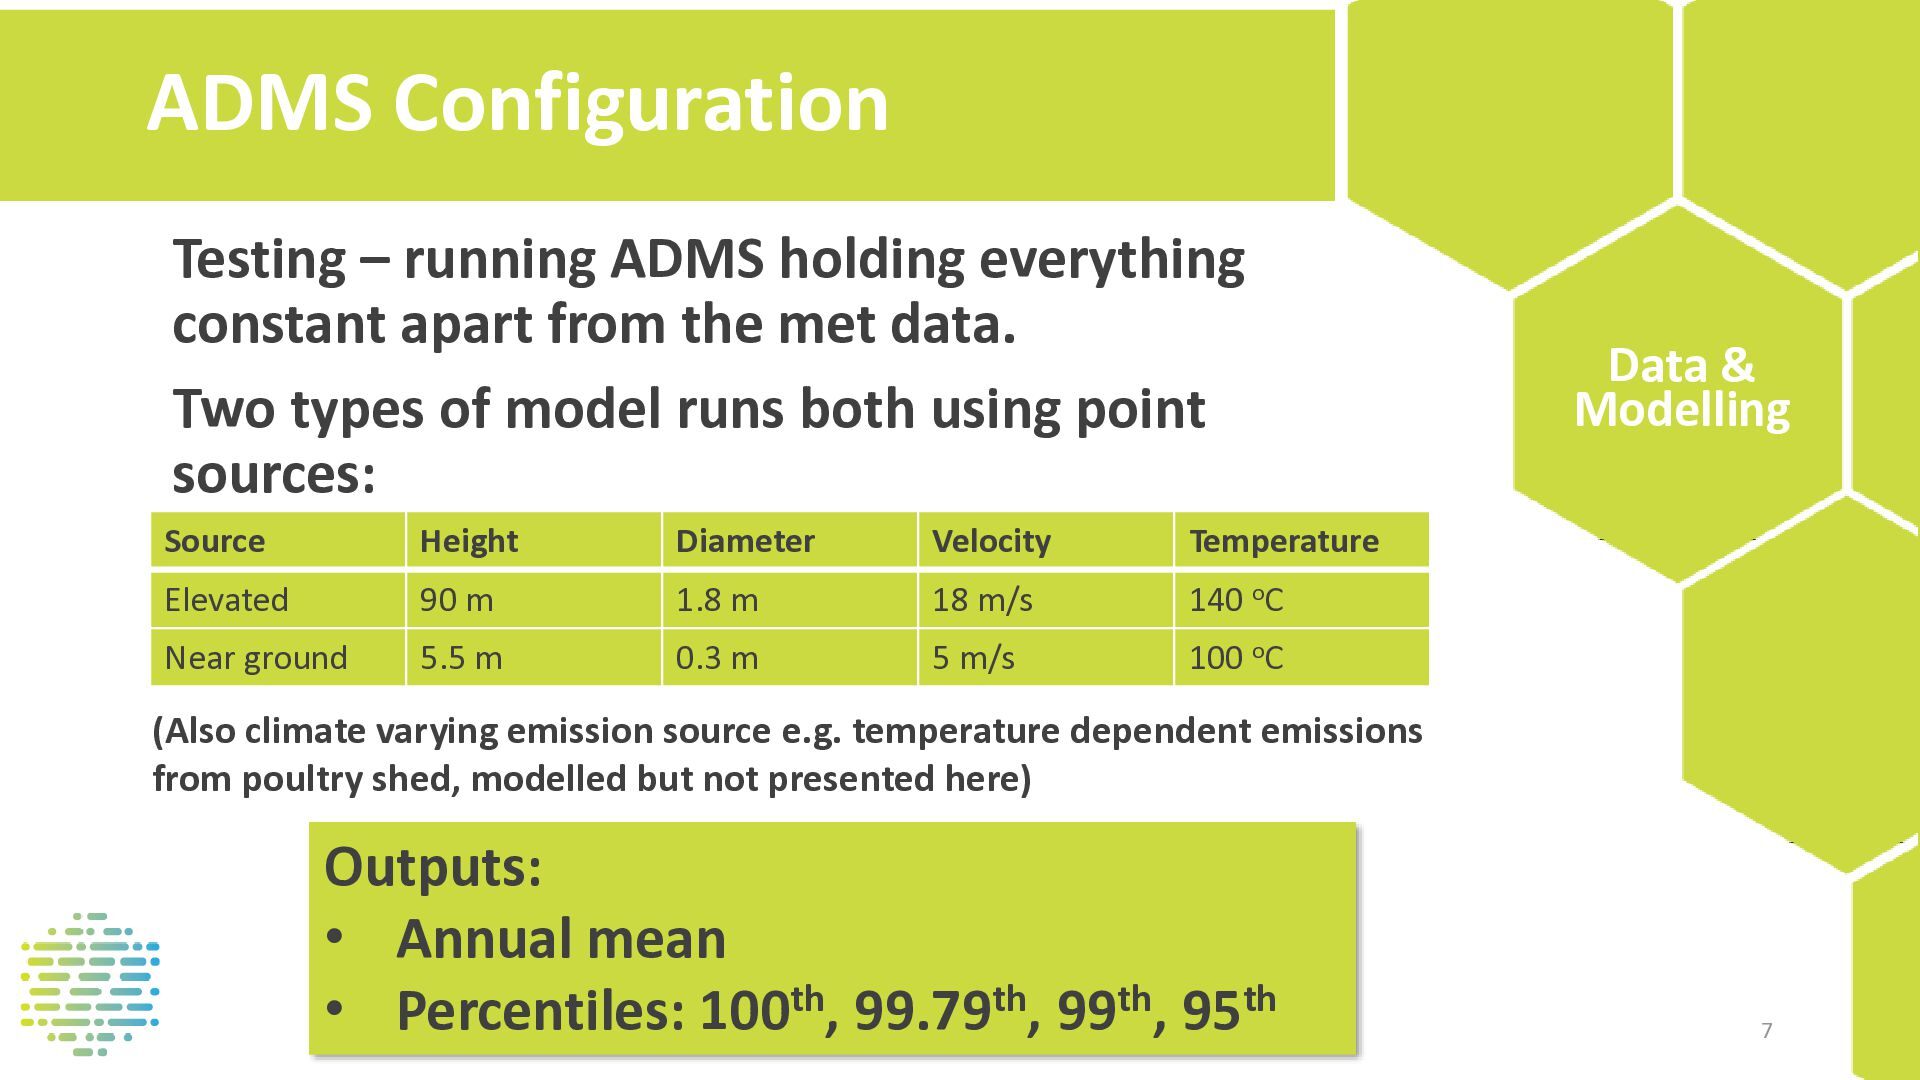
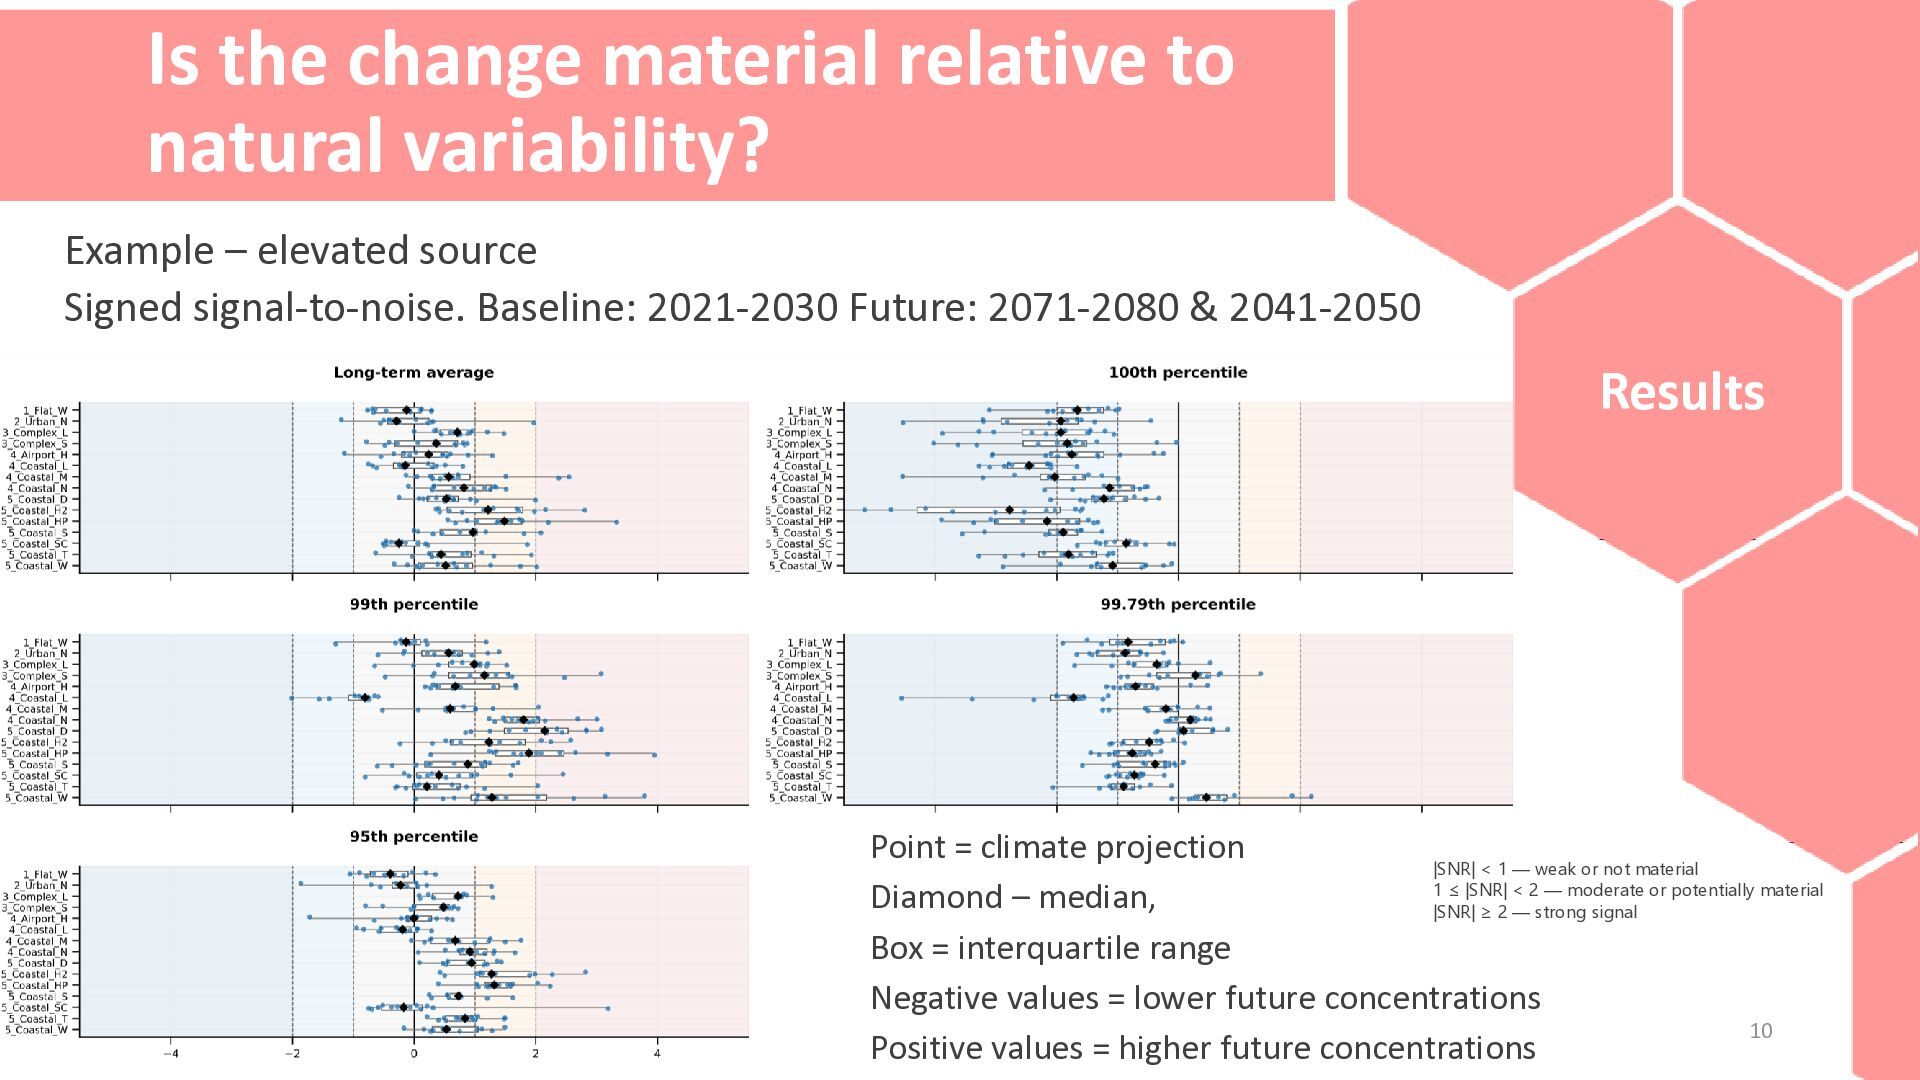
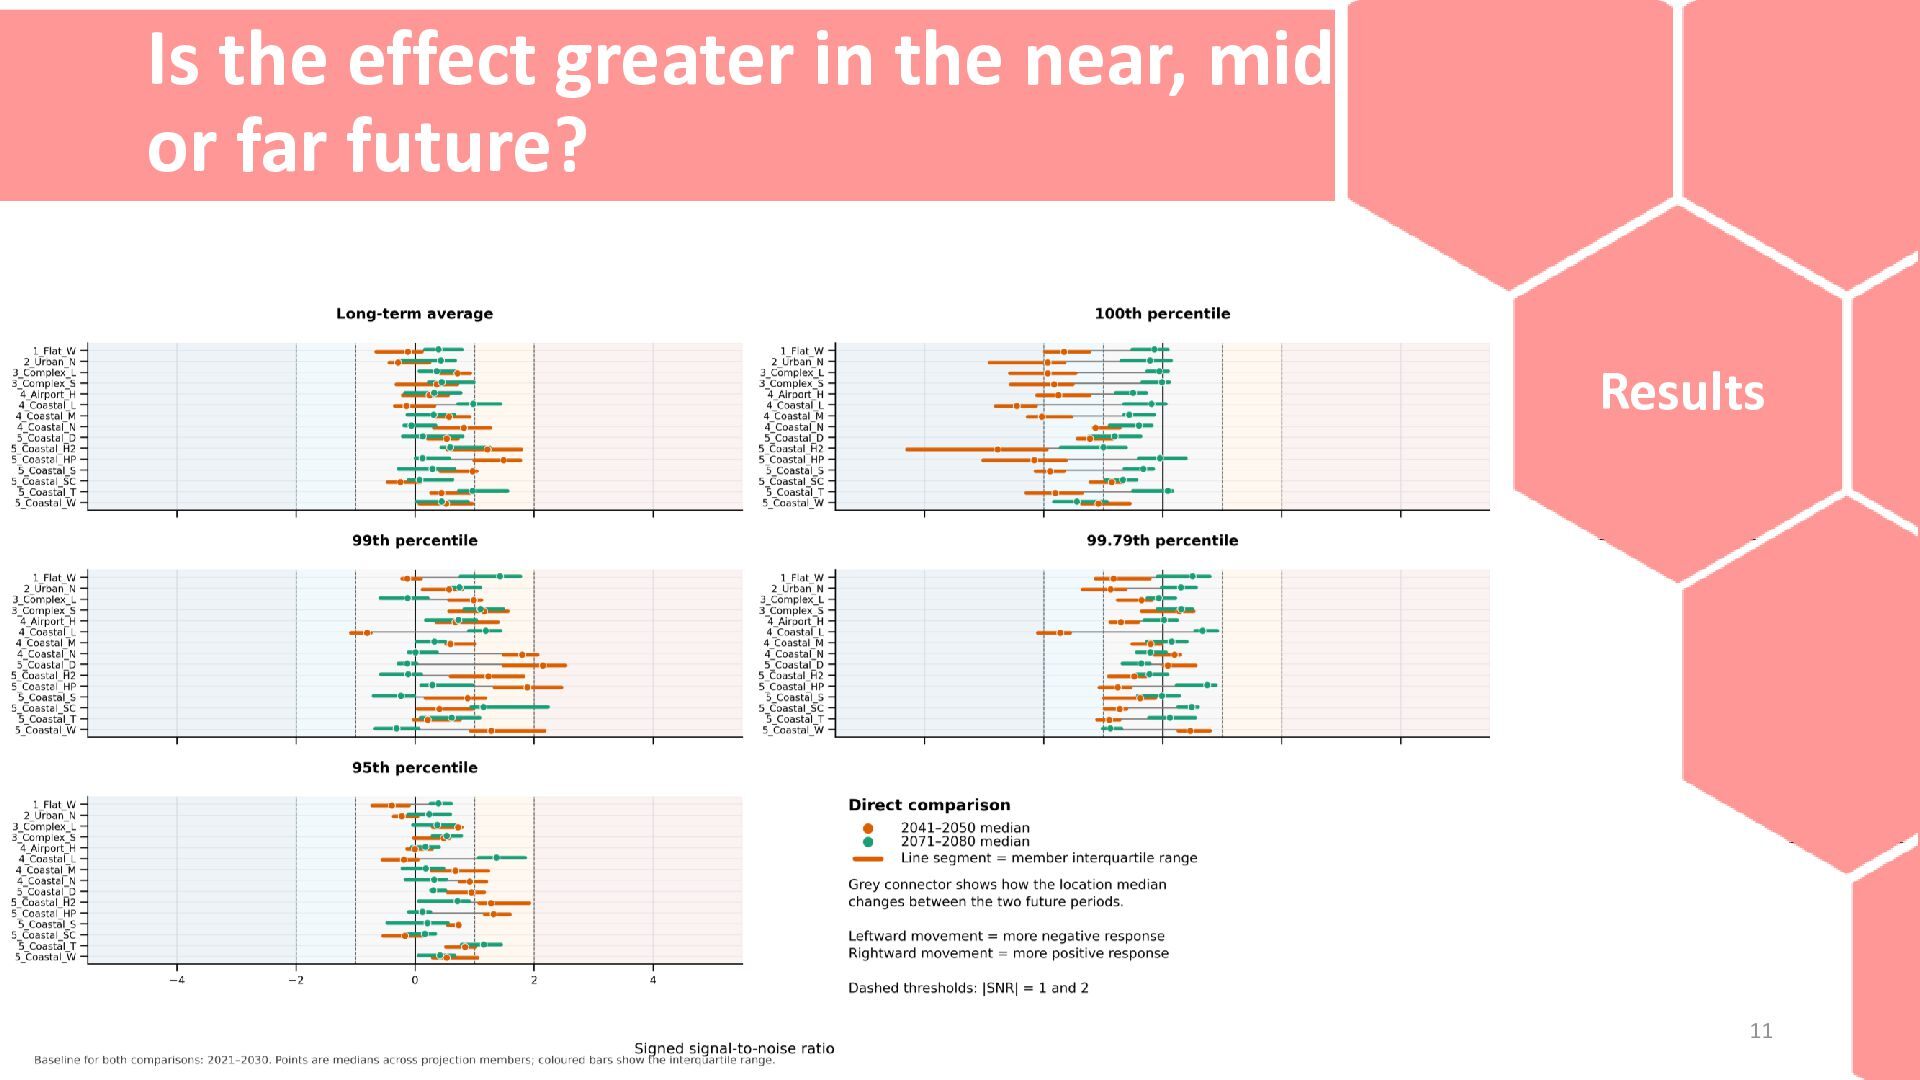
from the met data. Two types of model runs both using point sources: Source Height Diameter Velocity Temperature Elevated 90 m 1.8 m 18 m/s 140 oC Near ground 5.5 m 0.3 m 5 m/s 100 oC Data & Modelling (Also climate varying emission source e.g. temperature dependent emissions from poultry shed, modelled but not presented here) Outputs: • Annual mean • Percentiles: 100th, 99.79th, 99th, 95th 7
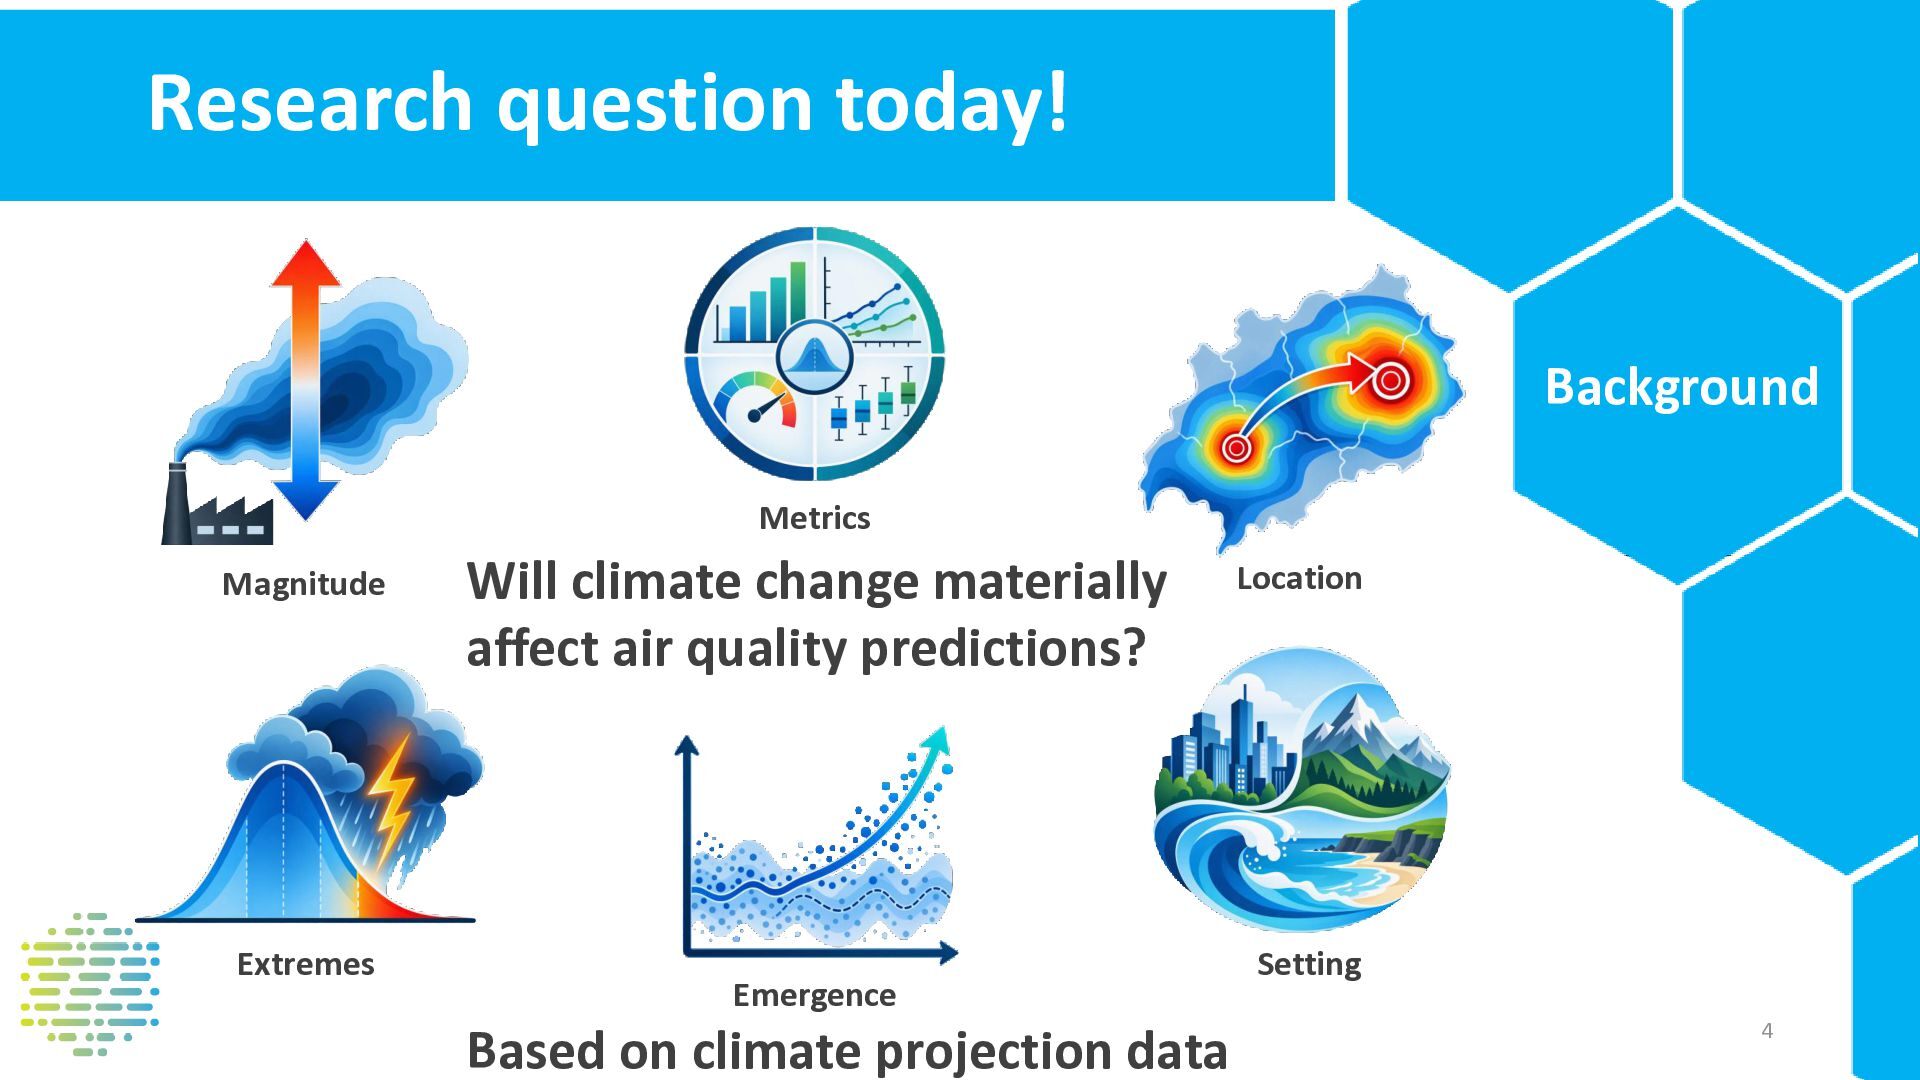
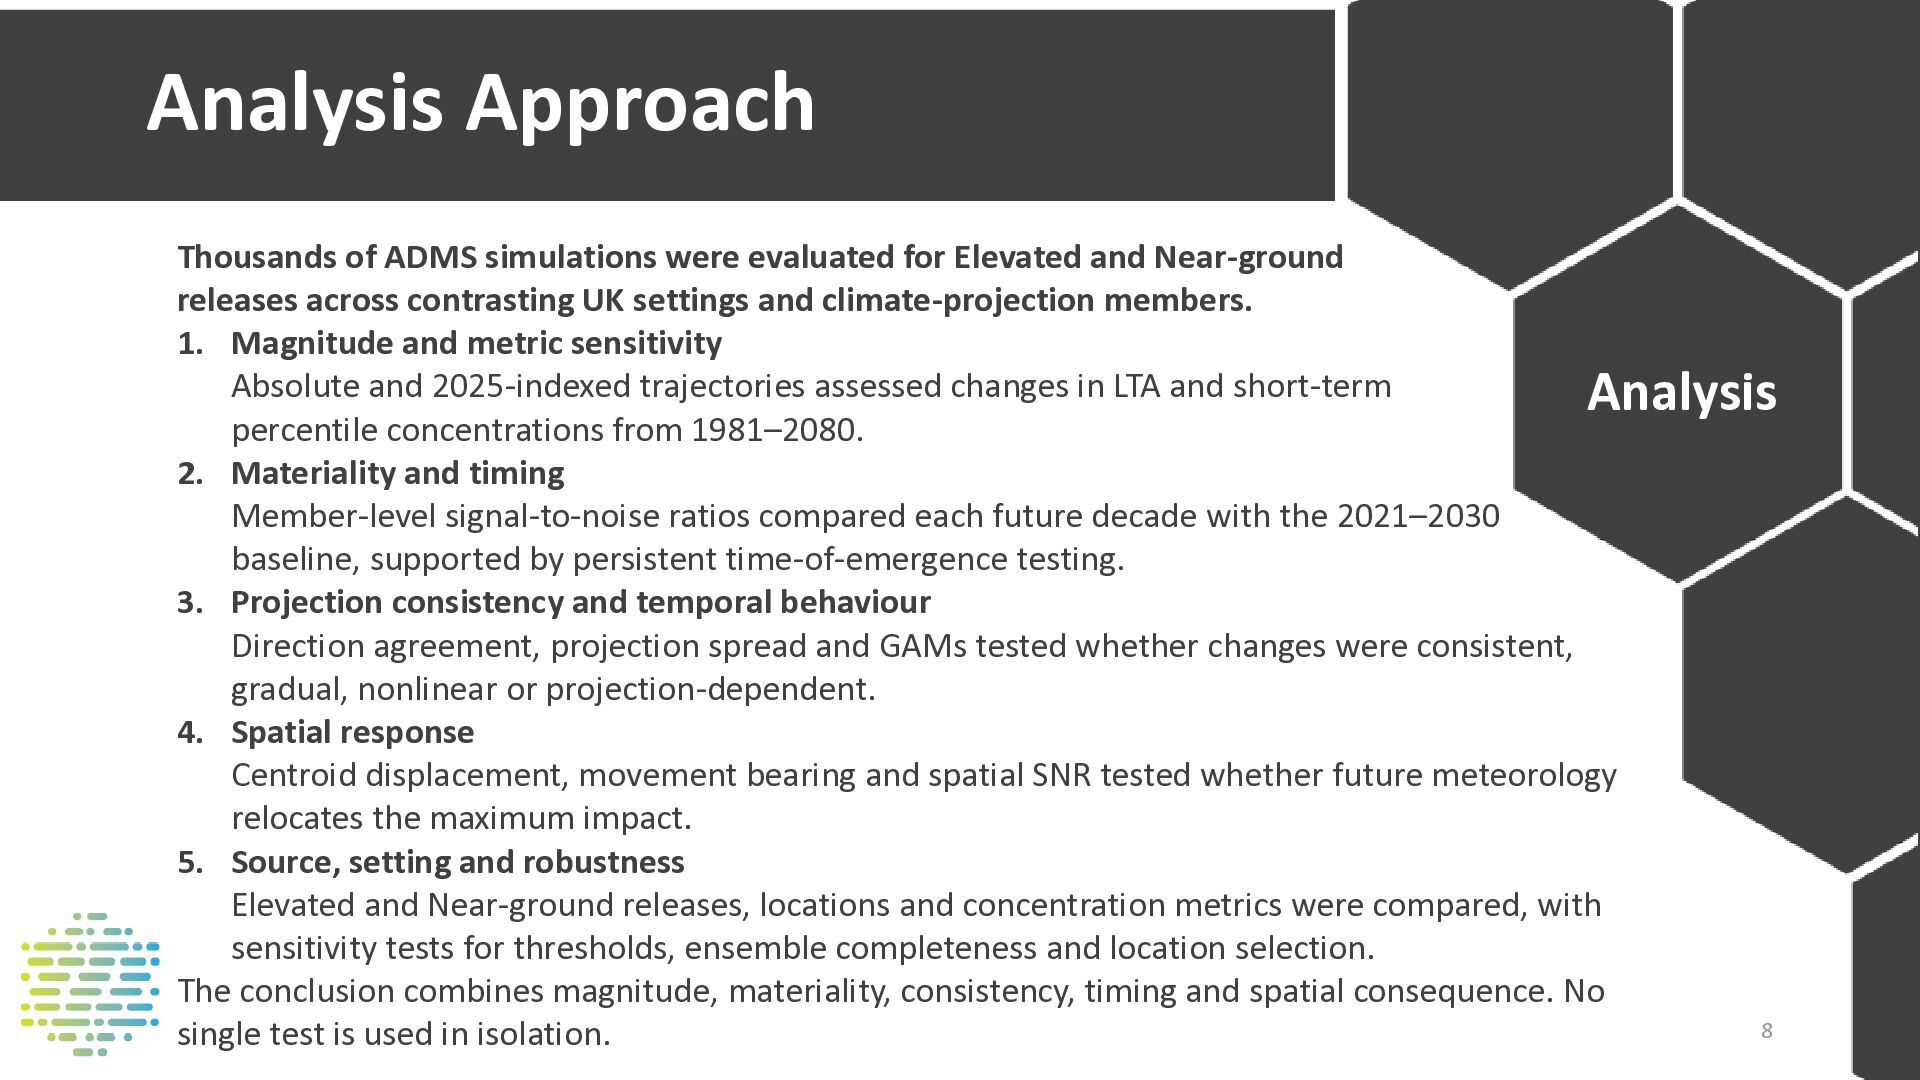
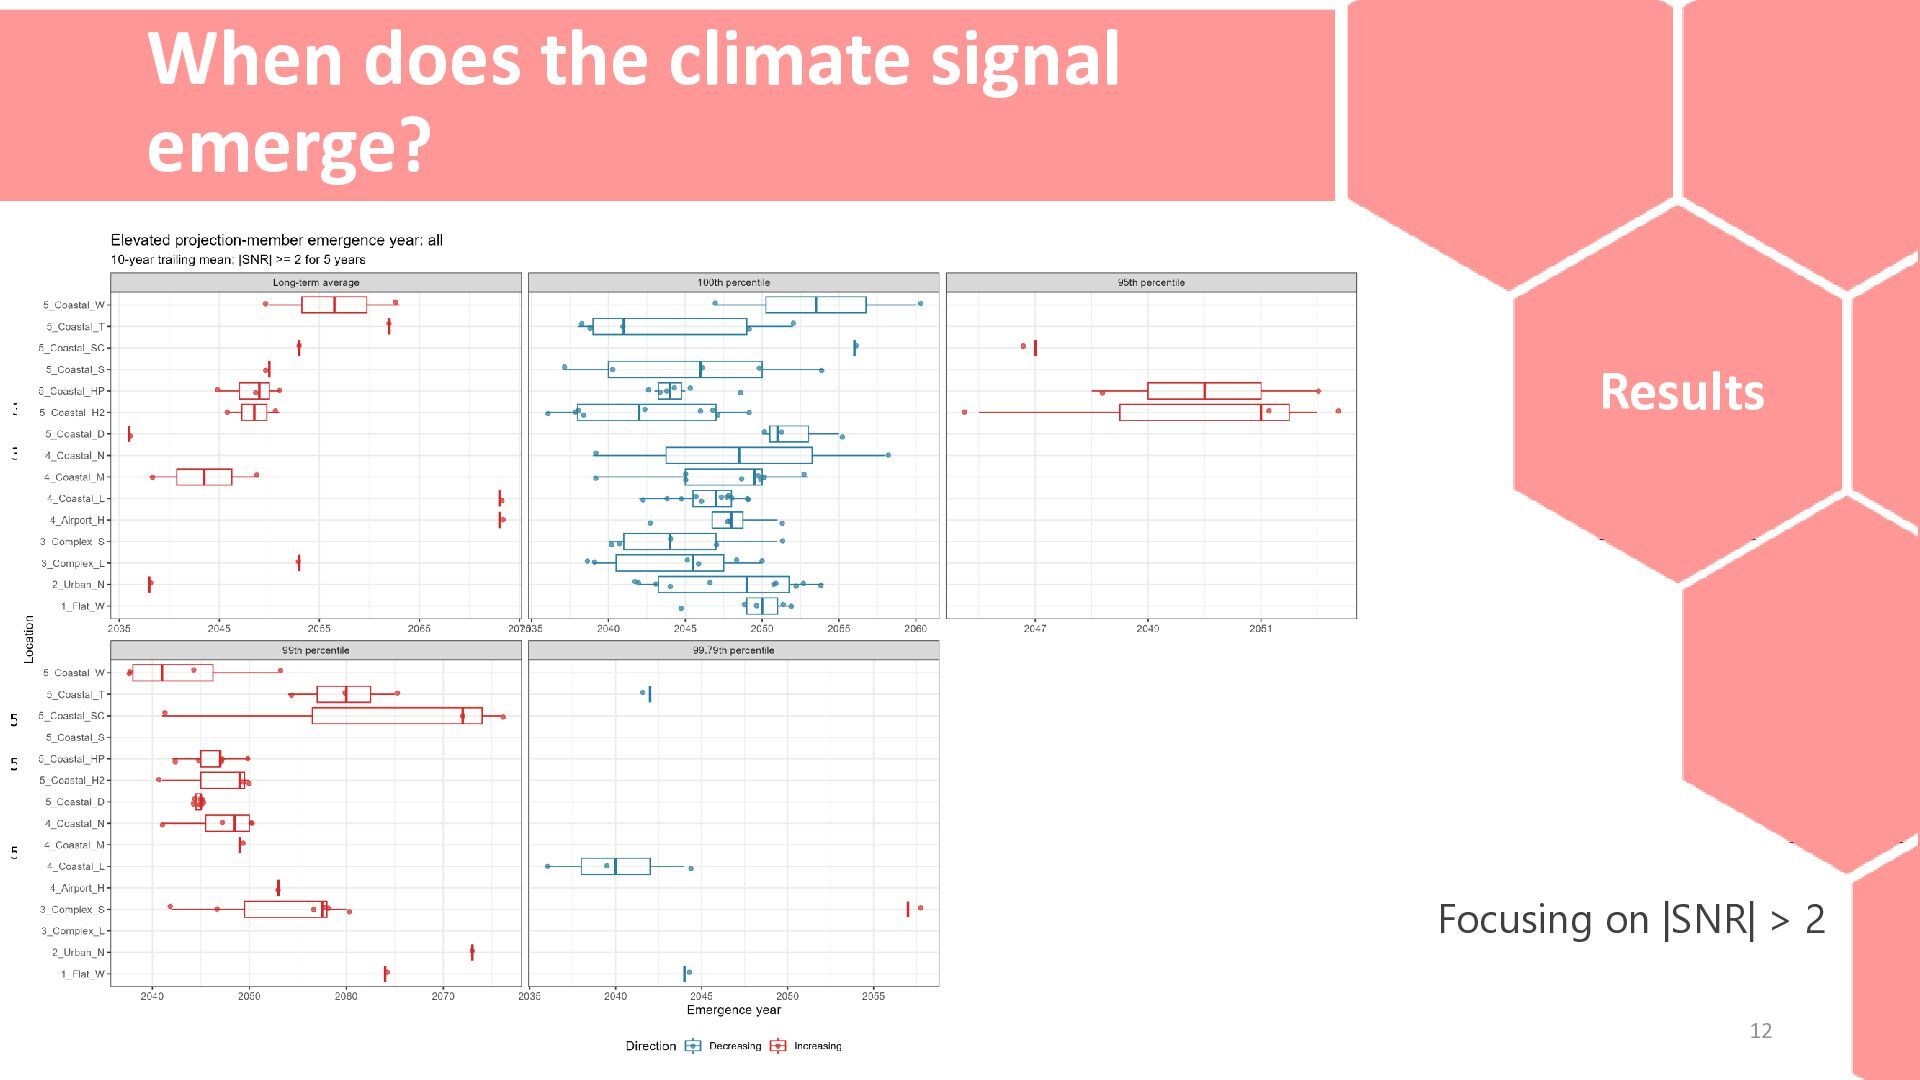
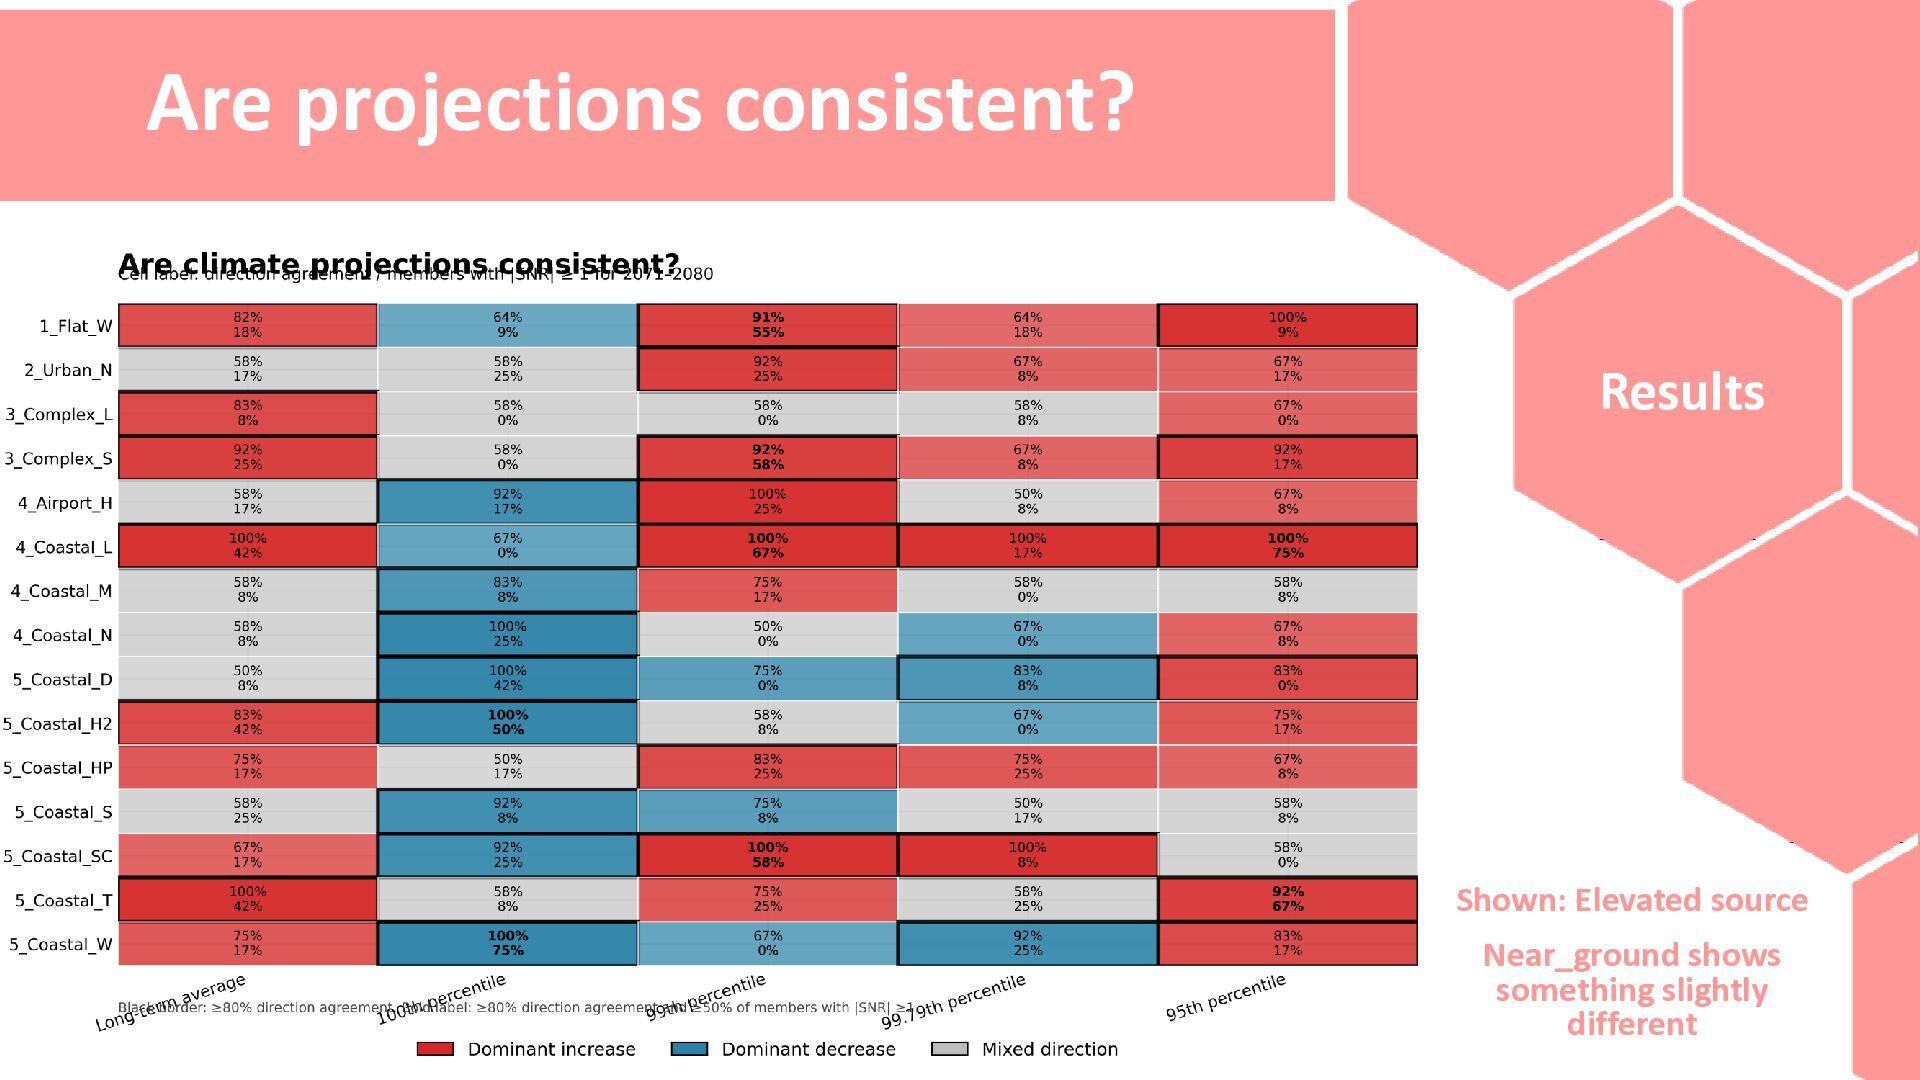
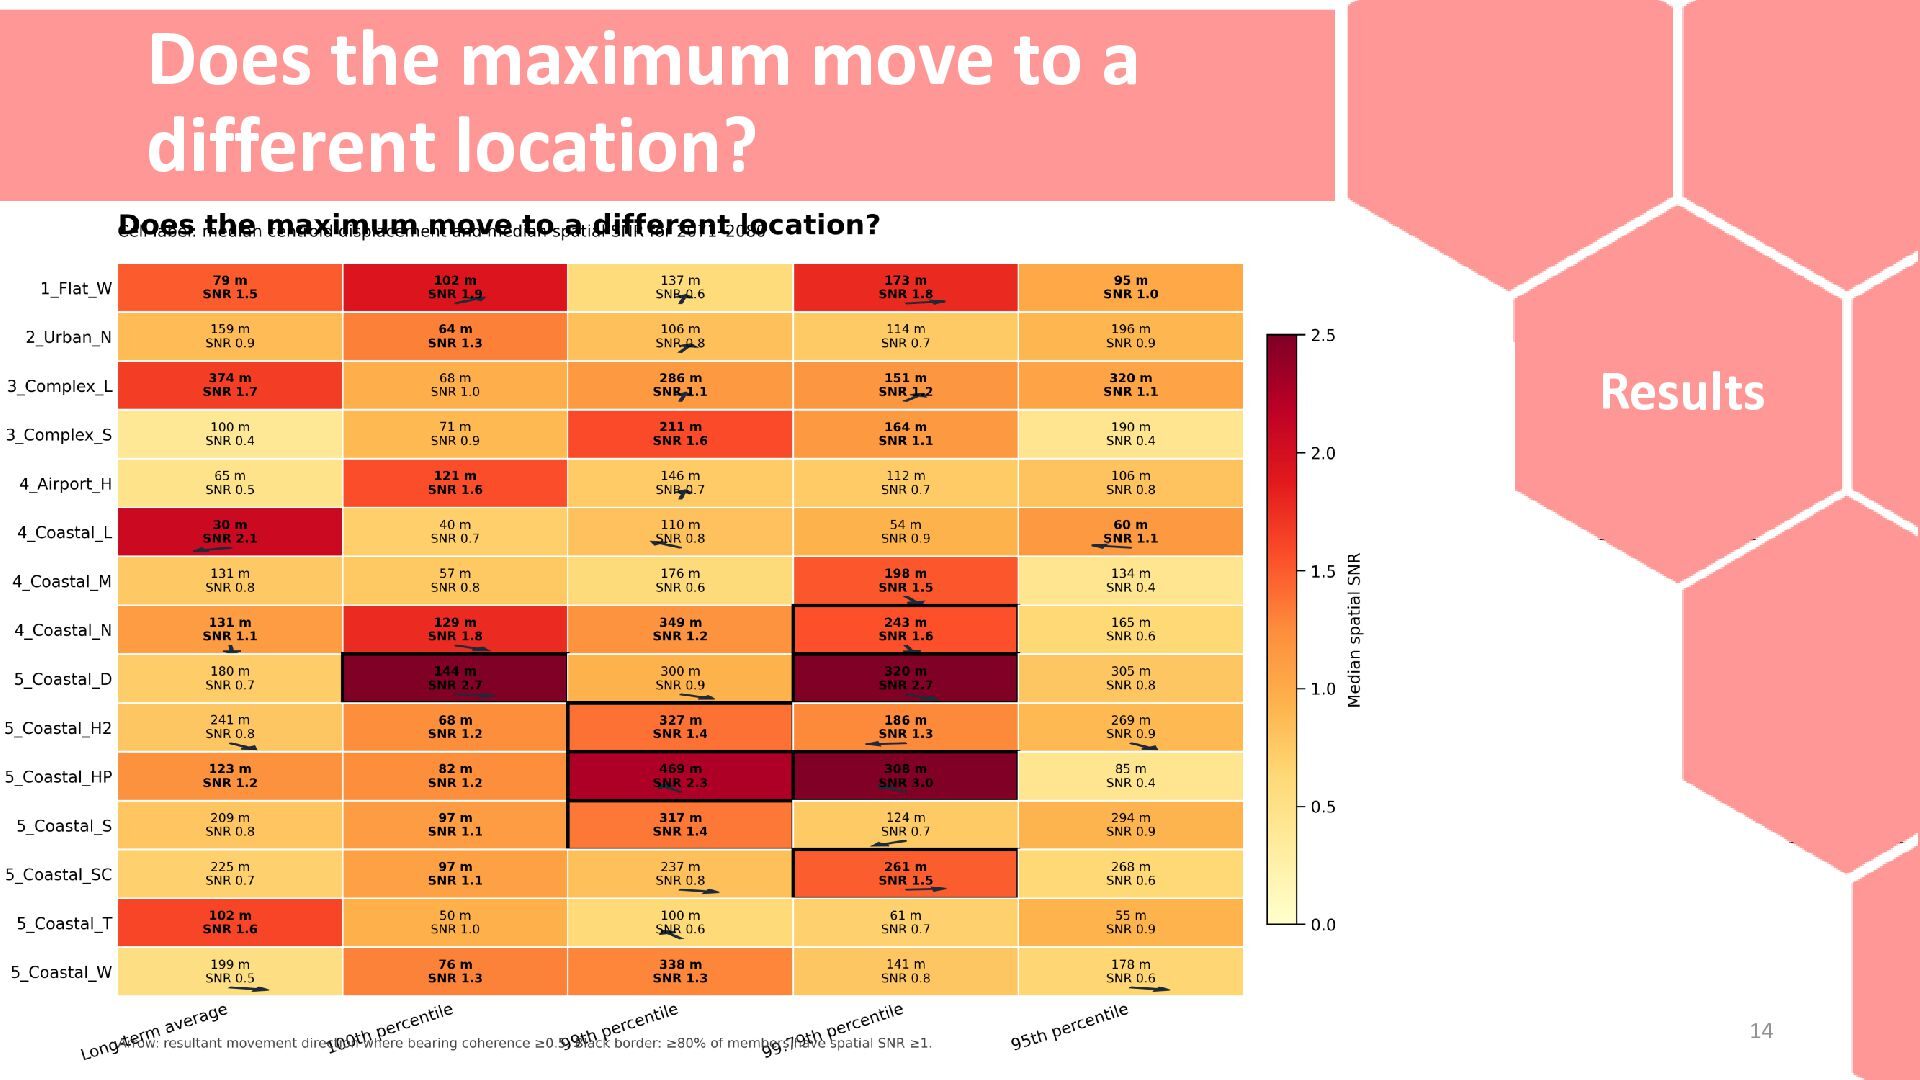
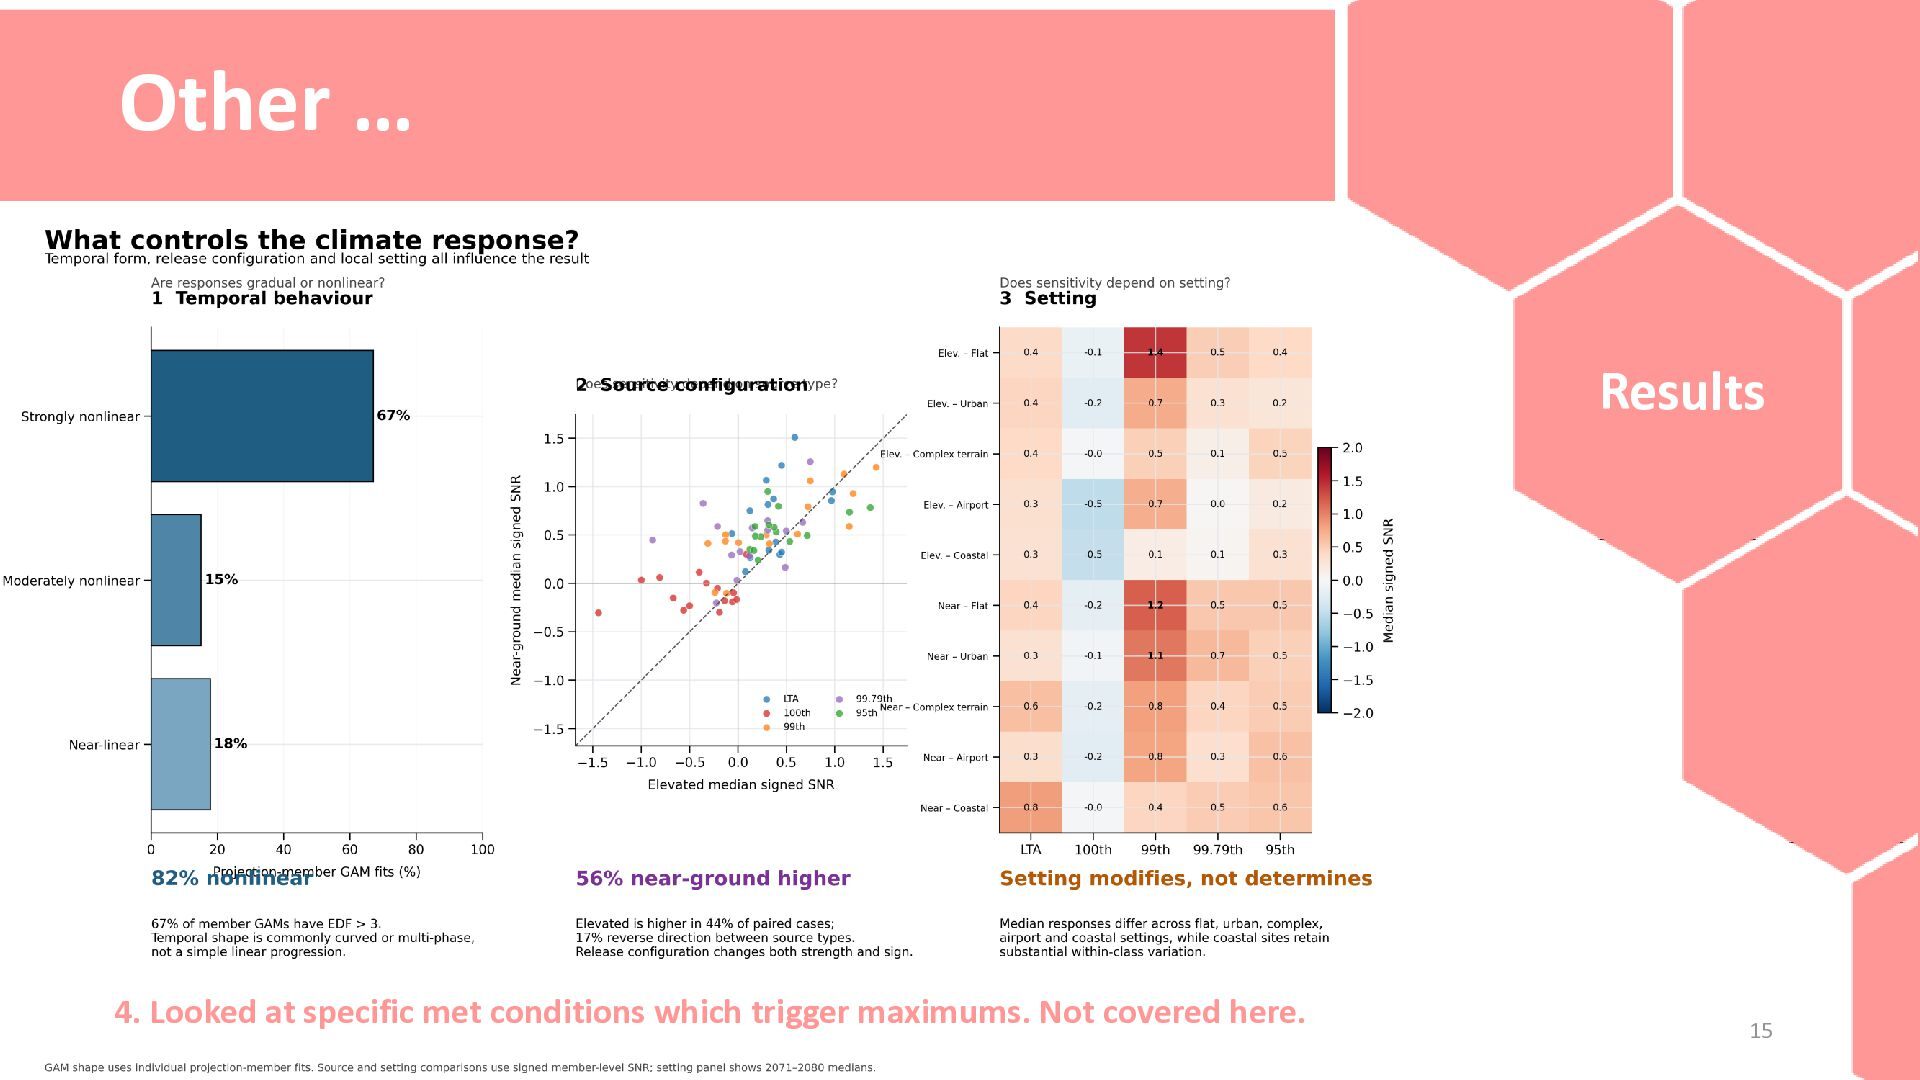
and Near-ground releases across contrasting UK settings and climate-projection members. 1. Magnitude and metric sensitivity Absolute and 2025-indexed trajectories assessed changes in LTA and short-term Analysis percentile concentrations from 1981–2080. 2. Materiality and timing Member-level signal-to-noise ratios compared each future decade with the 2021–2030 baseline, supported by persistent time-of-emergence testing. 3. Projection consistency and temporal behaviour Direction agreement, projection spread and GAMs tested whether changes were consistent, gradual, nonlinear or projection-dependent. 4. Spatial response Centroid displacement, movement bearing and spatial SNR tested whether future meteorology relocates the maximum impact. 5. Source, setting and robustness Elevated and Near-ground releases, locations and concentration metrics were compared, with sensitivity tests for thresholds, ensemble completeness and location selection. The conclusion combines magnitude, materiality, consistency, timing and spatial consequence. No 8 single test is used in isolation.
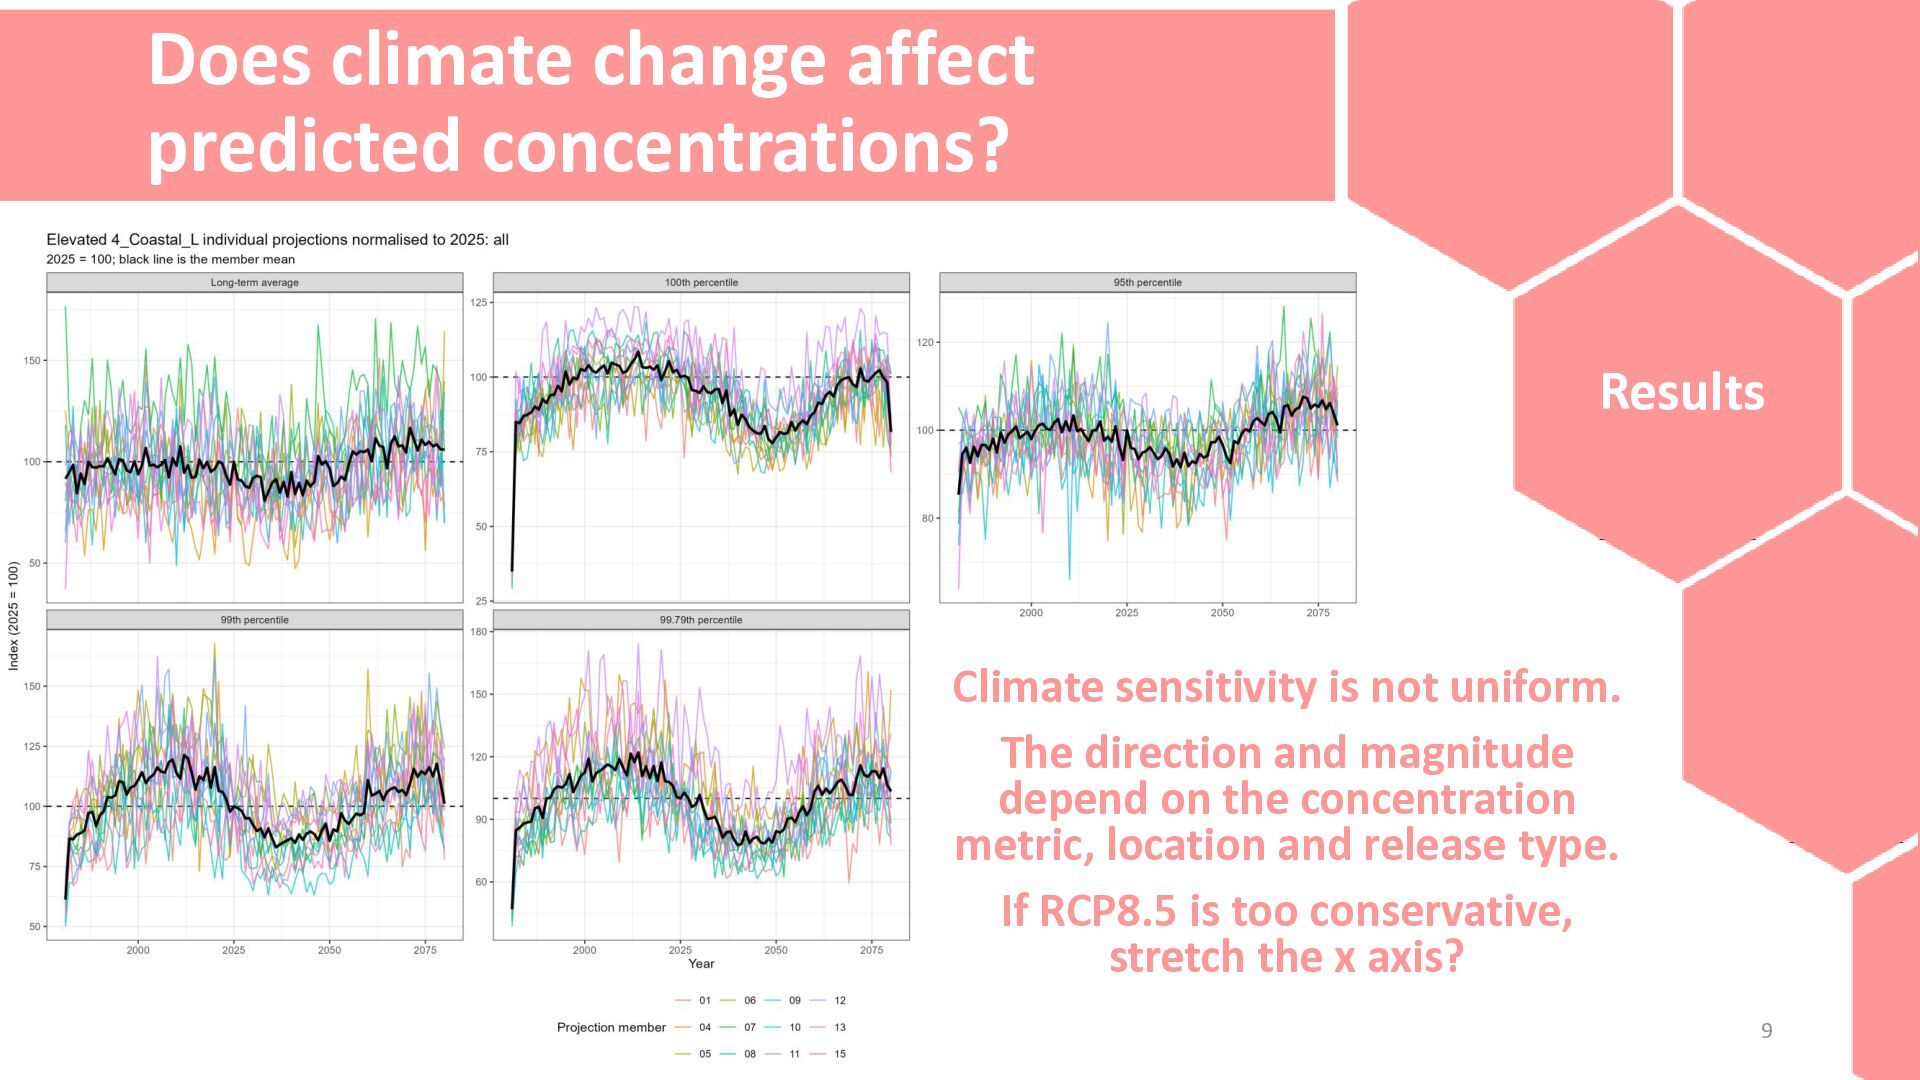
not uniform. The direction and magnitude depend on the concentration metric, location and release type. If RCP8.5 is too conservative, stretch the x axis? 9
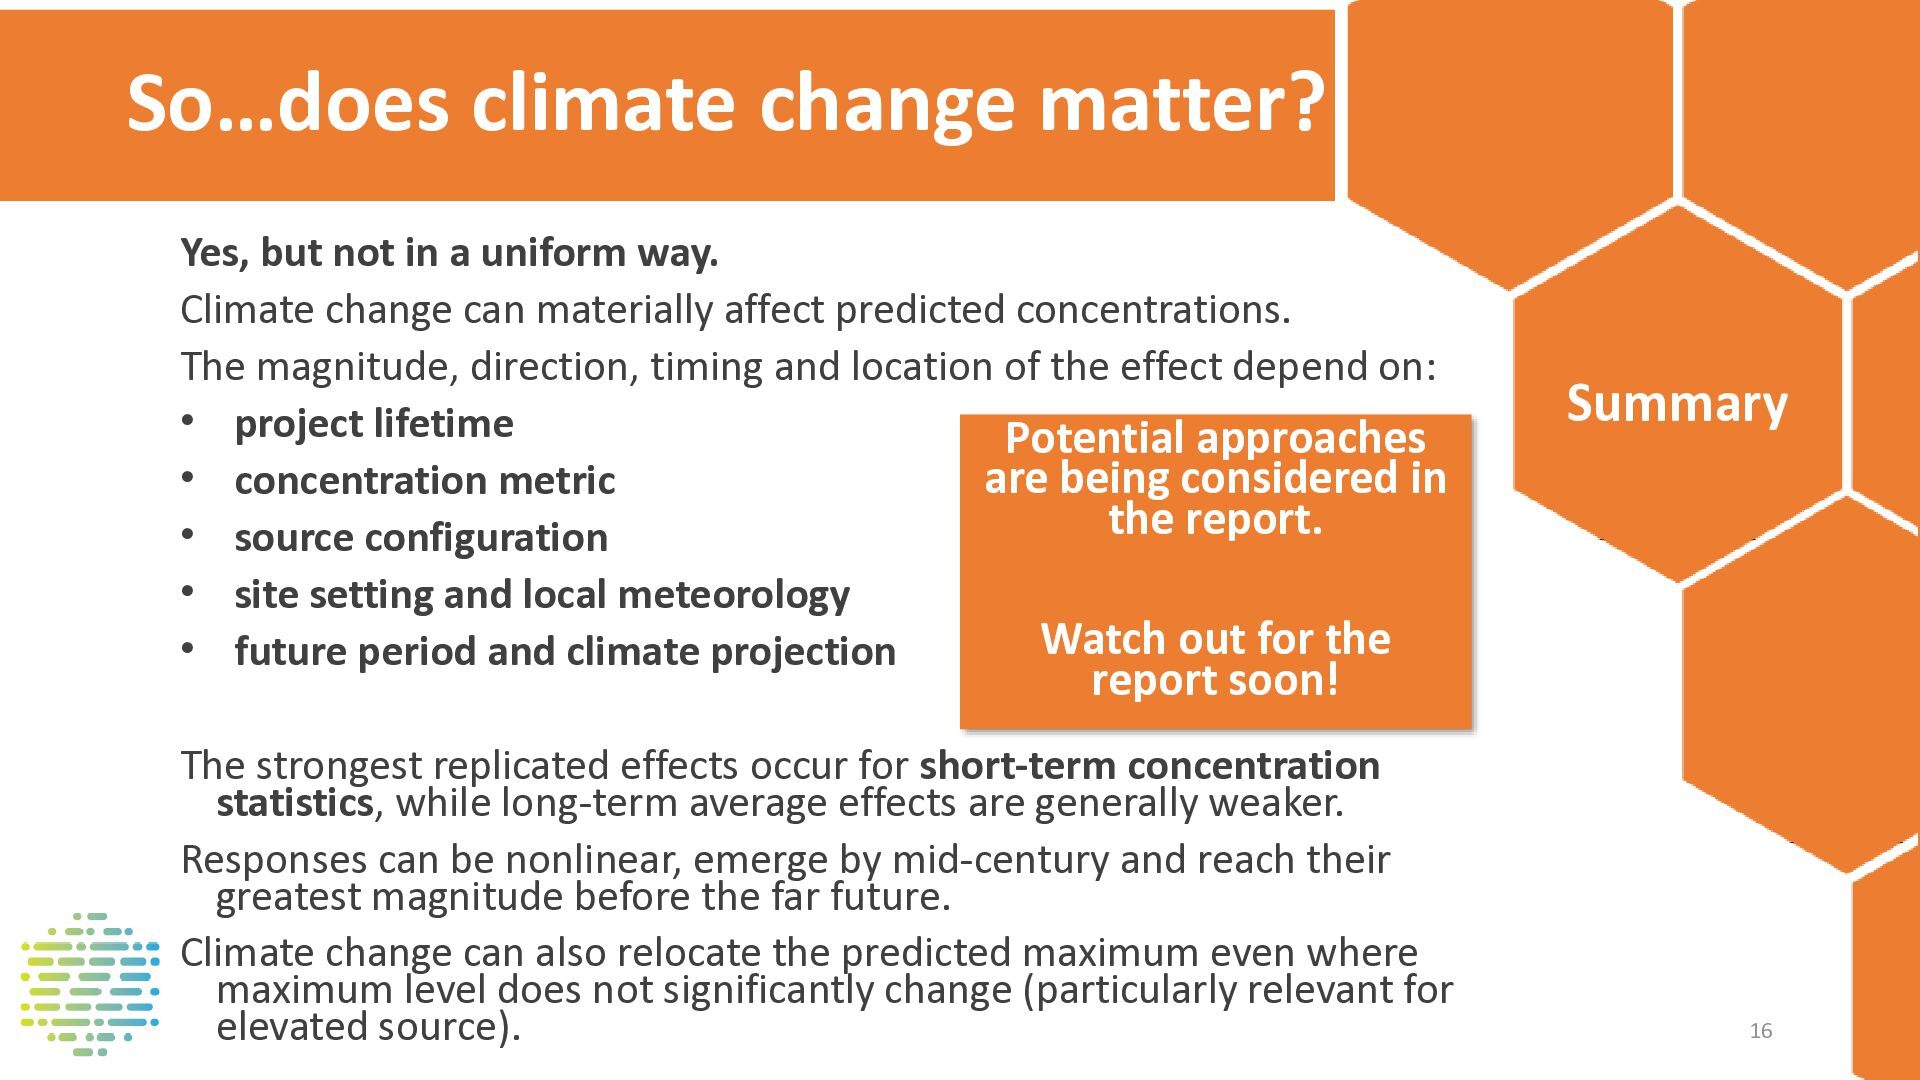
way. Climate change can materially affect predicted concentrations. The magnitude, direction, timing and location of the effect depend on: • project lifetime Potential approaches • concentration metric are being considered in the report. • source configuration • site setting and local meteorology Watch out for the • future period and climate projection Summary report soon! The strongest replicated effects occur for short-term concentration statistics, while long-term average effects are generally weaker. Responses can be nonlinear, emerge by mid-century and reach their greatest magnitude before the far future. Climate change can also relocate the predicted maximum even where maximum level does not significantly change (particularly relevant for elevated source). 16


 iesevents
 marktimemedia
 axbom
 jakevdp
 takai
 cromwellryan
 samanthasiow
 bkeepers
 madoxten
 geoffreycrofte
 sugarenia
 iamctodd
 danielanewman