vehicle emissions and concentration source apportionment Naomi Farren1, Samuel Wilson1, Marvin Shaw1, Yoann Bernard3, Kaylin Lee3 and Mallery Crowe3 and David Carslaw1,2 ROUTES TO CLEAN AIR, BIRMINGHAM, 21–22 OCTOBER 2026 1 Wolfson Atmospheric Chemistry Laboratories, University of York 2 WSP 3 The International Council on Clean Transportation
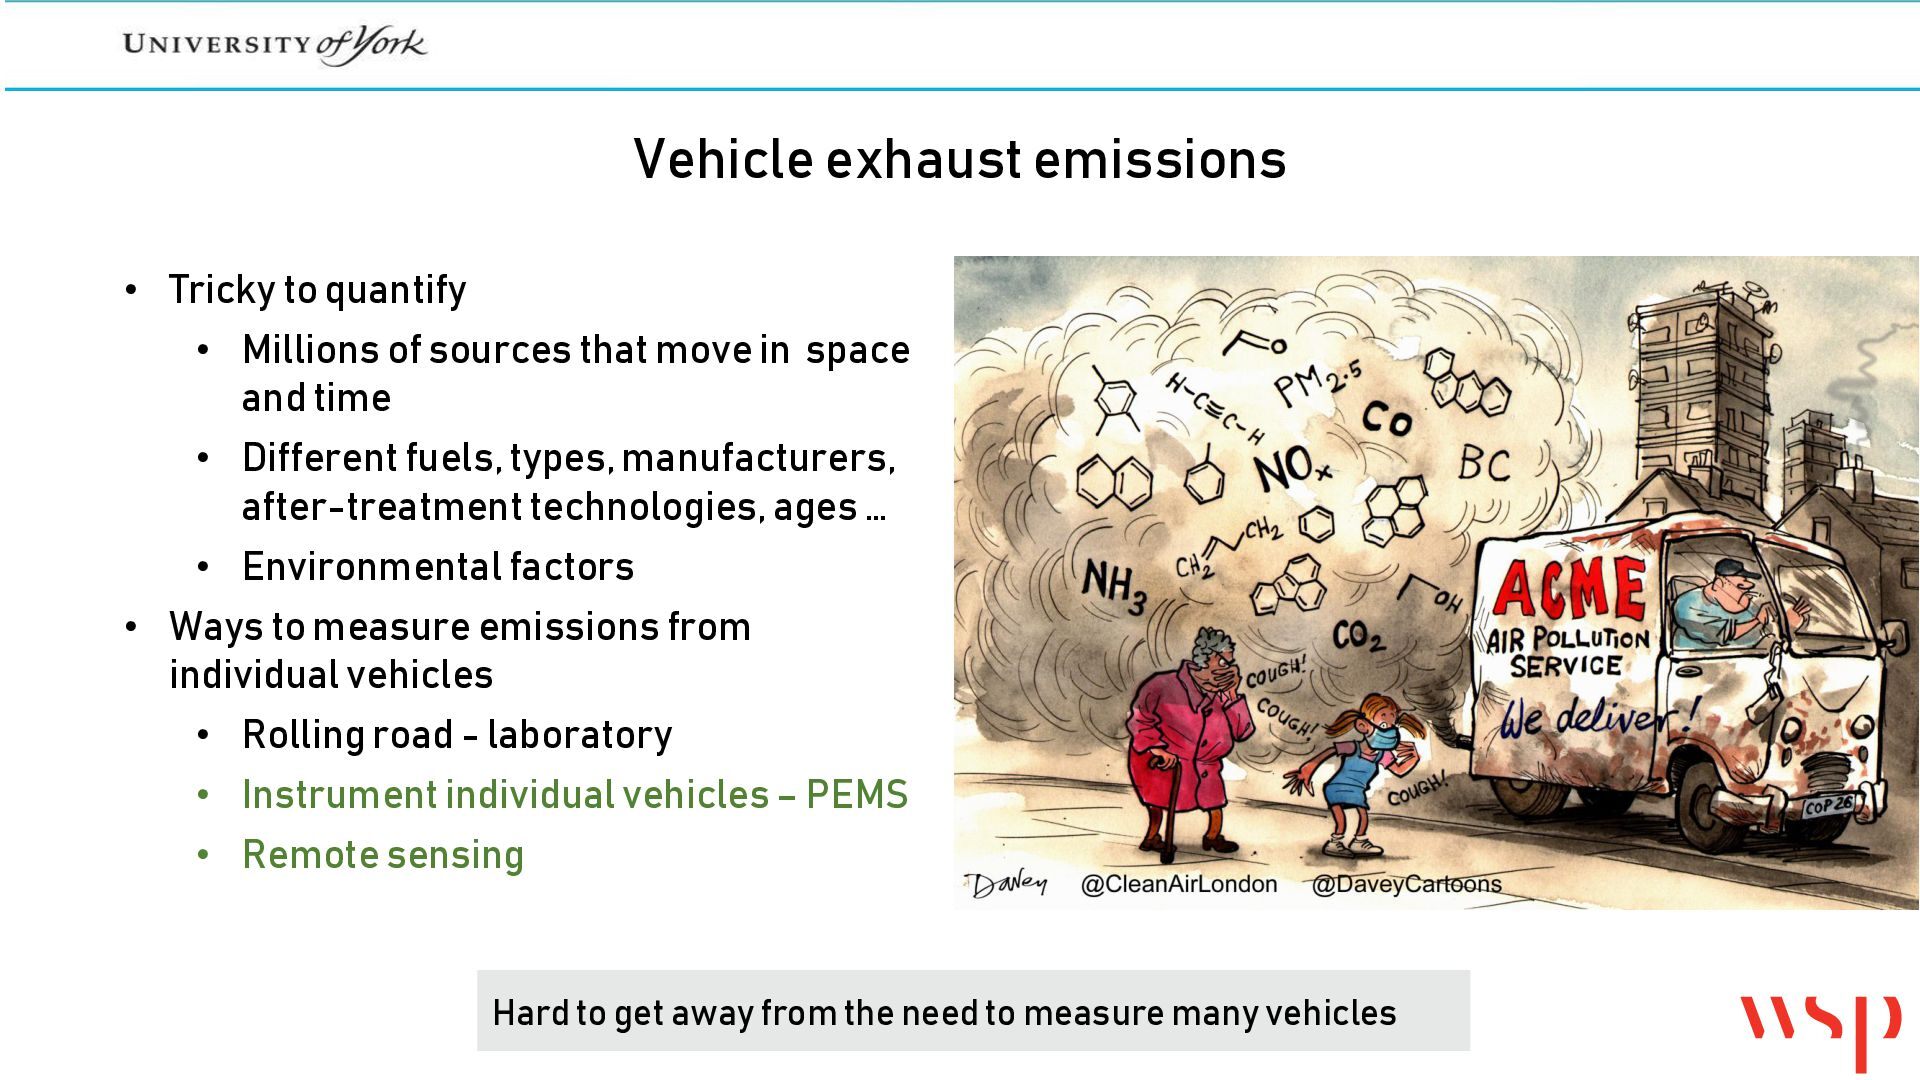
sources that move in space and time • Different fuels, types, manufacturers, after-treatment technologies, ages … • Environmental factors • Ways to measure emissions from individual vehicles • Rolling road - laboratory • Instrument individual vehicles – PEMS • Remote sensing Hard to get away from the need to measure many vehicles
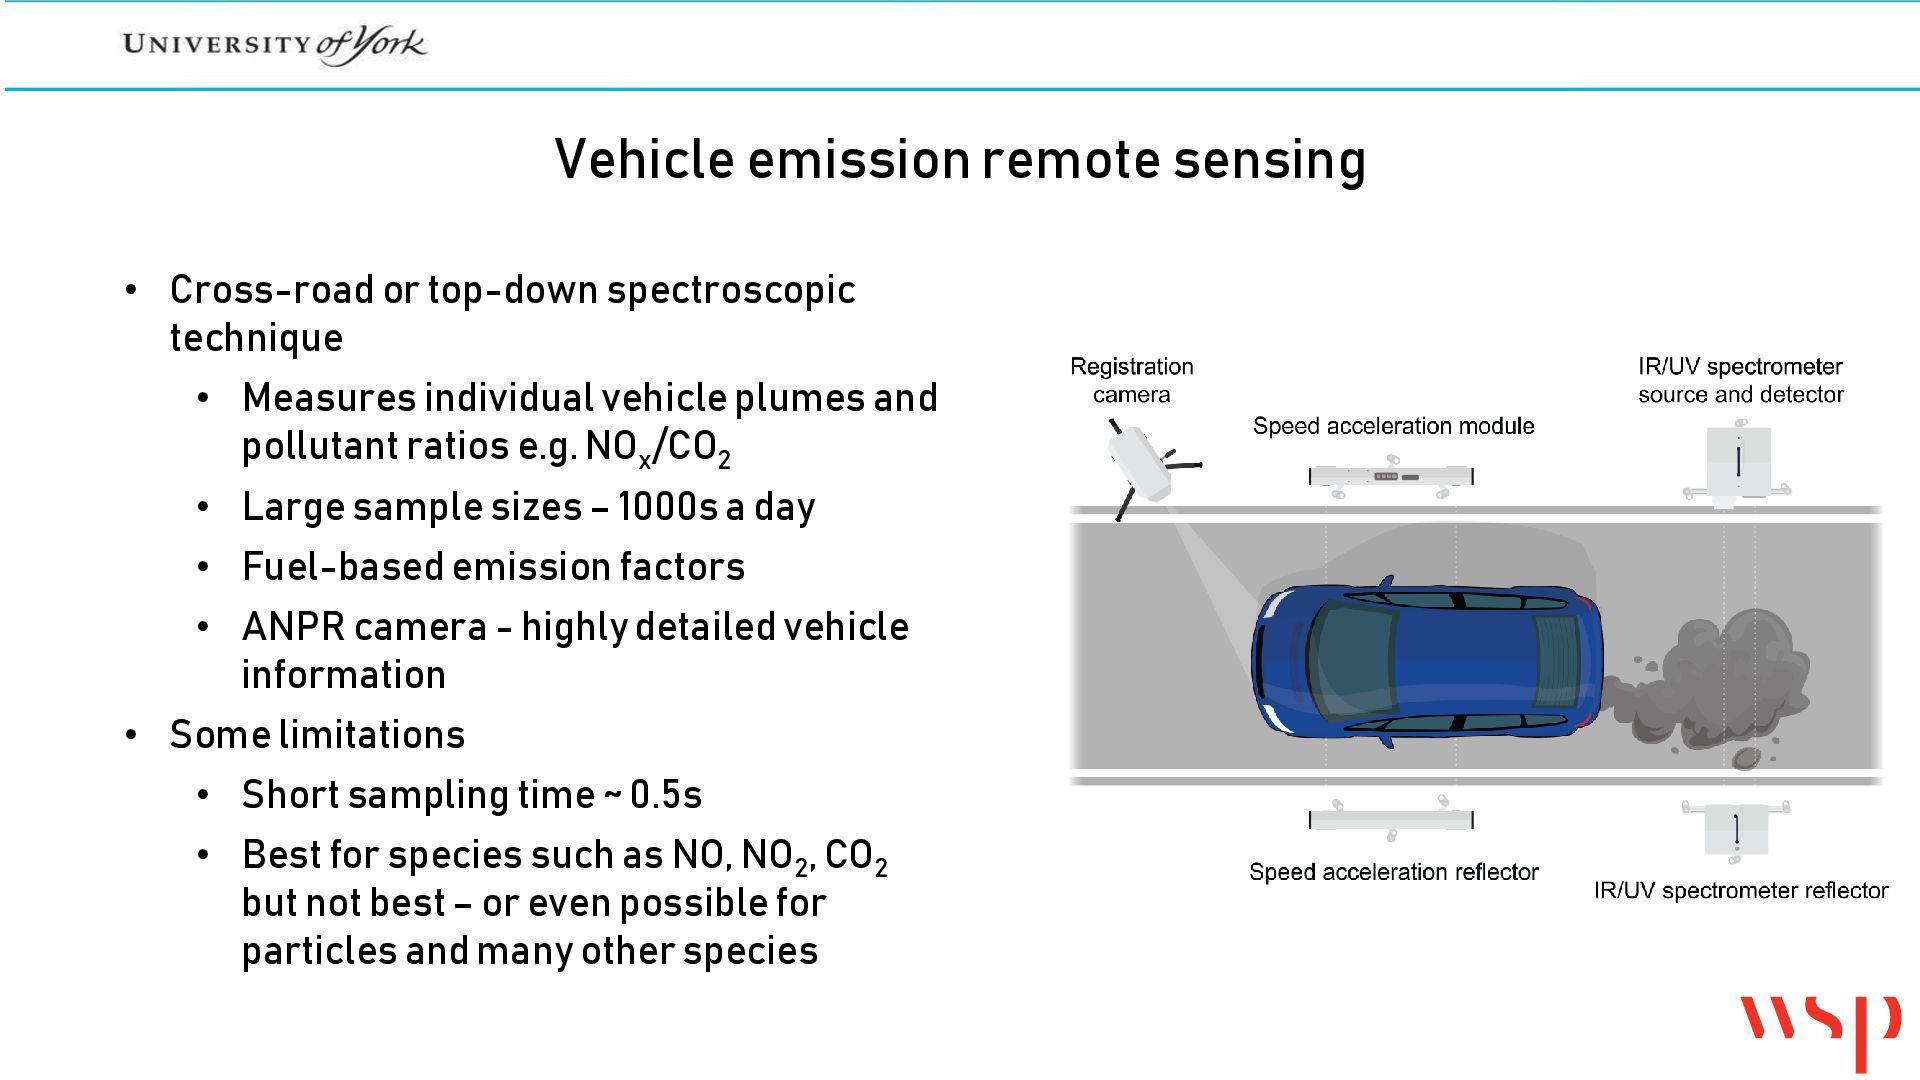
• Measures individual vehicle plumes and pollutant ratios e.g. NOx/CO2 • Large sample sizes – 1000s a day • Fuel-based emission factors • ANPR camera - highly detailed vehicle information • Some limitations • Short sampling time ~ 0.5s • Best for species such as NO, NO2, CO2 but not best – or even possible for particles and many other species
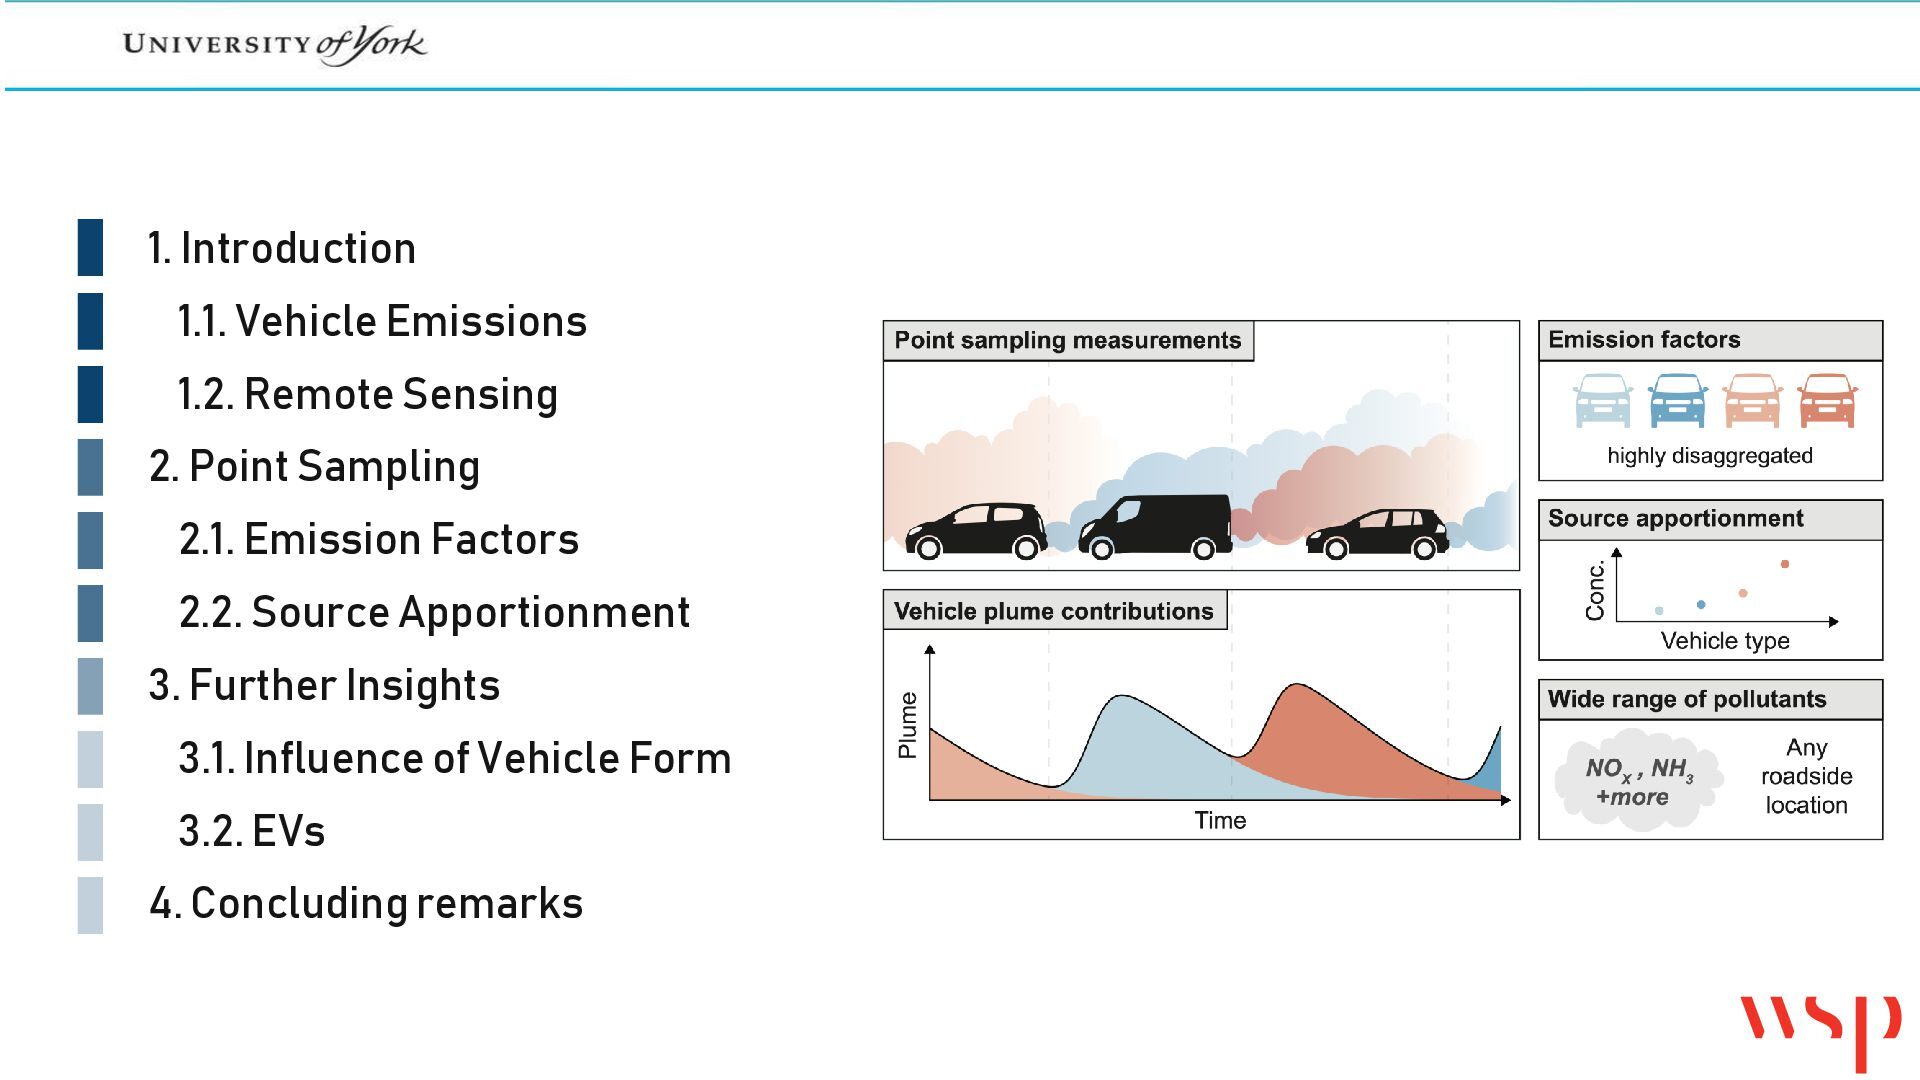
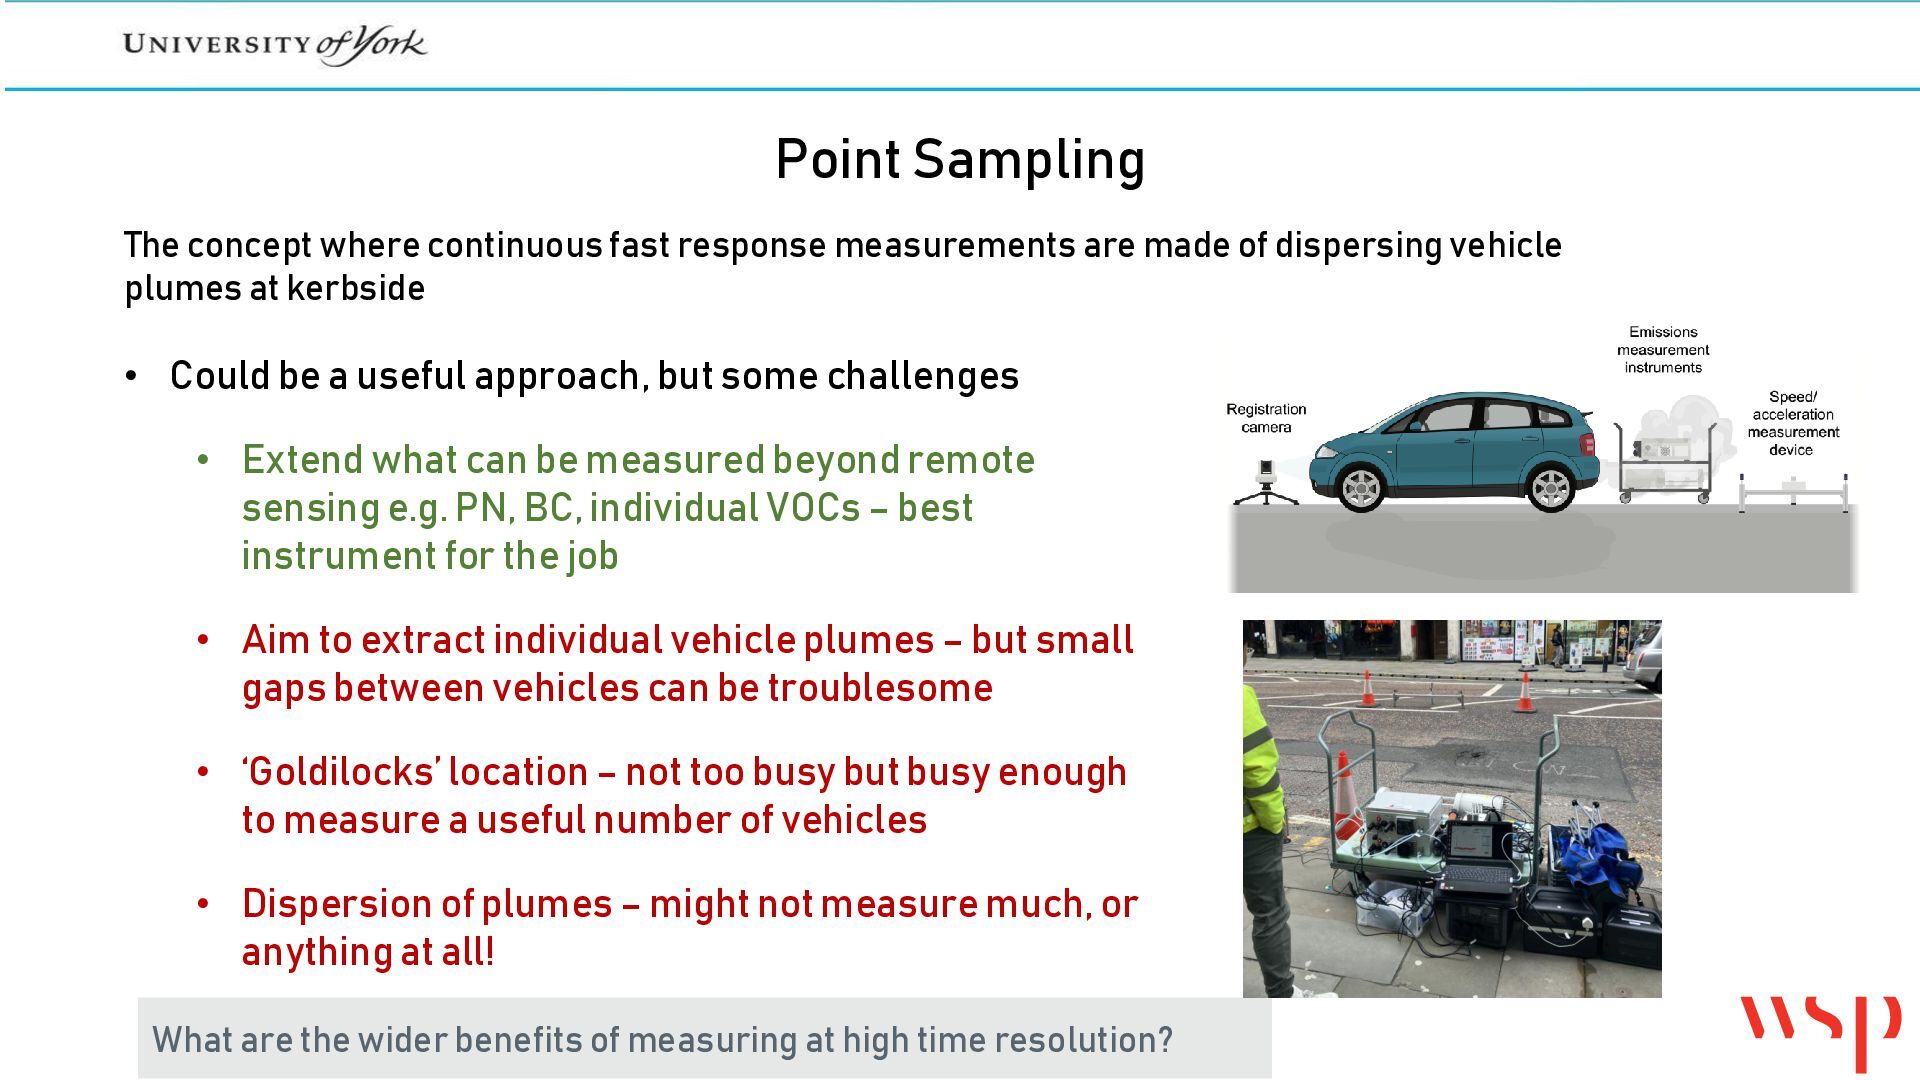
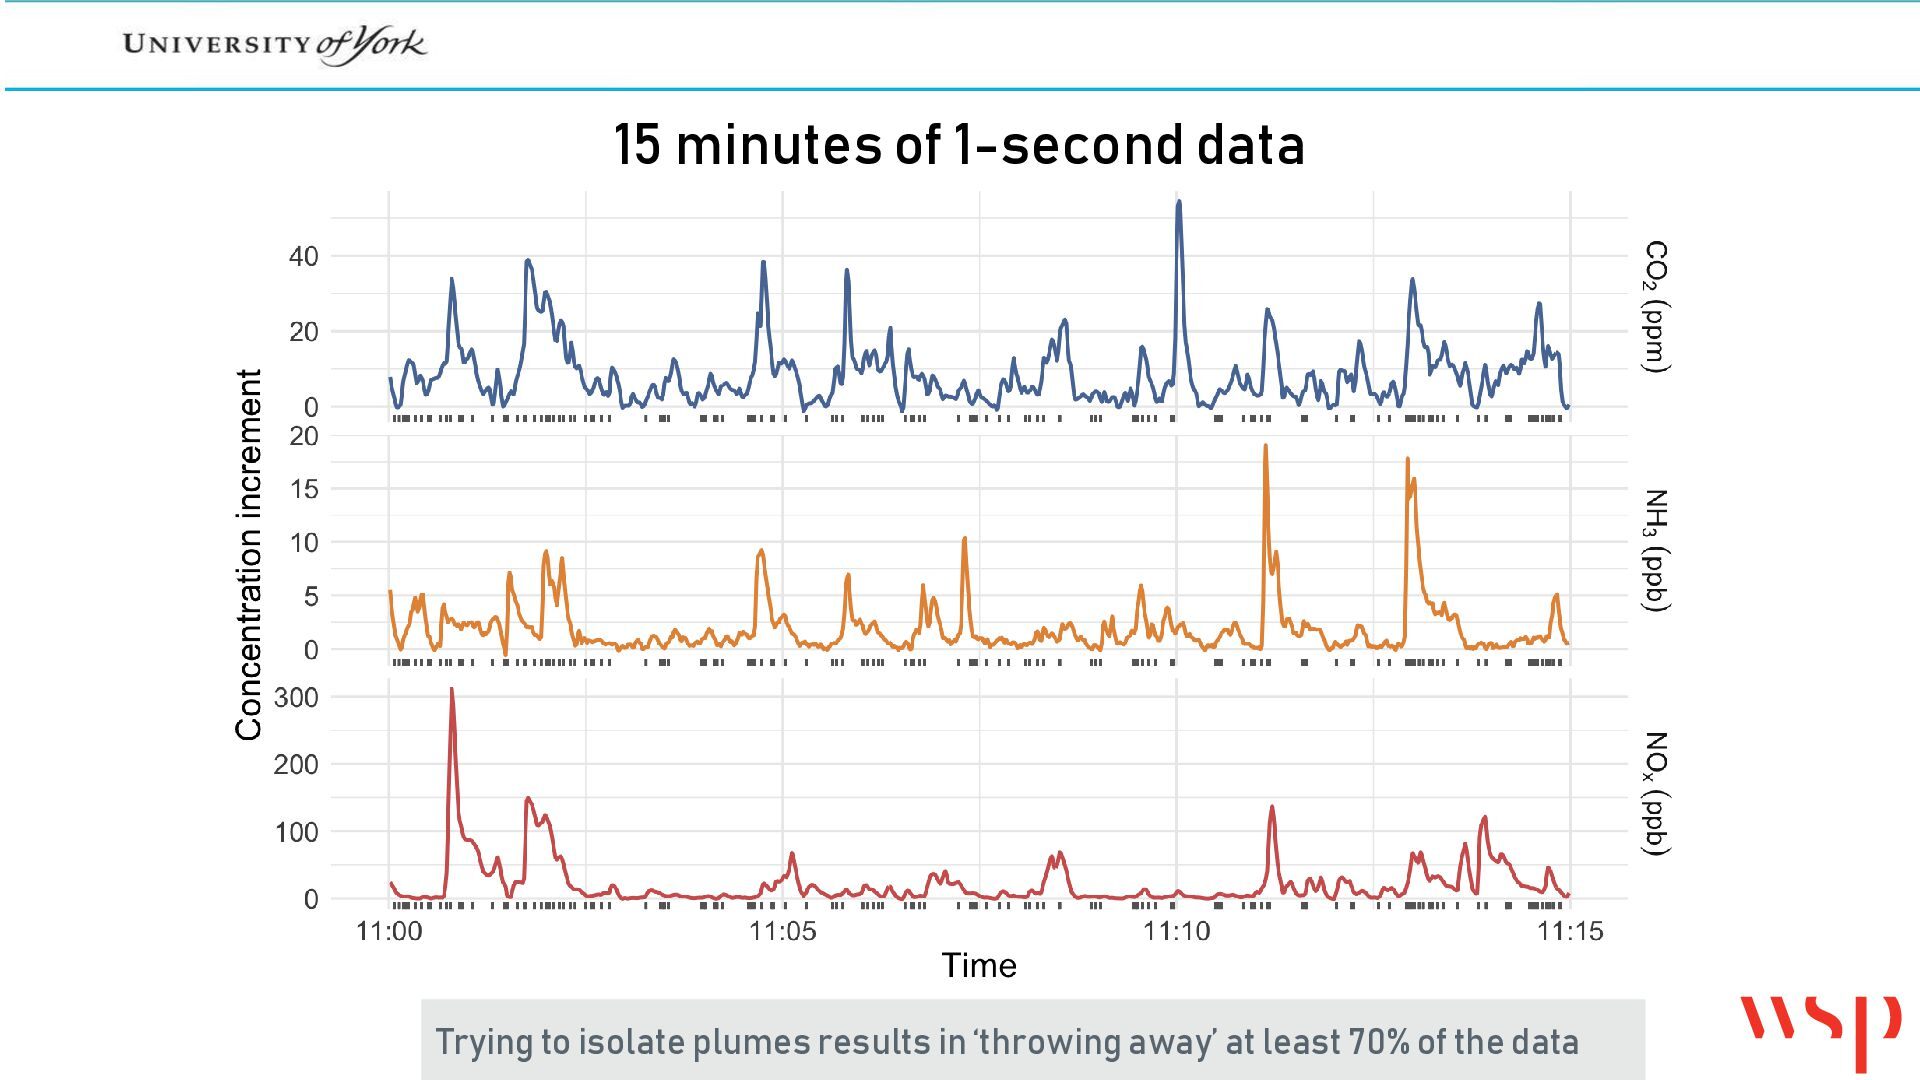
made of dispersing vehicle plumes at kerbside • Could be a useful approach, but some challenges • Extend what can be measured beyond remote sensing e.g. PN, BC, individual VOCs – best instrument for the job • Aim to extract individual vehicle plumes – but small gaps between vehicles can be troublesome • ‘Goldilocks’ location – not too busy but busy enough to measure a useful number of vehicles • Dispersion of plumes – might not measure much, or anything at all! What are the wider benefits of measuring at high time resolution?
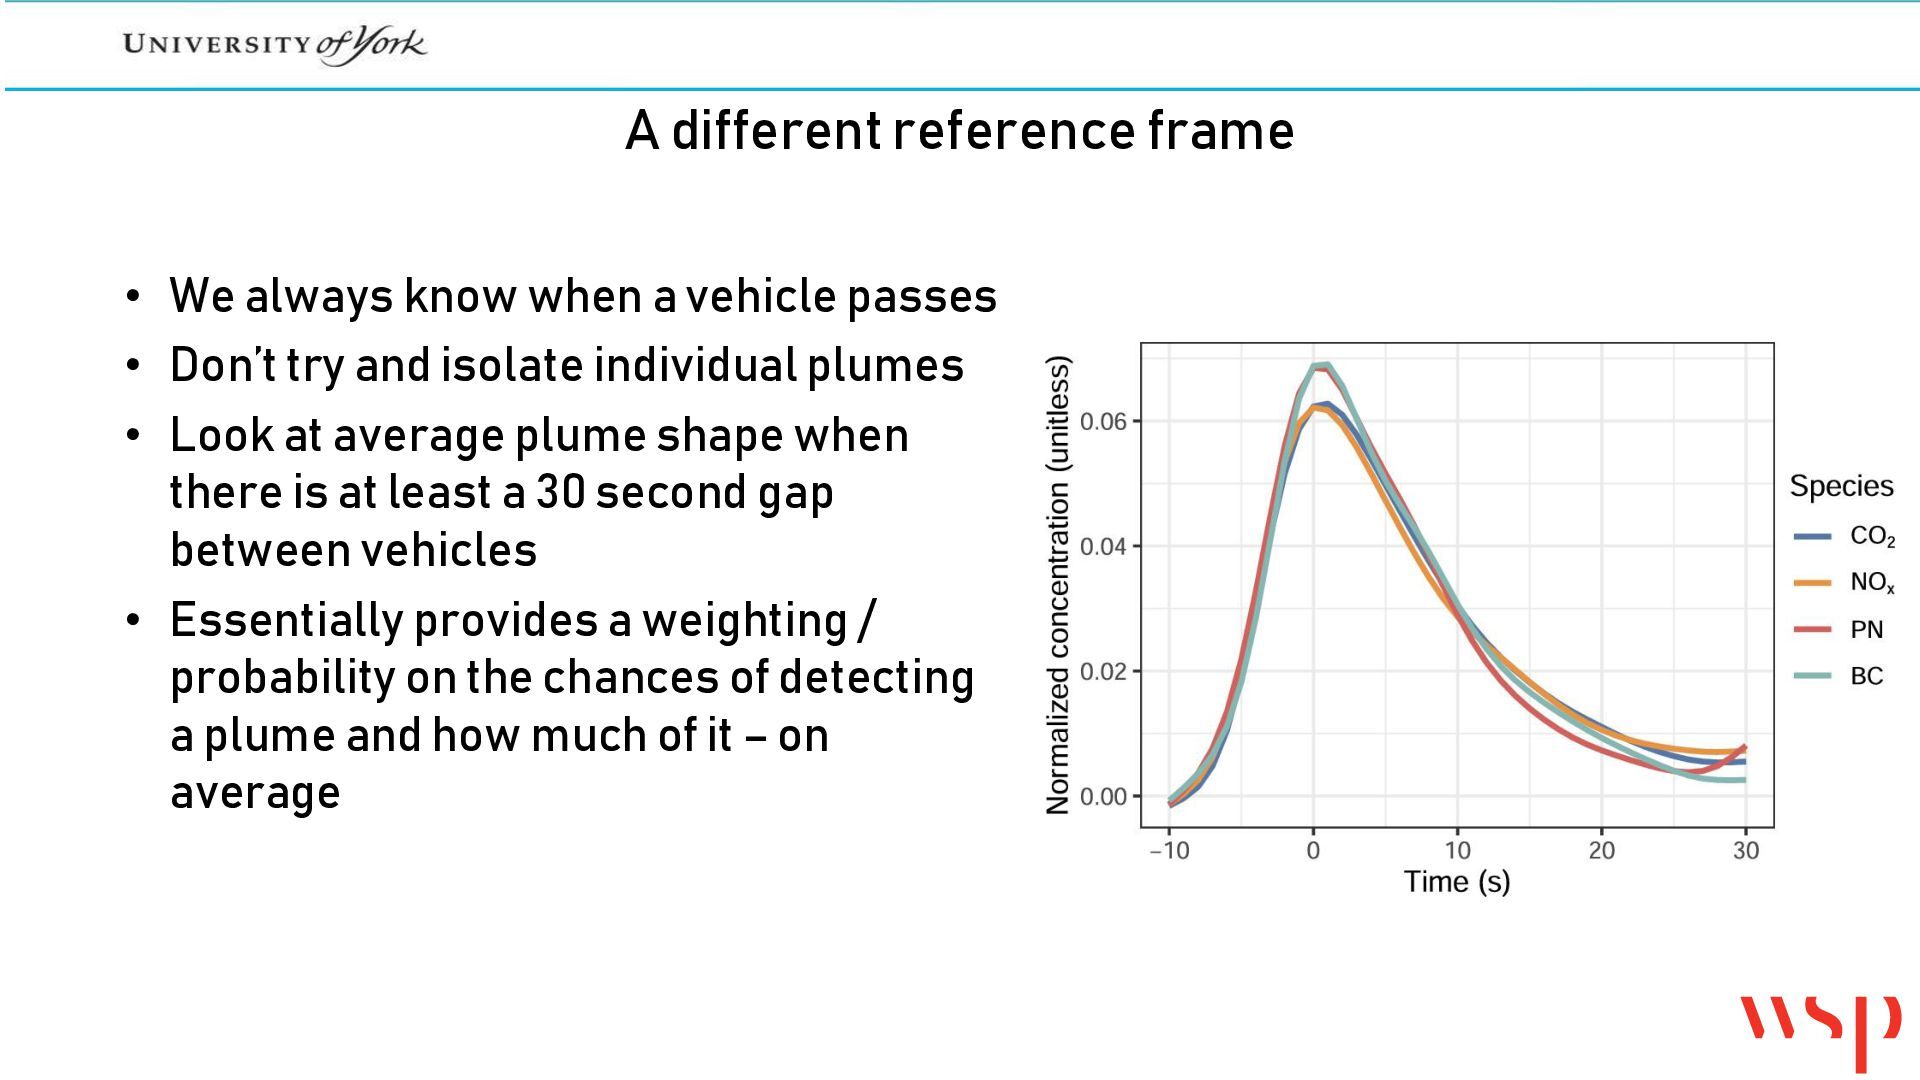
vehicle passes • Don’t try and isolate individual plumes • Look at average plume shape when there is at least a 30 second gap between vehicles • Essentially provides a weighting / probability on the chances of detecting a plume and how much of it – on average
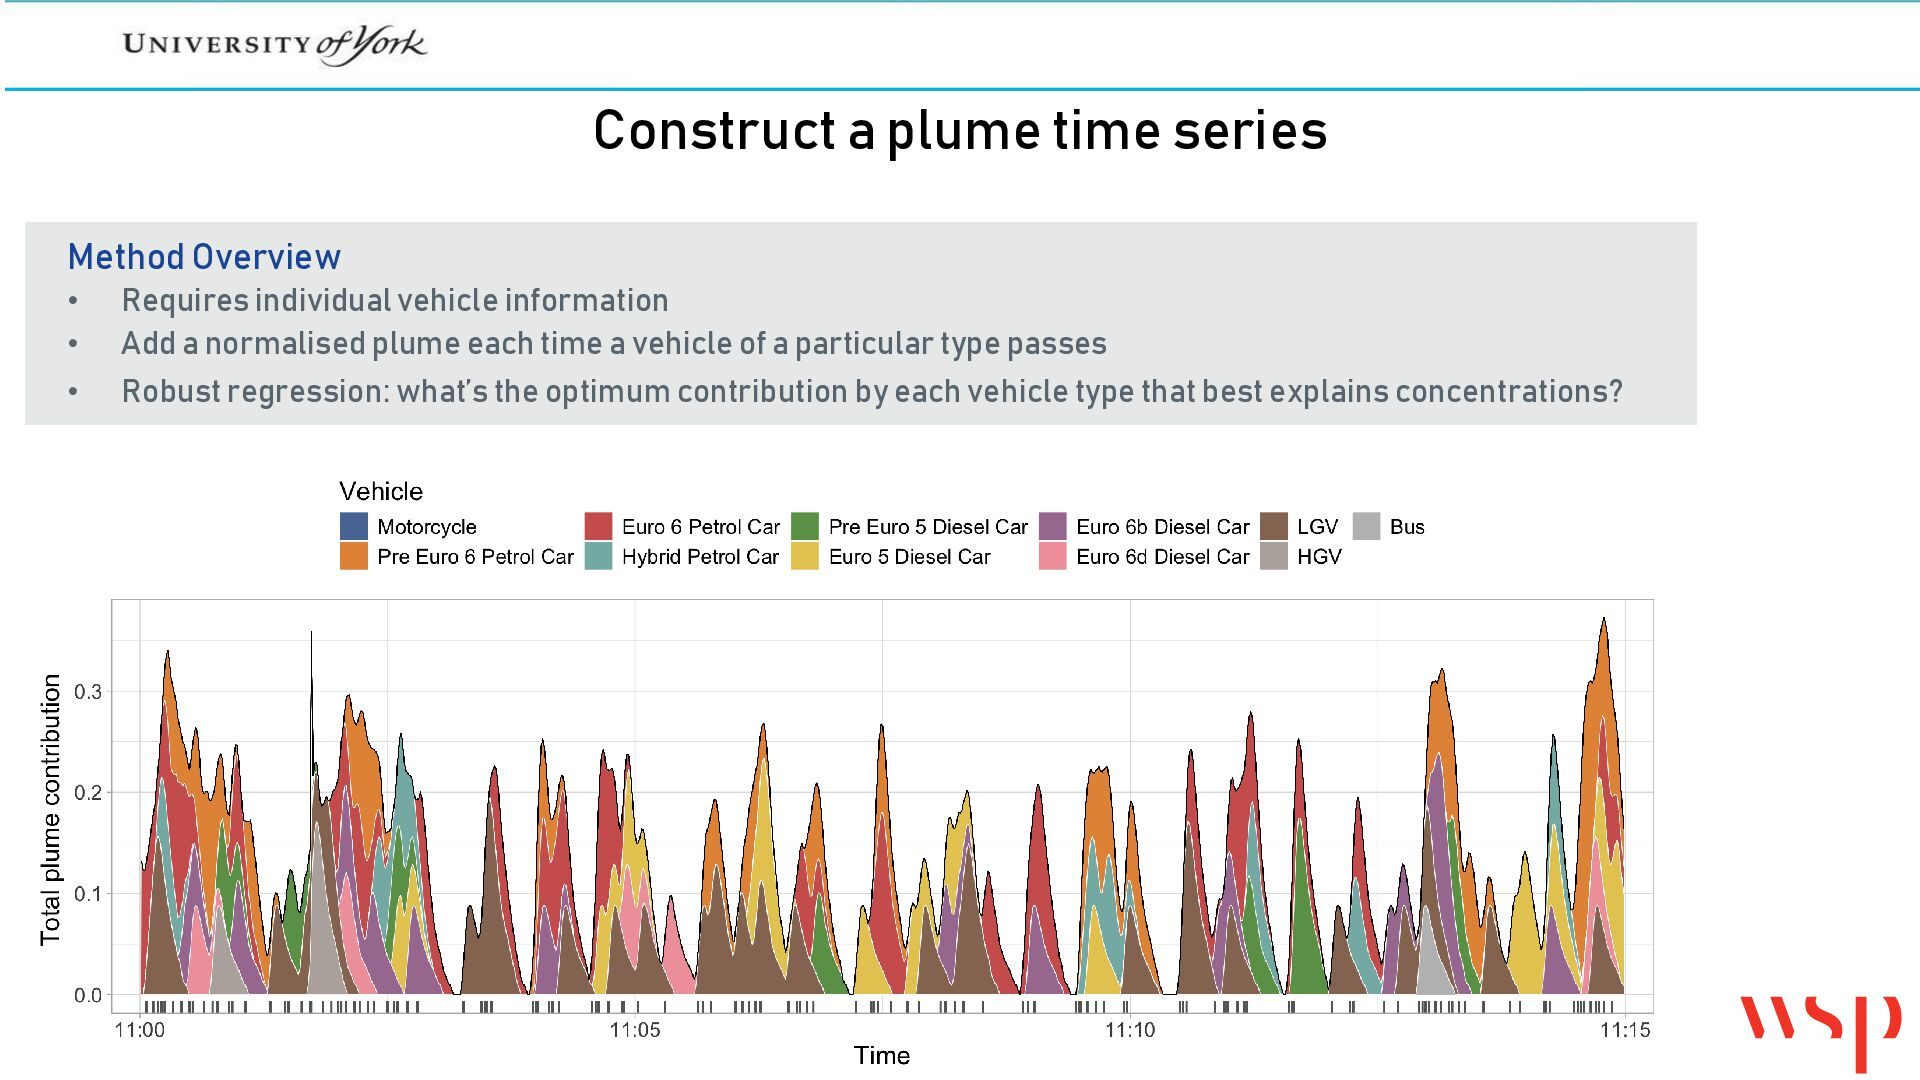
Requires individual vehicle information Add a normalised plume each time a vehicle of a particular type passes Robust regression: what’s the optimum contribution by each vehicle type that best explains concentrations?
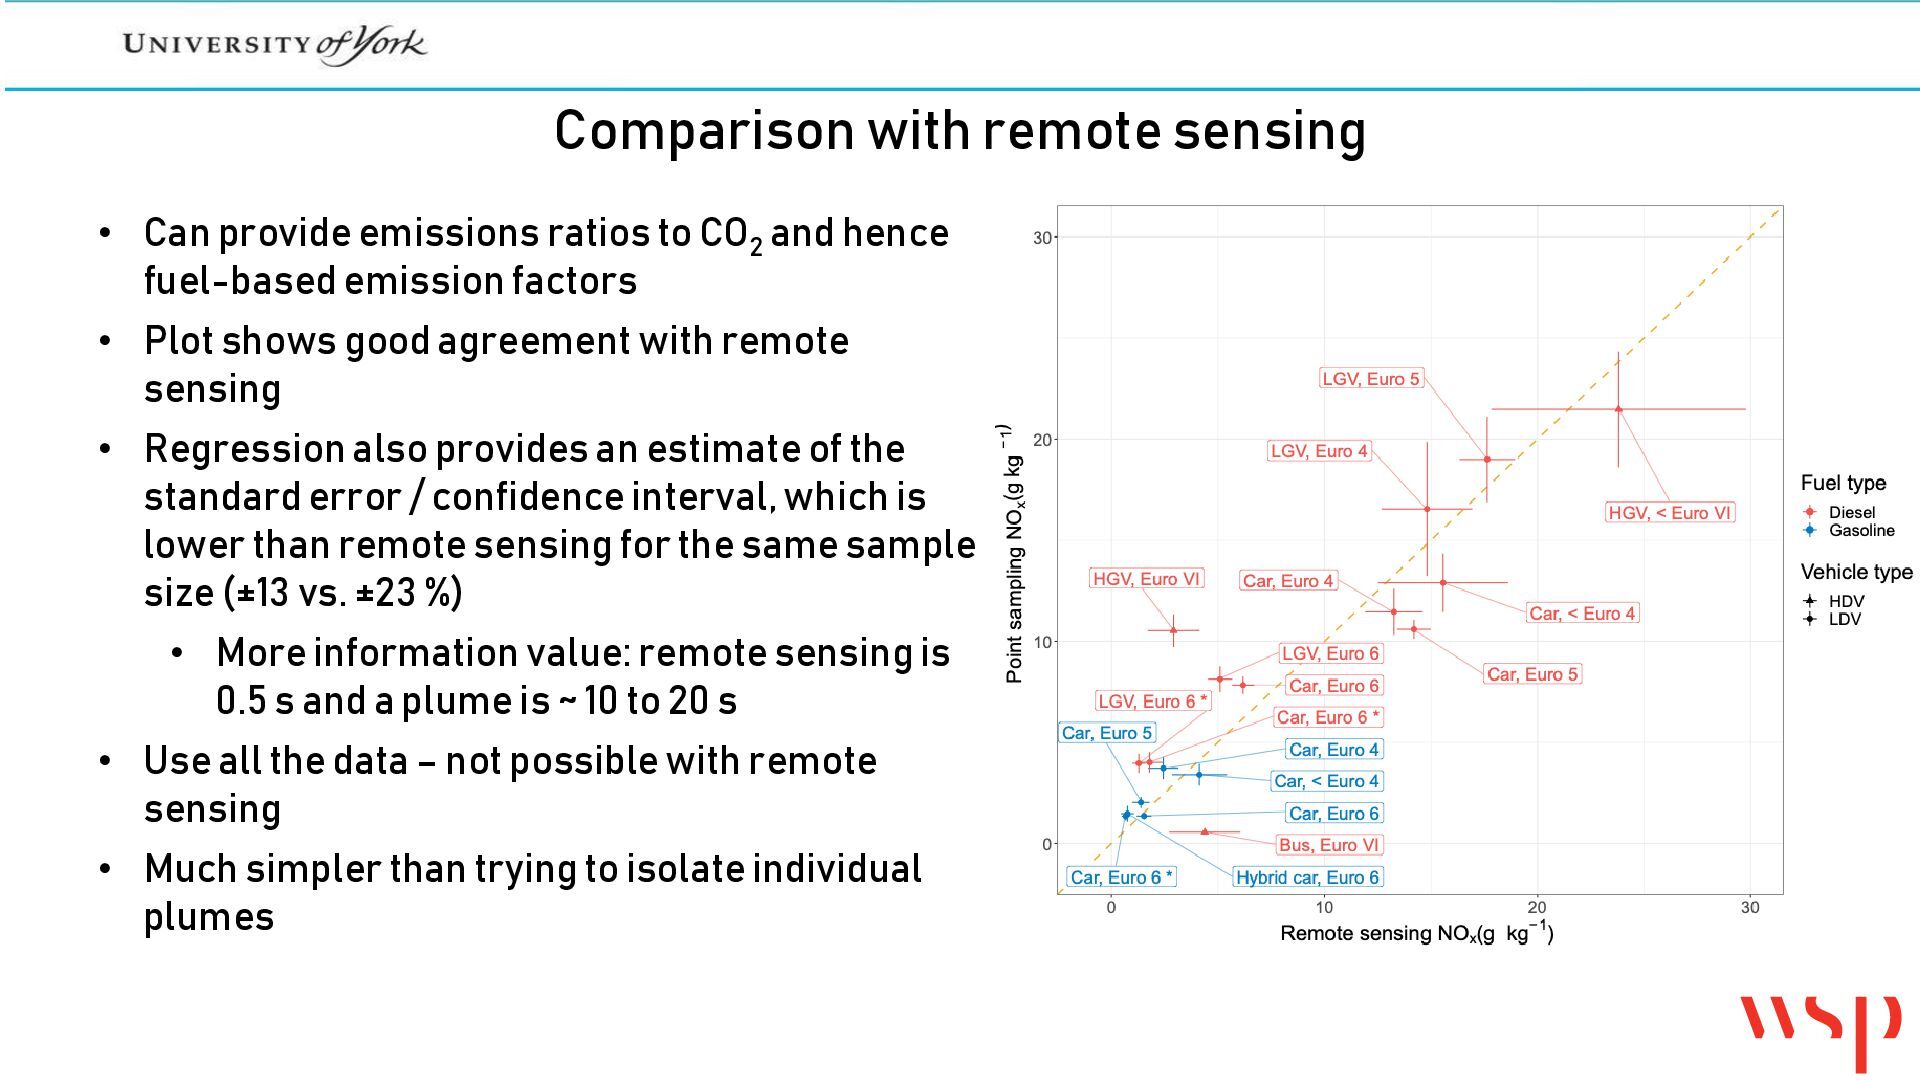
CO2 and hence fuel-based emission factors • Plot shows good agreement with remote sensing • Regression also provides an estimate of the standard error / confidence interval, which is lower than remote sensing for the same sample size (±13 vs. ±23 %) • More information value: remote sensing is 0.5 s and a plume is ~ 10 to 20 s • Use all the data – not possible with remote sensing • Much simpler than trying to isolate individual plumes
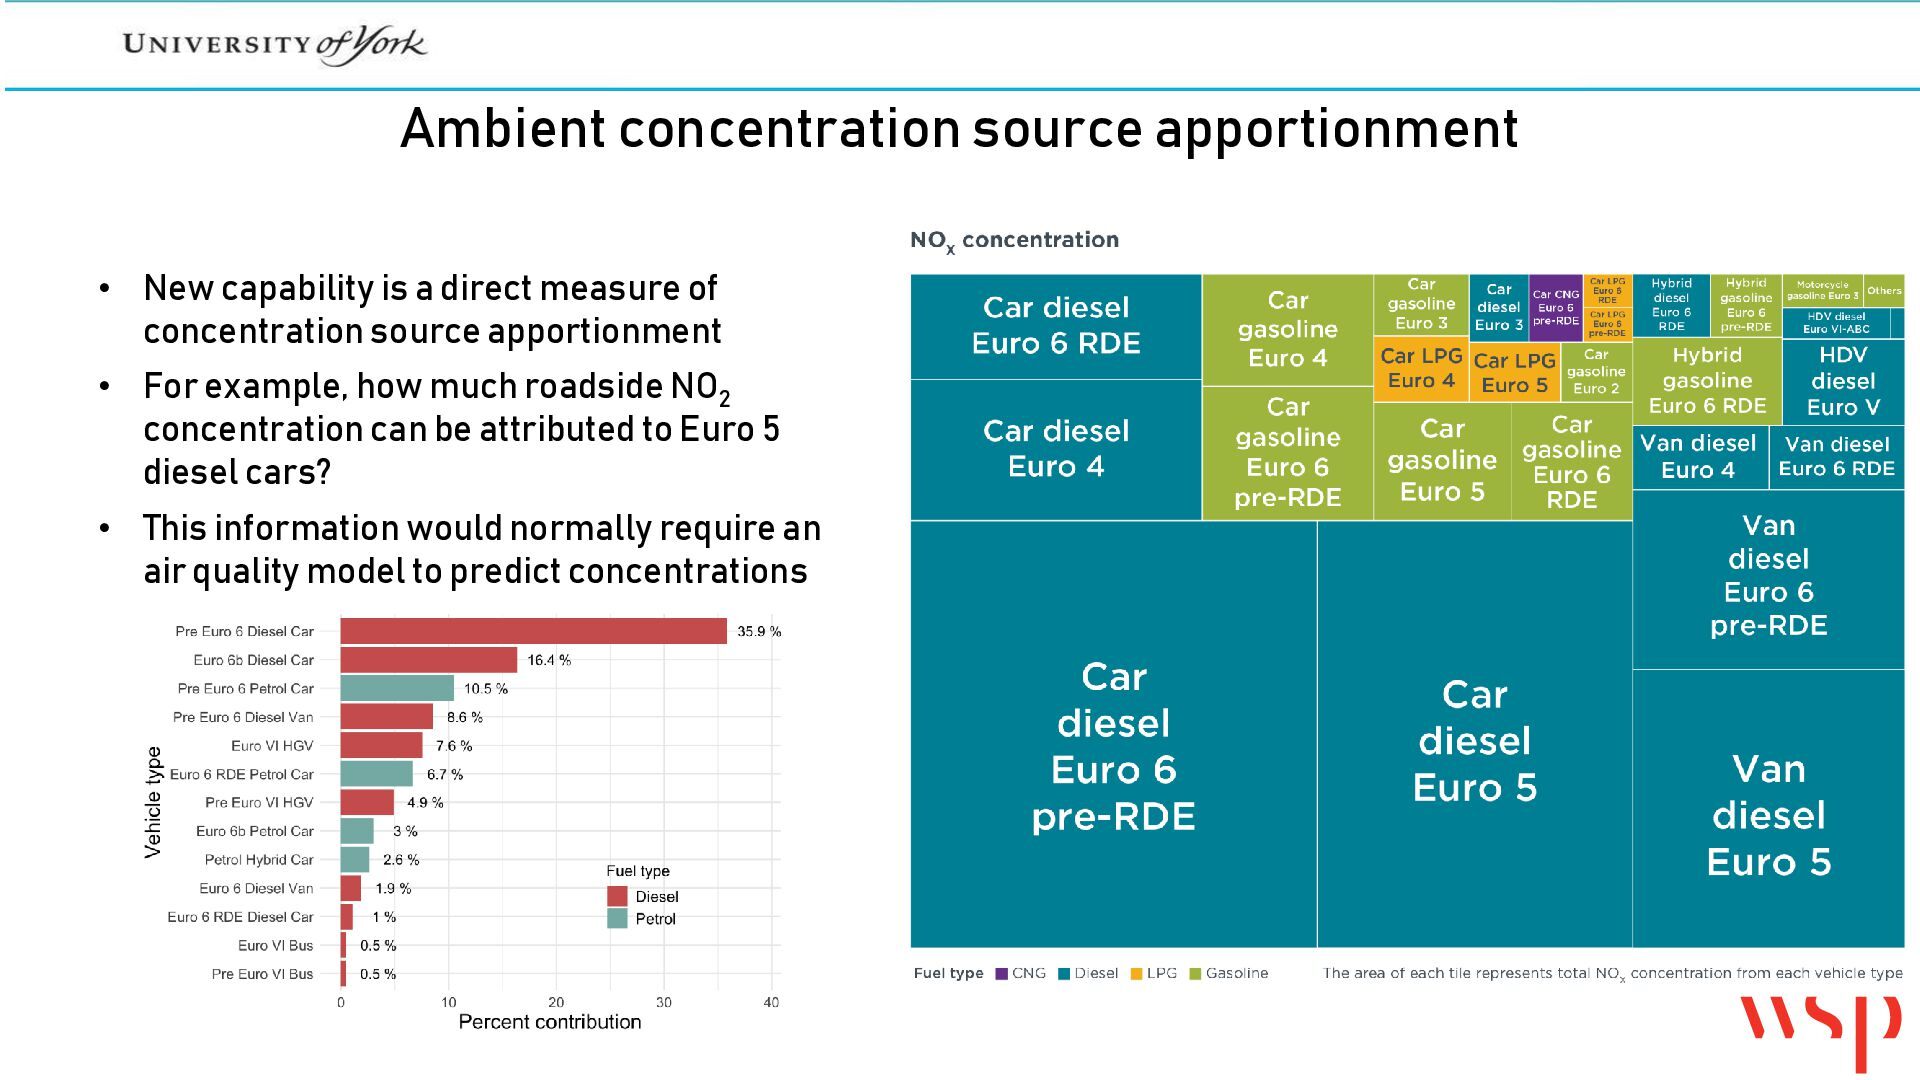
measure of concentration source apportionment • For example, how much roadside NO2 concentration can be attributed to Euro 5 diesel cars? • This information would normally require an air quality model to predict concentrations
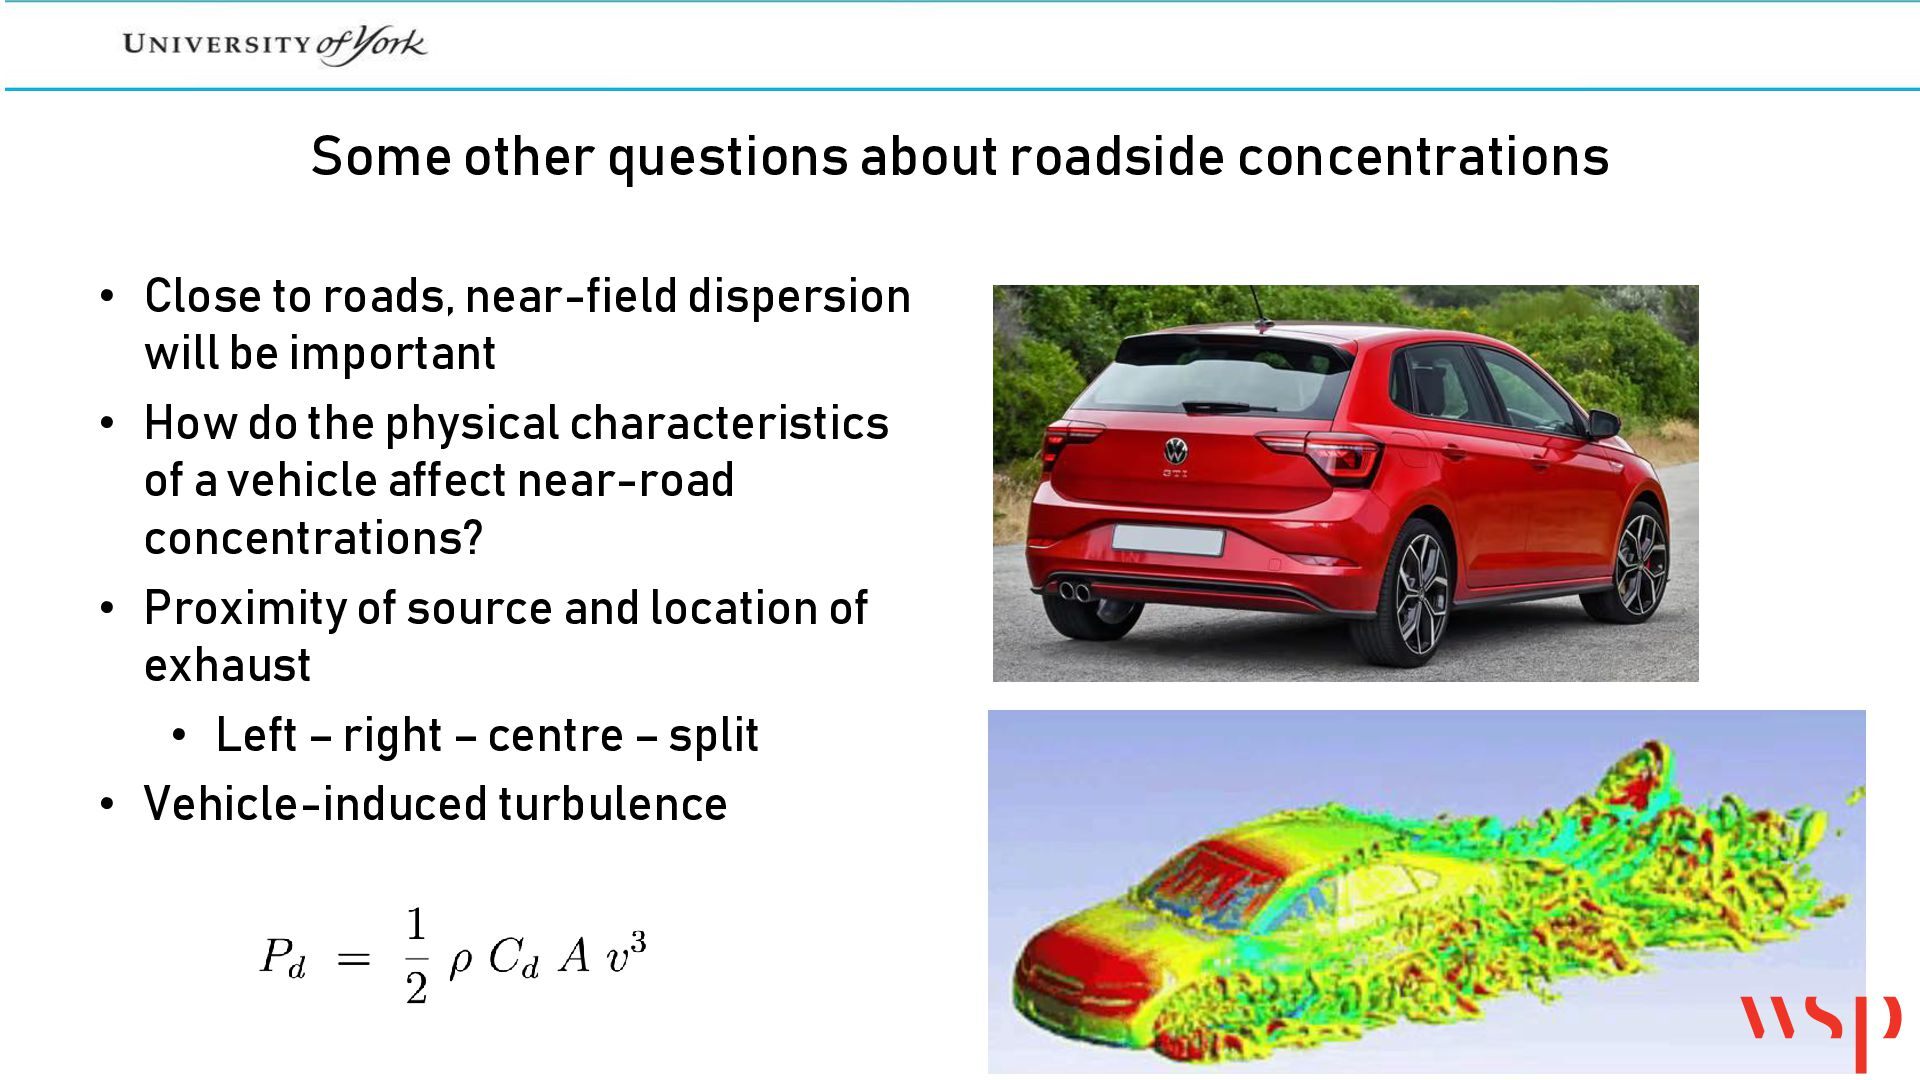
near-field dispersion will be important • How do the physical characteristics of a vehicle affect near-road concentrations? • Proximity of source and location of exhaust • Left – right – centre – split • Vehicle-induced turbulence
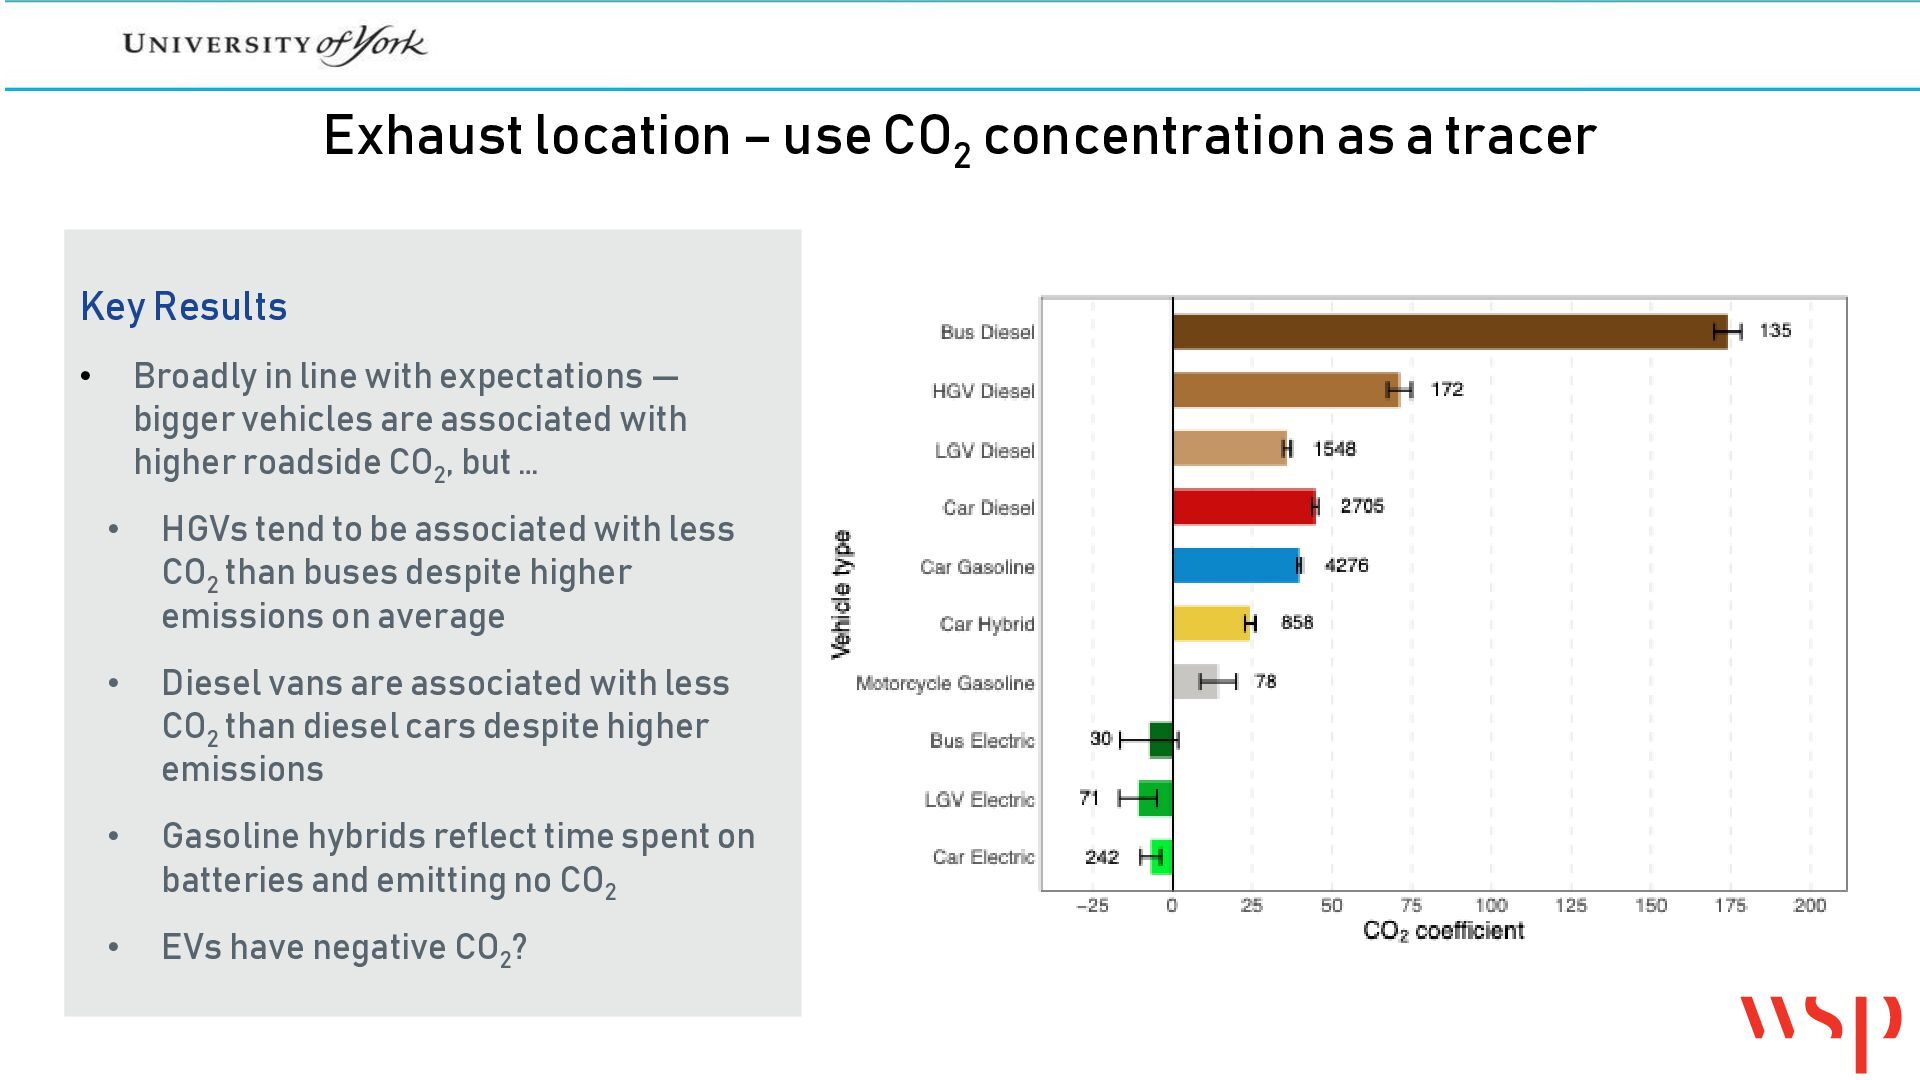
Results Broadly in line with expectations — bigger vehicles are associated with higher roadside CO2, but … • • HGVs tend to be associated with less CO2 than buses despite higher emissions on average • Diesel vans are associated with less CO2 than diesel cars despite higher emissions • Gasoline hybrids reflect time spent on batteries and emitting no CO2 • EVs have negative CO2?
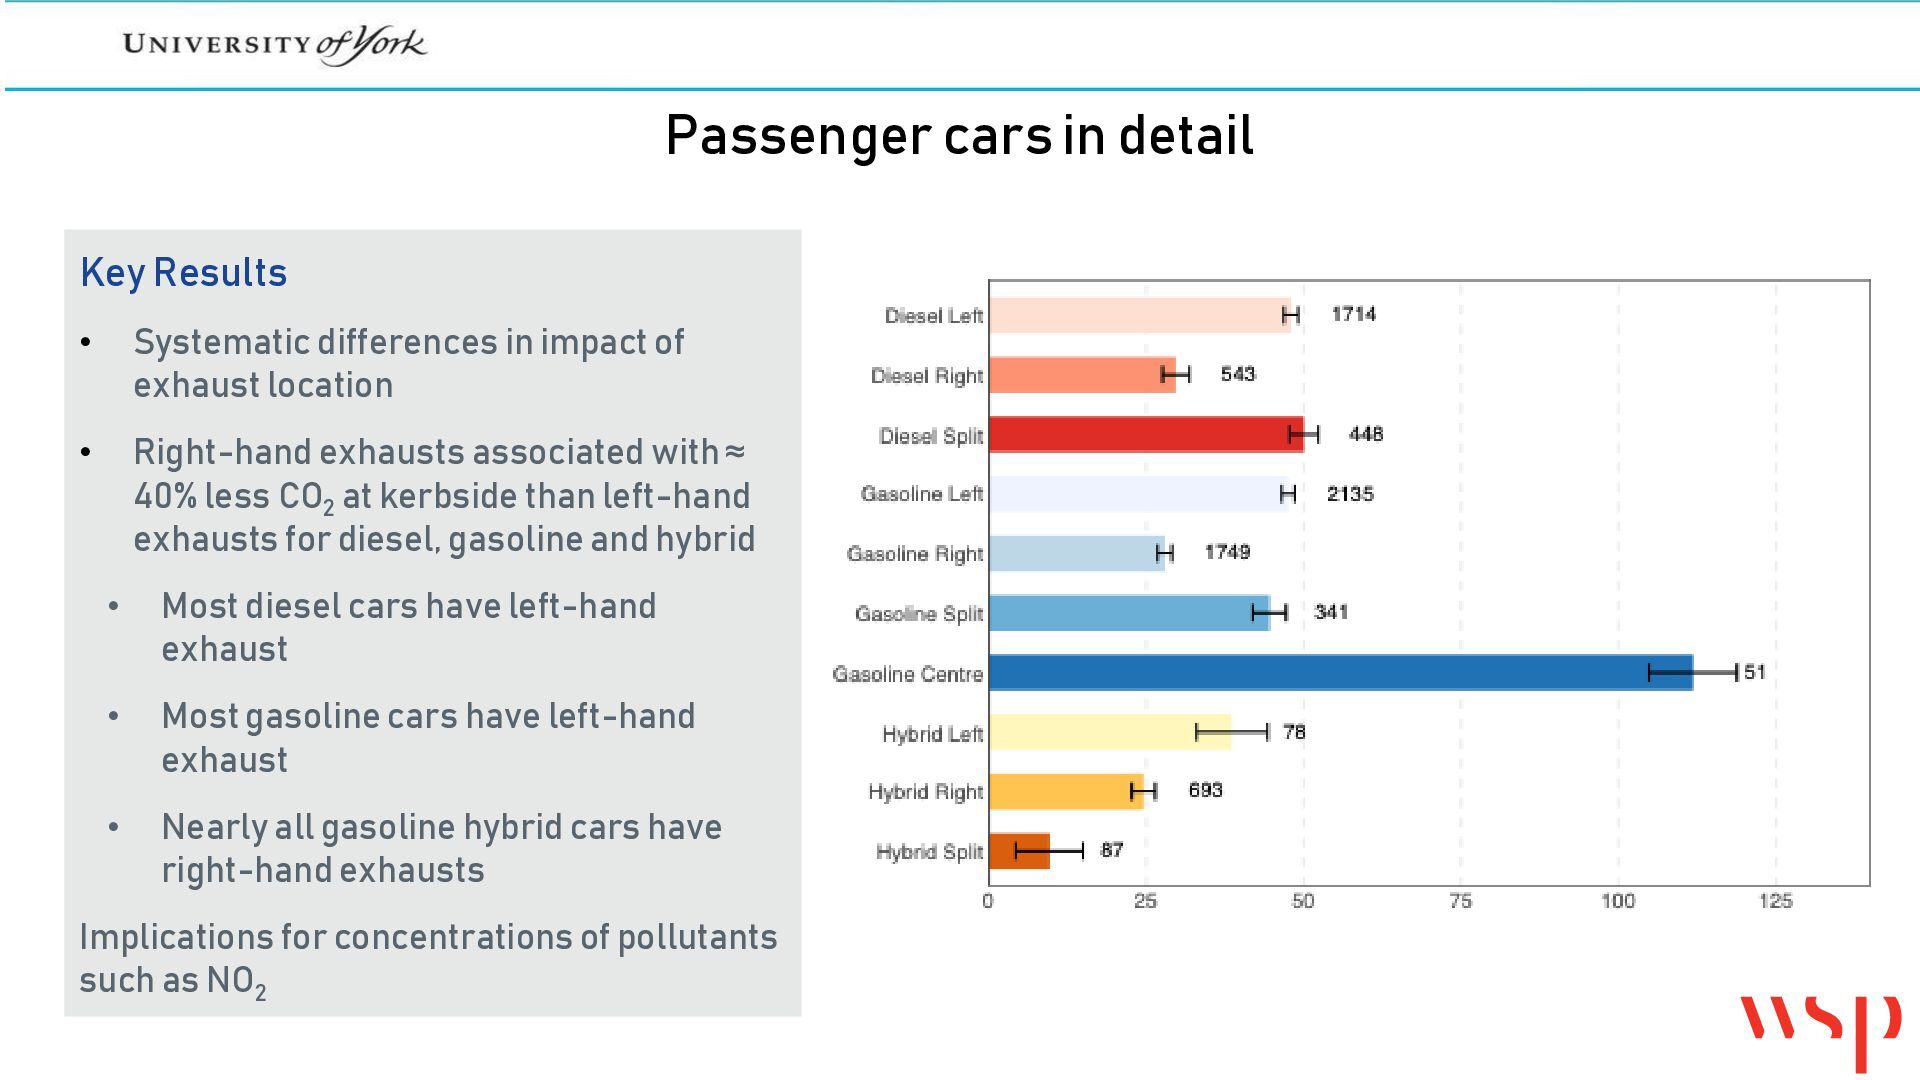
impact of exhaust location • Right-hand exhausts associated with ≈ 40% less CO2 at kerbside than left-hand exhausts for diesel, gasoline and hybrid • Most diesel cars have left-hand exhaust • Most gasoline cars have left-hand exhaust • Nearly all gasoline hybrid cars have right-hand exhausts Implications for concentrations of pollutants such as NO2
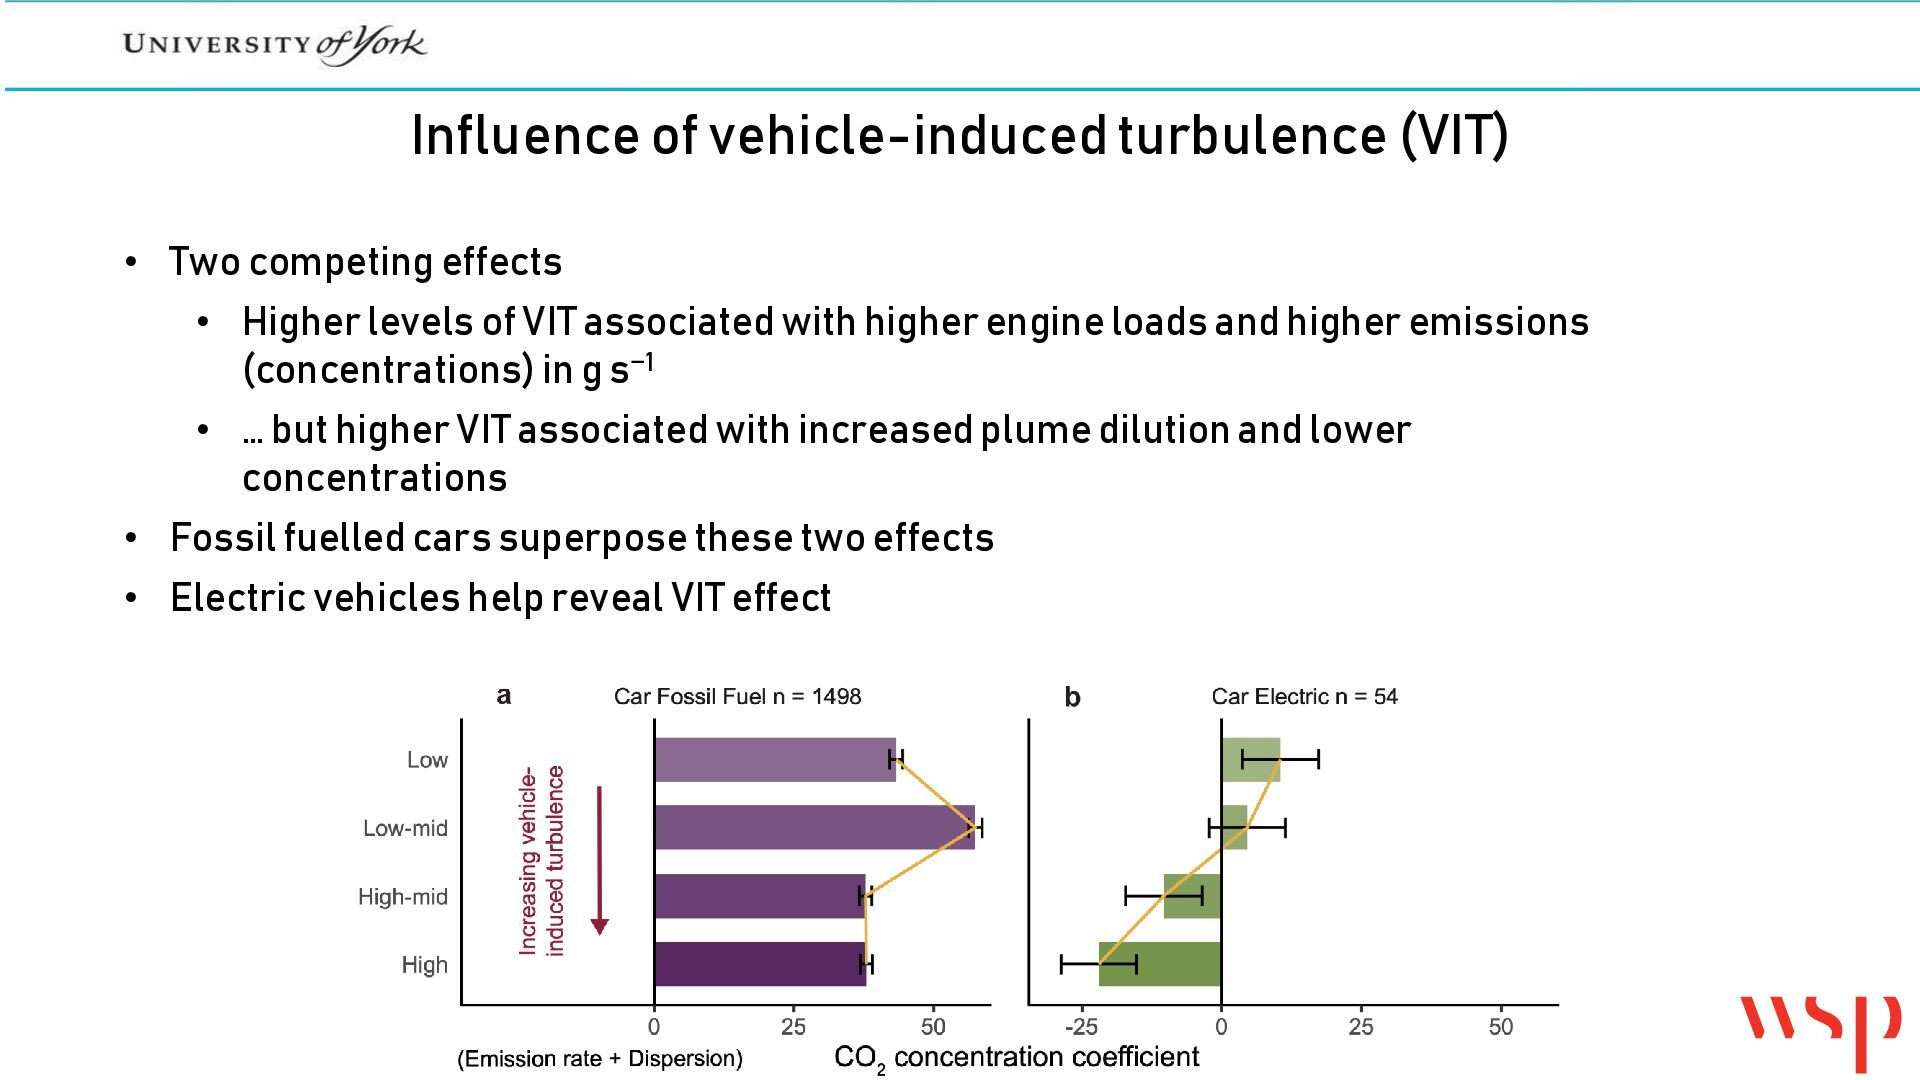
Higher levels of VIT associated with higher engine loads and higher emissions (concentrations) in g s−1 • … but higher VIT associated with increased plume dilution and lower concentrations • Fossil fuelled cars superpose these two effects • Electric vehicles help reveal VIT effect
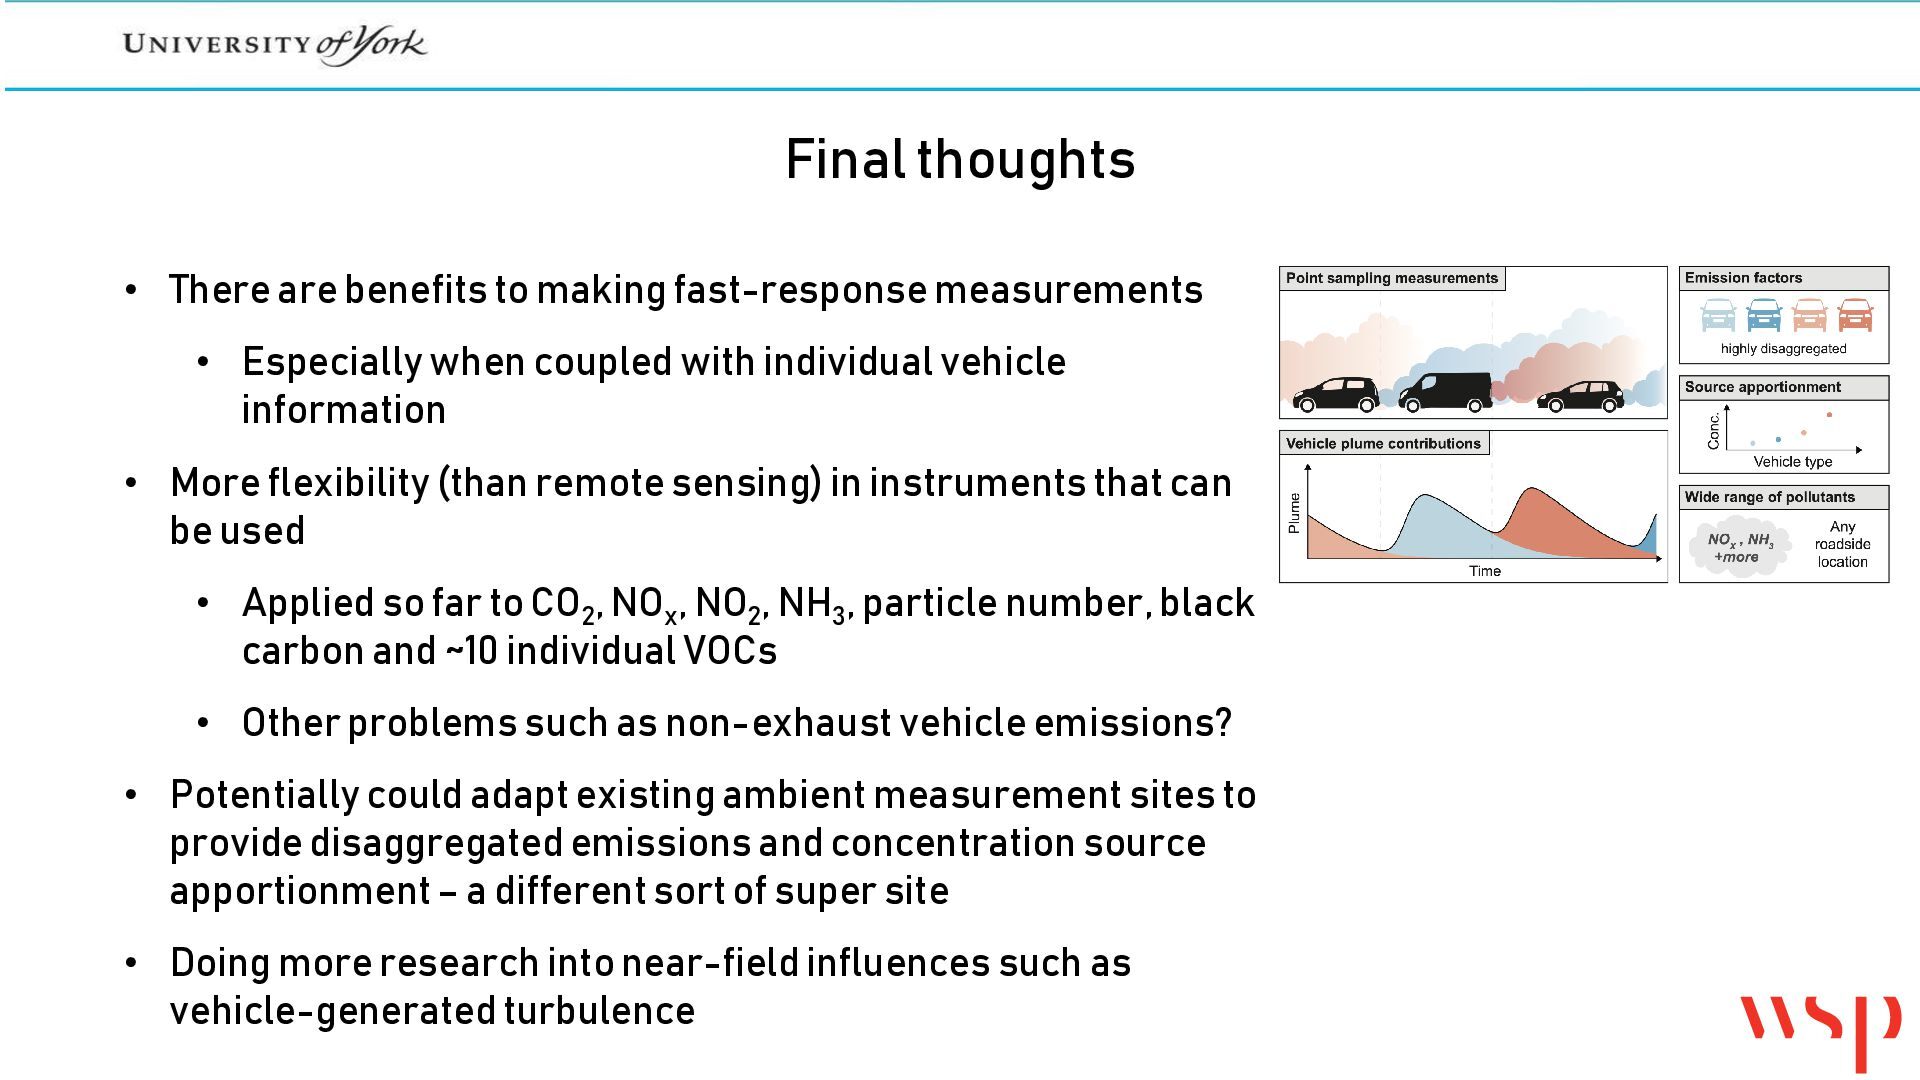
• Especially when coupled with individual vehicle information • More flexibility (than remote sensing) in instruments that can be used • Applied so far to CO2, NOx, NO2, NH3, particle number, black carbon and ~10 individual VOCs • Other problems such as non-exhaust vehicle emissions? • Potentially could adapt existing ambient measurement sites to provide disaggregated emissions and concentration source apportionment – a different sort of super site • Doing more research into near-field influences such as vehicle-generated turbulence


 iesevents
 carmenintech
 codingconduct
 kimpetersen
 jlugia
 holman
 cassininazir
 inesmontani
 smashingmag
 sstephenson
 geoffreycrofte