Upgrade to Pro — share decks privately, control downloads, hide ads and more …

RTCA Keynote Dr Gary Fuller - Measurement chal...

Avatar for IES Events IES Events
October 27, 2026
23

RTCA Keynote Dr Gary Fuller - Measurement challenges in a regulatory context

Avatar for IES Events

IES Events

October 27, 2026

More Decks by IES Events

Transcript

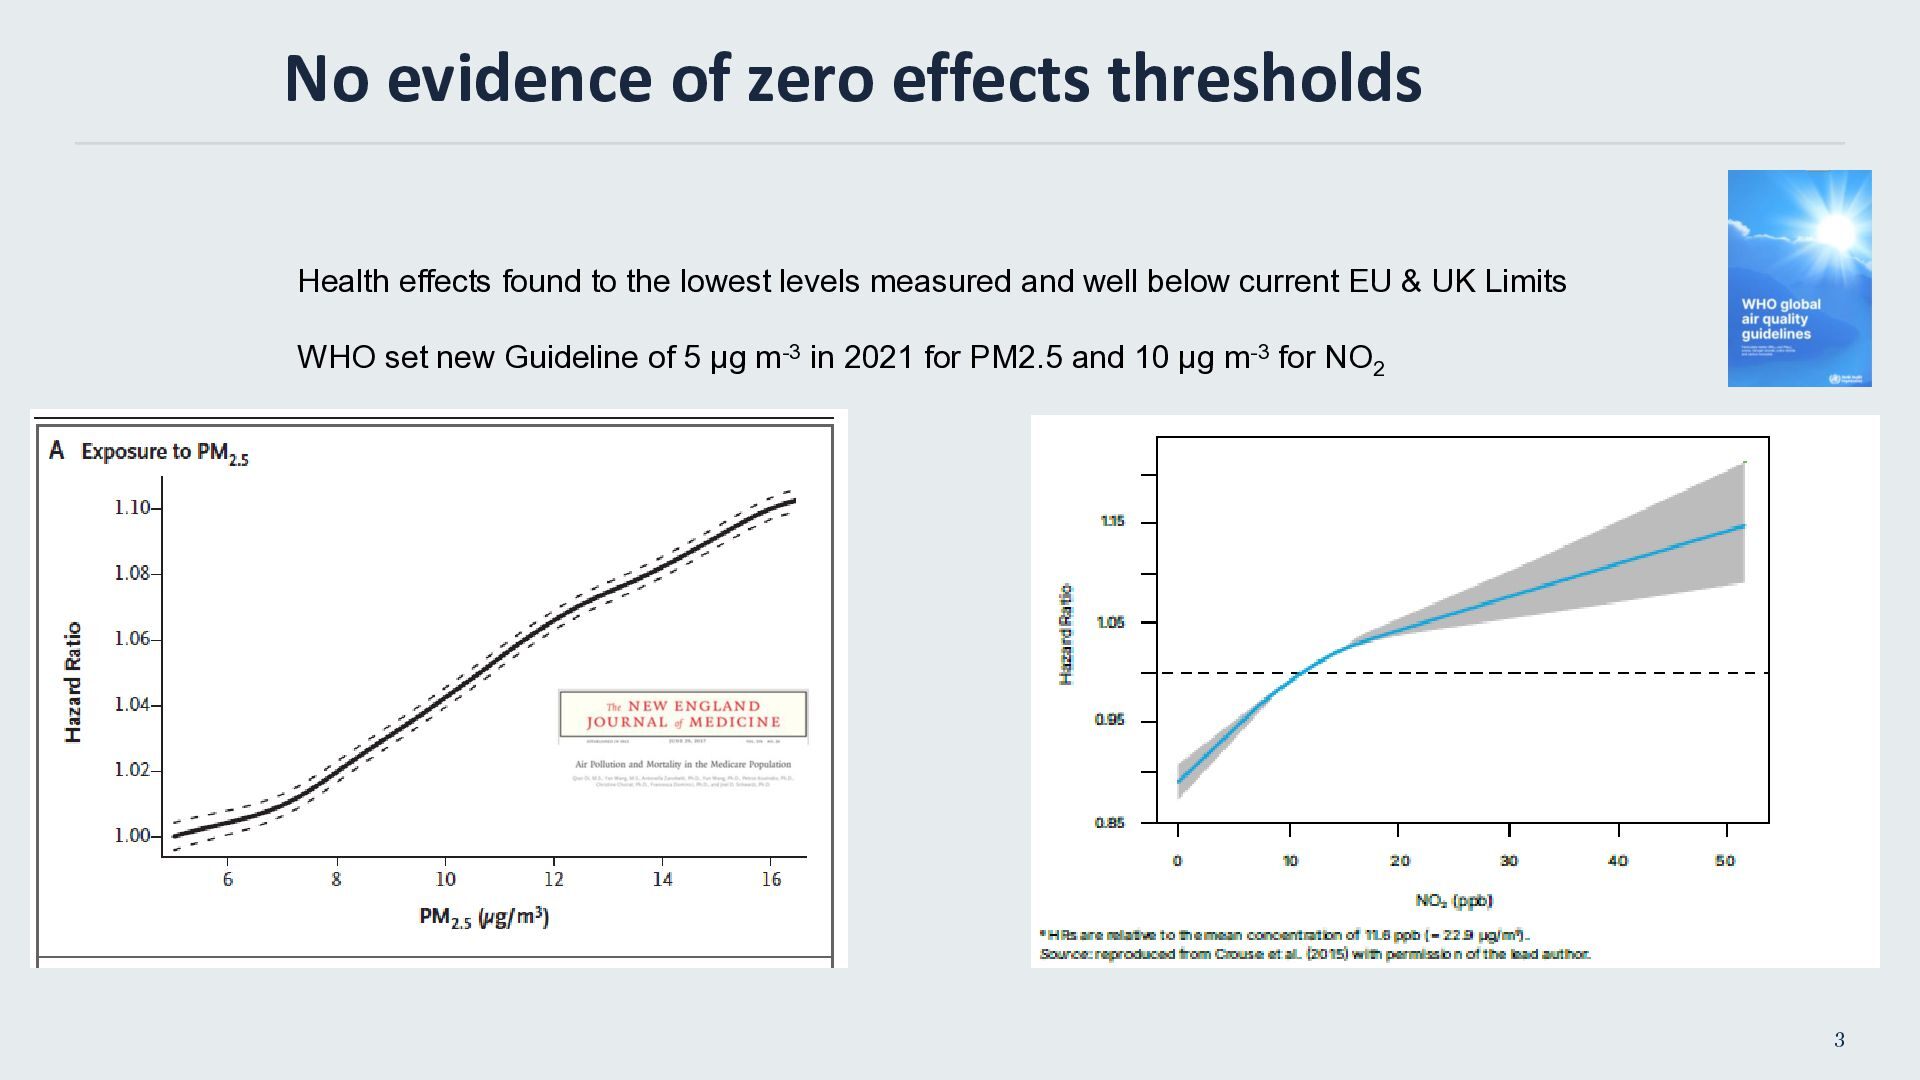
  1. No evidence of zero effects thresholds Health effects found to

    the lowest levels measured and well below current EU & UK Limits WHO set new Guideline of 5 µg m-3 in 2021 for PM2.5 and 10 µg m-3 for NO2 3
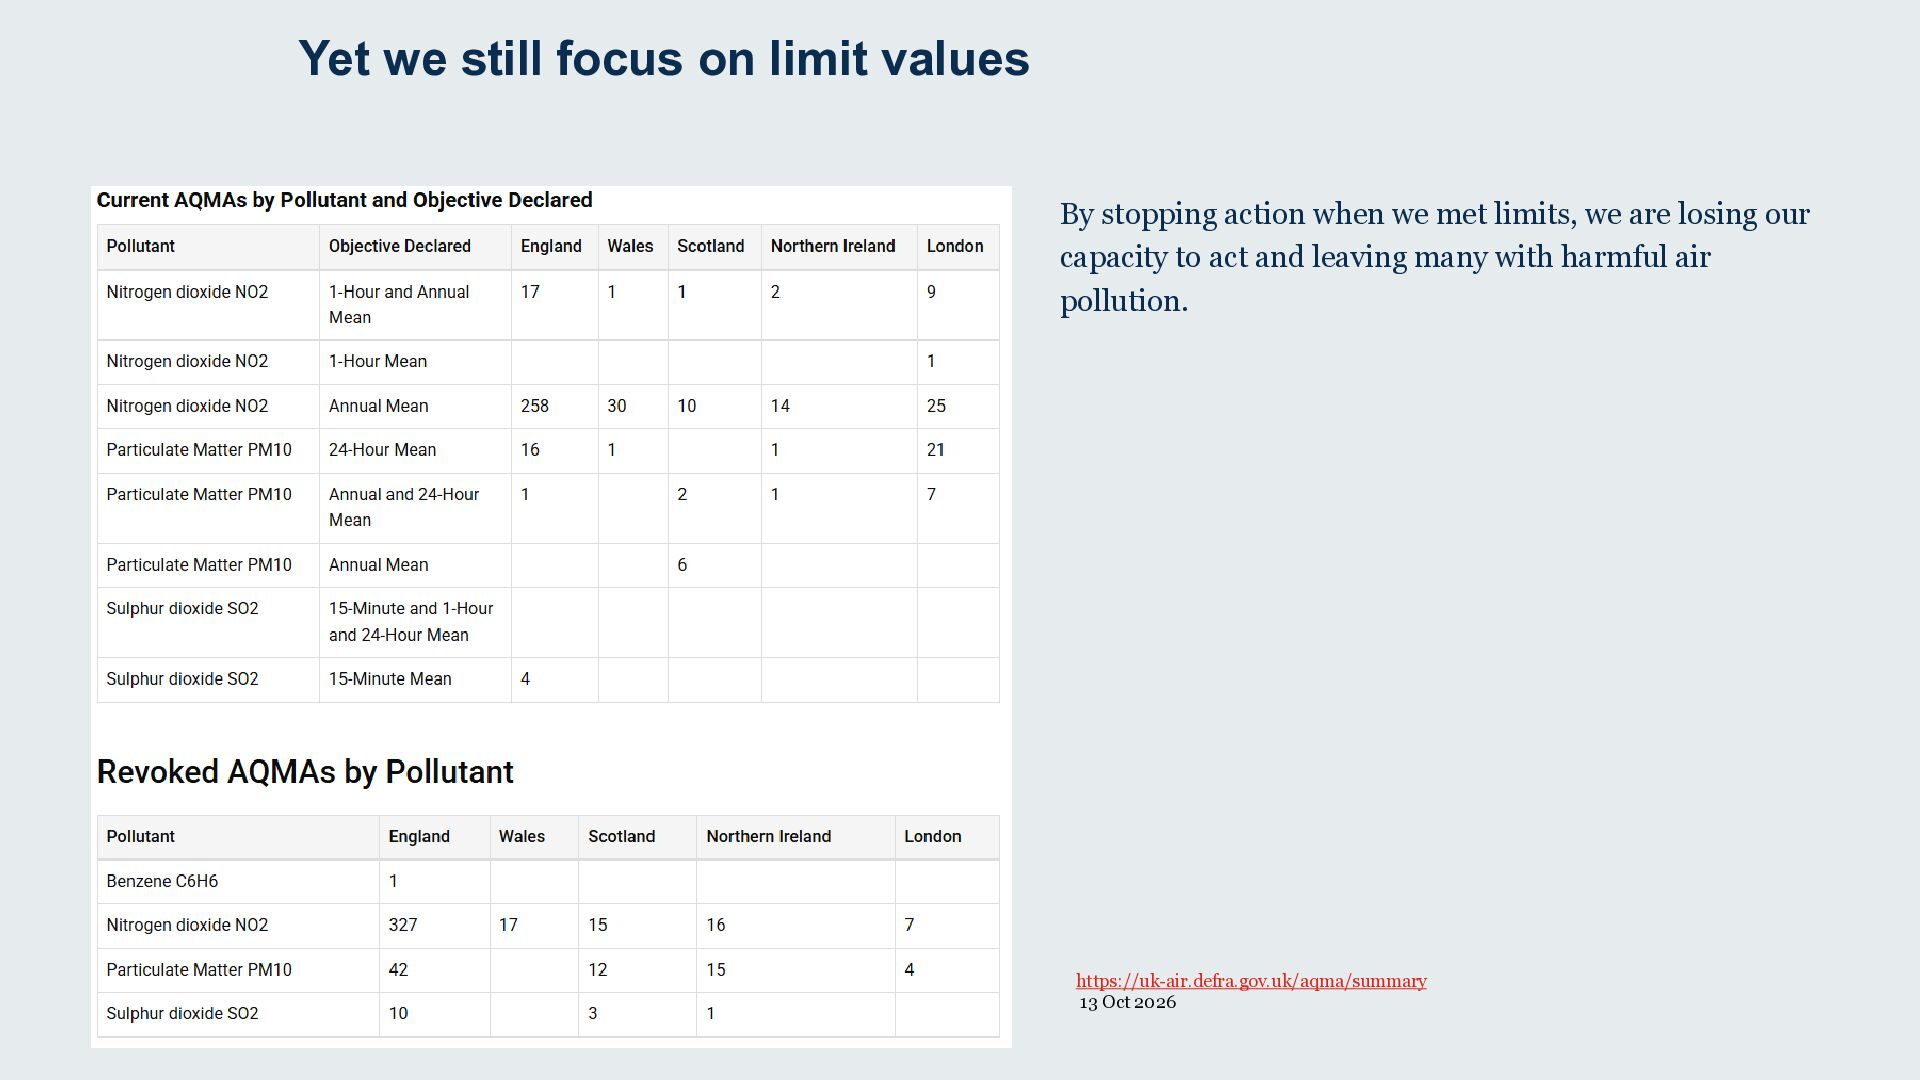
  2. Yet we still focus on limit values By stopping action

    when we met limits, we are losing our capacity to act and leaving many with harmful air pollution. https://uk-air.defra.gov.uk/aqma/summary 13 Oct 2026
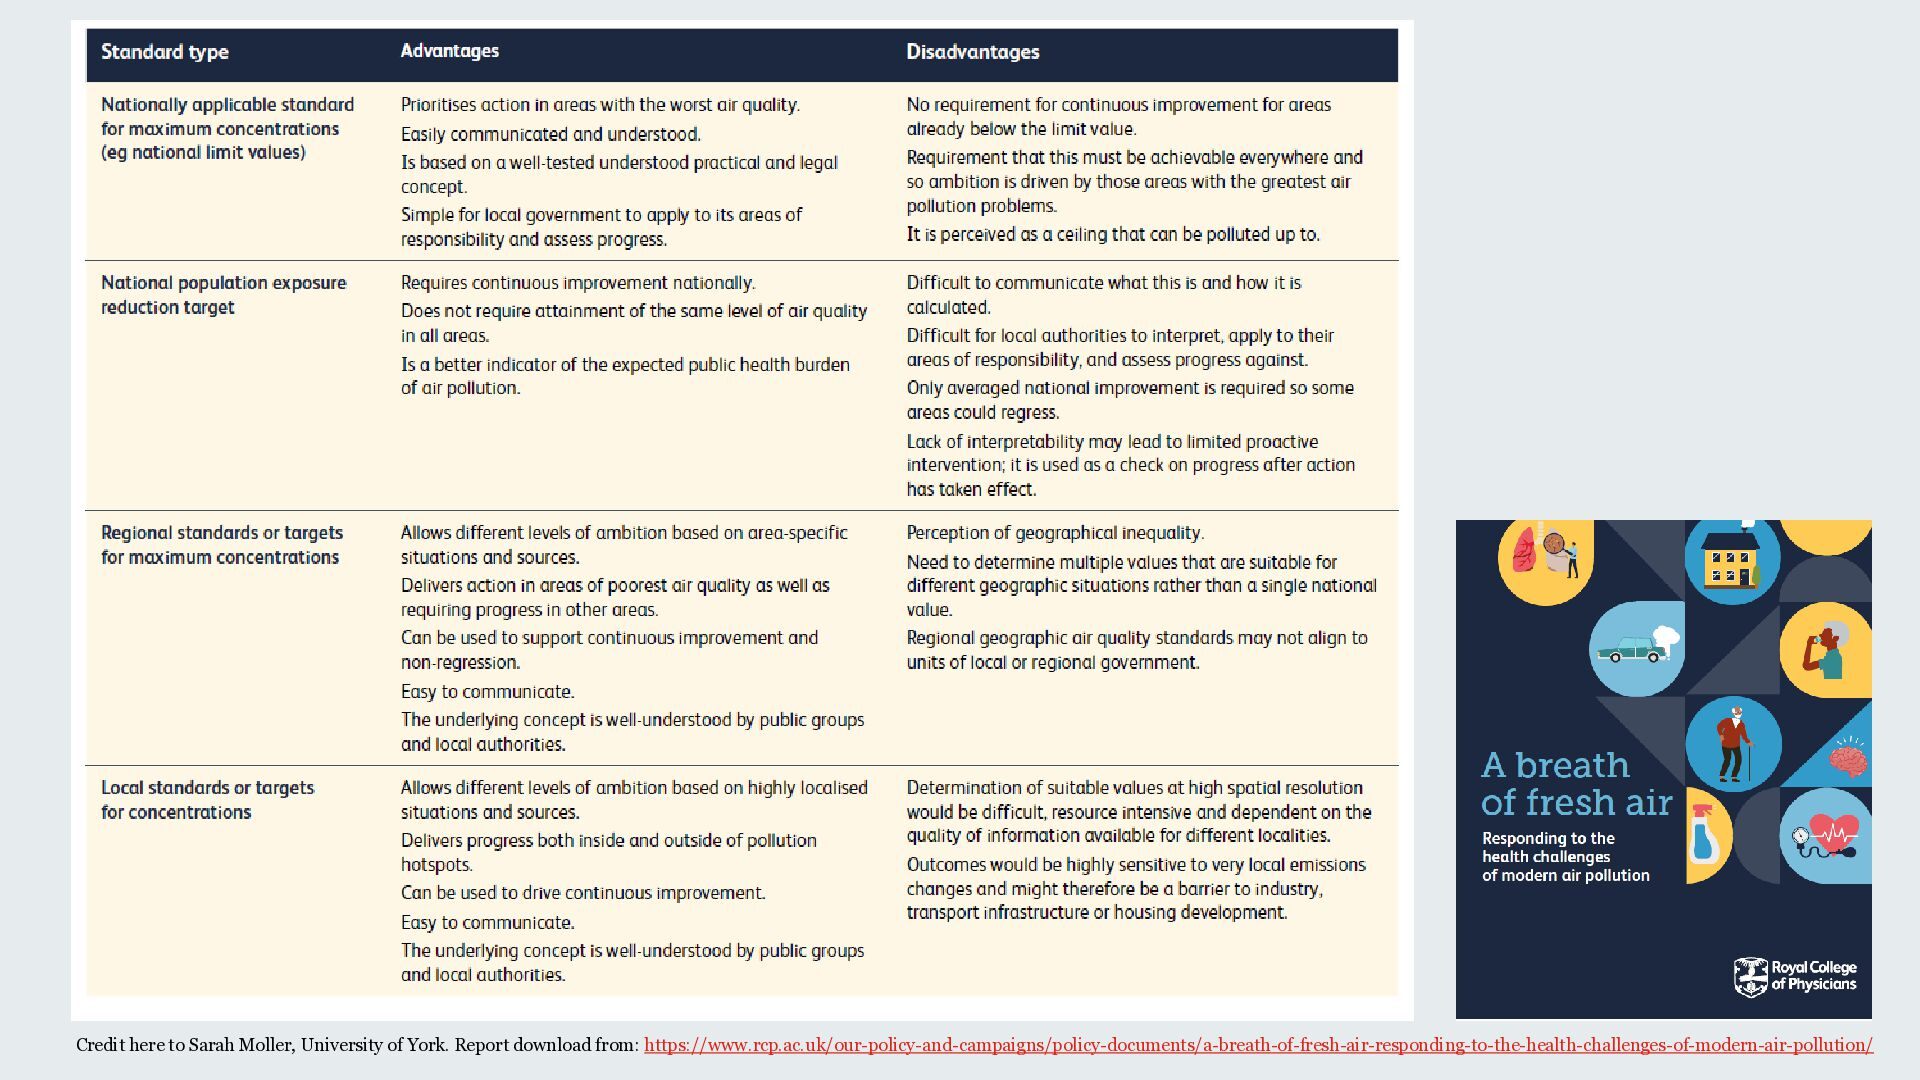
  3. Credit here to Sarah Moller, University of York. Report download

    from: https://www.rcp.ac.uk/our-policy-and-campaigns/policy-documents/a-breath-of-fresh-air-responding-to-the-health-challenges-of-modern-air-pollution/
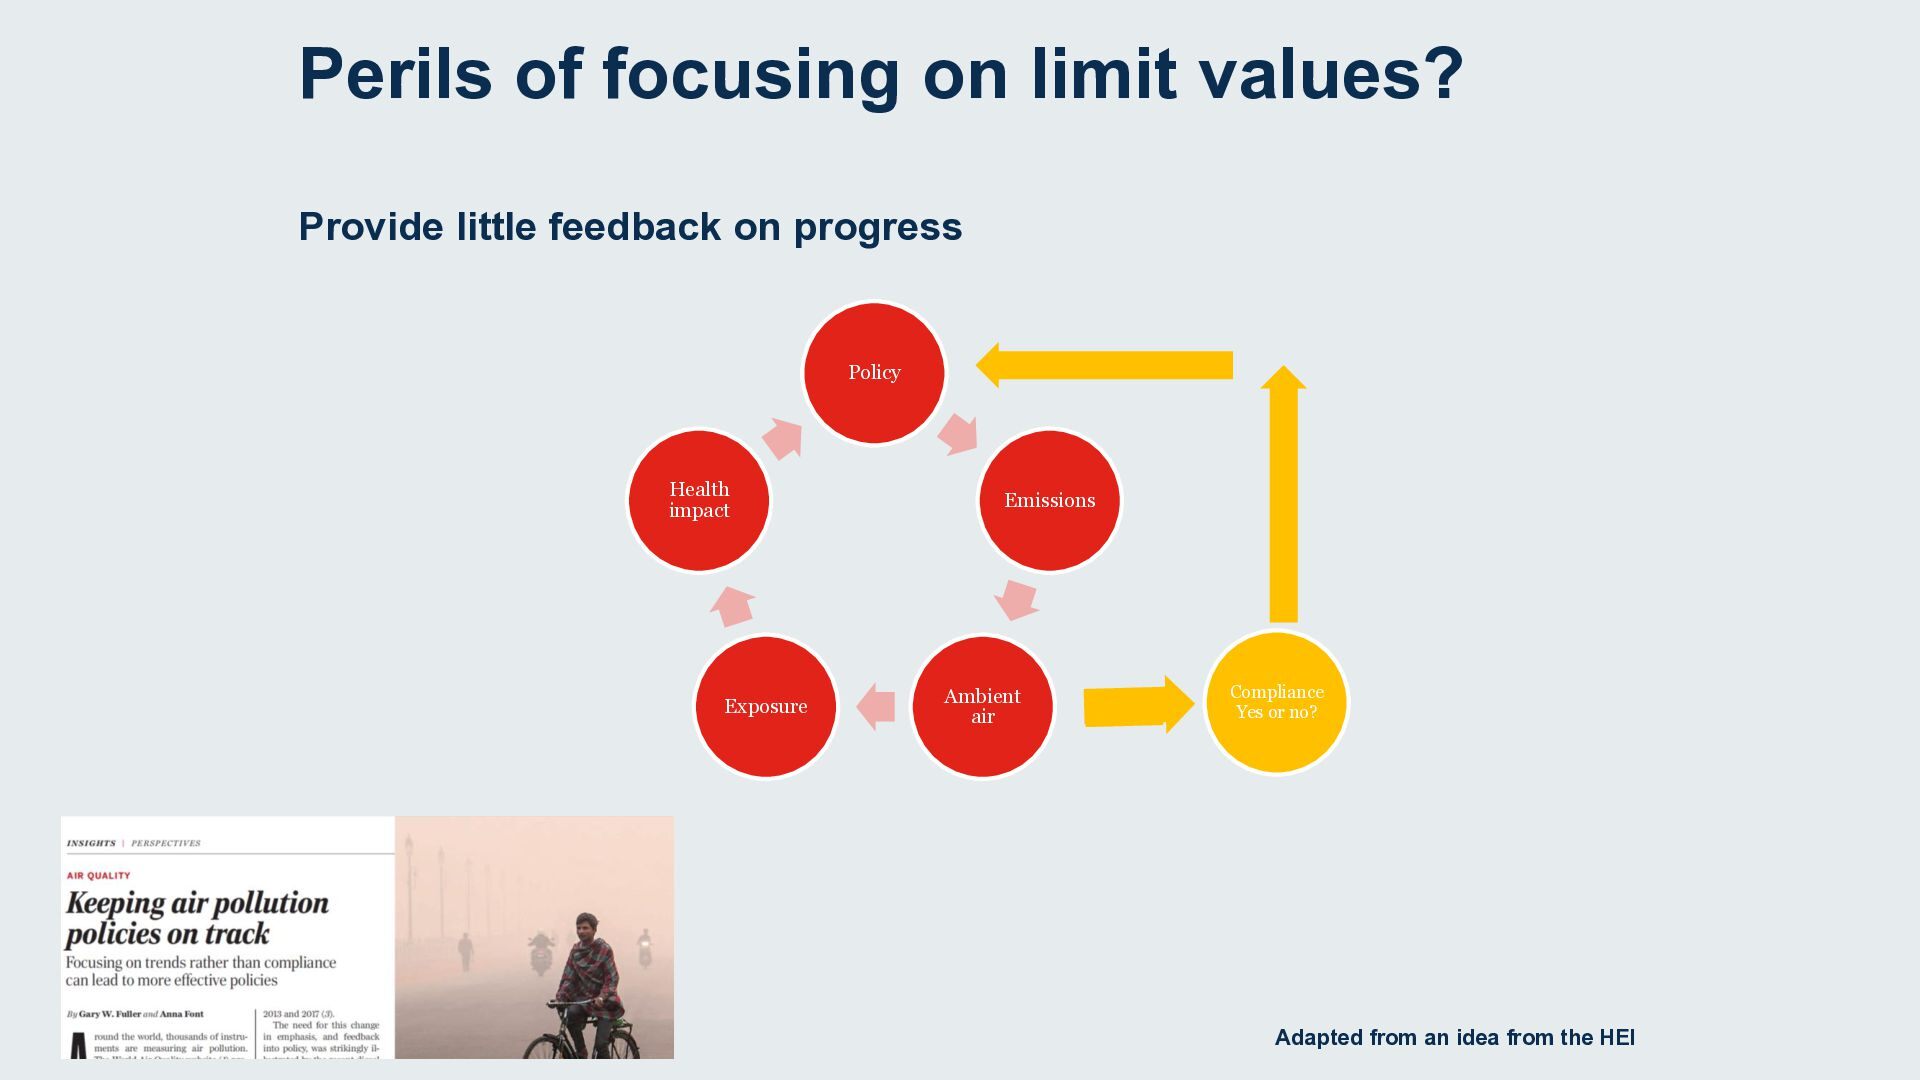
  4. Perils of focusing on limit values? Provide little feedback on

    progress Policy Health impact Exposure Emissions Ambient air Compliance Yes or no? Adapted from an idea from the HEI
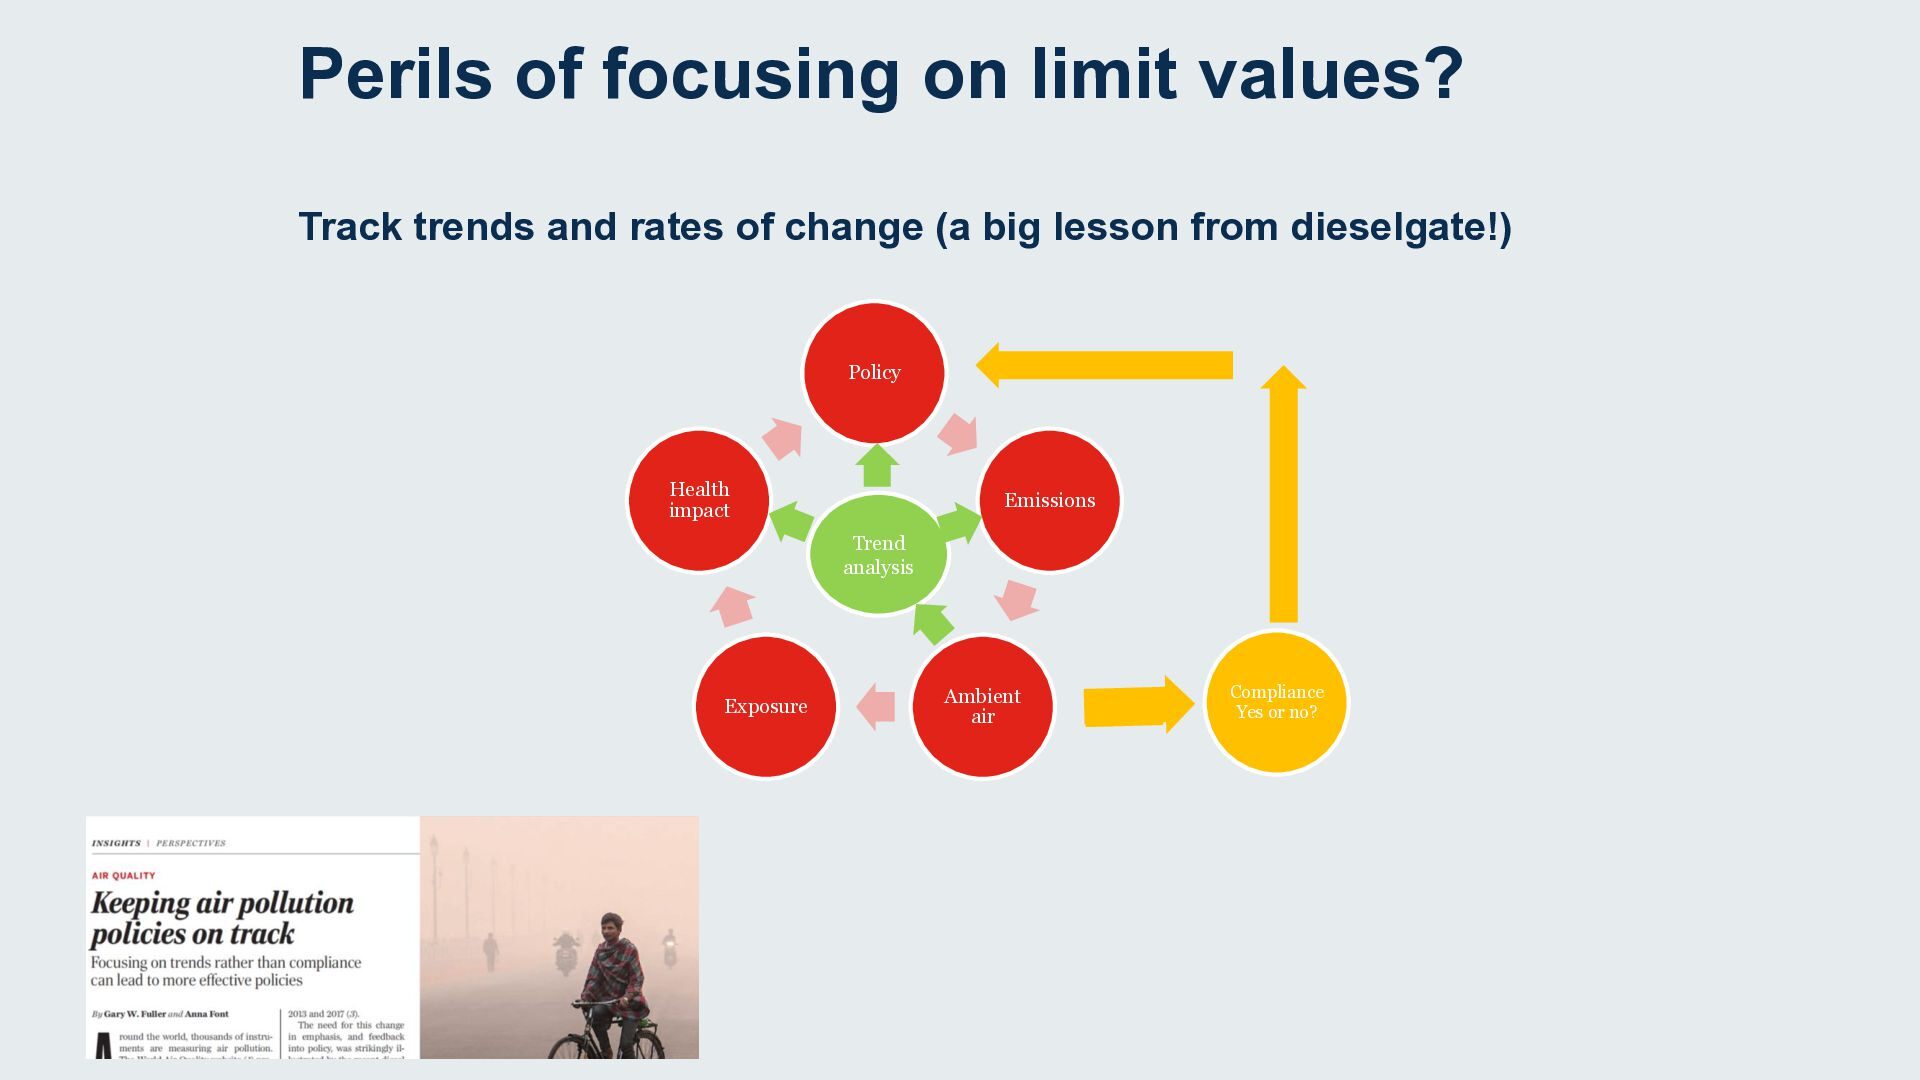
  5. Perils of focusing on limit values? Track trends and rates

    of change (a big lesson from dieselgate!) Policy Health impact Emissions Trend analysis Exposure Ambient air Compliance Yes or no?
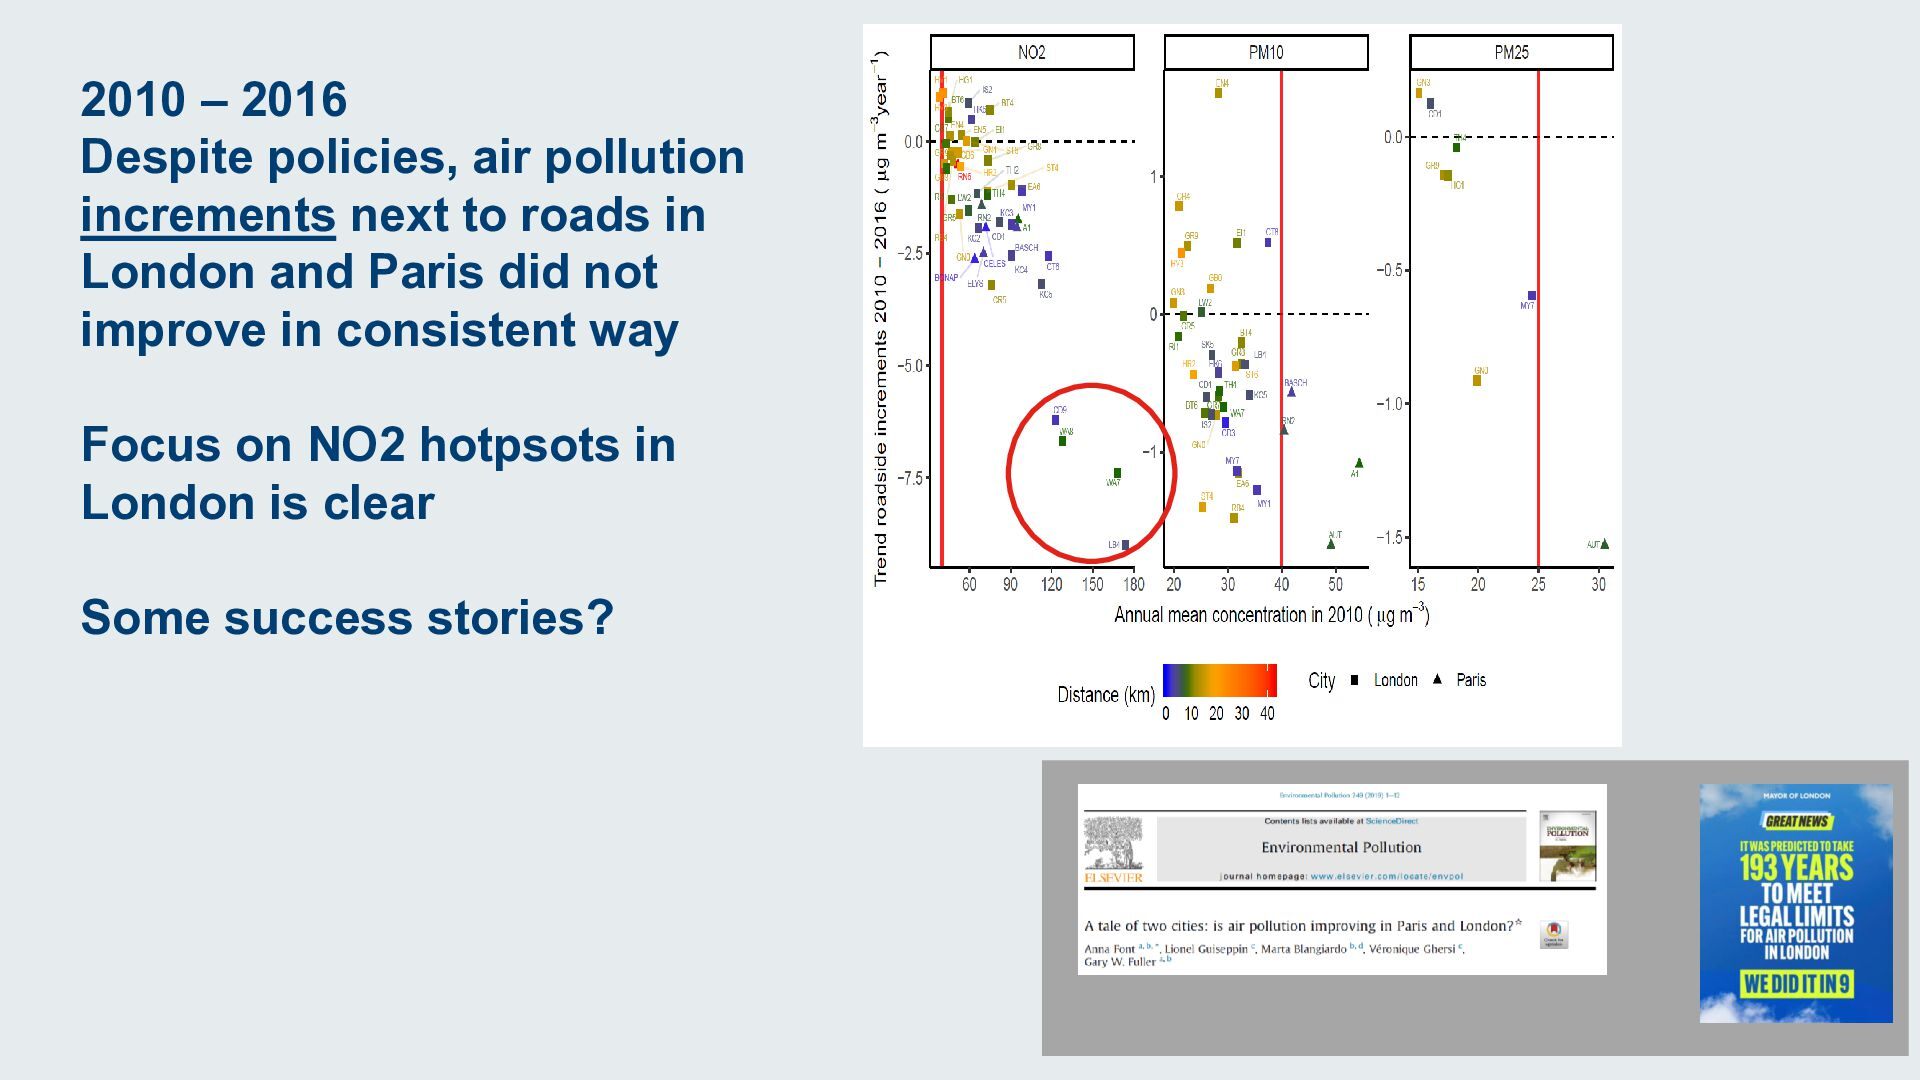
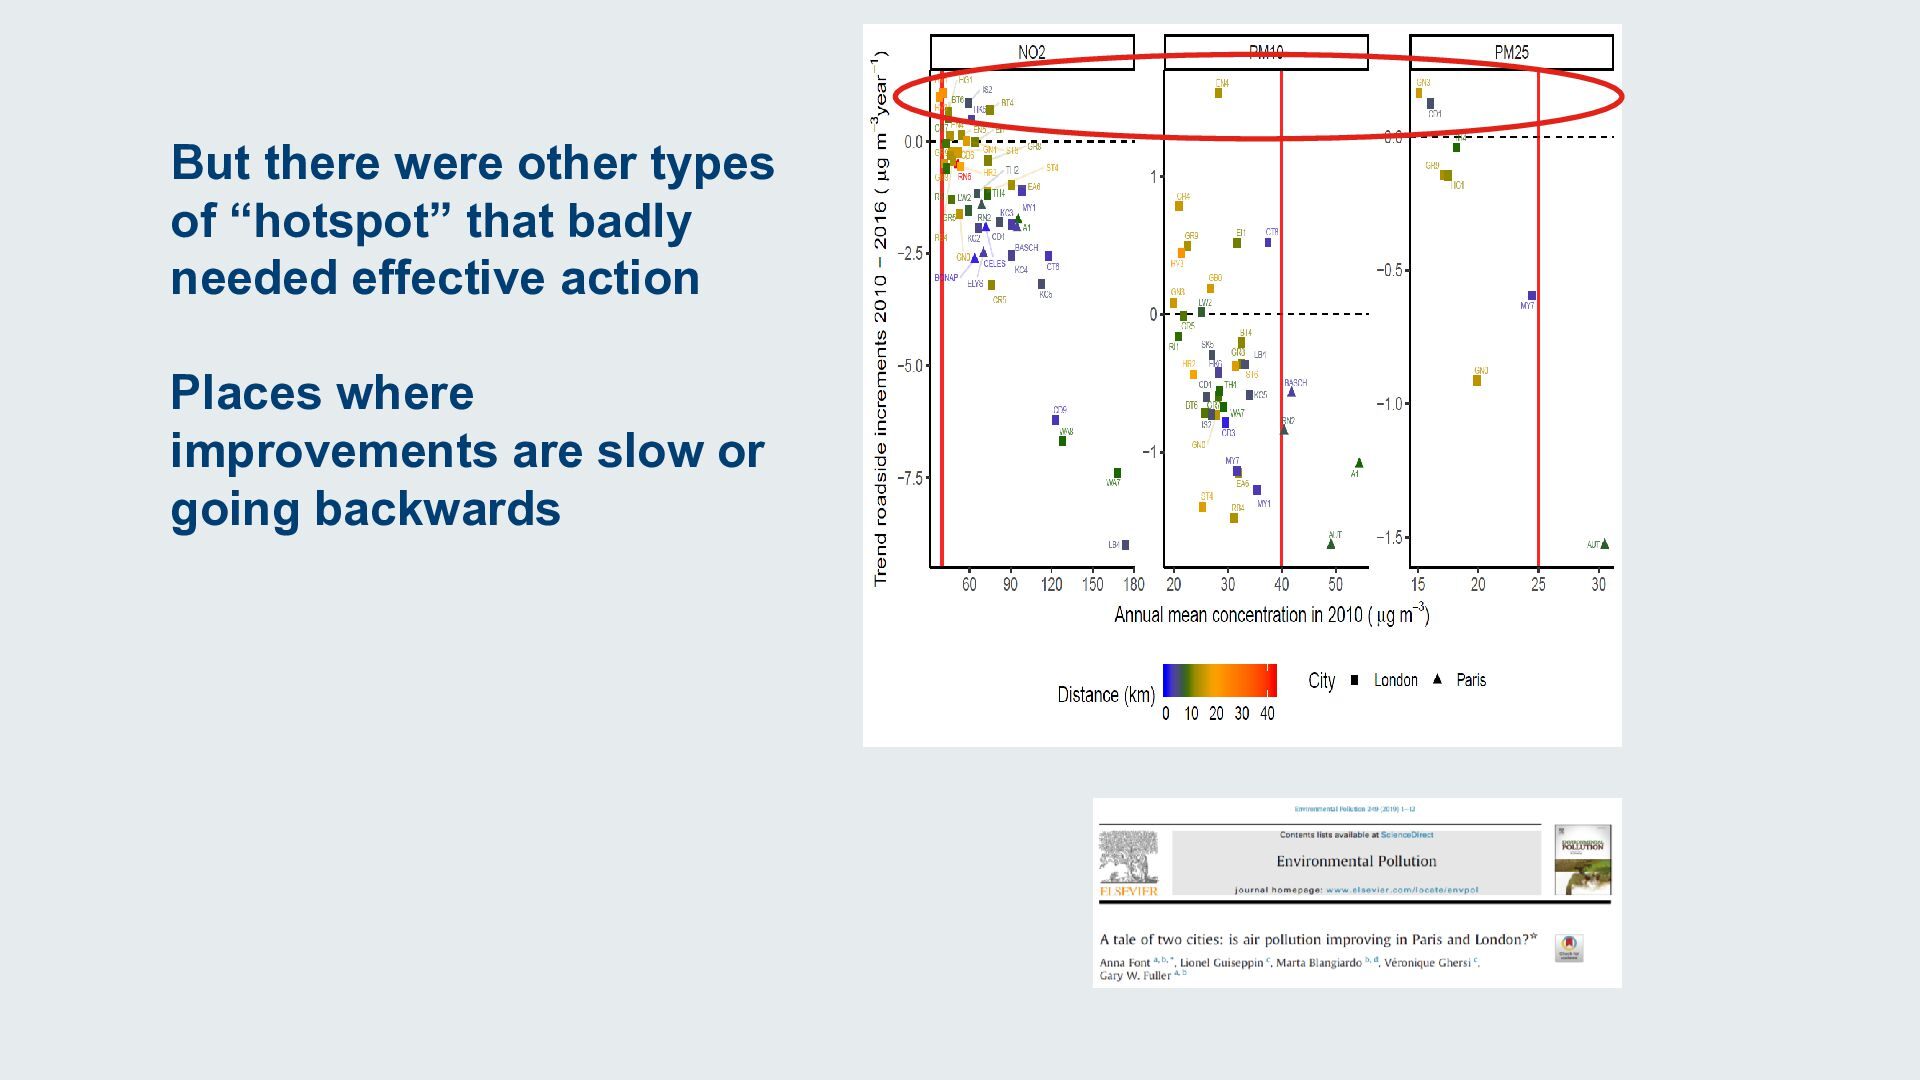
  6. 2010 – 2016 Despite policies, air pollution increments next to

    roads in London and Paris did not improve in consistent way Focus on NO2 hotpsots in London is clear Some success stories?
  7. But there were other types of “hotspot” that badly needed

    effective action Places where improvements are slow or going backwards
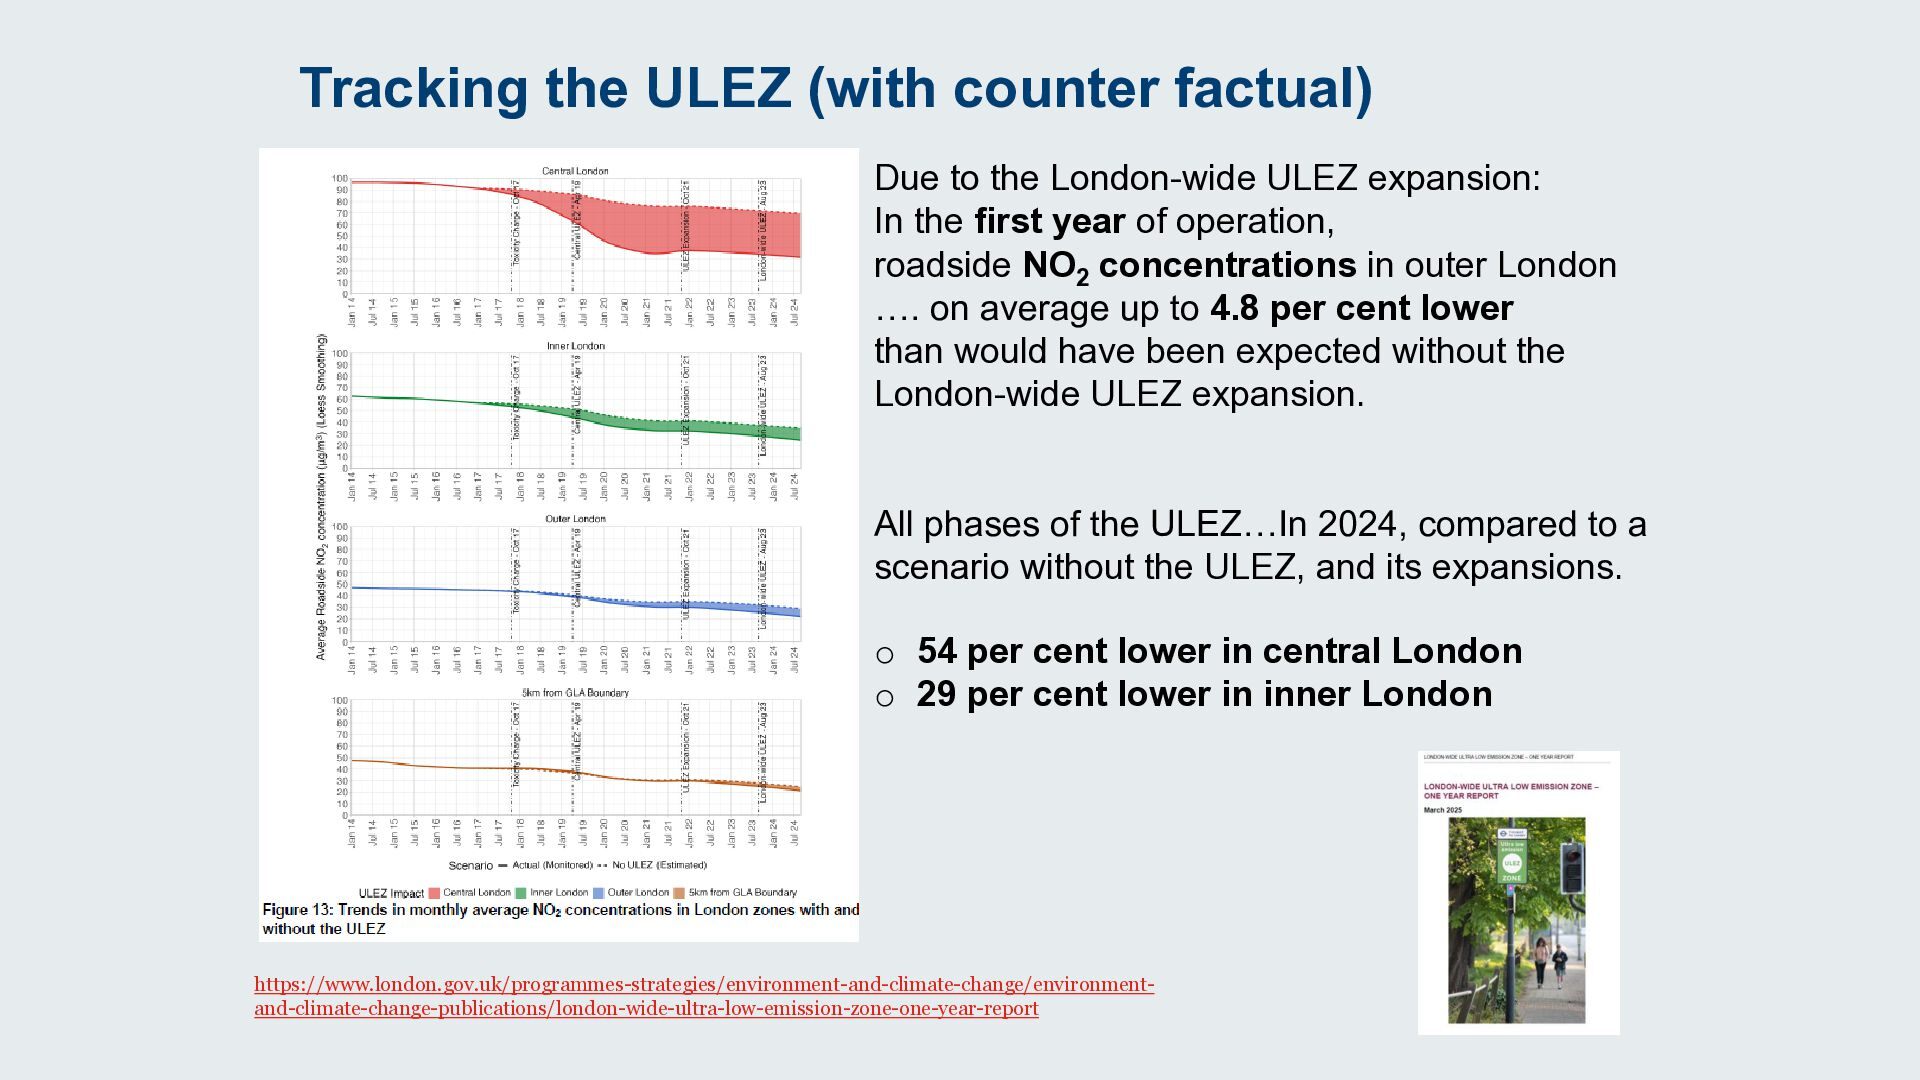
  8. Tracking the ULEZ (with counter factual) Due to the London-wide

    ULEZ expansion: In the first year of operation, roadside NO2 concentrations in outer London …. on average up to 4.8 per cent lower than would have been expected without the London-wide ULEZ expansion. All phases of the ULEZ…In 2024, compared to a scenario without the ULEZ, and its expansions. o 54 per cent lower in central London o 29 per cent lower in inner London https://www.london.gov.uk/programmes-strategies/environment-and-climate-change/environmentand-climate-change-publications/london-wide-ultra-low-emission-zone-one-year-report
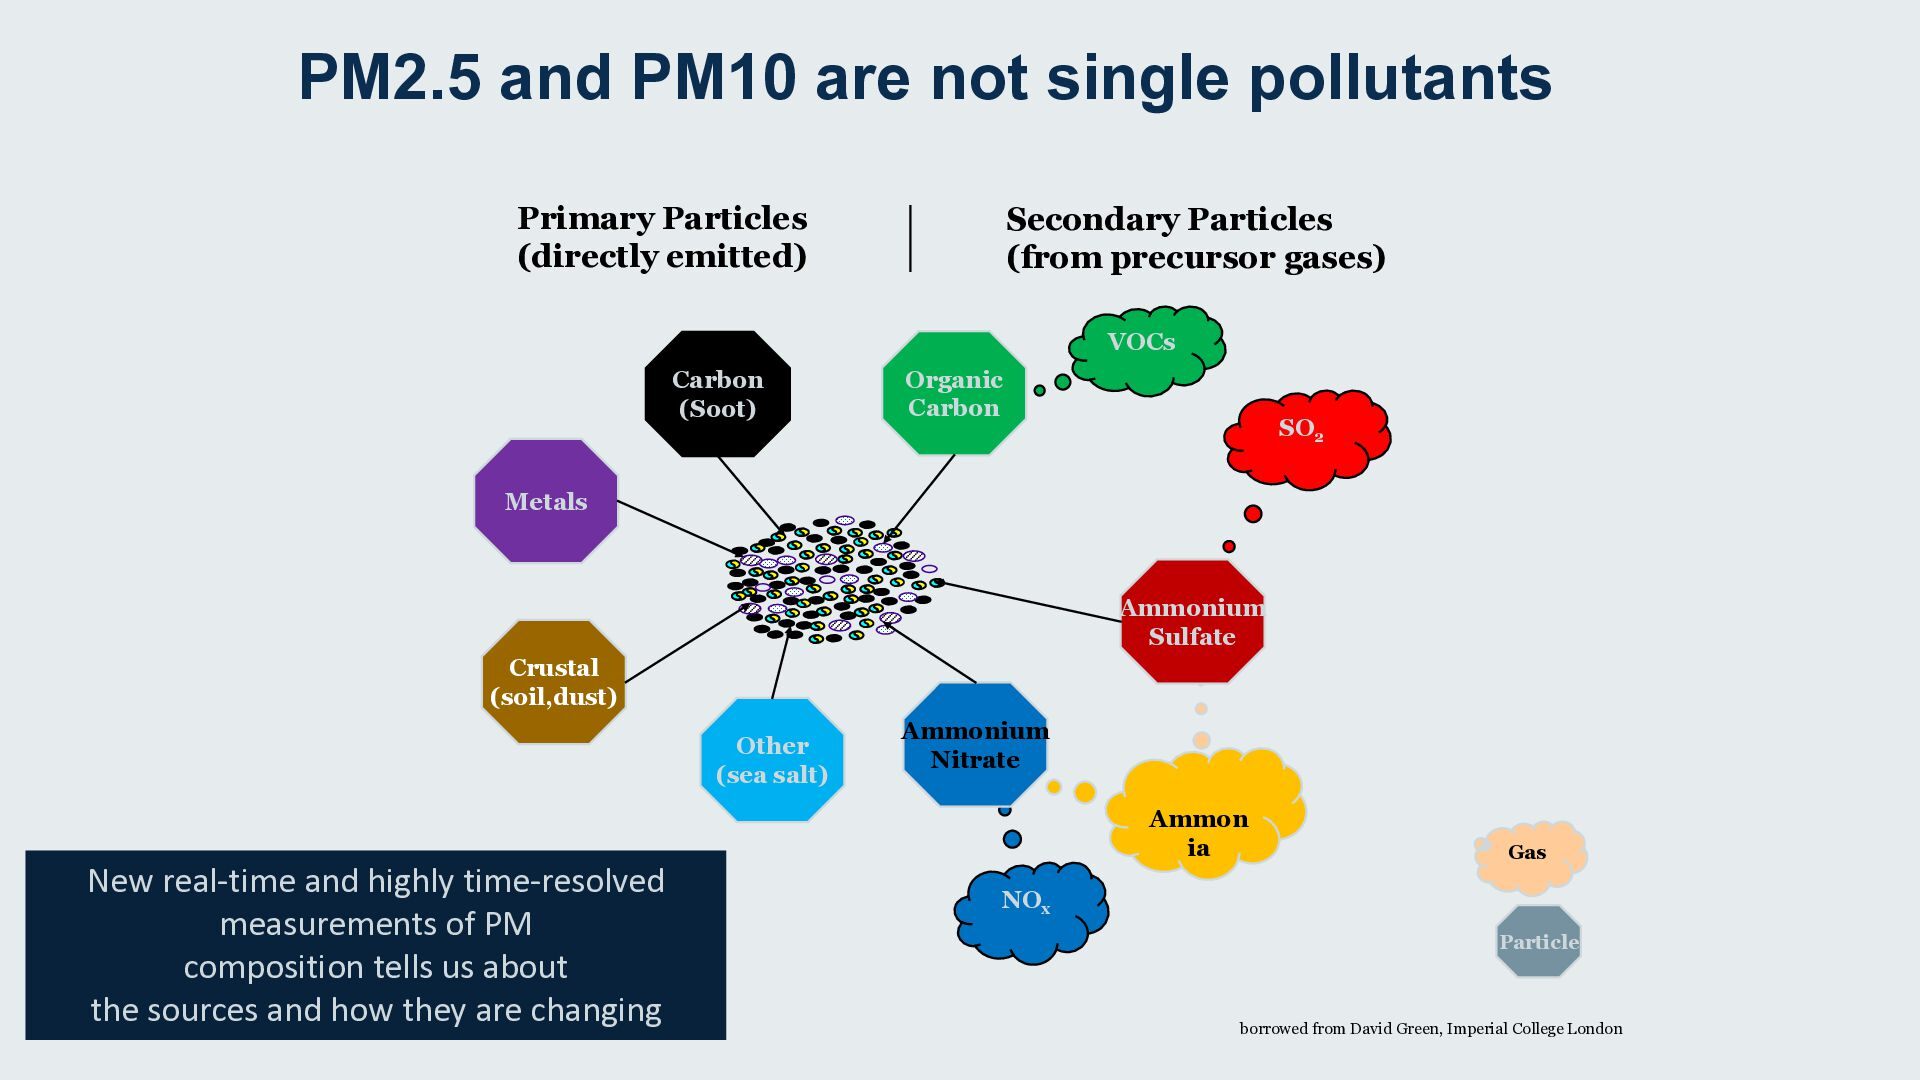
  9. PM2.5 and PM10 are not single pollutants Primary Particles (directly

    emitted) Secondary Particles (from precursor gases) VOCs Carbon (Soot) Organic Carbon SO2 Metals Ammonium Sulfate Crustal (soil,dust) Other (sea salt) Ammonium Nitrate Ammon ia New real-time and highly time-resolved measurements of PM composition tells us about the sources and how they are changing Gas NOx Particle borrowed from David Green, Imperial College London
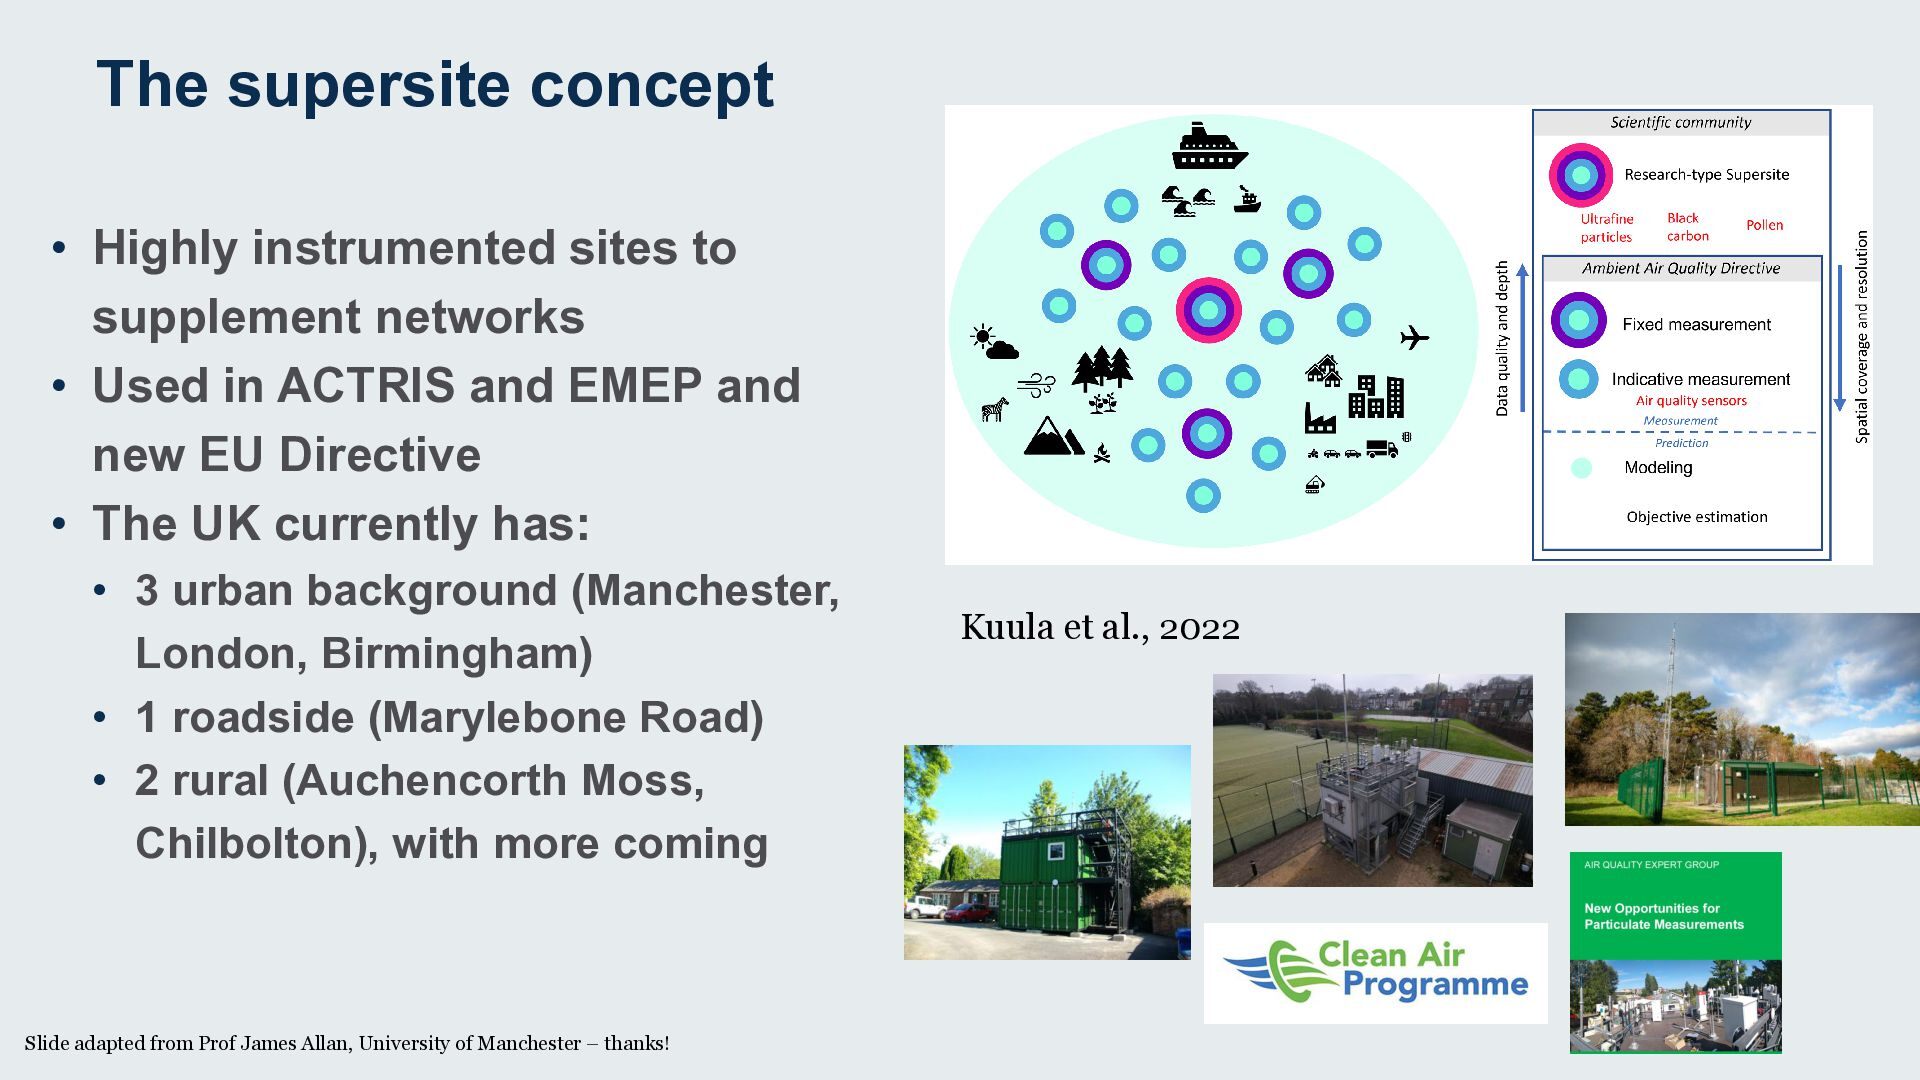
  10. The supersite concept • Highly instrumented sites to supplement networks

    • Used in ACTRIS and EMEP and new EU Directive • The UK currently has: • 3 urban background (Manchester, London, Birmingham) • 1 roadside (Marylebone Road) • 2 rural (Auchencorth Moss, Chilbolton), with more coming Slide adapted from Prof James Allan, University of Manchester – thanks! Kuula et al., 2022
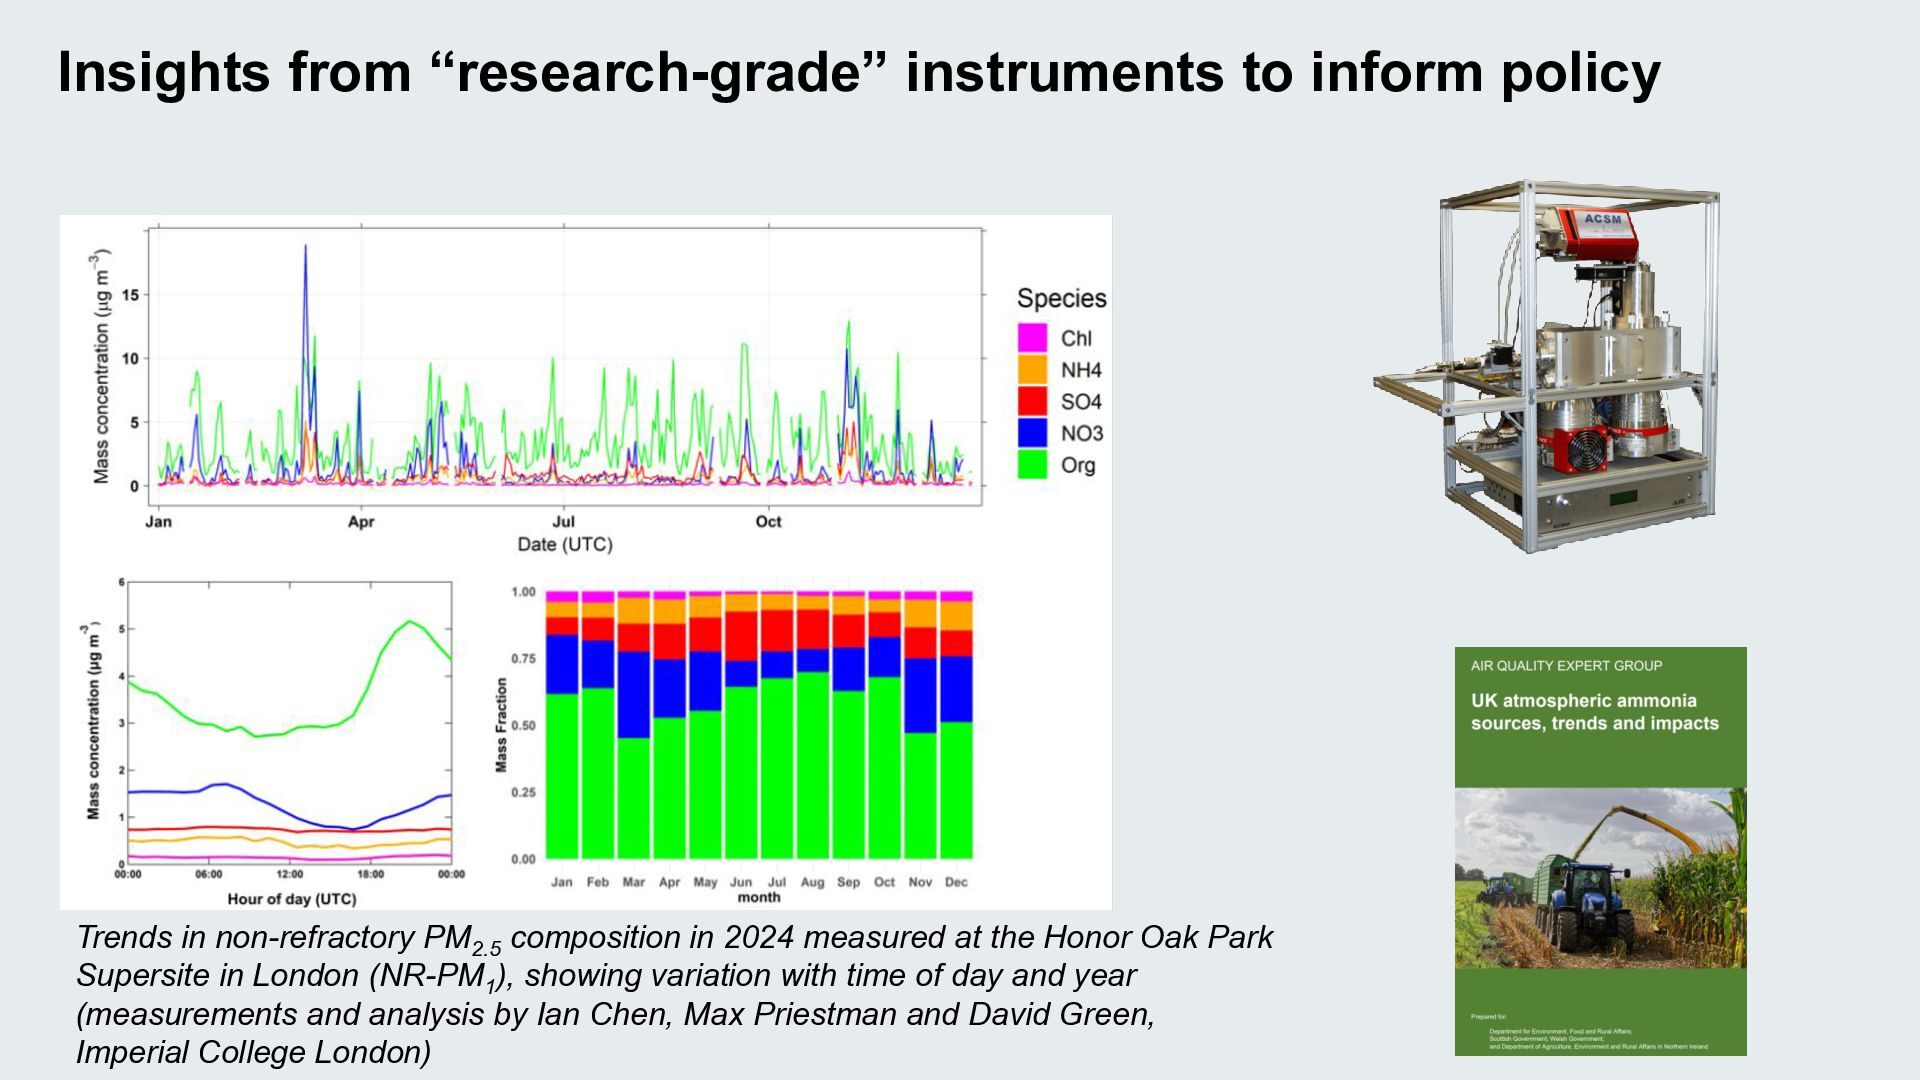
  11. Insights from “research-grade” instruments to inform policy Trends in non-refractory

    PM2.5 composition in 2024 measured at the Honor Oak Park Supersite in London (NR-PM1), showing variation with time of day and year (measurements and analysis by Ian Chen, Max Priestman and David Green, Imperial College London)
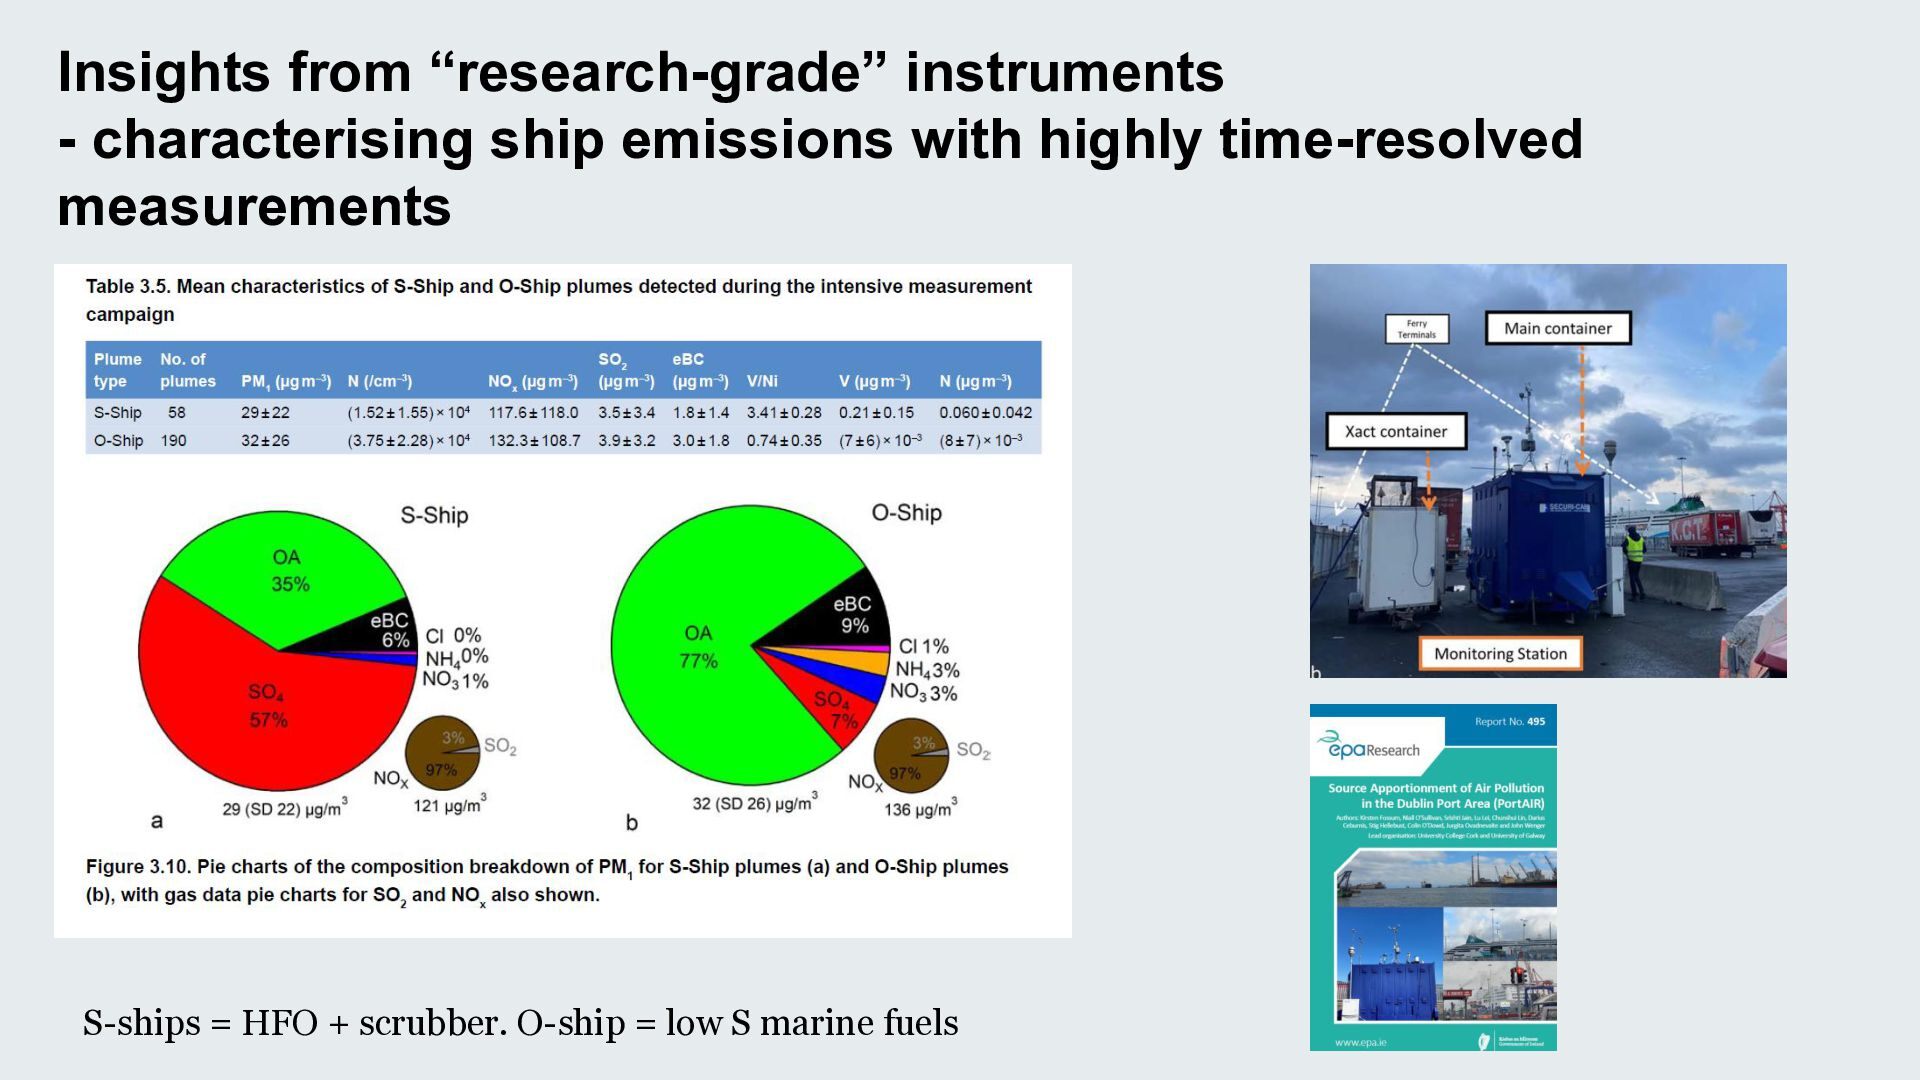
  12. Insights from “research-grade” instruments - characterising ship emissions with highly

    time-resolved measurements S-ships = HFO + scrubber. O-ship = low S marine fuels
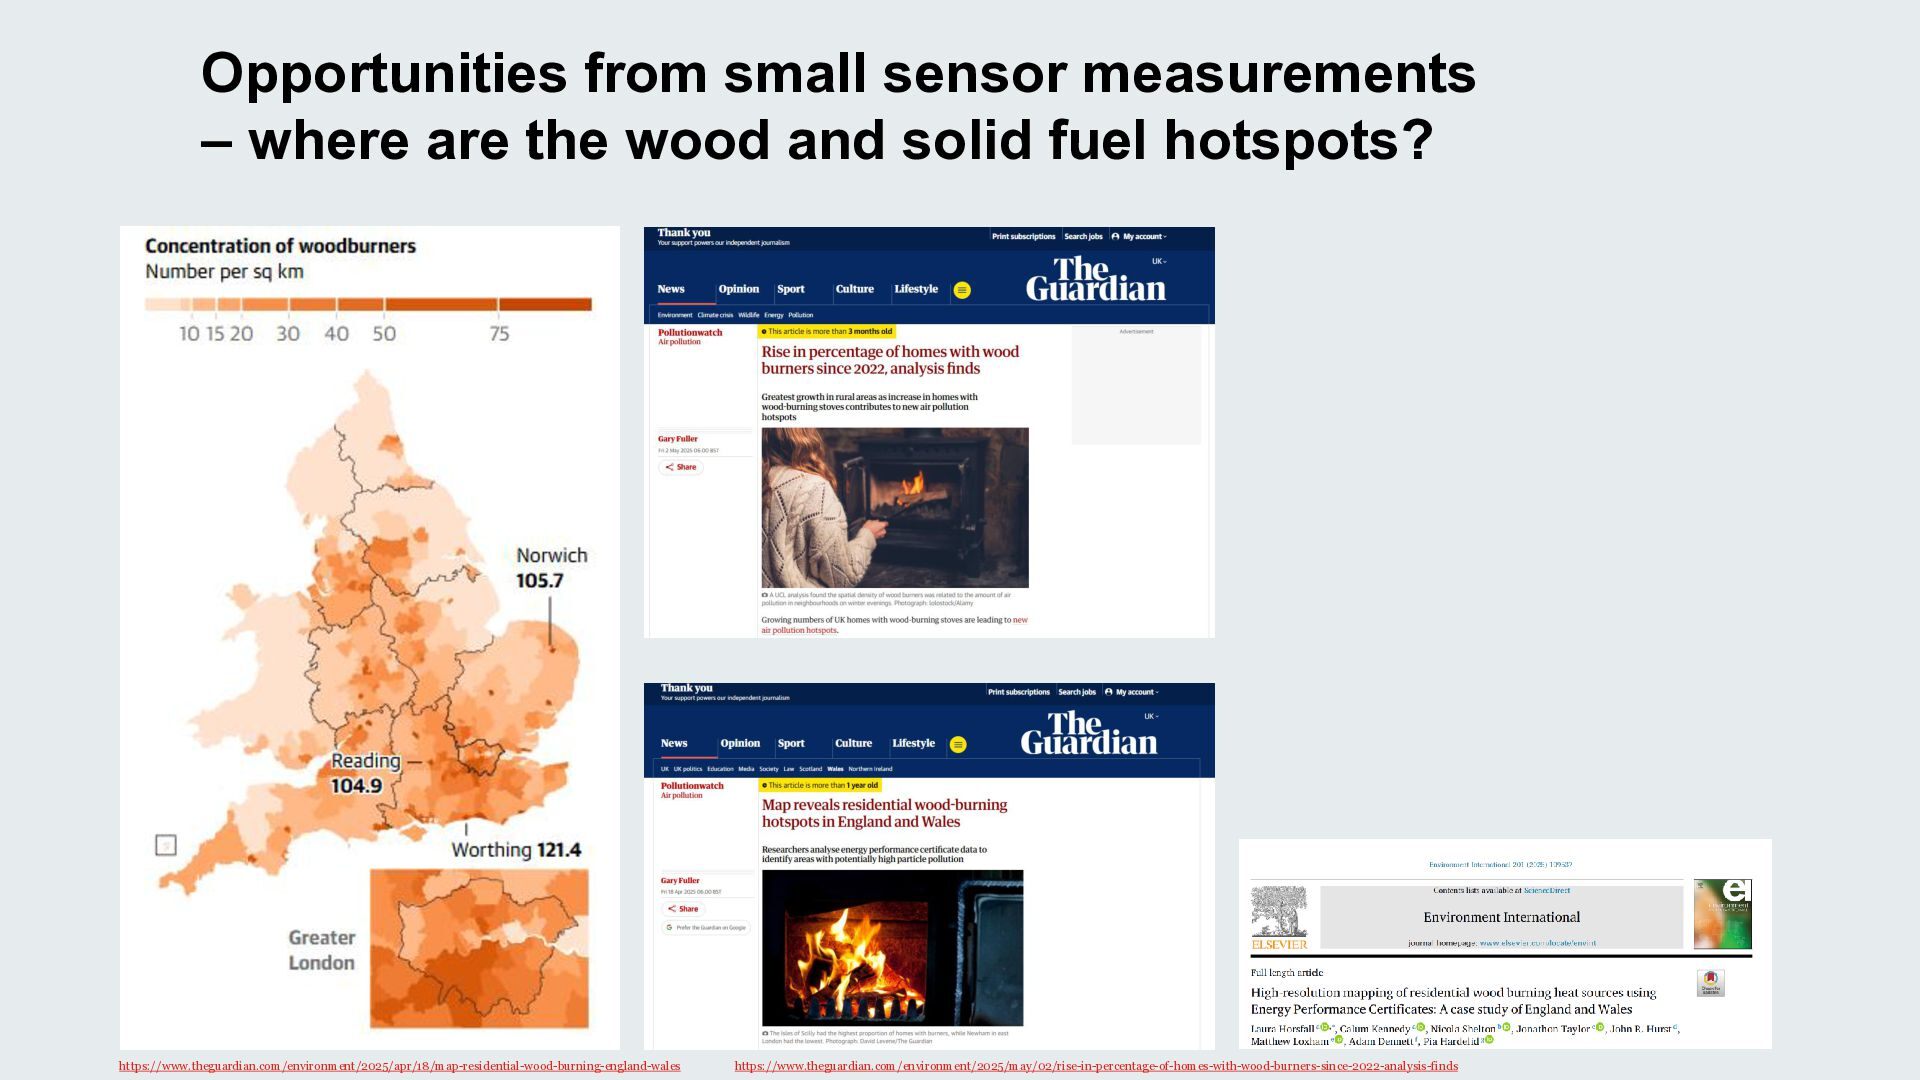
  13. Opportunities from small sensor measurements – where are the wood

    and solid fuel hotspots? https://www.theguardian.com/environment/2025/apr/18/map-residential-wood-burning-england-wales https://www.theguardian.com/environment/2025/may/02/rise-in-percentage-of-homes-with-wood-burners-since-2022-analysis-finds
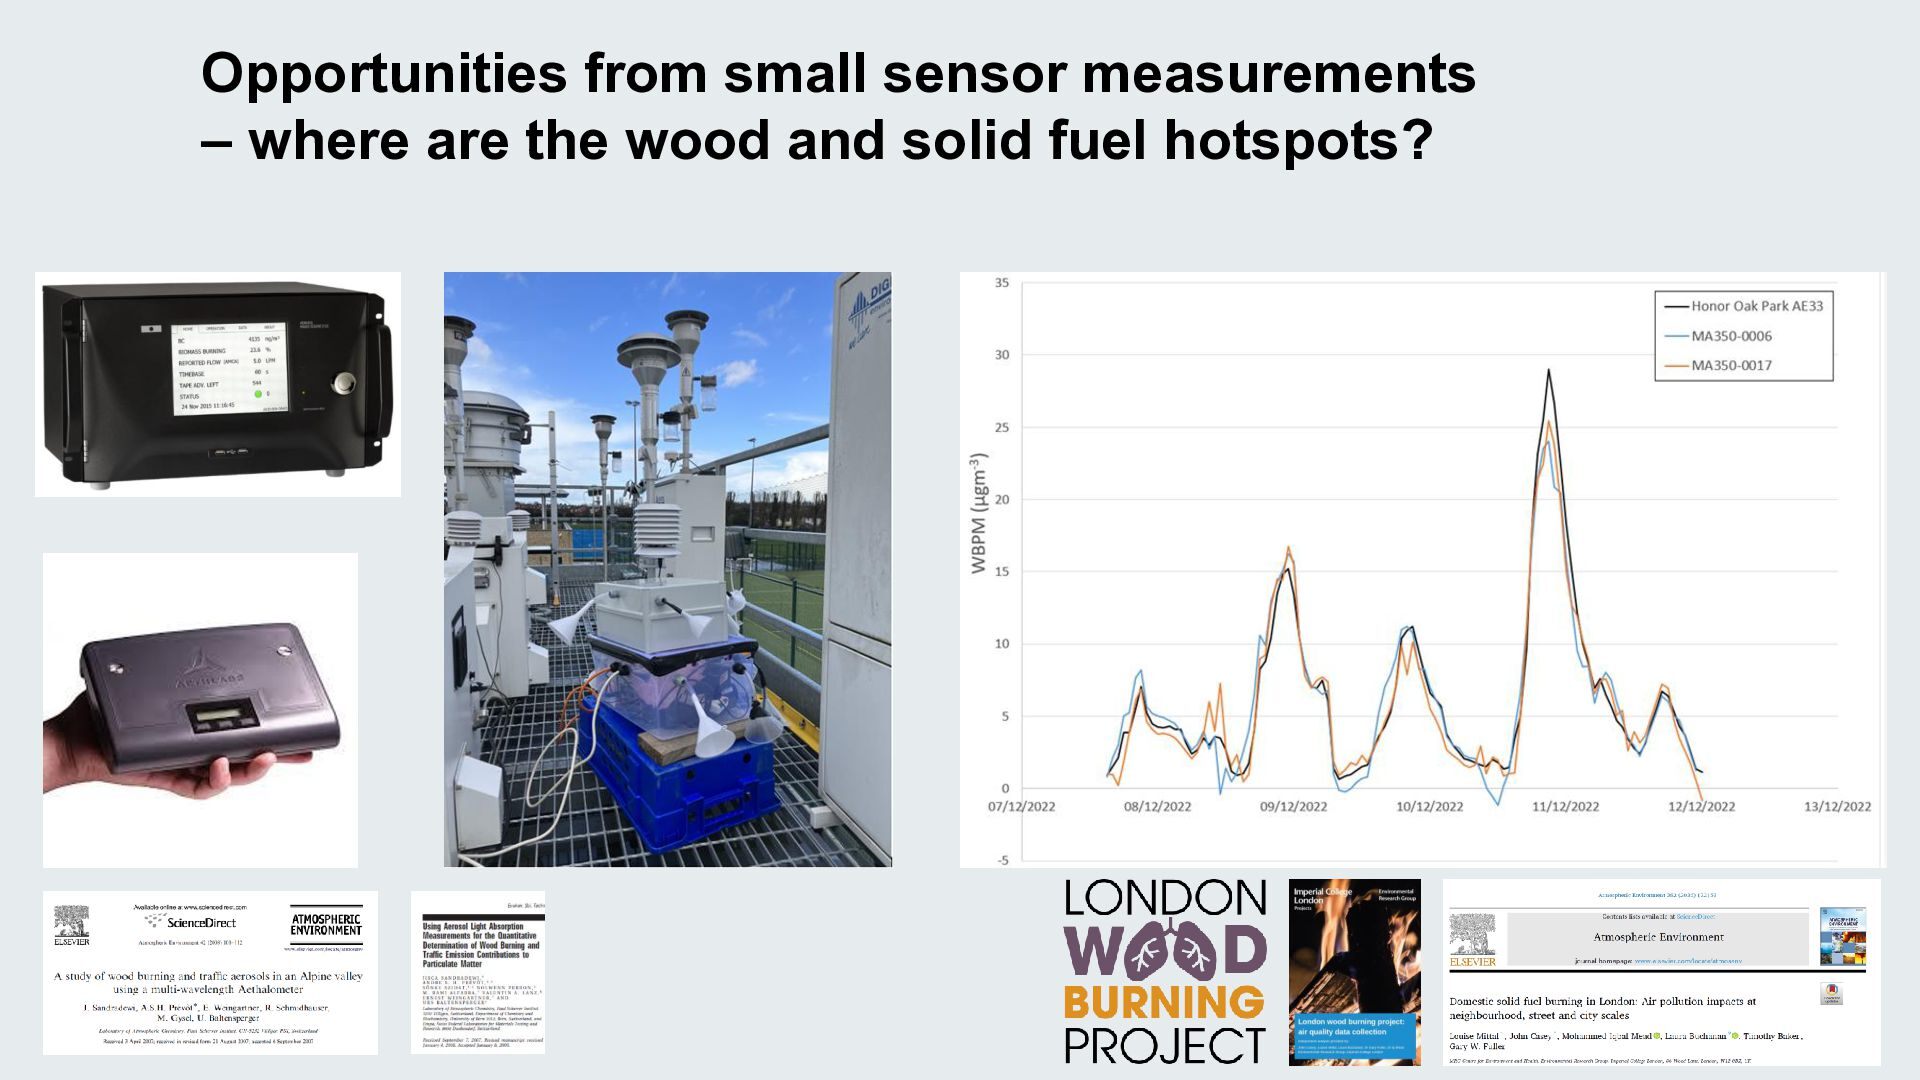
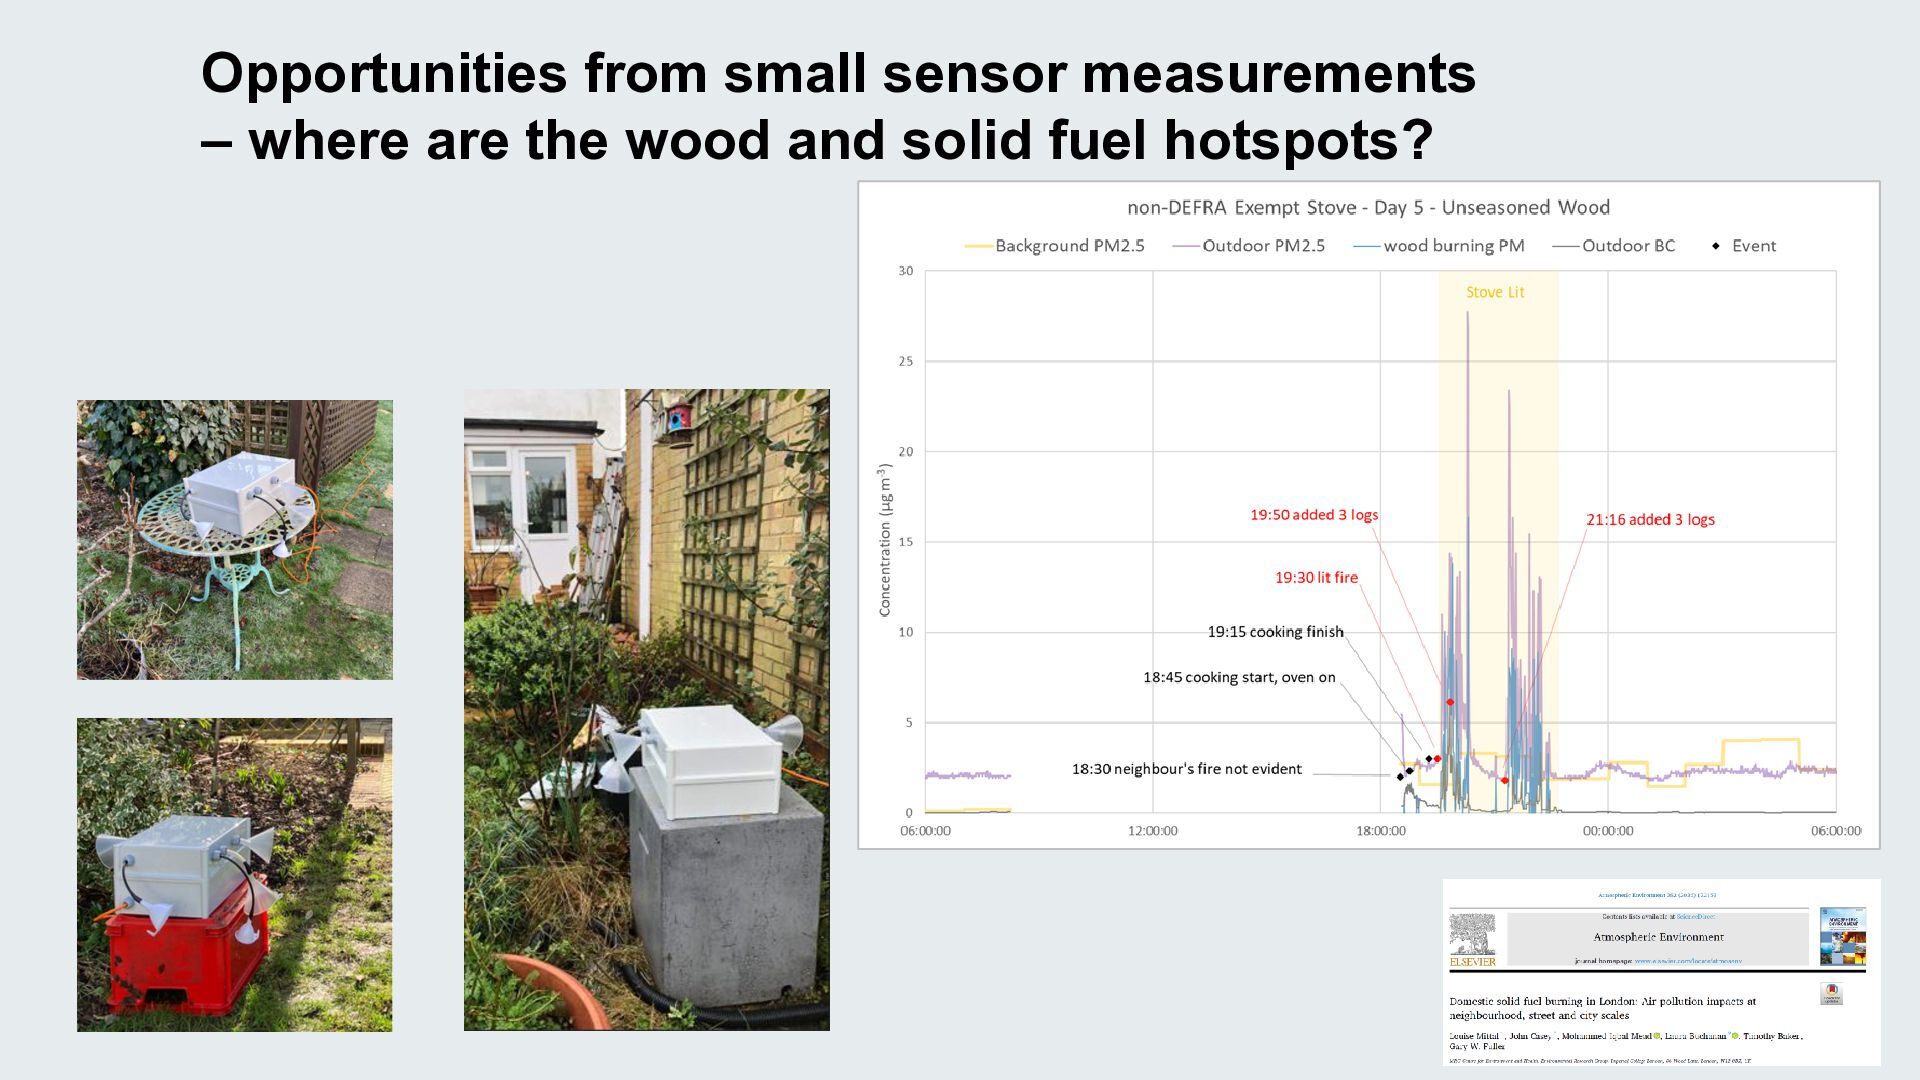
  14. Opportunities from small sensor measurements – where are the wood

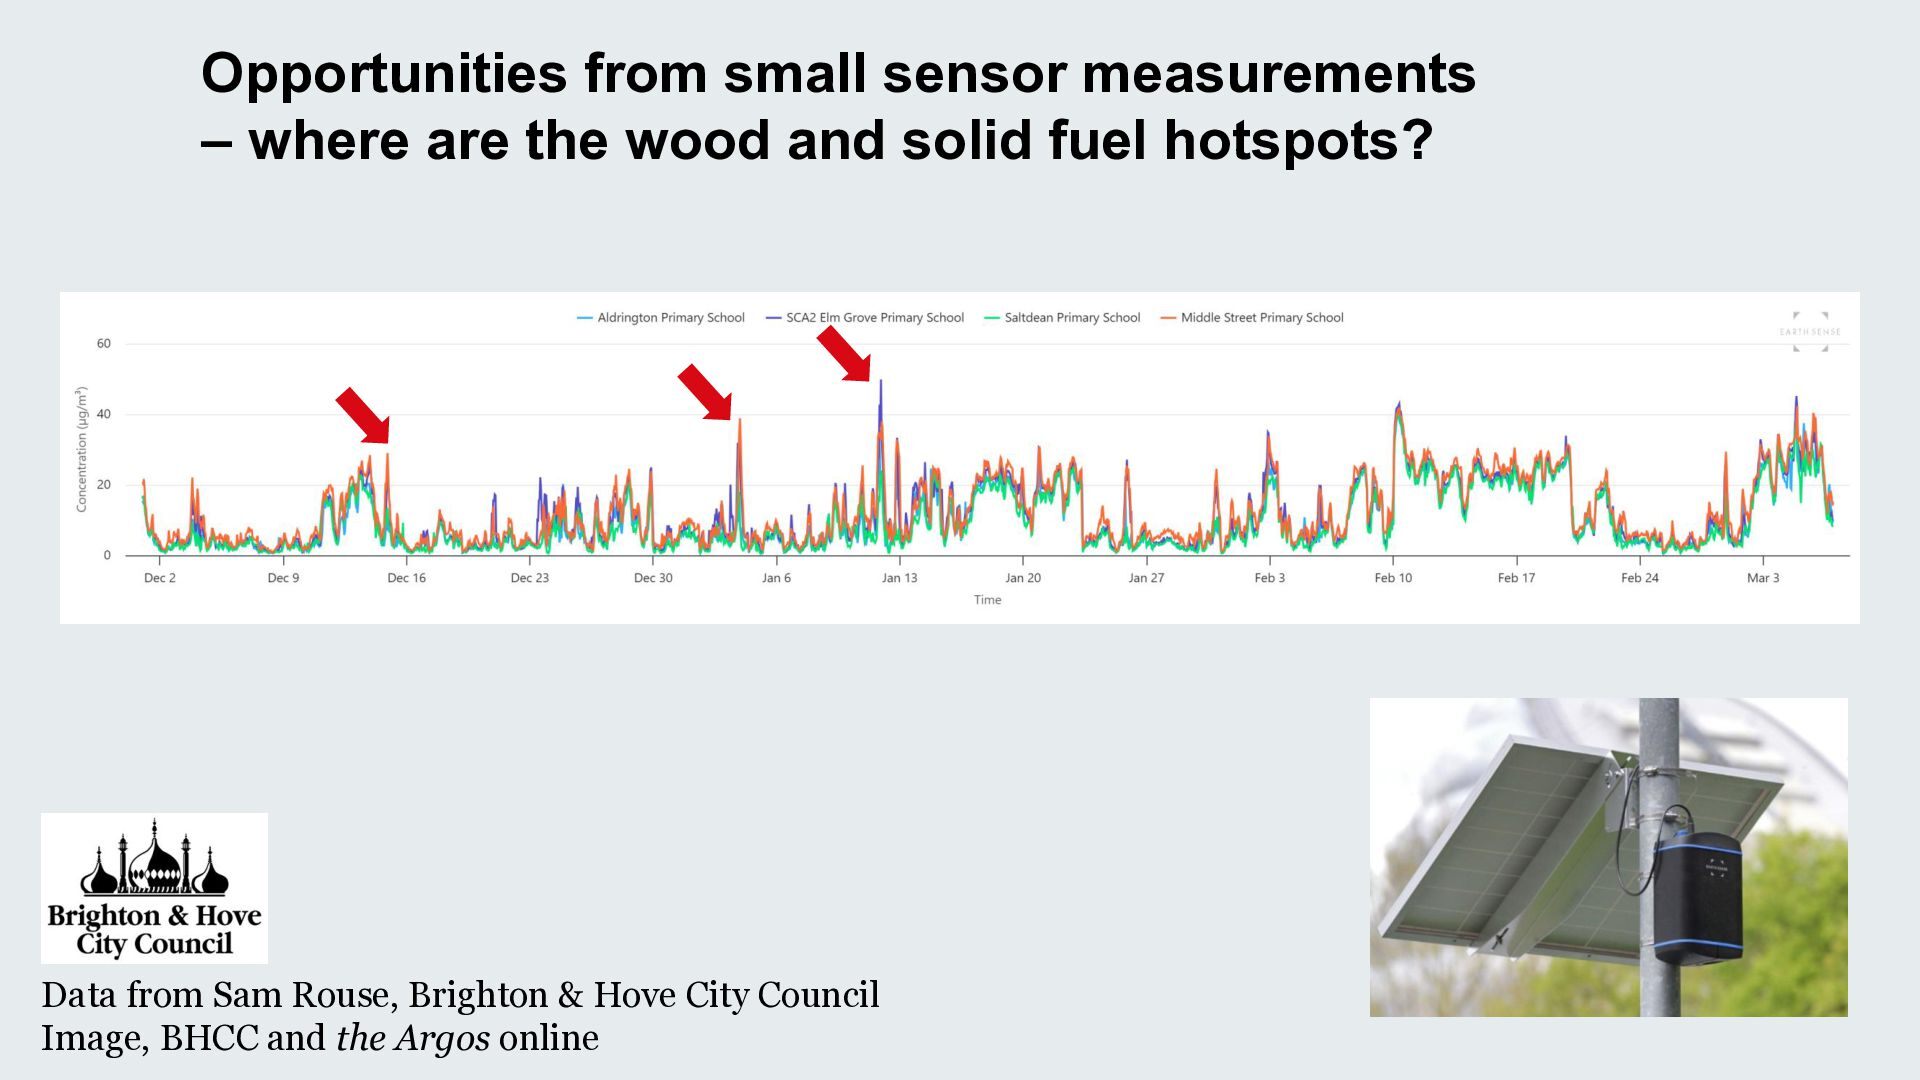
    and solid fuel hotspots? Data from Sam Rouse, Brighton & Hove City Council Image, BHCC and the Argos online
  15. Opportunities from small sensor measurements – where are the wood

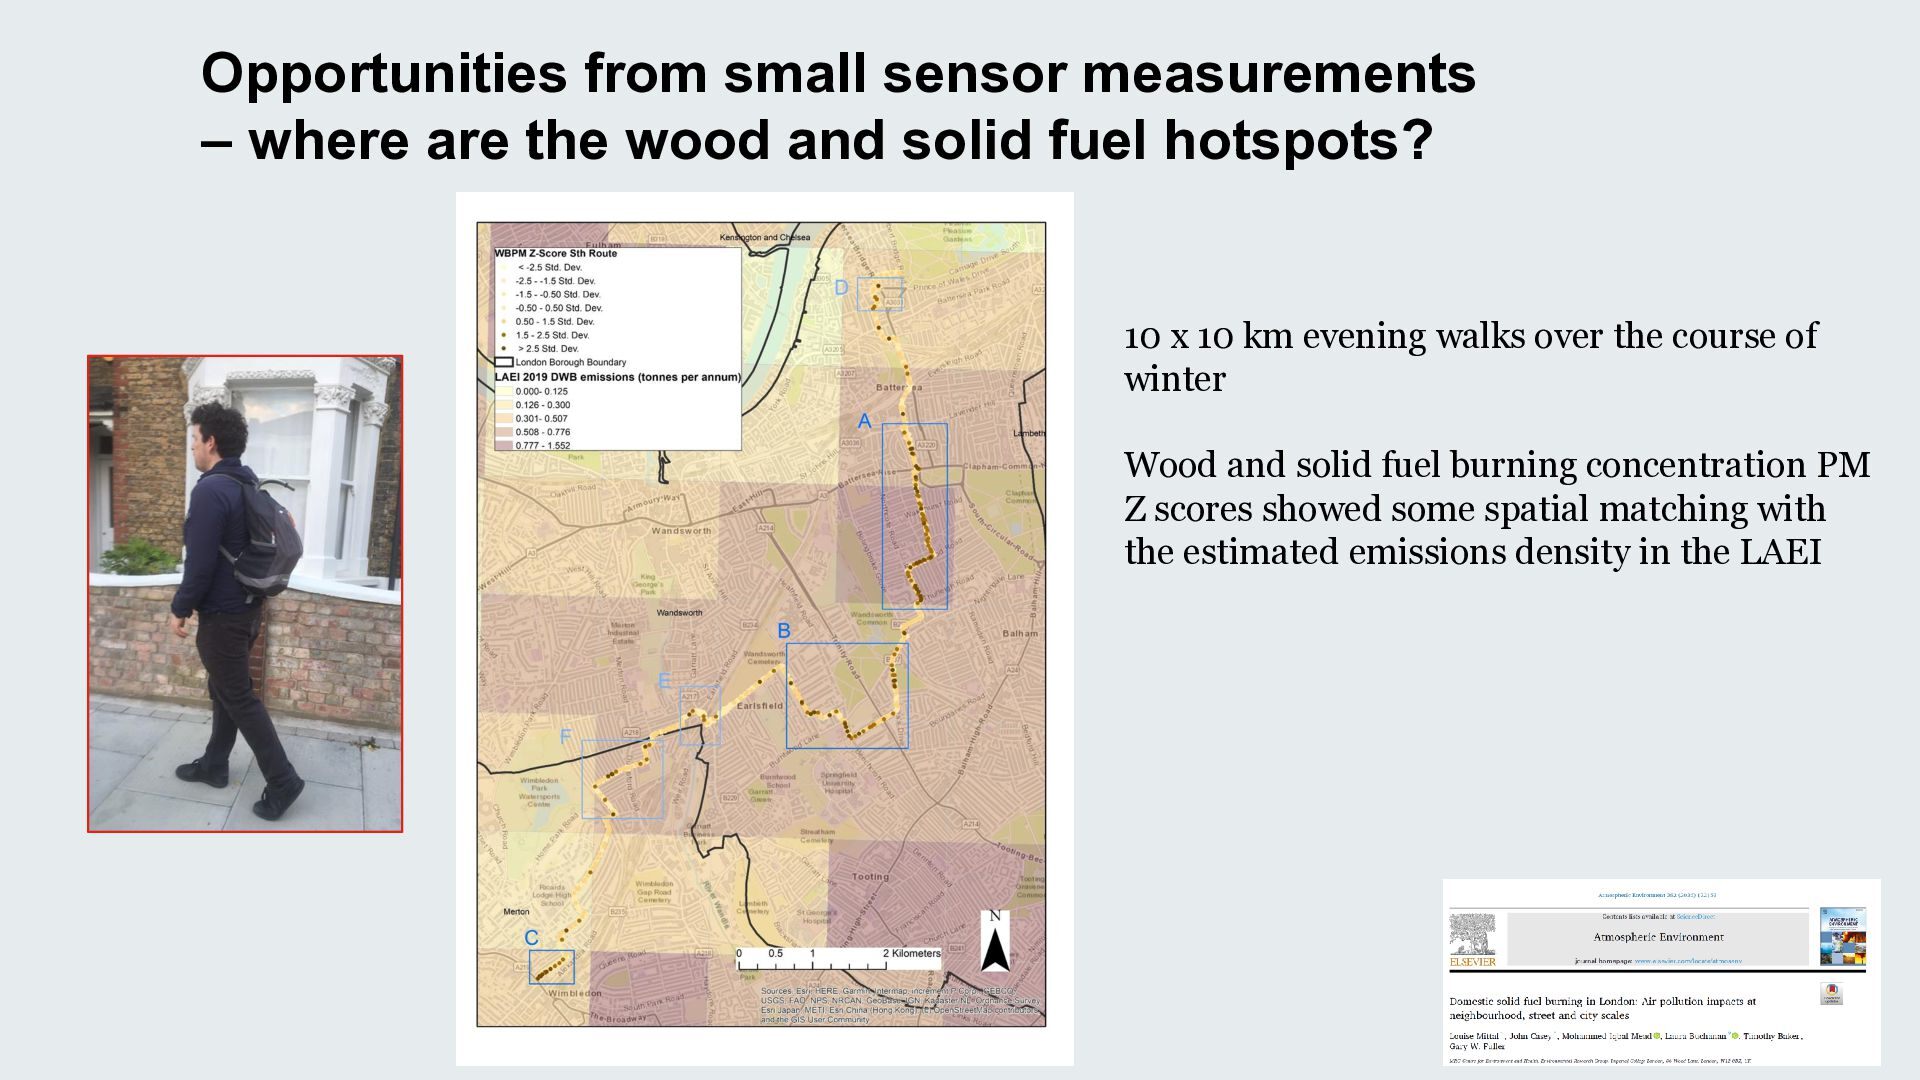
    and solid fuel hotspots? 10 x 10 km evening walks over the course of winter Wood and solid fuel burning concentration PM Z scores showed some spatial matching with the estimated emissions density in the LAEI
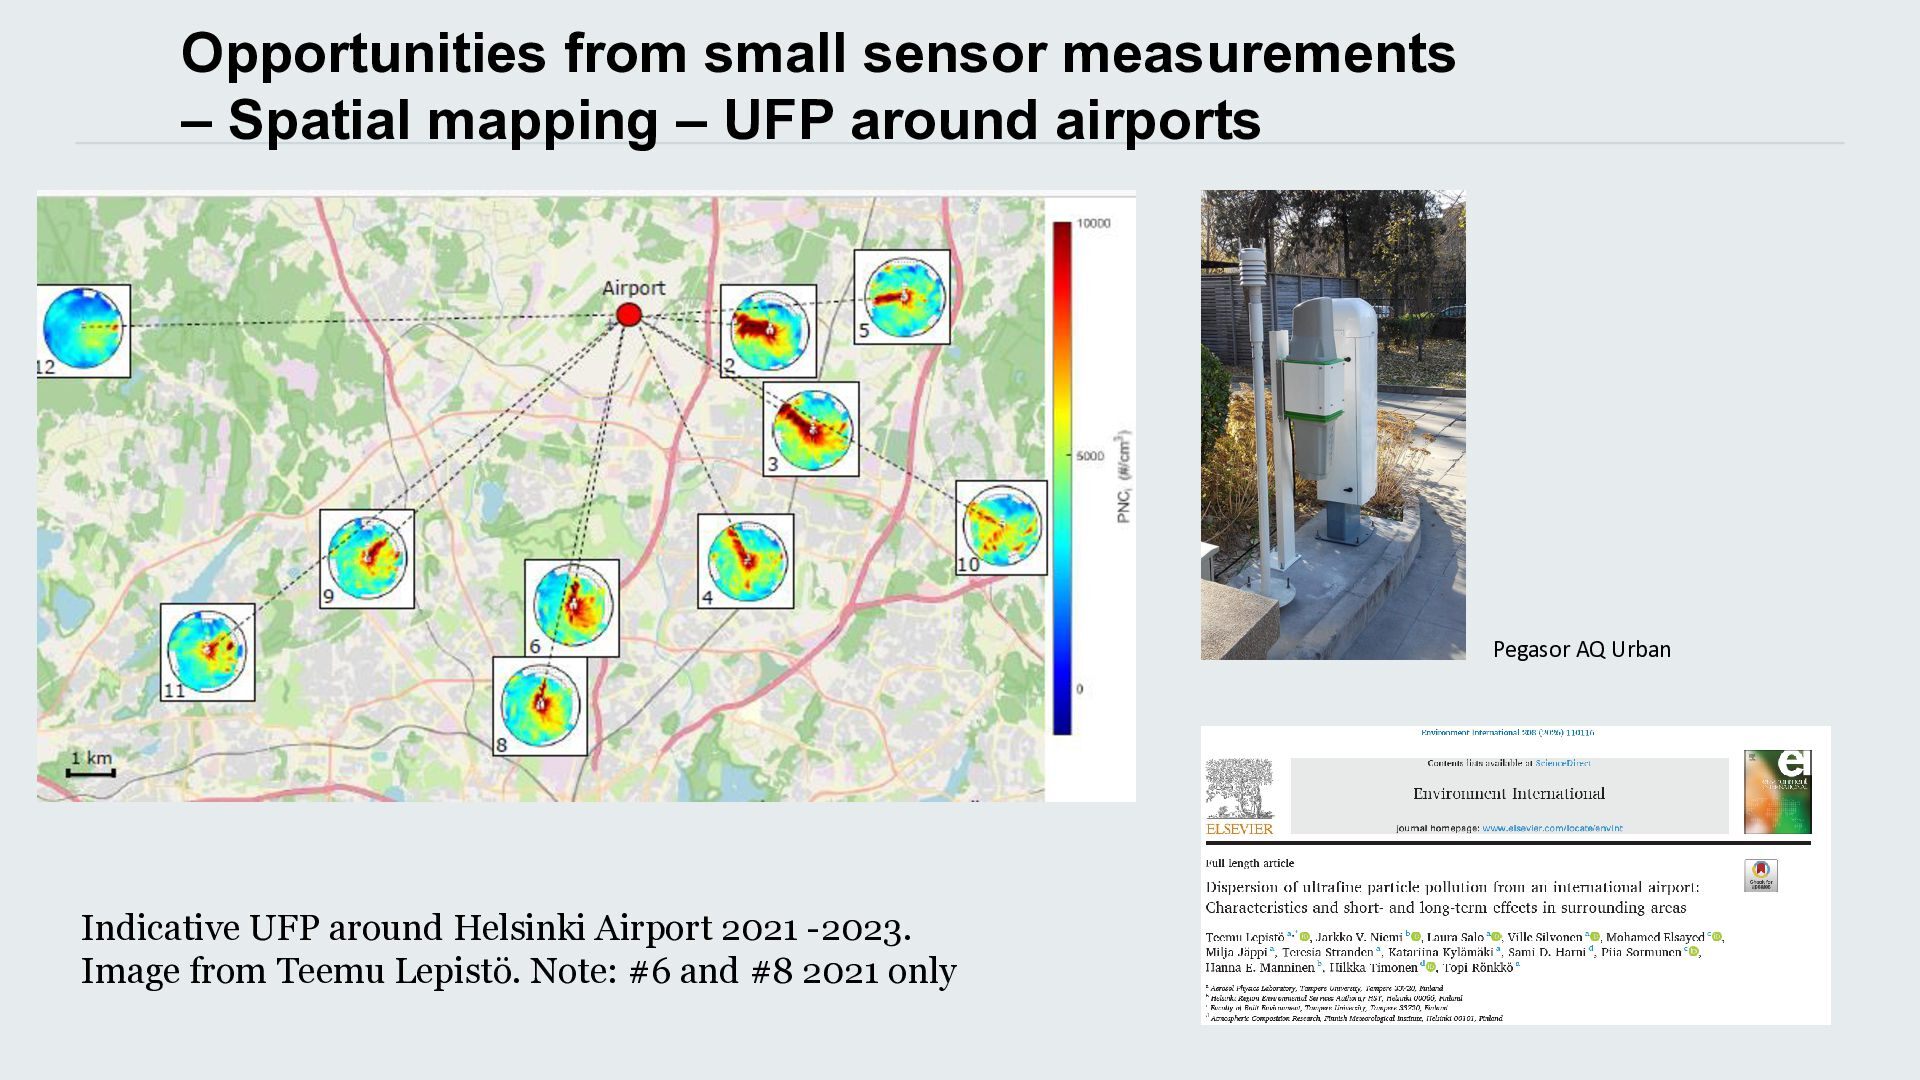
  16. Opportunities from small sensor measurements – Spatial mapping – UFP

    around airports Pegasor AQ Urban Indicative UFP around Helsinki Airport 2021 -2023. Image from Teemu Lepistö. Note: #6 and #8 2021 only
  17. Dr Gary Fuller [email protected] www.theguardian.com/profile/gary-fuller Measurement opportunities in a regulatory

    context IAQM Routes to Clean Air – Oct 2026 With thanks to David Green, James Allan and AQEG members for slides www.ukcleanair.org/