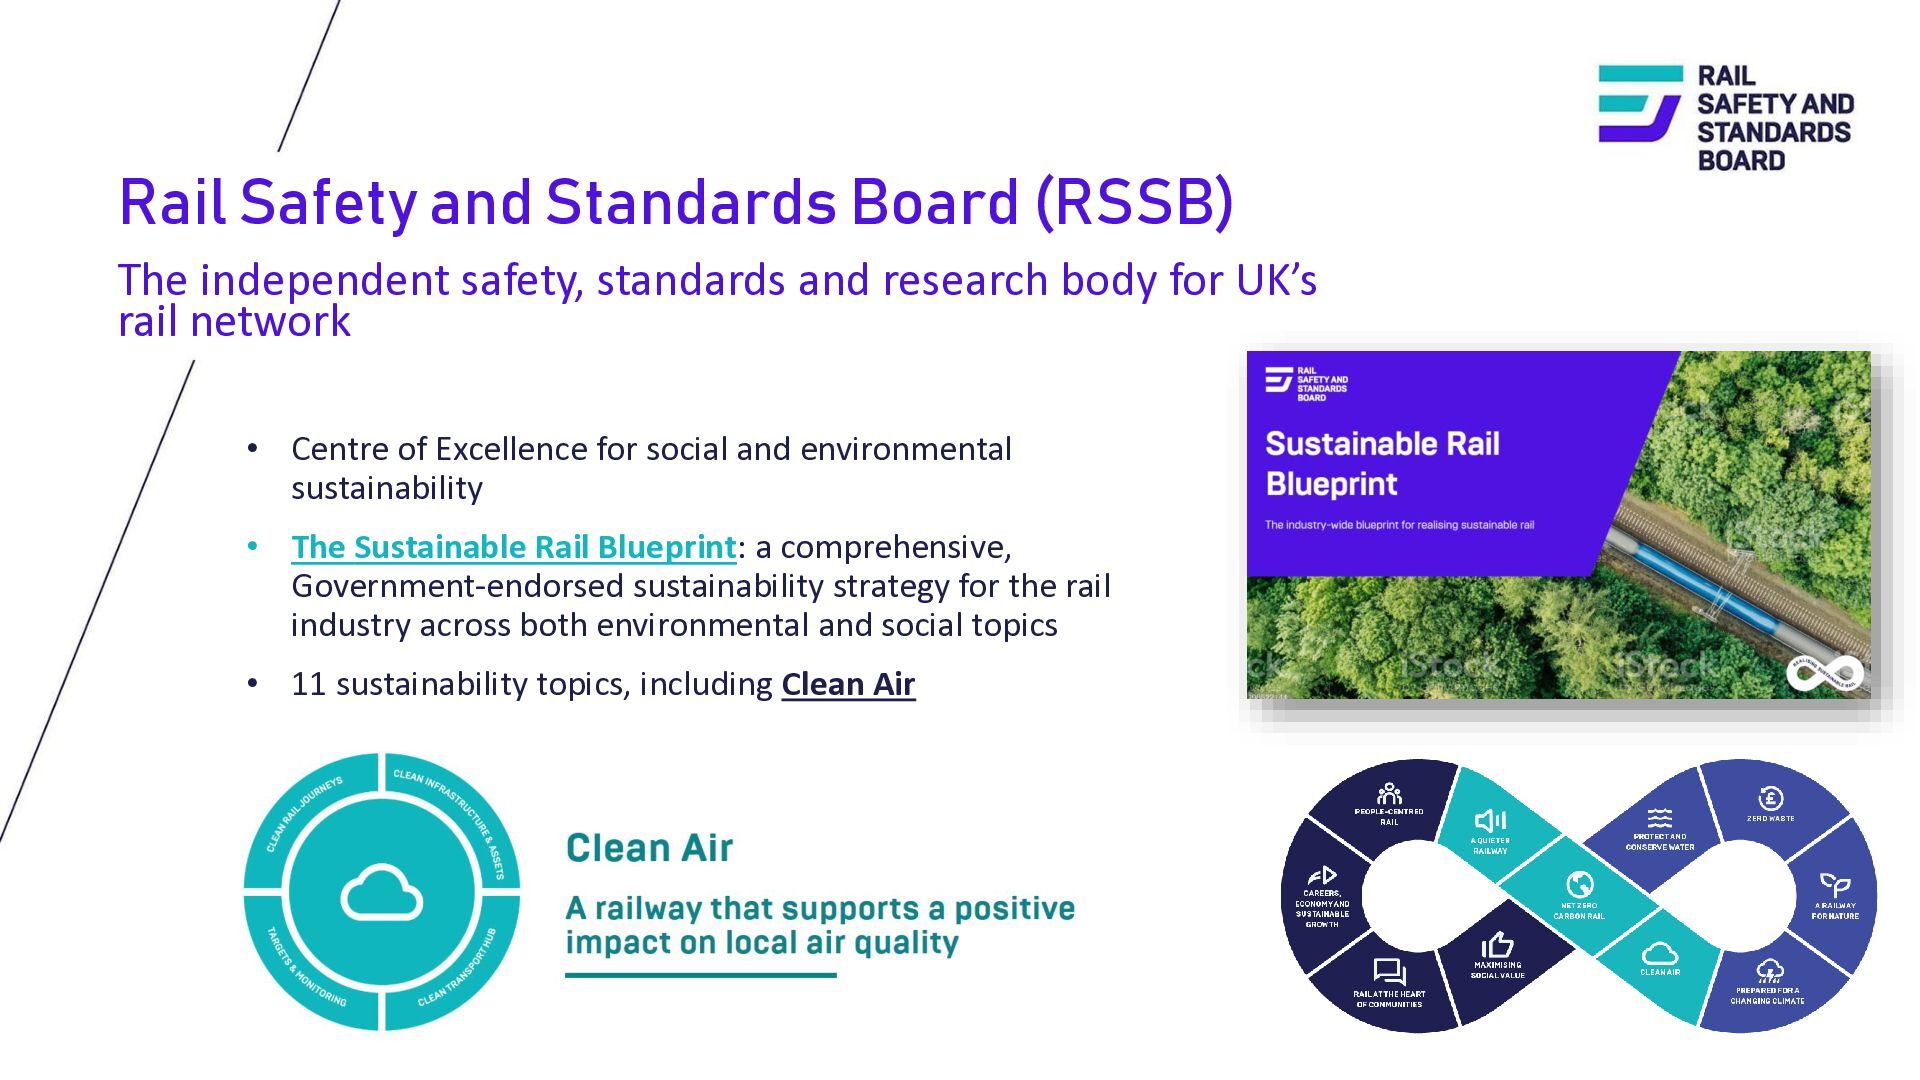
and research body for UK’s rail network • Centre of Excellence for social and environmental sustainability • The Sustainable Rail Blueprint: a comprehensive, Government-endorsed sustainability strategy for the rail industry across both environmental and social topics • 11 sustainability topics, including Clean Air 2
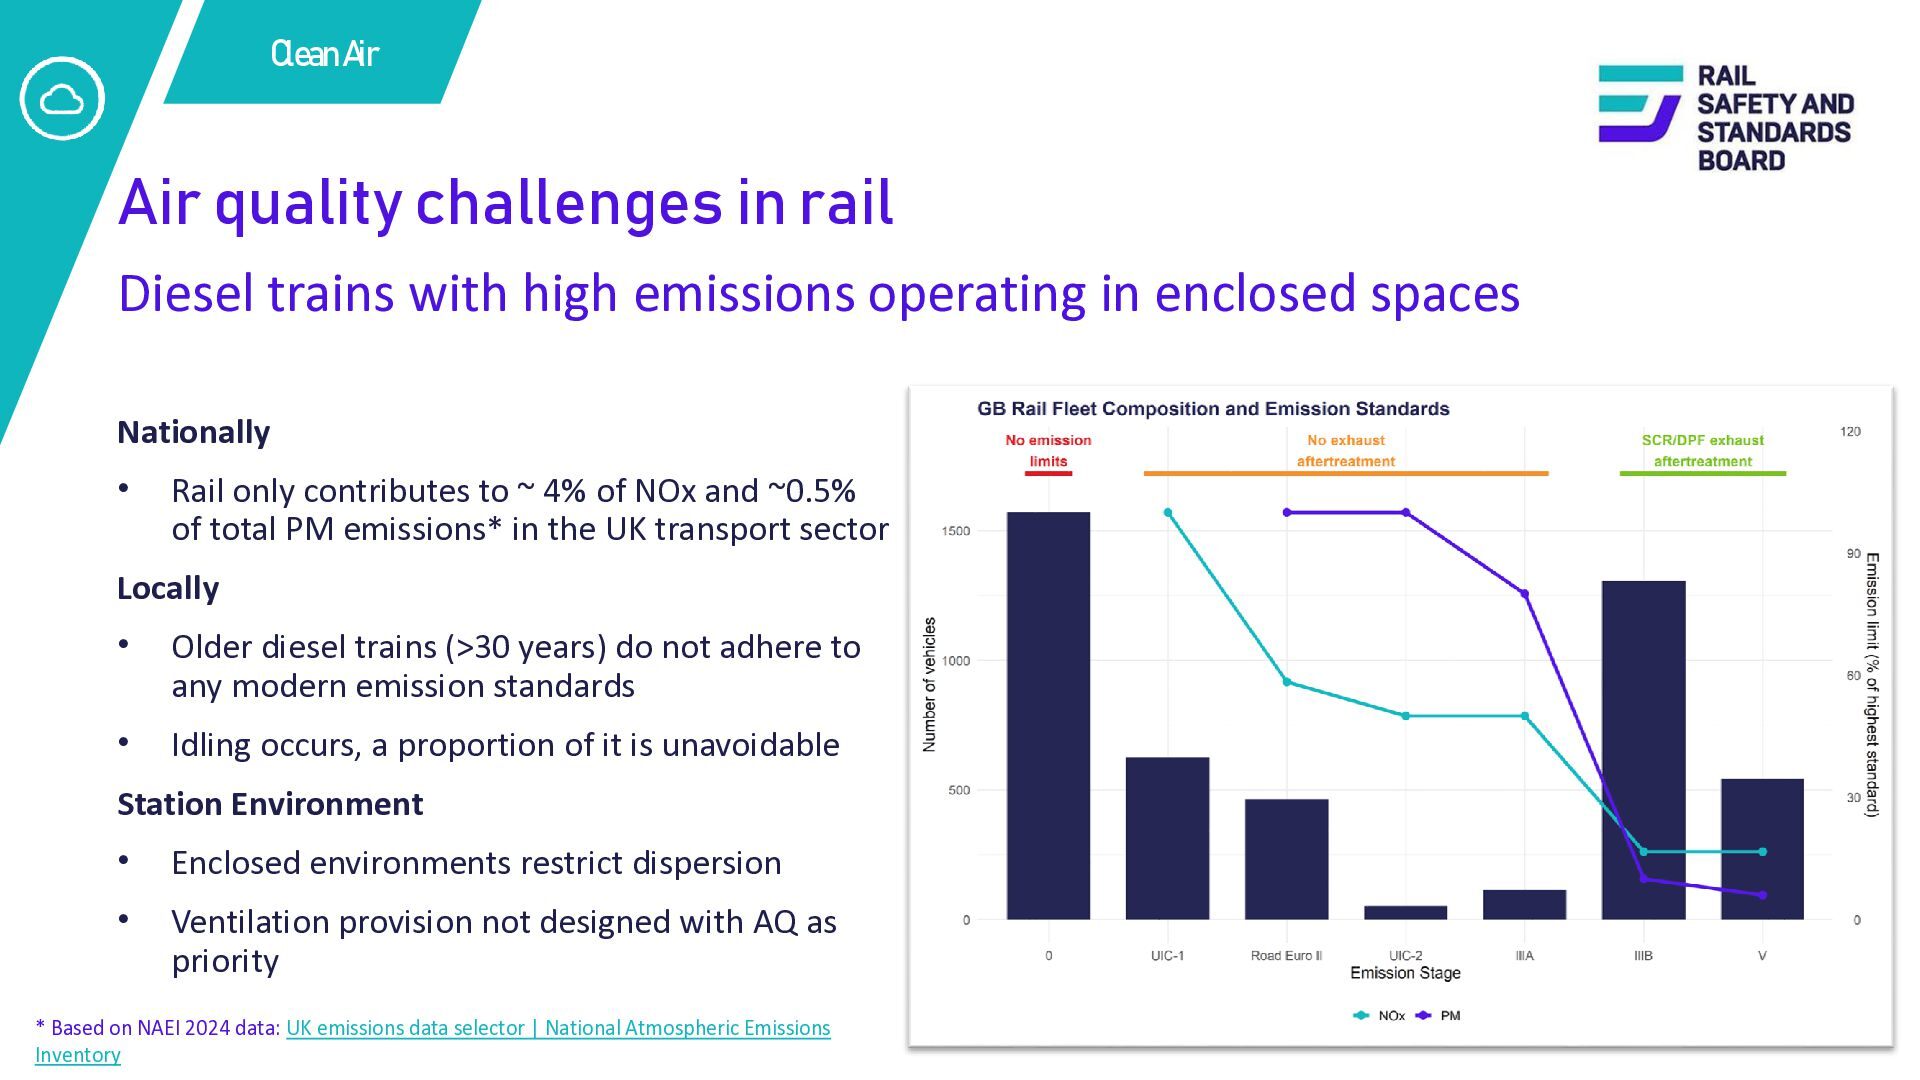
high emissions operating in enclosed spaces Nationally • Rail only contributes to ~ 4% of NOx and ~0.5% of total PM emissions* in the UK transport sector Locally • Older diesel trains (>30 years) do not adhere to any modern emission standards • Idling occurs, a proportion of it is unavoidable Station Environment • Enclosed environments restrict dispersion • Ventilation provision not designed with AQ as priority * Based on NAEI 2024 data: UK emissions data selector | National Atmospheric Emissions Inventory 4
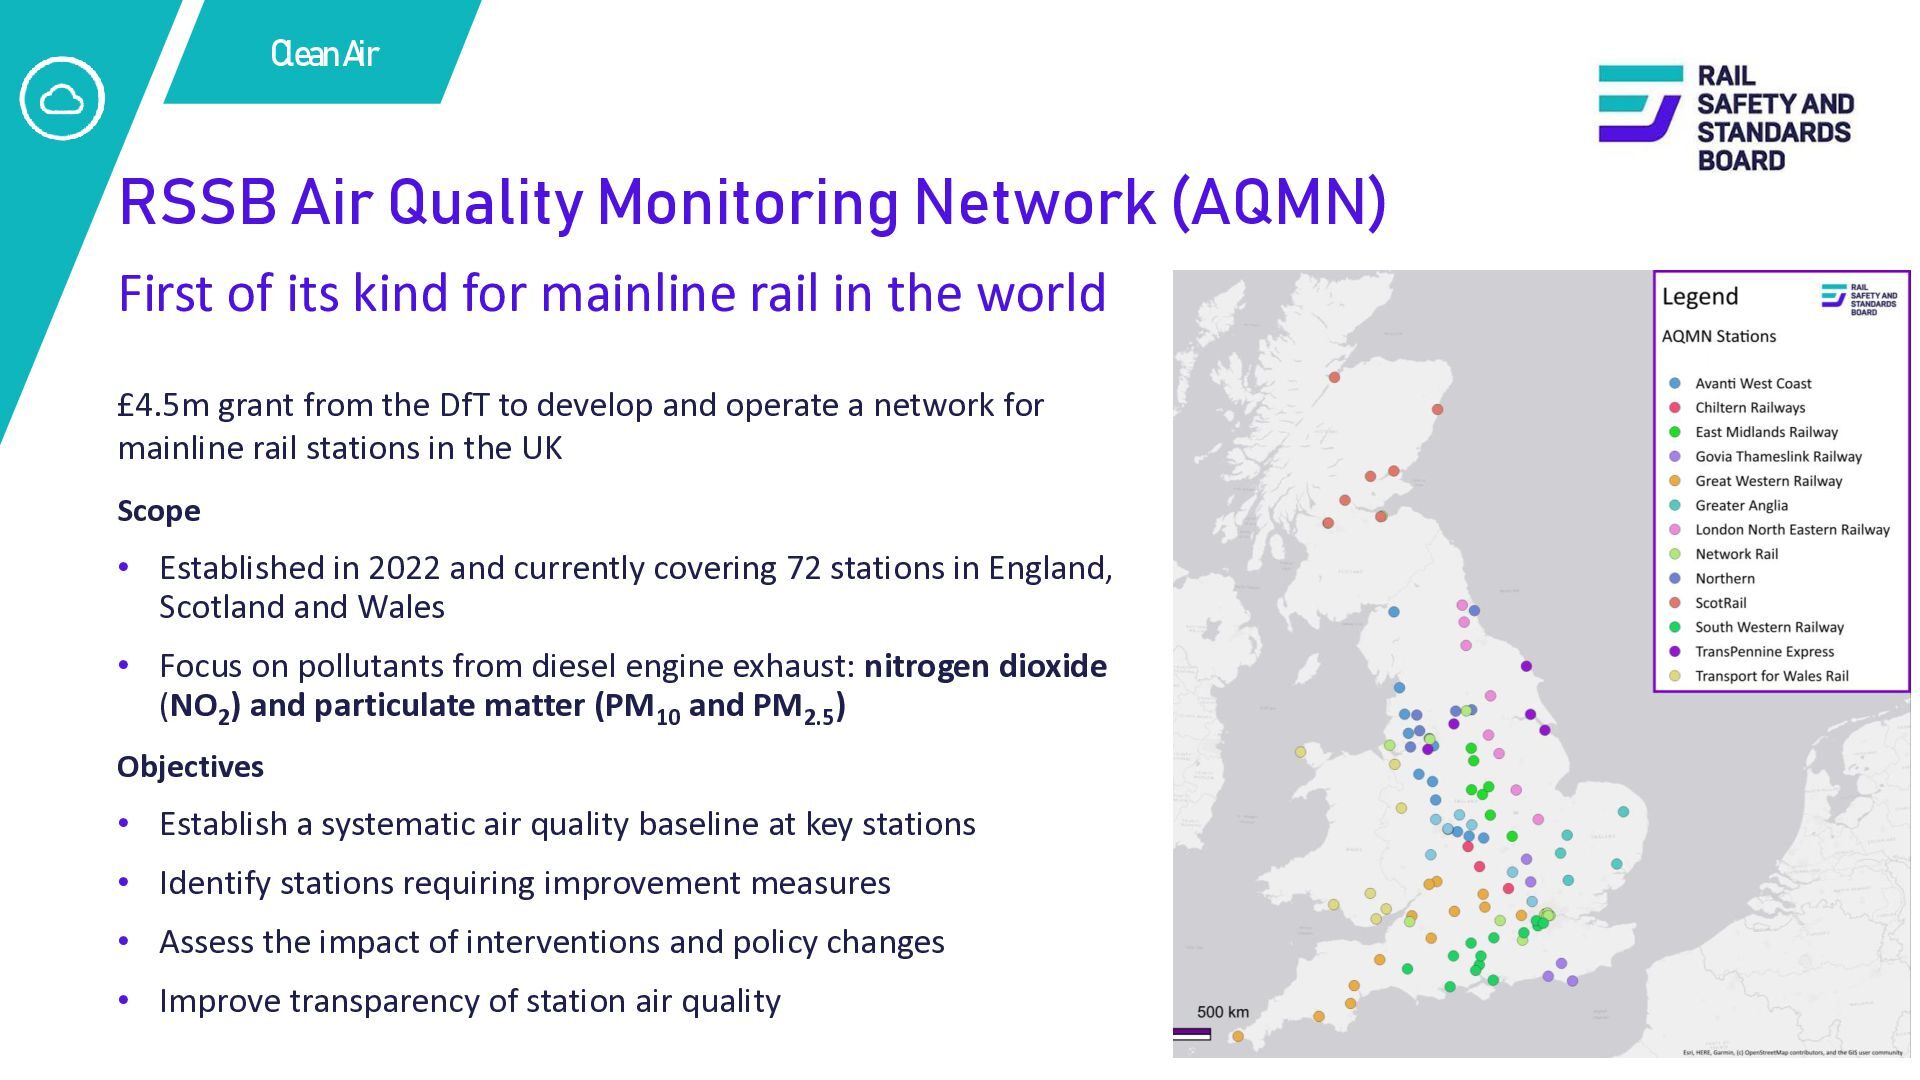
its kind for mainline rail in the world £4.5m grant from the DfT to develop and operate a network for mainline rail stations in the UK Scope • Established in 2022 and currently covering 72 stations in England, Scotland and Wales • Focus on pollutants from diesel engine exhaust: nitrogen dioxide (NO2) and particulate matter (PM10 and PM2.5) Objectives • Establish a systematic air quality baseline at key stations • Identify stations requiring improvement measures • Assess the impact of interventions and policy changes • Improve transparency of station air quality 5
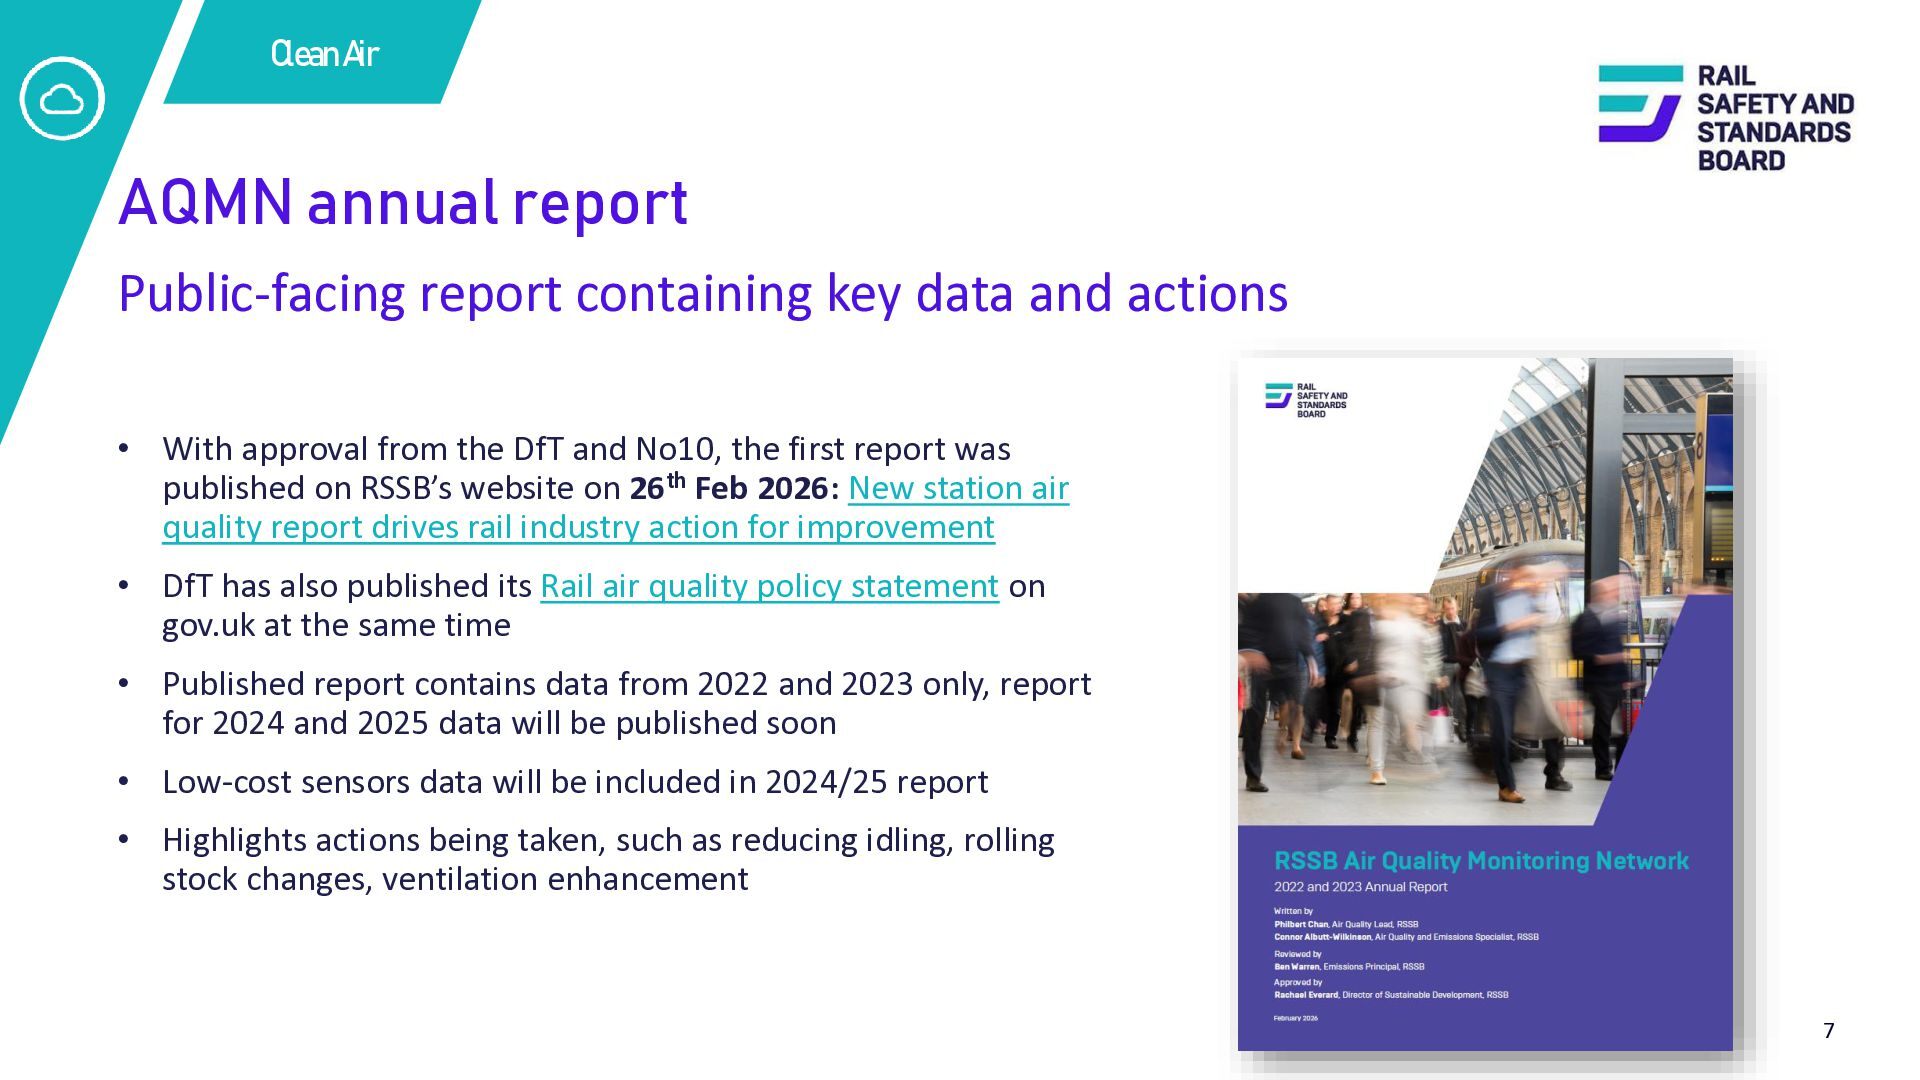
and actions • With approval from the DfT and No10, the first report was published on RSSB’s website on 26th Feb 2026: New station air quality report drives rail industry action for improvement • DfT has also published its Rail air quality policy statement on gov.uk at the same time • Published report contains data from 2022 and 2023 only, report for 2024 and 2025 data will be published soon • Low-cost sensors data will be included in 2024/25 report • Highlights actions being taken, such as reducing idling, rolling stock changes, ventilation enhancement 7
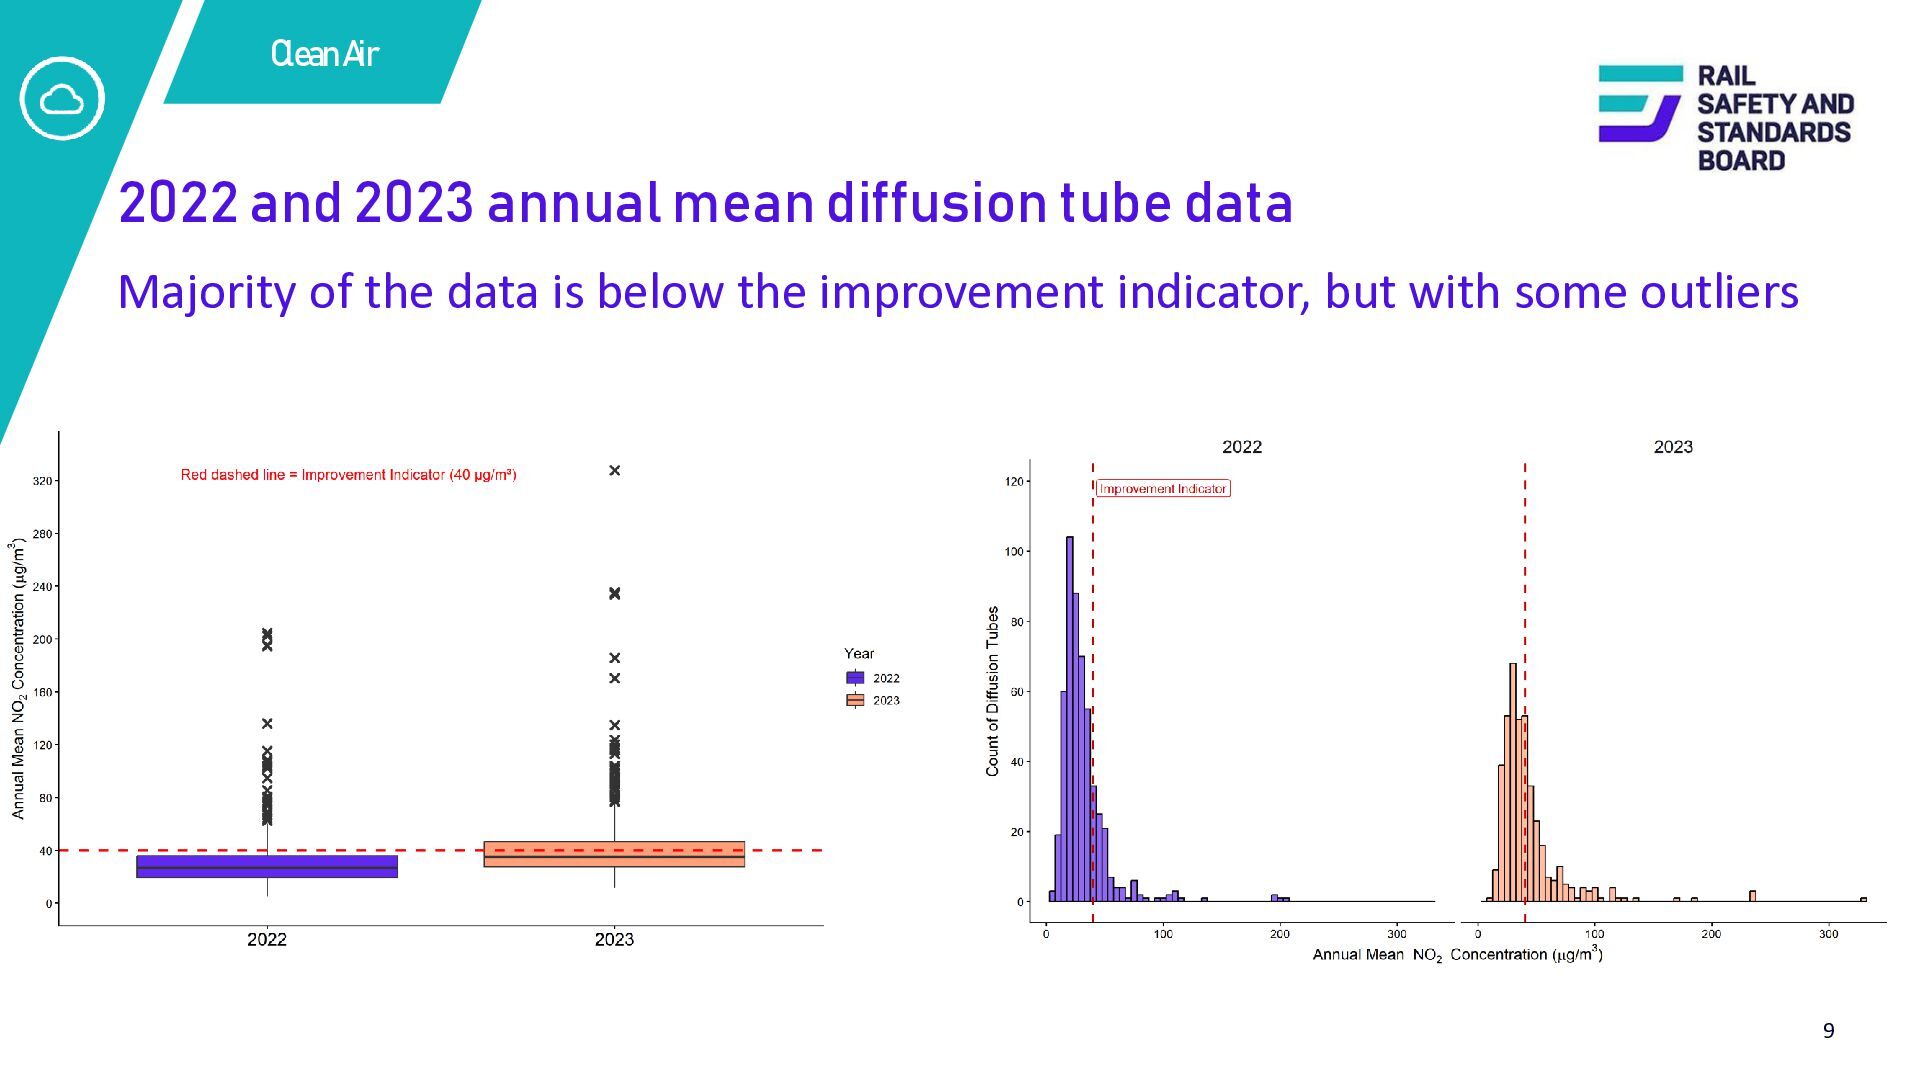
have AQ issues, but those with issues can be serious There is no legal or regulatory air quality targets for the protection of the general public in enclosed train stations. We use an ‘improvement indicator’ of 40 µg/m³ of nitrogen dioxide (as an annual mean) to determine which stations require mitigation measures • Data collected has shown that about 50 stations across the network (2%) require air quality improvement. For context there are 2,585 mainline stations (as of 2024) • These 2% of stations account for 19% of all passenger movements across the network. Many stations with air quality issues are interchange or terminal stations, so passenger footfall is high • At some stations (e.g. Birmingham New Street), the pollution level is significantly higher than the worst roadside location in the UK • Data suggests level of NO2 within station is largely driven by diesel train activities, less so for PM 8
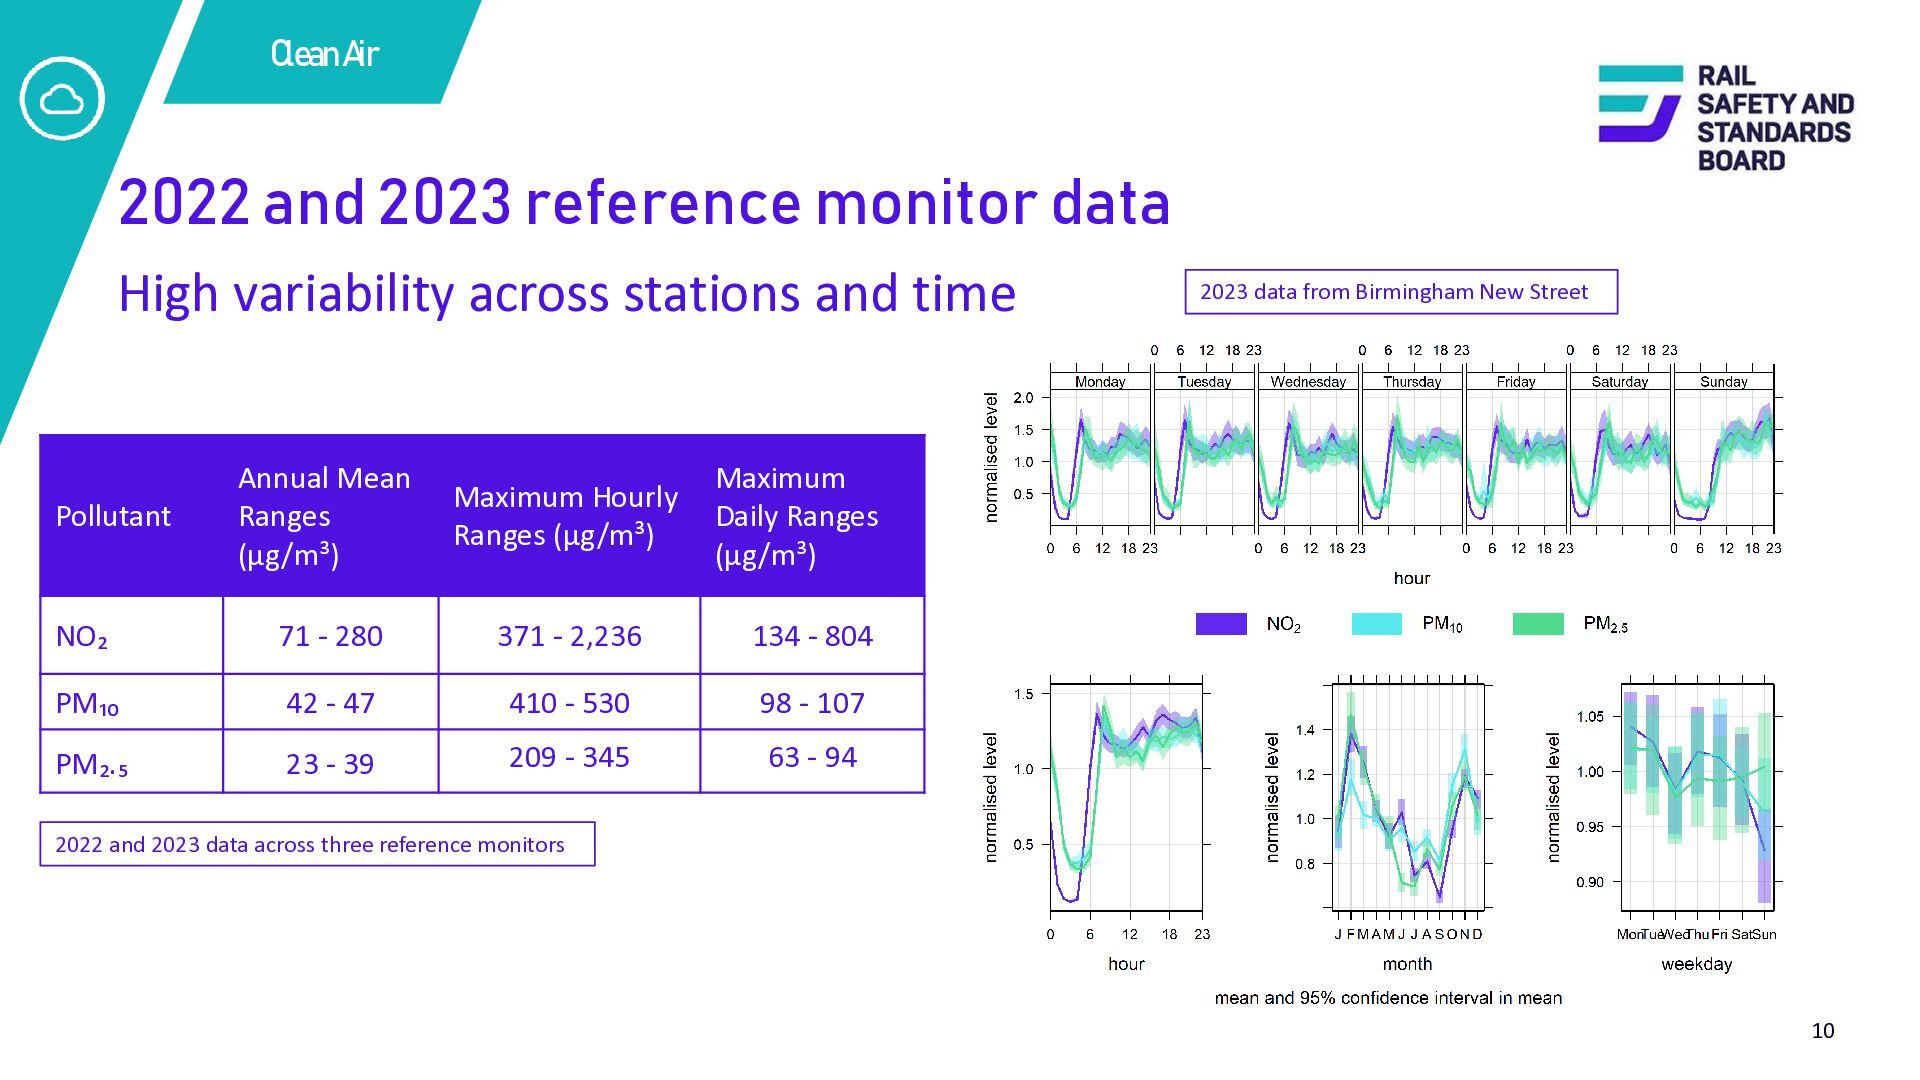
across stations and time Annual Mean Ranges (µg/m³) Maximum Hourly Ranges (µg/m³) Maximum Daily Ranges (µg/m³) NO₂ 71 - 280 371 - 2,236 134 - 804 PM₁₀ 42 - 47 410 - 530 98 - 107 PM₂.₅ 23 - 39 209 - 345 63 - 94 Pollutant 2023 data from Birmingham New Street 2022 and 2023 data across three reference monitors 10
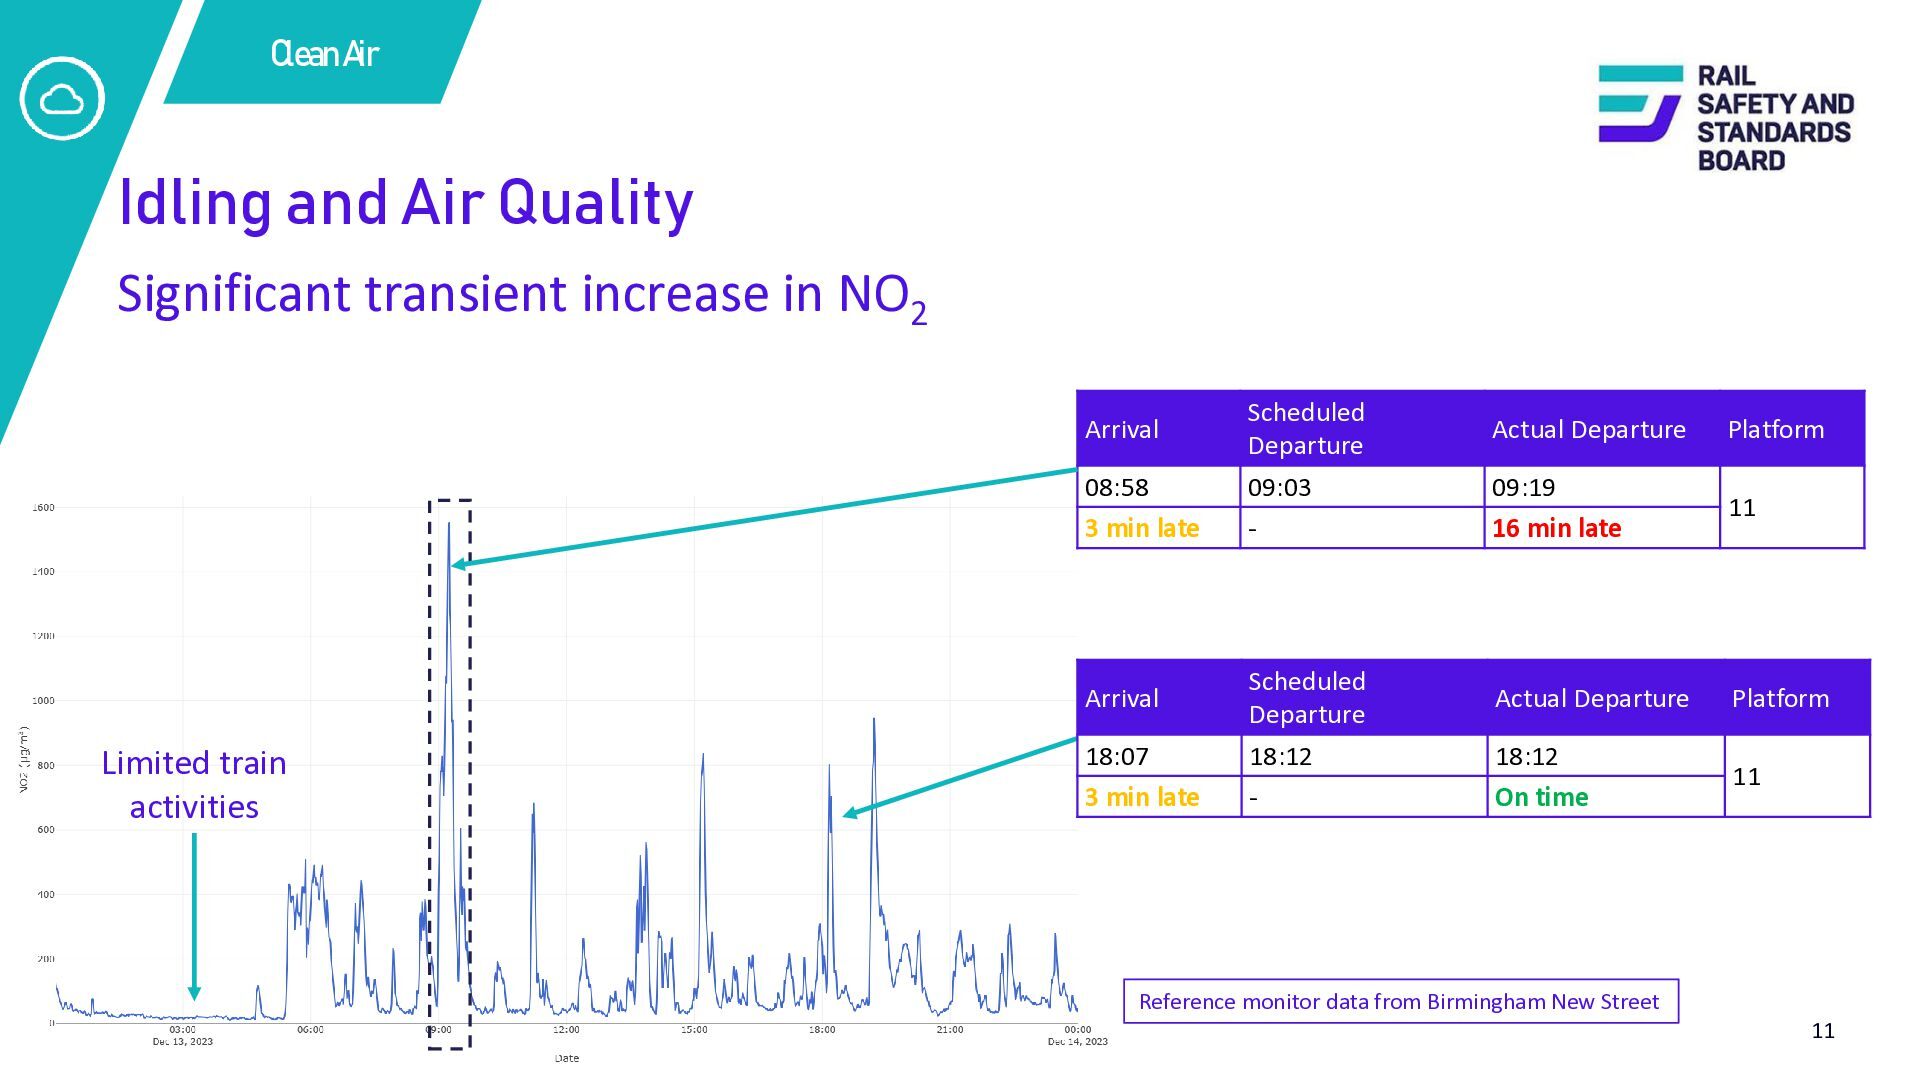
NO2 Arrival 08:58 3 min late Arrival Limited train activities 18:07 3 min late Scheduled Departure 09:03 - Scheduled Departure 18:12 - Actual Departure Platform 09:19 16 min late 11 Actual Departure Platform 18:12 On time 11 Reference monitor data from Birmingham New Street 11
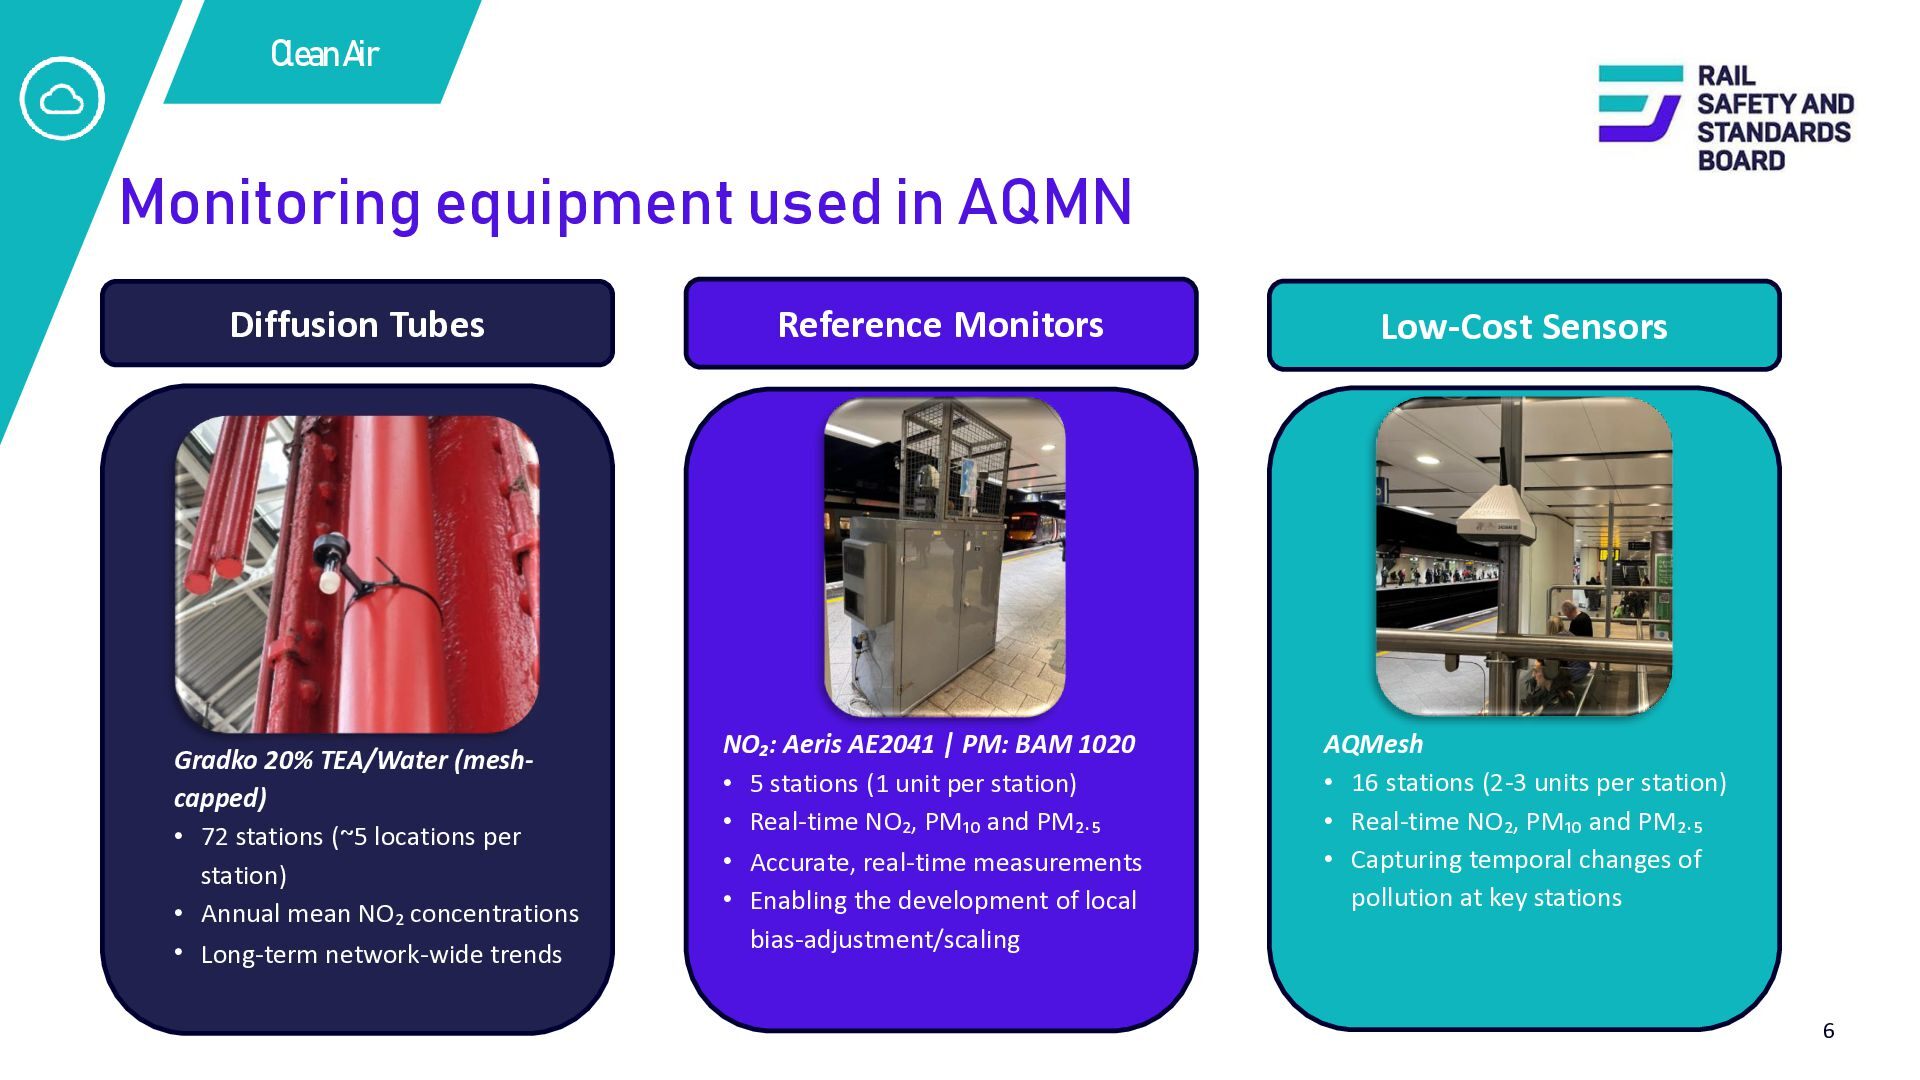
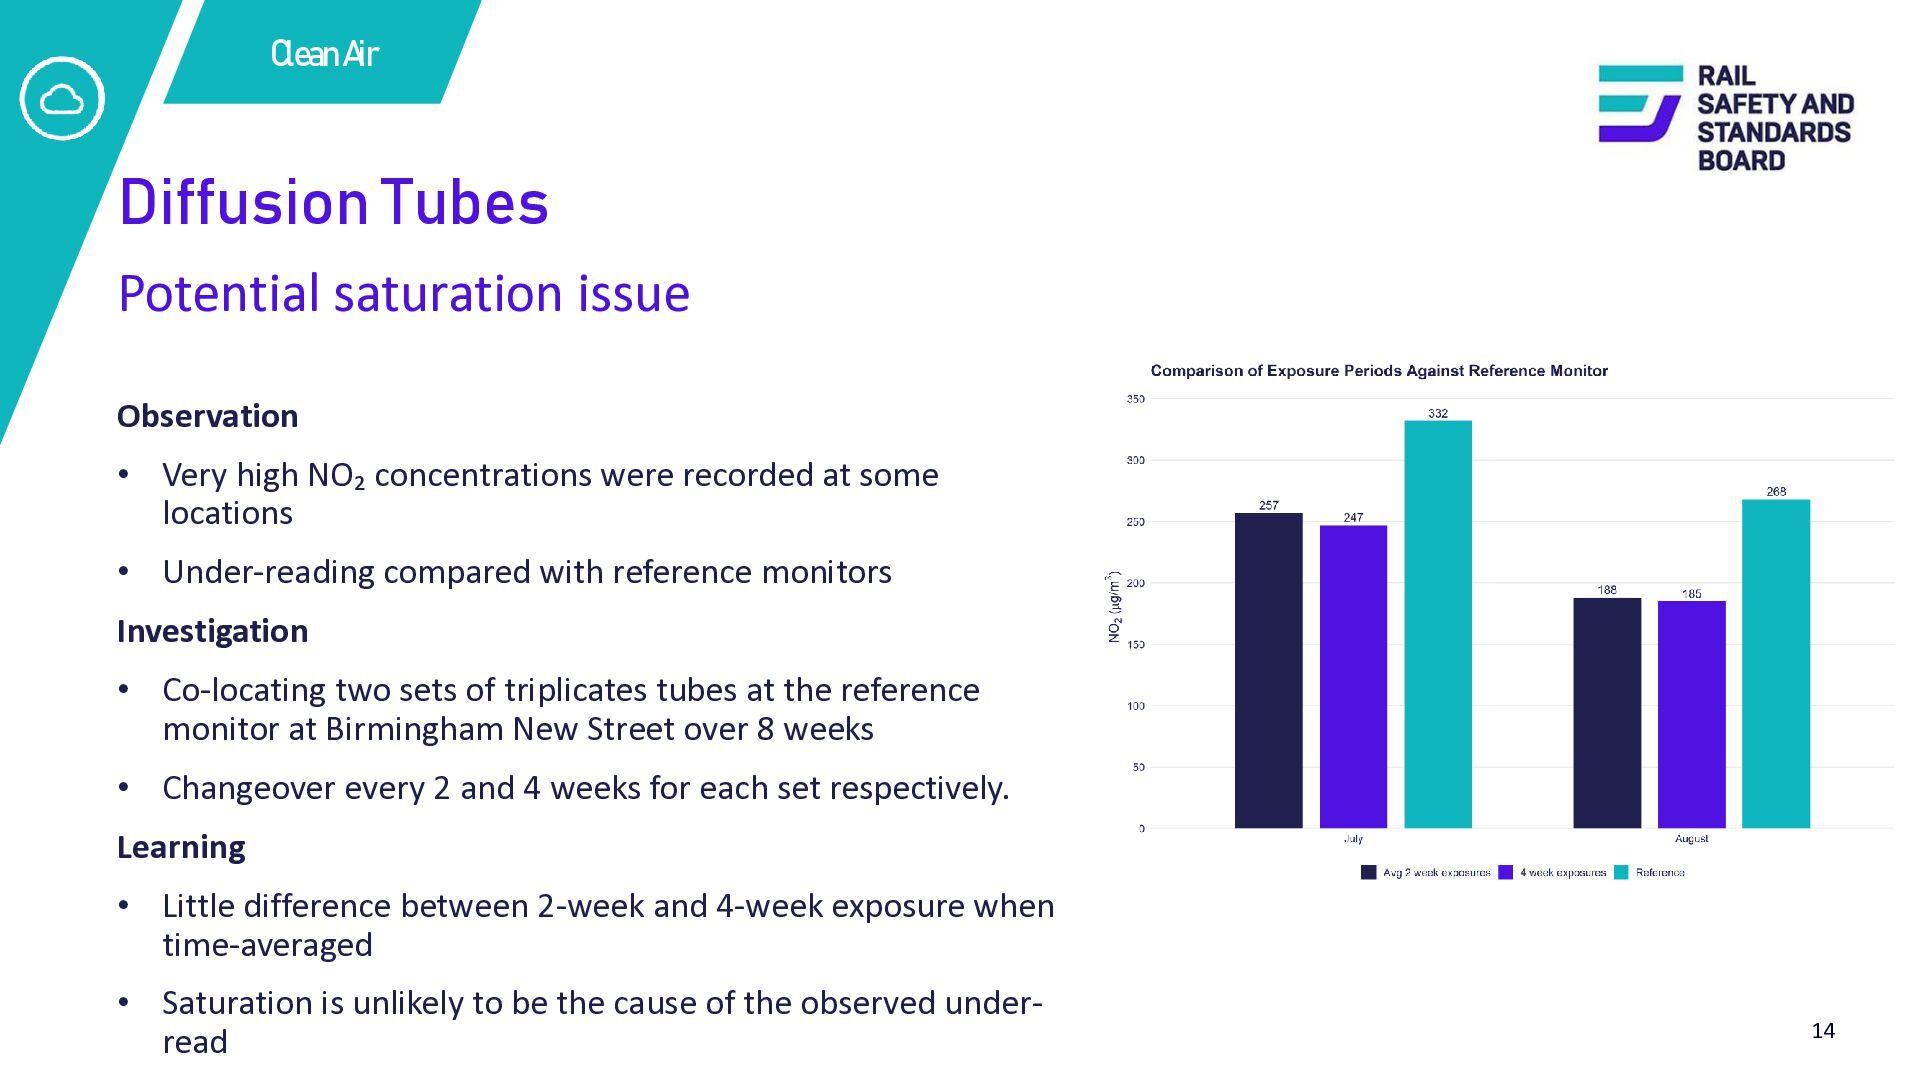
high NO₂ concentrations were recorded at some locations • Under-reading compared with reference monitors Investigation • Co-locating two sets of triplicates tubes at the reference monitor at Birmingham New Street over 8 weeks • Changeover every 2 and 4 weeks for each set respectively. Learning • Little difference between 2-week and 4-week exposure when time-averaged • Saturation is unlikely to be the cause of the observed underread 14
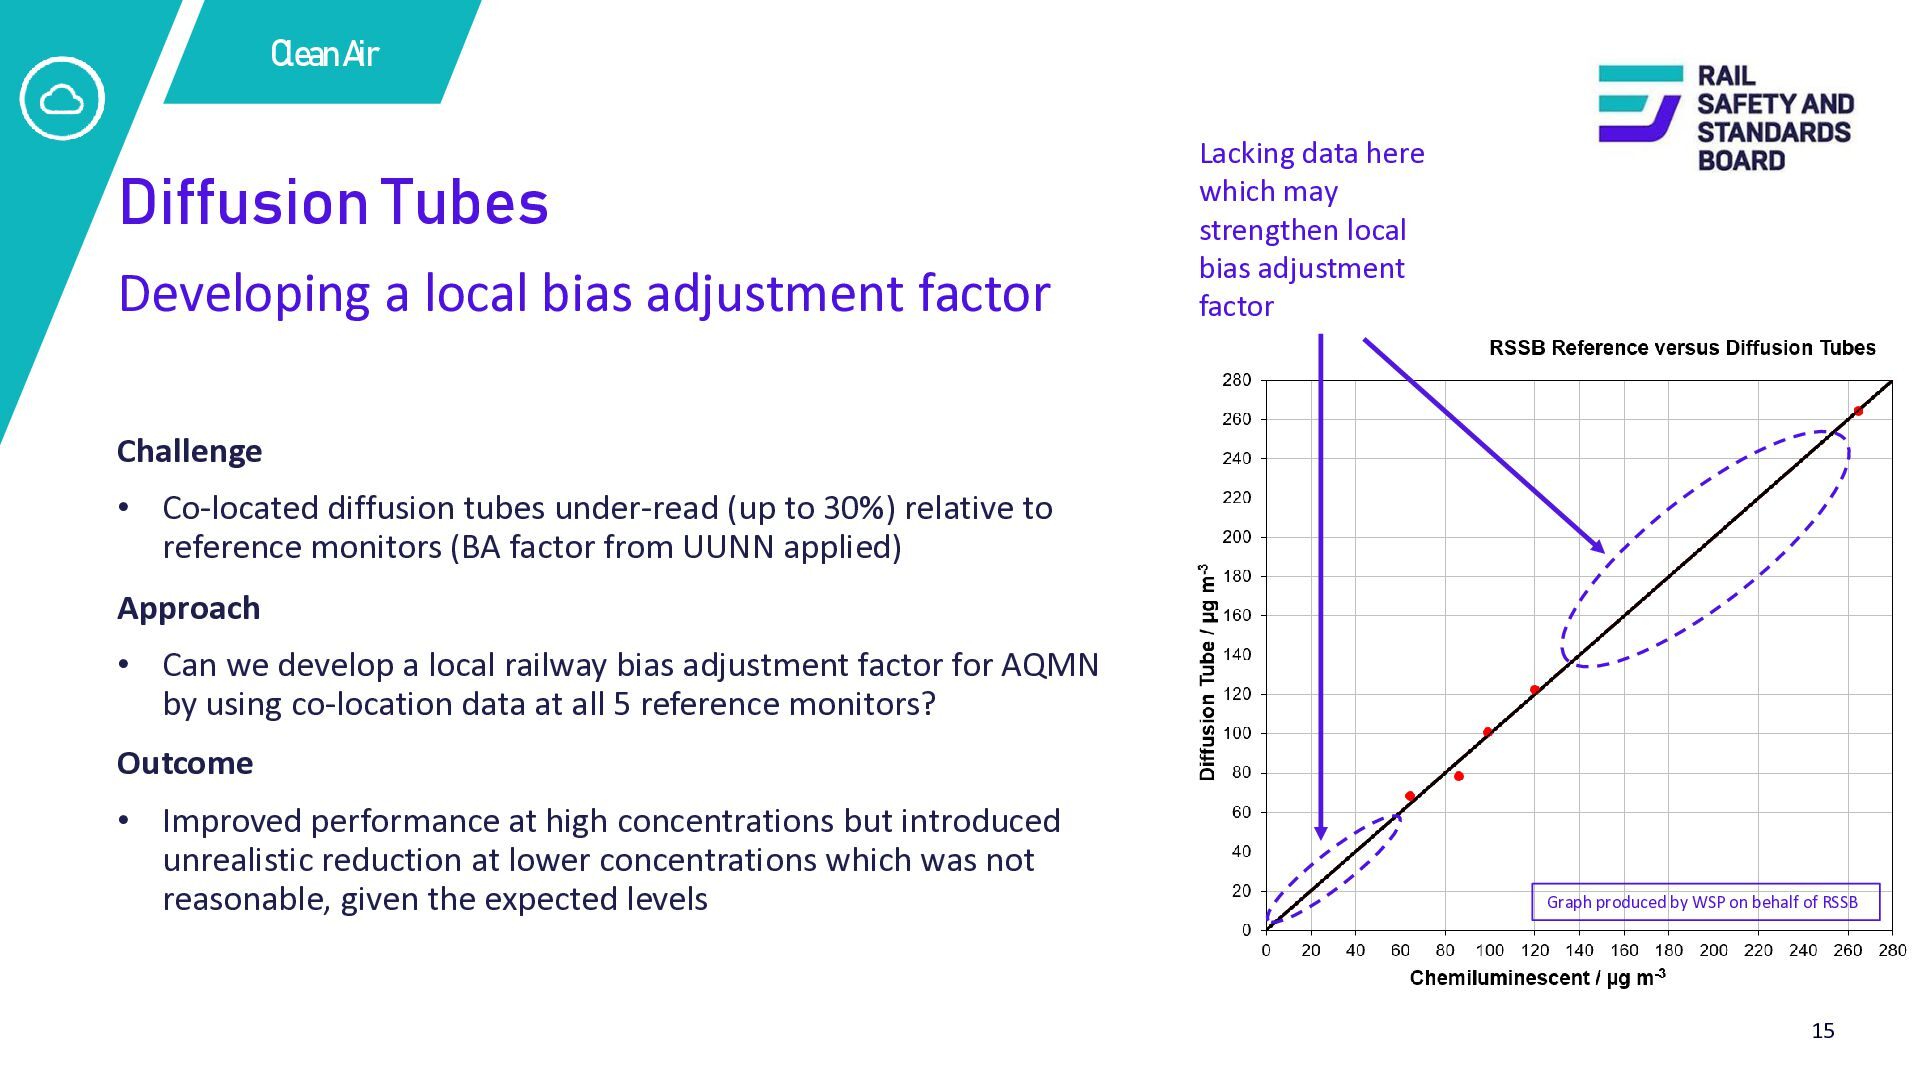
Lacking data here which may strengthen local bias adjustment factor Challenge • Co-located diffusion tubes under-read (up to 30%) relative to reference monitors (BA factor from UUNN applied) Approach • Can we develop a local railway bias adjustment factor for AQMN by using co-location data at all 5 reference monitors? Outcome • Improved performance at high concentrations but introduced unrealistic reduction at lower concentrations which was not reasonable, given the expected levels Graph produced by WSP on behalf of RSSB 15
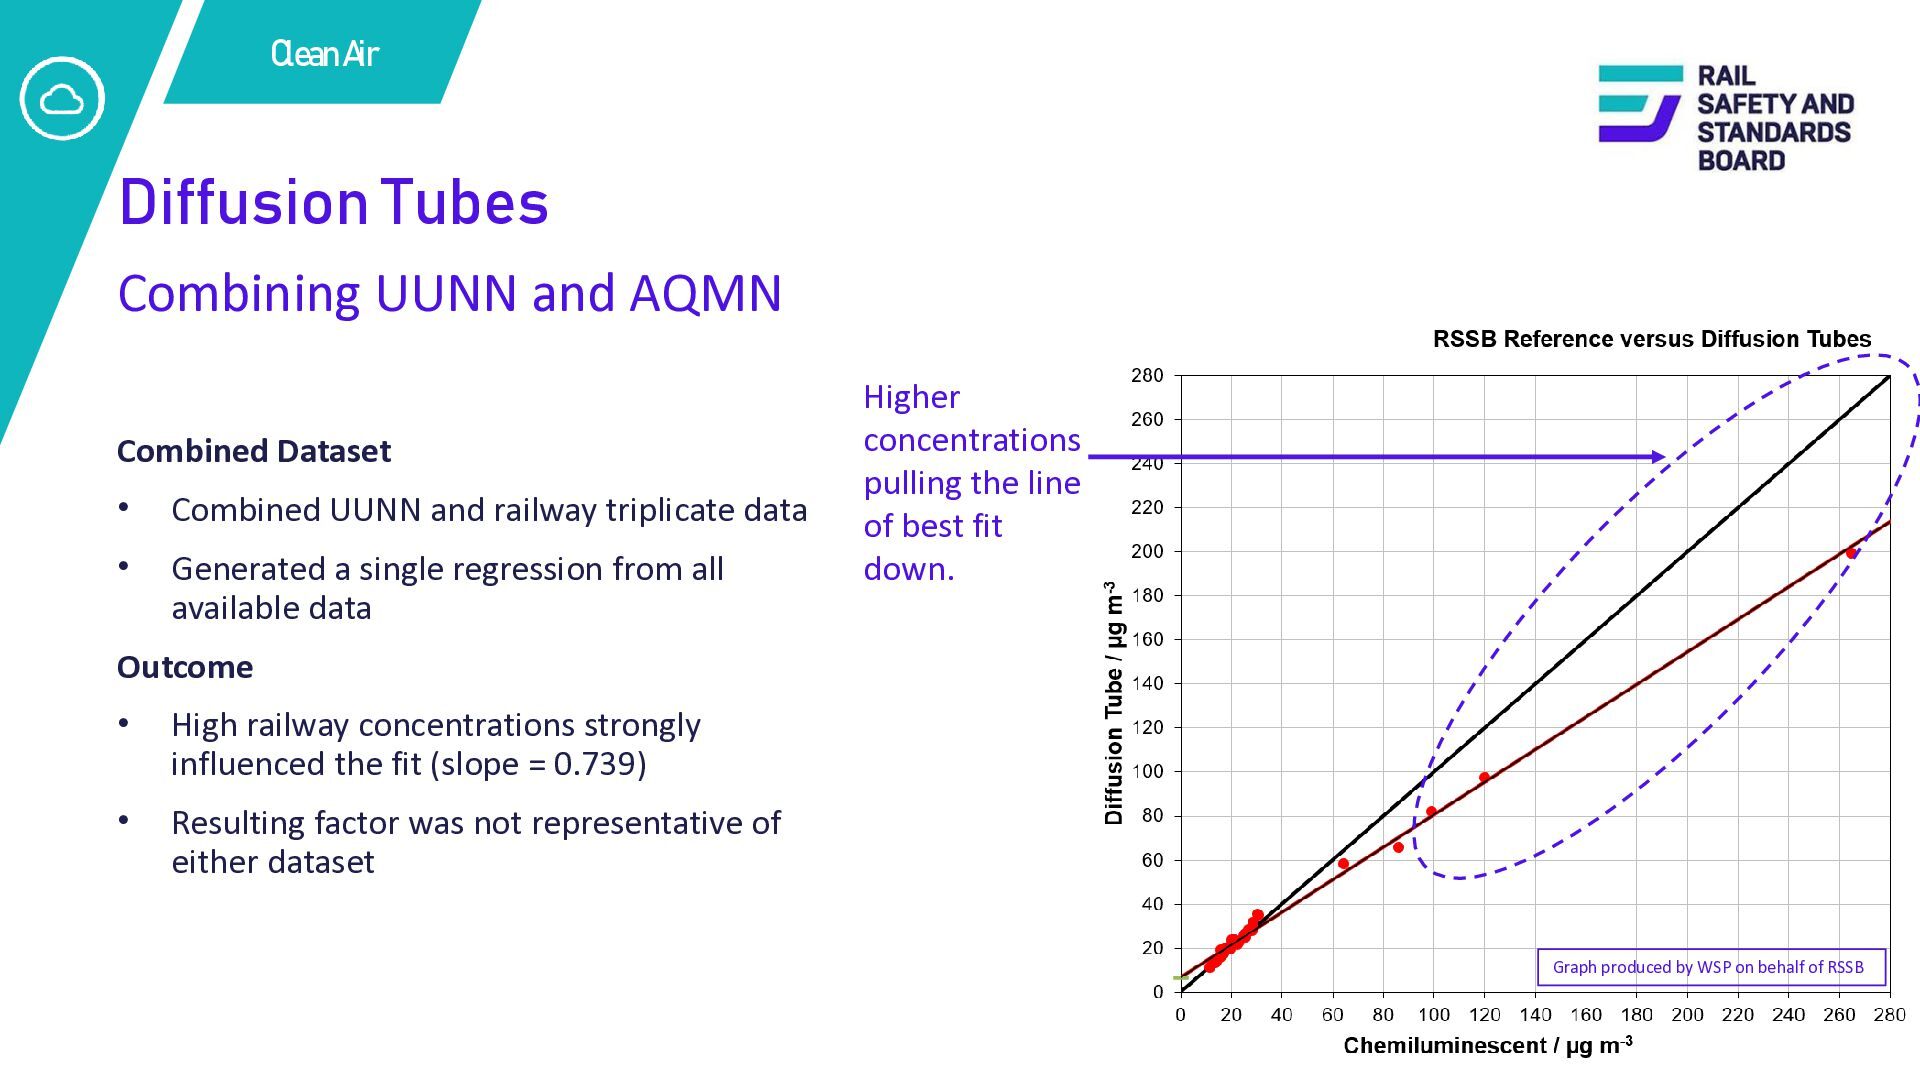
• Combined UUNN and railway triplicate data • Generated a single regression from all available data Higher concentrations pulling the line of best fit down. Outcome • High railway concentrations strongly influenced the fit (slope = 0.739) • Resulting factor was not representative of either dataset Graph produced by WSP on behalf of RSSB 16
reporting • Currently applying the established UUNN bias adjustment factor for reporting • Provides a consistent, nationally recognised basis for AQMN reporting and comparison • Avoids applying railway-specific adjustments that have not yet been validated across the full concentration range What factors contribute to diffusion tubes performing differently in railway environments? Do enclosed and open-air stations require different bias adjustment approaches? What further insights can be extracted from the AQMN diffusion tube and reference monitor dataset? 17
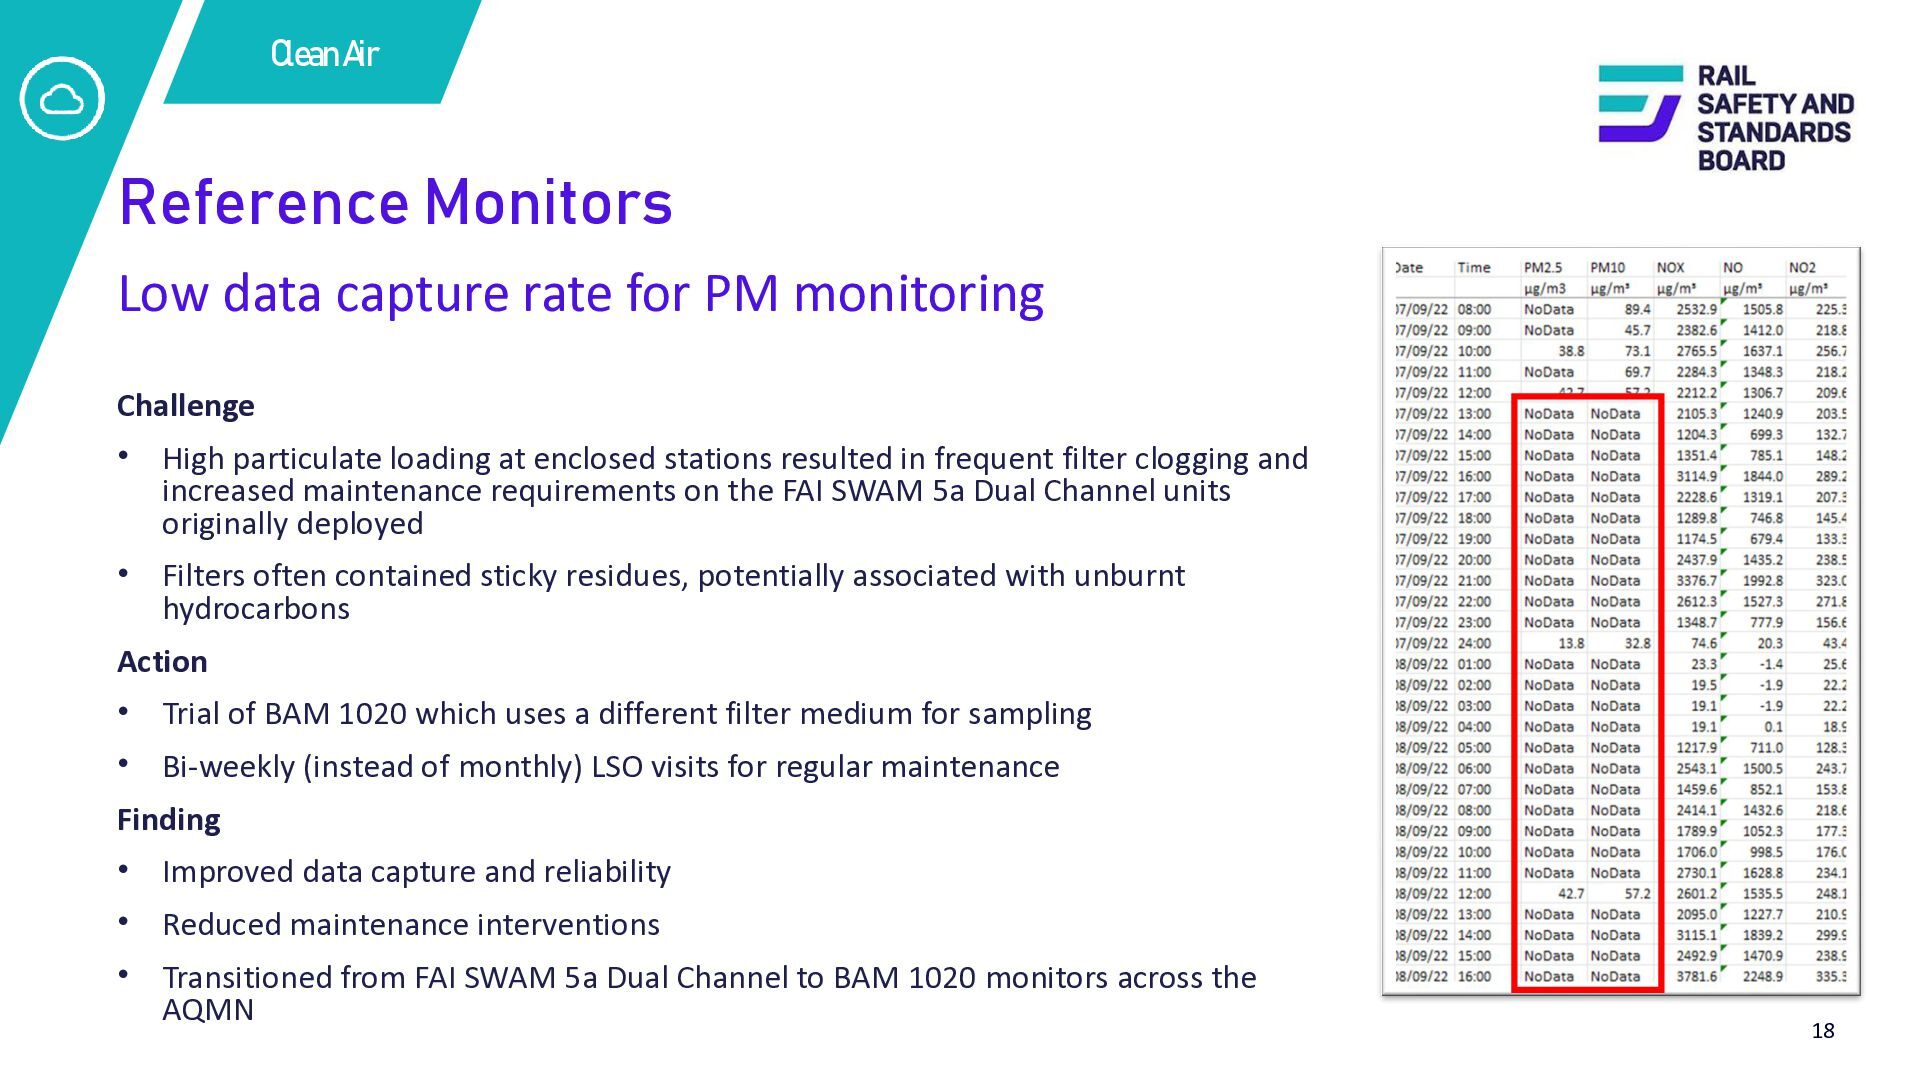
monitoring Challenge • High particulate loading at enclosed stations resulted in frequent filter clogging and increased maintenance requirements on the FAI SWAM 5a Dual Channel units originally deployed • Filters often contained sticky residues, potentially associated with unburnt hydrocarbons Action • Trial of BAM 1020 which uses a different filter medium for sampling • Bi-weekly (instead of monthly) LSO visits for regular maintenance Finding • Improved data capture and reliability • Reduced maintenance interventions • Transitioned from FAI SWAM 5a Dual Channel to BAM 1020 monitors across the AQMN 18
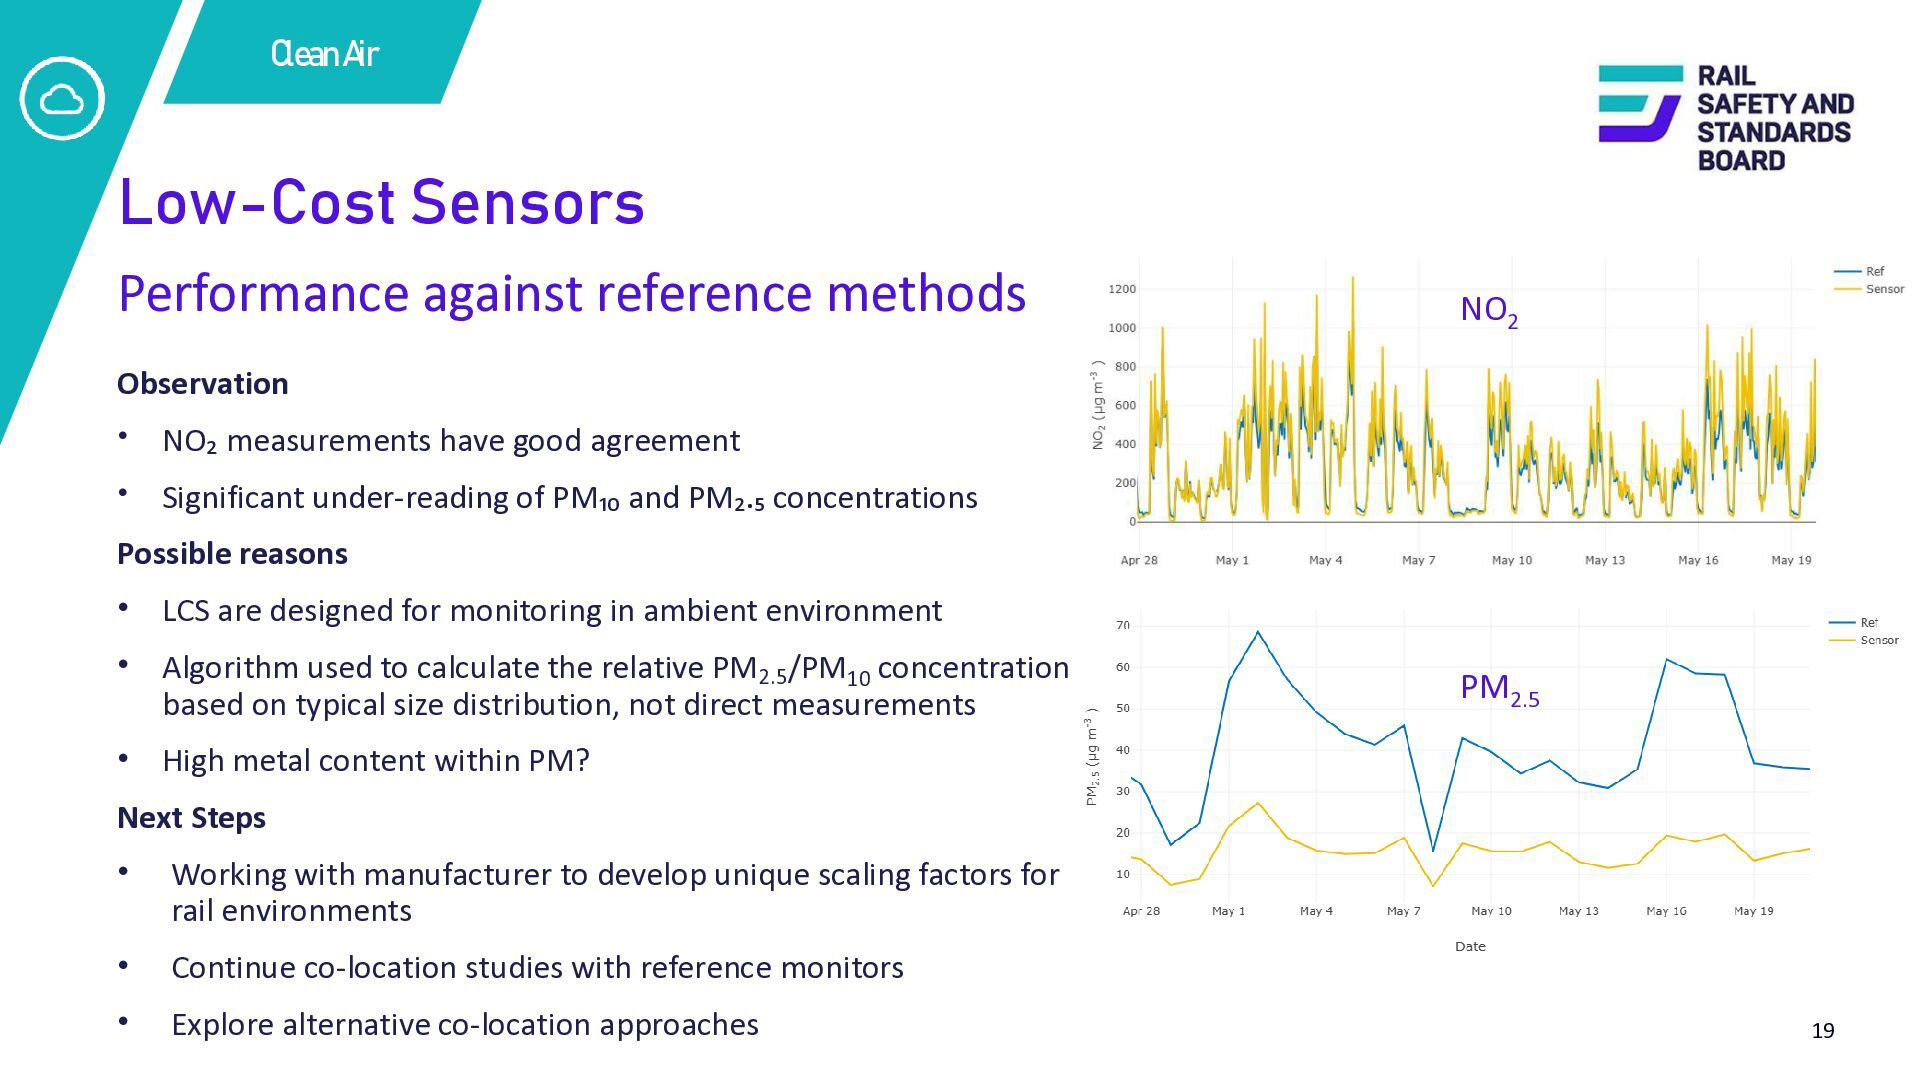
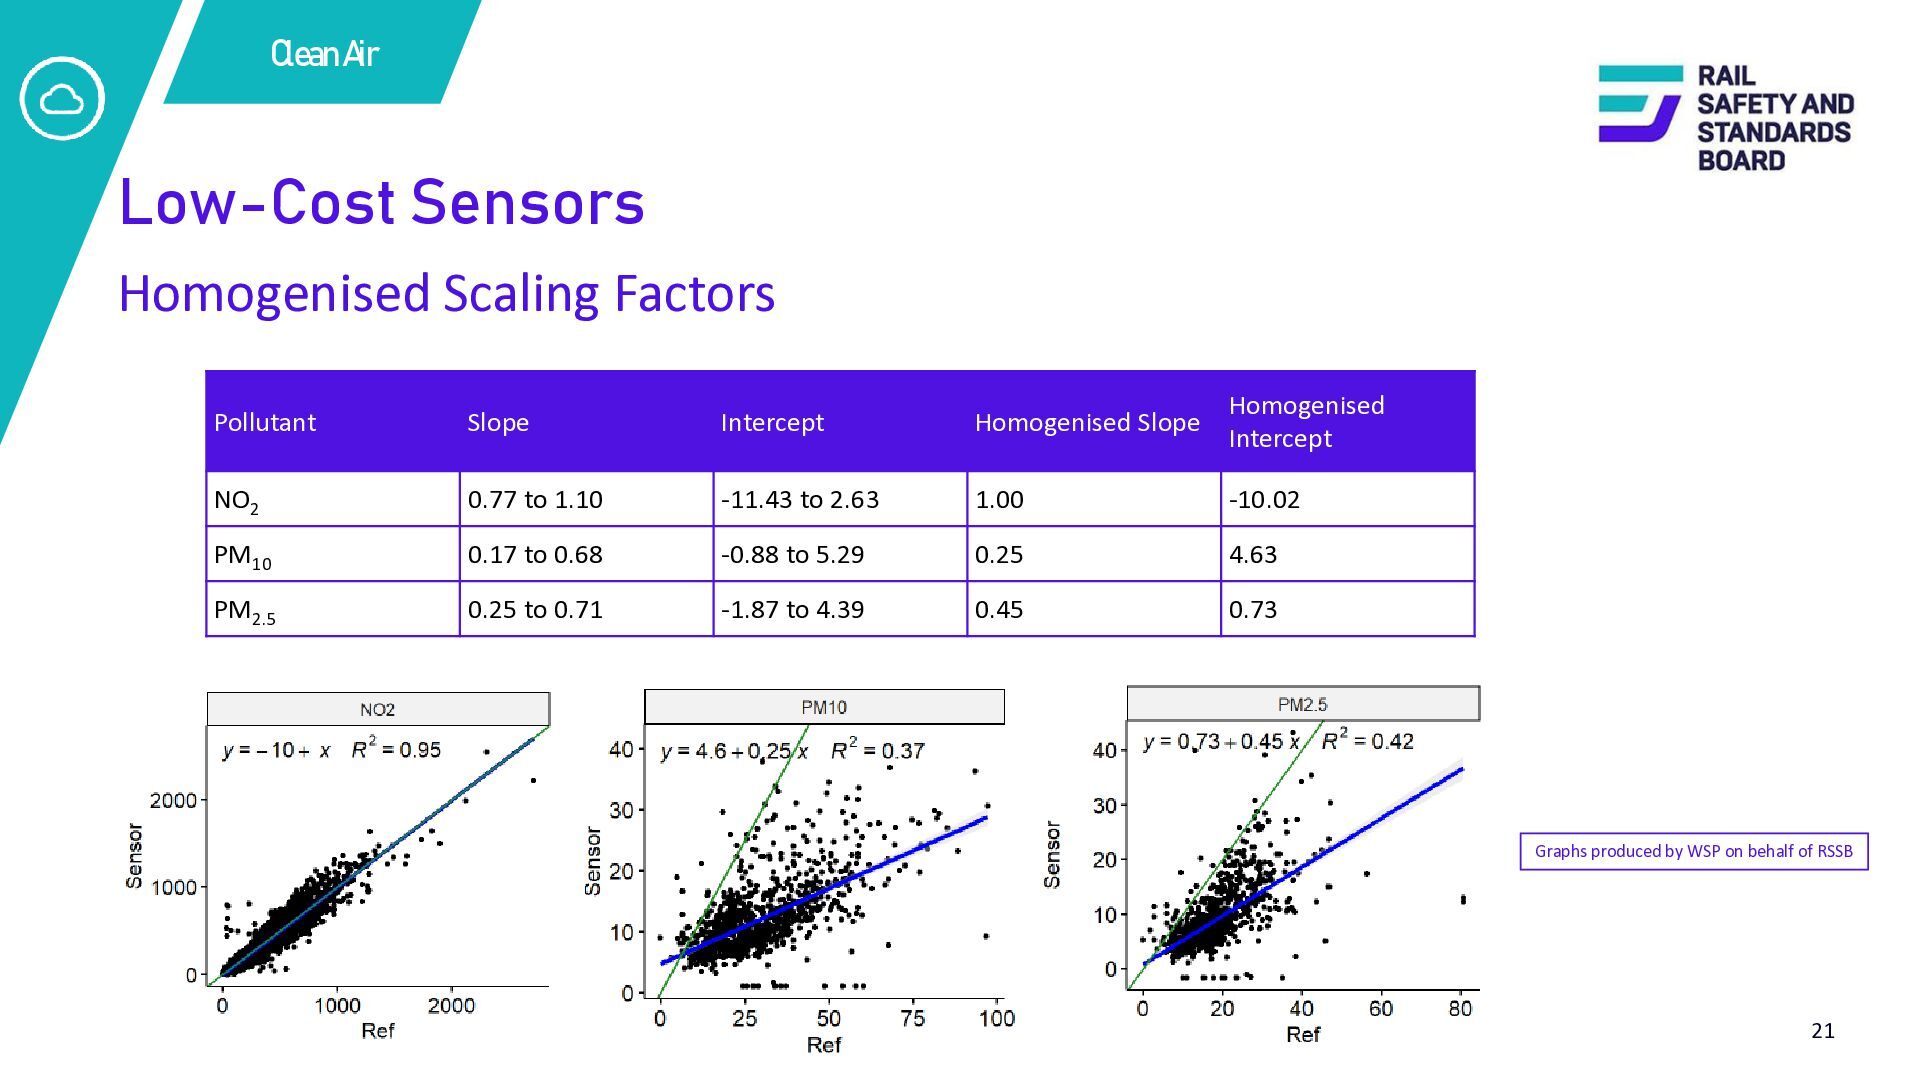
• NO₂ measurements have good agreement • Significant under-reading of PM₁₀ and PM₂.₅ concentrations Possible reasons • LCS are designed for monitoring in ambient environment • Algorithm used to calculate the relative PM2.5/PM10 concentration based on typical size distribution, not direct measurements PM2.5 • High metal content within PM? Next Steps • Working with manufacturer to develop unique scaling factors for rail environments • Continue co-location studies with reference monitors • Explore alternative co-location approaches 19
AQMN Investigation • Sensor performance varied significantly between sensors and pollutants • Assessed whether a common scaling factor could be applied across AQMN sites Learning • Factors that improved agreement at one location did not necessarily improve agreement elsewhere • Possible reasons: Different environment, range of pollutant concentration levels Outcome • A single network-wide scaling factor could not be justified from the available evidence • Concentrations are now reported as unscaled 20
Homogenised Slope Homogenised Intercept NO2 0.77 to 1.10 -11.43 to 2.63 1.00 -10.02 PM10 0.17 to 0.68 -0.88 to 5.29 0.25 4.63 PM2.5 0.25 to 0.71 -1.87 to 4.39 0.45 0.73 Graphs produced by WSP on behalf of RSSB 21
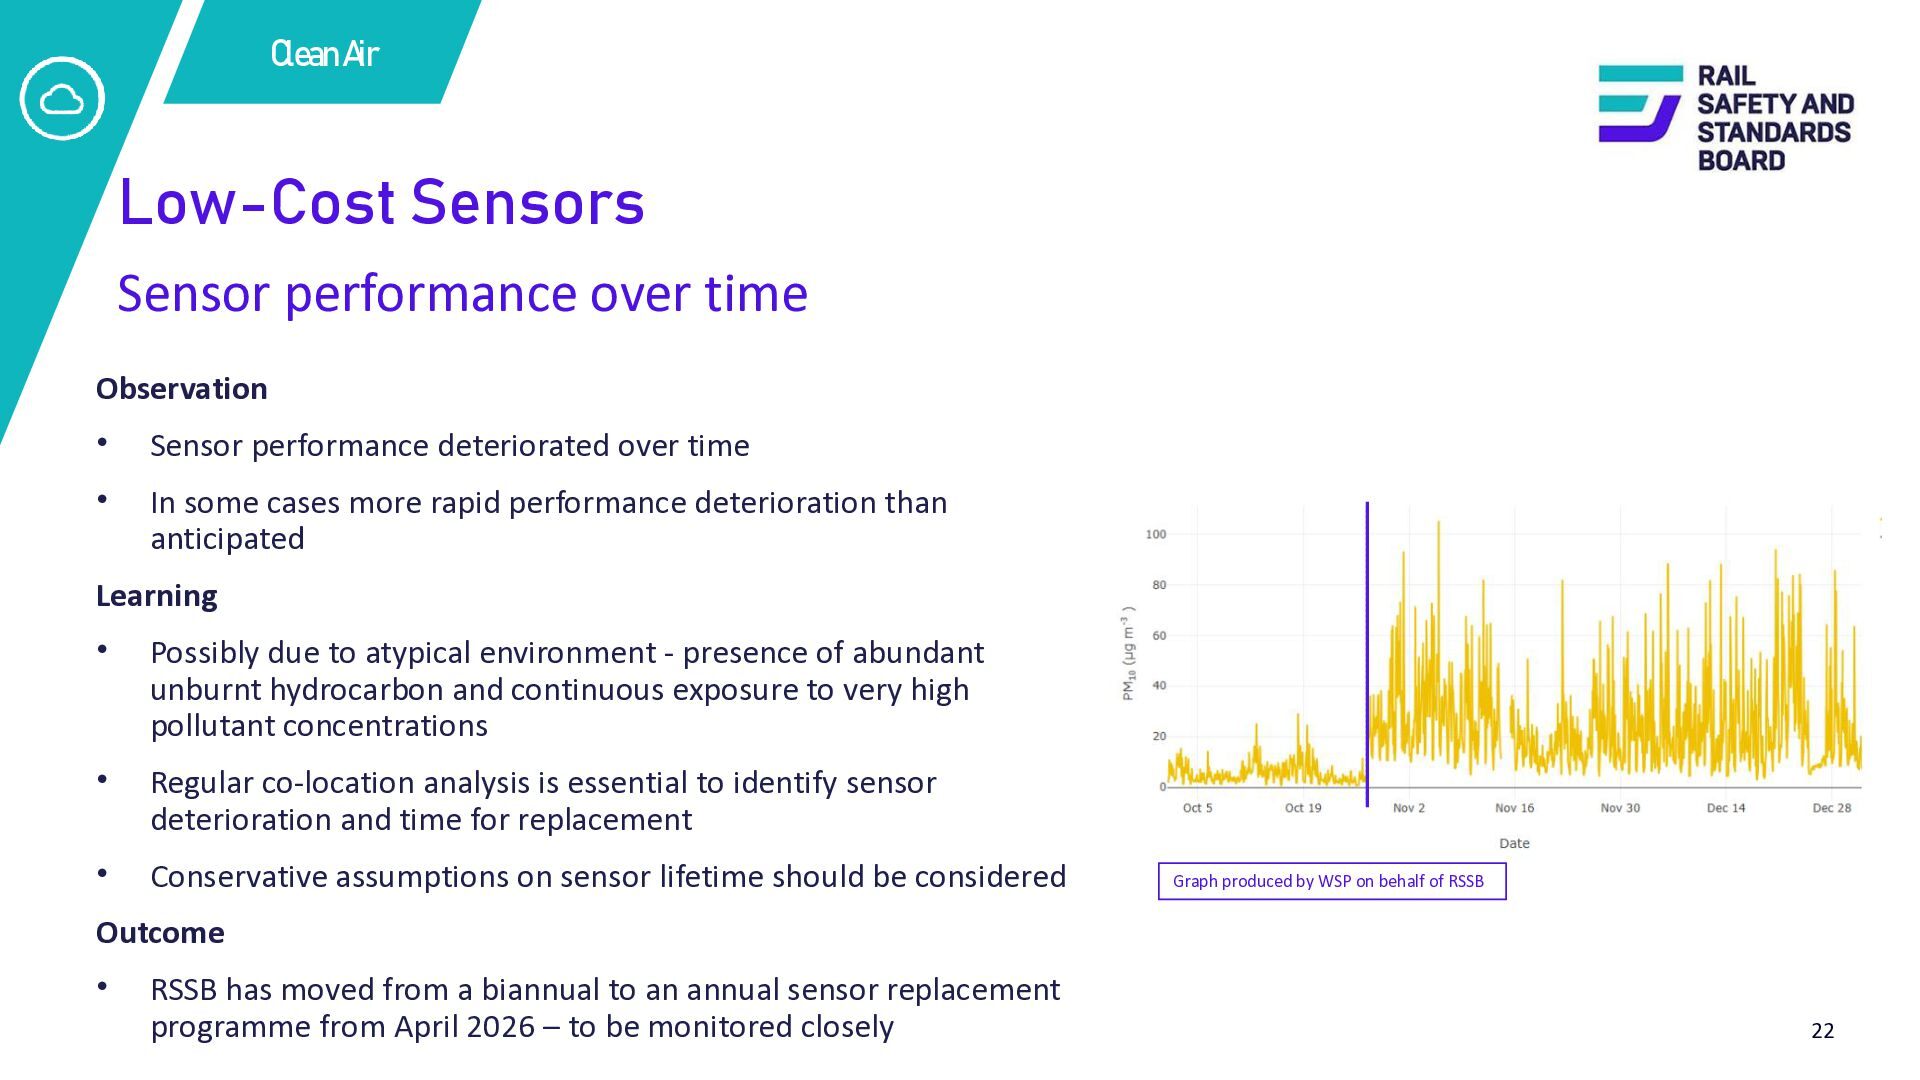
Sensor performance deteriorated over time • In some cases more rapid performance deterioration than anticipated Learning • Possibly due to atypical environment - presence of abundant unburnt hydrocarbon and continuous exposure to very high pollutant concentrations • Regular co-location analysis is essential to identify sensor deterioration and time for replacement • Conservative assumptions on sensor lifetime should be considered Graph produced by WSP on behalf of RSSB Outcome • RSSB has moved from a biannual to an annual sensor replacement programme from April 2026 – to be monitored closely 22
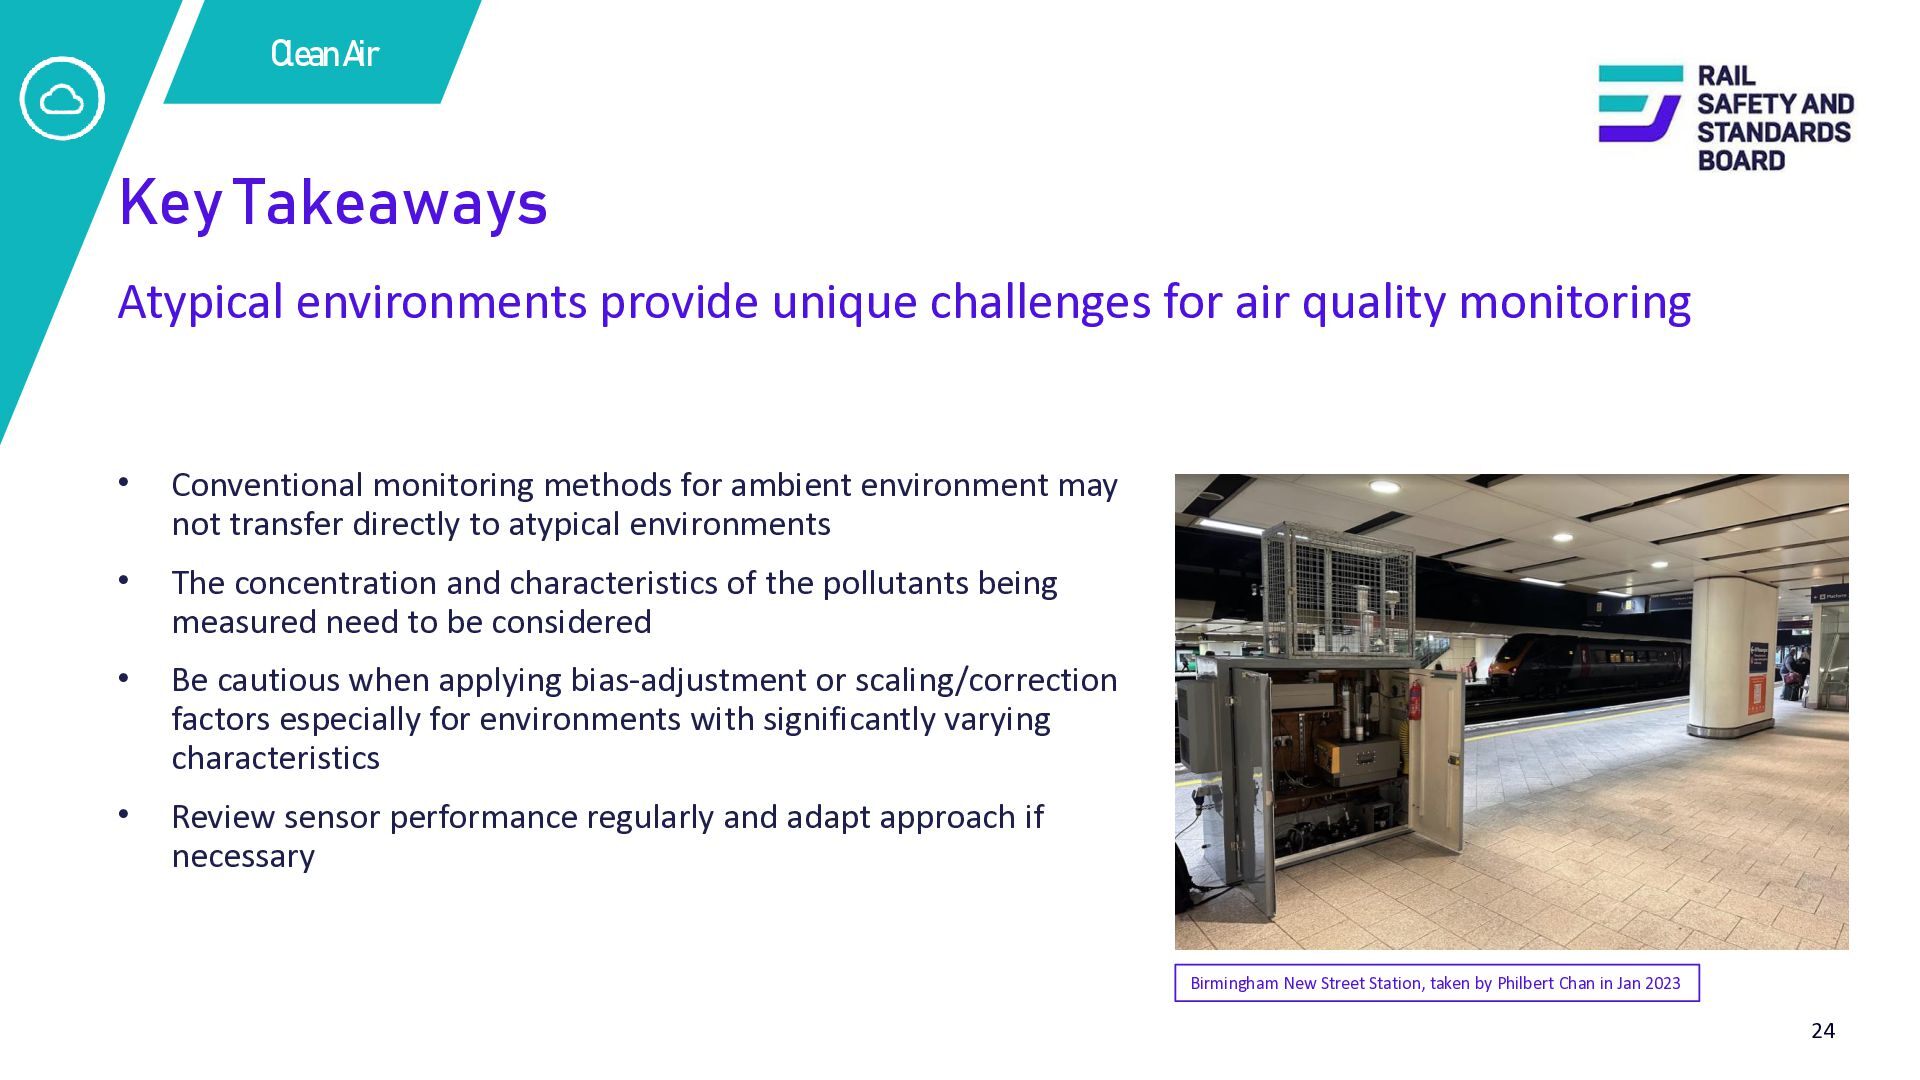
air quality monitoring • Conventional monitoring methods for ambient environment may not transfer directly to atypical environments • The concentration and characteristics of the pollutants being measured need to be considered • Be cautious when applying bias-adjustment or scaling/correction factors especially for environments with significantly varying characteristics • Review sensor performance regularly and adapt approach if necessary Birmingham New Street Station, taken by Philbert Chan in Jan 2023 24


 iesevents
 colly
 sstephenson
 garrettdimon
 tamaranovitovic
 iamctodd
 keithpitt
 tapps
 brad_frost
 takai
 baasie
 chriscoyier
 nikkihalliwell