Upgrade to Pro — share decks privately, control downloads, hide ads and more …

SQL Saturday 917 Vienna - Designing PowerBI and Tabular models for performance and scalability

Ivan Donev
January 24, 2020

SQL Saturday 917 Vienna - Designing PowerBI and Tabular models for performance and scalability

Set of suggestions and best practices for creating robust models, that can scale and perform both in the PowerBI and Analysis Services Tabular world

Ivan Donev

January 24, 2020
Tweet

More Decks by Ivan Donev

Other Decks in Technology

Transcript

  1. Tabular design for performance
    and scalability
    Ivan Donev
    Doing data in Microsoft’s realm for 13 years
    @ikdonev | https://www.linkedin.com/in/ivandonev/

    View Slide

  2. The order of importance (personal opinion)
    Optimization patterns
    with Aggregations
    Storage and formula
    optimization patterns
    Base layer design

    View Slide

  3. Tabular internals

    View Slide

  4. DAX Query Engine
    Formula engine
    Produce query plans
    Data request from SE
    Single threaded
    Storage engine:
    Returns data to FE
    Multi-threaded
    https://insightquest.files.wordpress.com/2016/11/dax-query-engine.png

    View Slide

  5. Storing and compressing data
    Data is encoded and stored compressed 
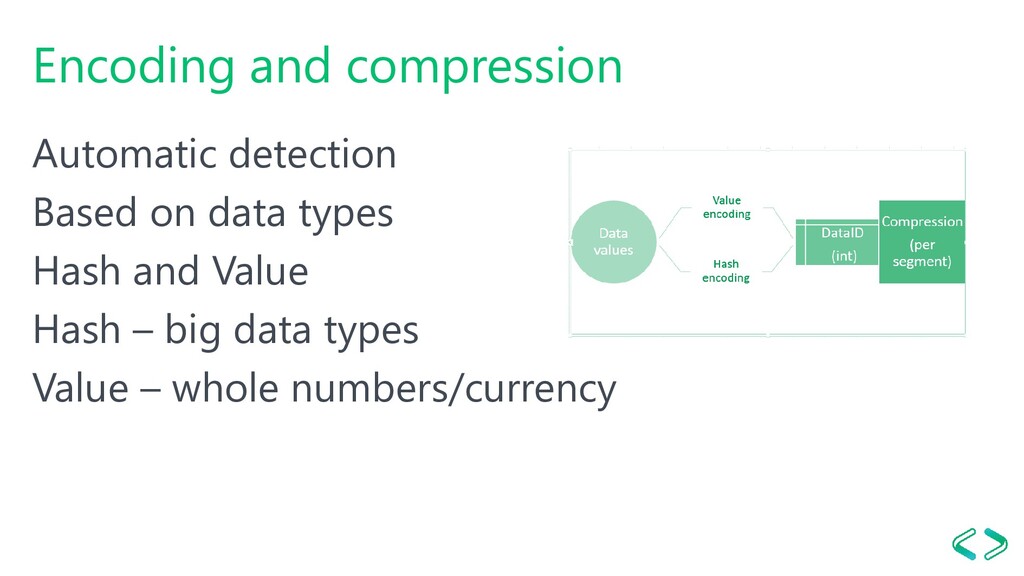
on disk
    Encoded and uncompressed in memory
    The process when importing data:
    1. Read the data and detect data types
    2. Encode
    3. Compress when saving on disk

    View Slide

  6. Encoding and compression
    Automatic detection
    Based on data types
    Hash and Value
    Hash – big data types
    Value – whole numbers/currency

    View Slide

  7. Understanding value encoding in Vertipaq
    Modify the range
    Takes 194 as base
    Stores the difference
    Bytes decreased
    Only on Integer values

    View Slide

  8. Understanding dictionary encoding
    8
    Column encoding
    Build a dictionary
    Replace values
    This stores strings as integers
    Strings, floating points, etc. are
    dictionary encoded
    Distinct values determine size of
    model

    View Slide

  9. Understanding Run Length Encoding (RLE)
    Additional compression
    technique
    Avoids repeating values
    Sorting is important

    View Slide

  10. Compression summary
    Order of importance
    Column cardinality
    Number of repetitions
    Number of rows
    Data type
    Re-encoding
    Non-integer
    Integer

    View Slide

  11. The overall process
    Data Values
    VALUE
    ENCODING
    HASH
    ENCODING
    Encoded
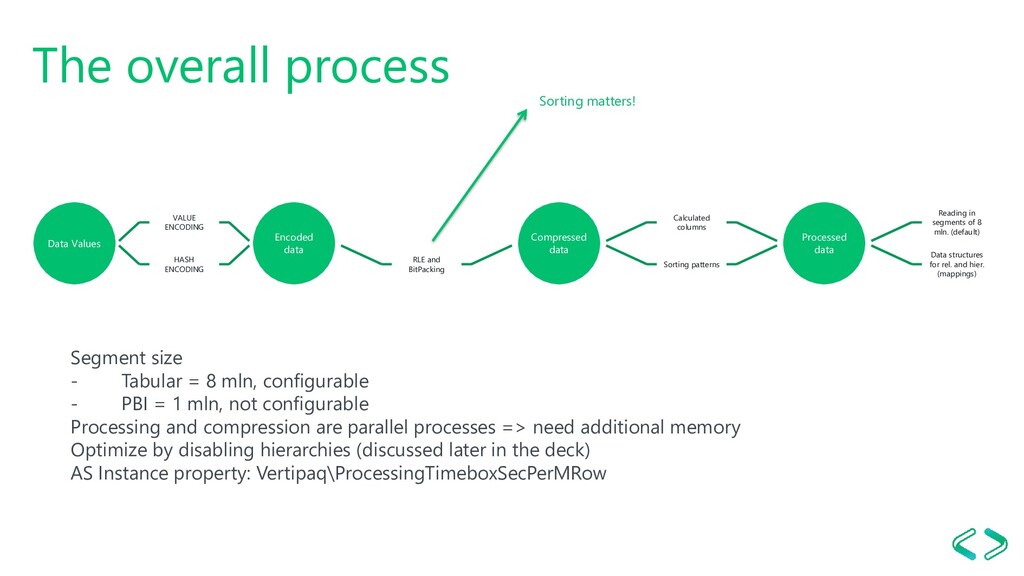
    data
    RLE and
    BitPacking
    Compressed
    data
    Calculated
    columns
    Sorting patterns
    Processed
    data
    Reading in
    segments of 8
    mln. (default)
    Data structures
    for rel. and hier.
    (mappings)
    Segment size
    - Tabular = 8 mln, configurable
    - PBI = 1 mln, not configurable
    Processing and compression are parallel processes => need additional memory
    Optimize by disabling hierarchies (discussed later in the deck)
    AS Instance property: Vertipaq\ProcessingTimeboxSecPerMRow
    Sorting matters!

    View Slide

  12. Storage
    optimization
    patterns

    View Slide

  13. Pattern #1 – Excessive columns
    Not all columns are needed from the source
    Text and big numbers are with high priority
    If you need analysis – try to push it to the DB engine
    (if possible)
    Filter, filter, filter!!!

    View Slide

  14. Pattern #2 – Date/time table
    Date table
    - Created automatically 
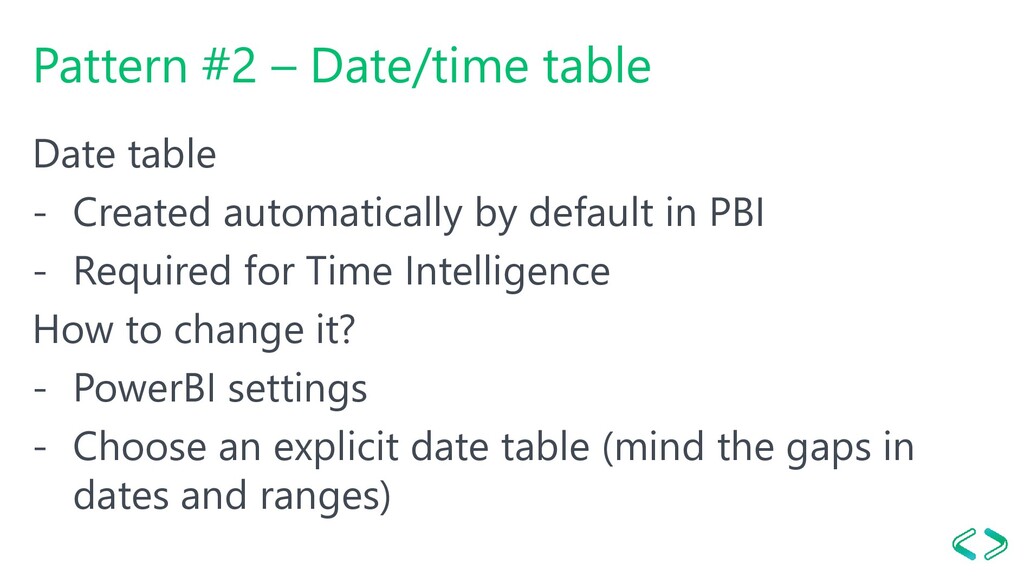
by default in PBI
    - Required for Time Intelligence
    How to change it?
    - PowerBI settings
    - Choose an explicit date table (mind the gaps in
    dates and ranges)

    View Slide

  15. Pattern #3 – Data types
    Data types
    - Define encoding
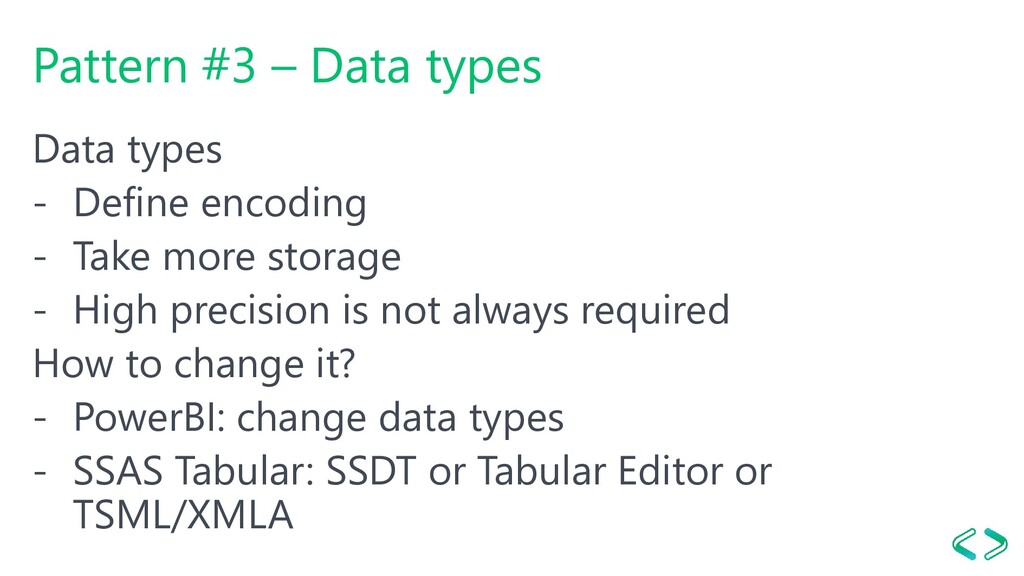
    - Take more storage
    - High precision is not always required
    How to change it?
    - PowerBI: change data types
    - SSAS Tabular: SSDT or Tabular Editor or
    TSML/XMLA

    View Slide

  16. Pattern #4 – Long values
    Big numbers
    - Imagine a 
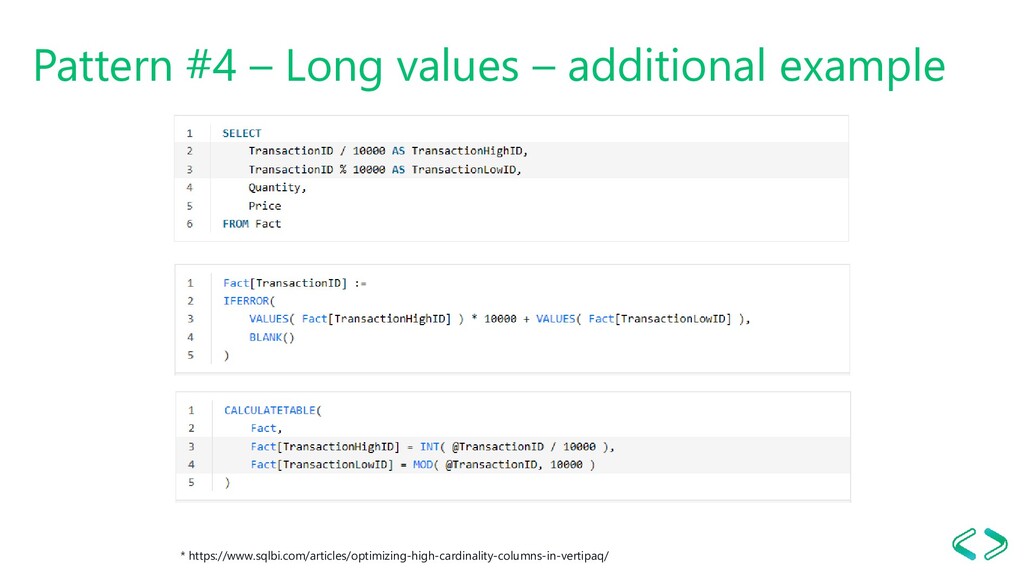
20-digit value
    - Can use DECIMAL
    - Not much of an effect
    How to fix it?
    - Split the column to parts
    100200300 = 100*1000000 + 200*100000 + 300
    - Numbers: use modulo and division
    - Text: use Left/Substring/Right

    View Slide

  17. Pattern #4 – Long values – additional example
    * https://www.sqlbi.com/articles/optimizing-high-cardinality-columns-in-vertipaq/

    View Slide

  18. A not so scientific experiment

    View Slide

  19. Pattern #5 – Precision
    Precision
    - Affects encoding and compression
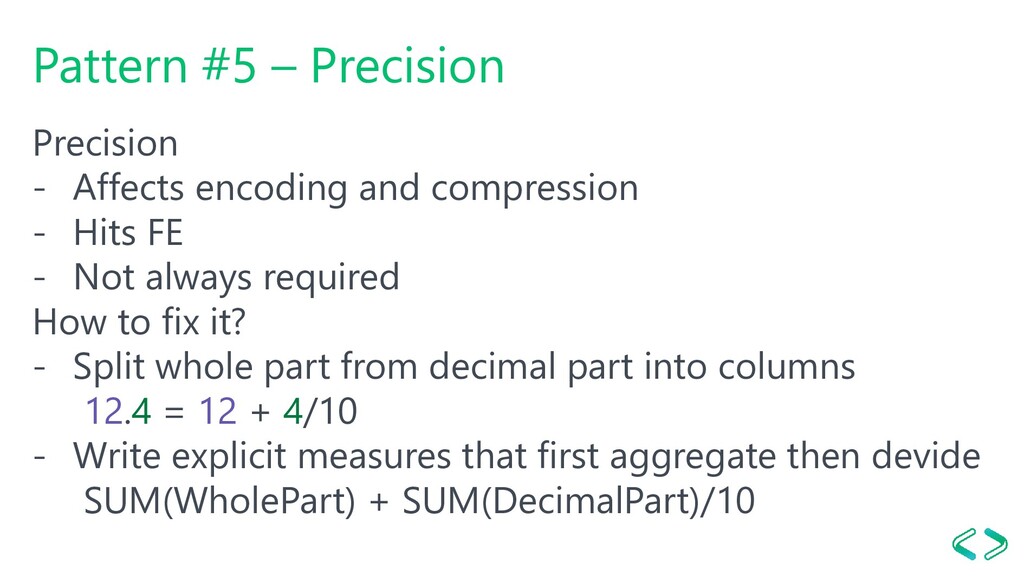
    - Hits FE
    - Not always required
    How to fix it?
    - Split whole part from decimal part into columns
    12.4 = 12 + 4/10
    - Write explicit measures that first aggregate then devide
    SUM(WholePart) + SUM(DecimalPart)/10

    View Slide

  20. Pattern #6 – Date, time
    Date and time
    - Usually 
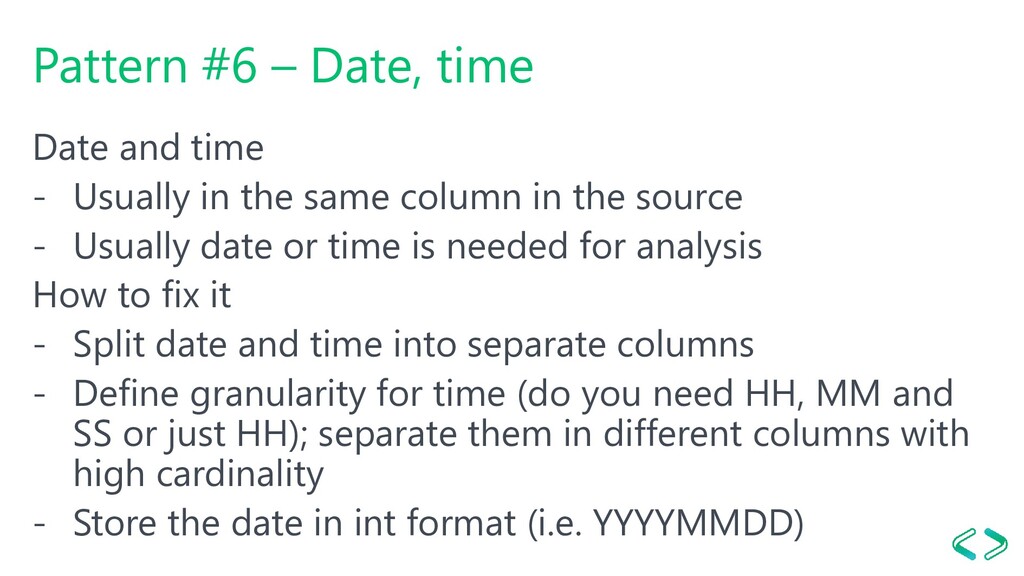
in the same column in the source
    - Usually date or time is needed for analysis
    How to fix it
    - Split date and time into separate columns
    - Define granularity for time (do you need HH, MM and
    SS or just HH); separate them in different columns with
    high cardinality
    - Store the date in int format (i.e. YYYYMMDD)

    View Slide

  21. Pattern #7 – Source Key columns or IDs
    Keys and IDs
    - High cardinality
    - Are they really needed
    How to fix it?
    - Denormalize
    - Remove them if not needed
    - Split them (if feasible)

    View Slide

  22. DEMO – Auto date/time and AS
    hints

    View Slide

  23. Big model
    aggregation patterns
    by Phil Seamark (@PhilSeamark)

    View Slide

  24. Aggregation awareness in PowerBI
    Detailed rows
    Report Visual
    Option 1: Import, useful for small to med size tables
    Detailed rows
    Report Visual
    Option 2: DQ/Dual for med-large size tables
    Detailed rows
    Report Visual
    Option 3: Usage of aggregated tables
    Aggregated tables

    View Slide

  25. A sample model from Reza Rad

    View Slide

  26. Agg pattern # 1 - Horizontal aggs

    View Slide

  27. Horizontal aggs (2)

    View Slide

  28. Horizontal aggs (3)

    View Slide

  29. Horizontal Aggs
    Applicable in:
    - SSAS and PowerBI (no agg 
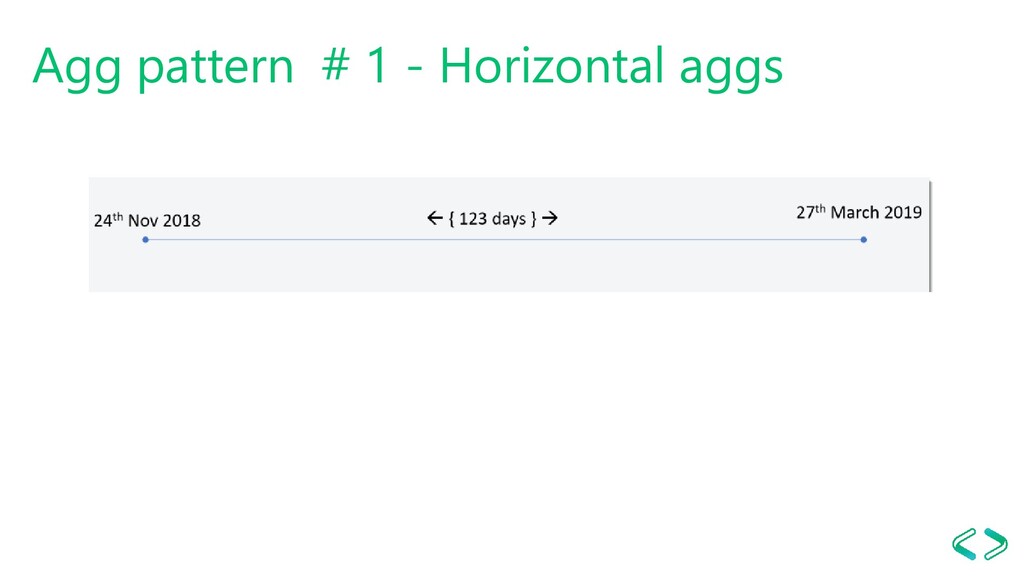
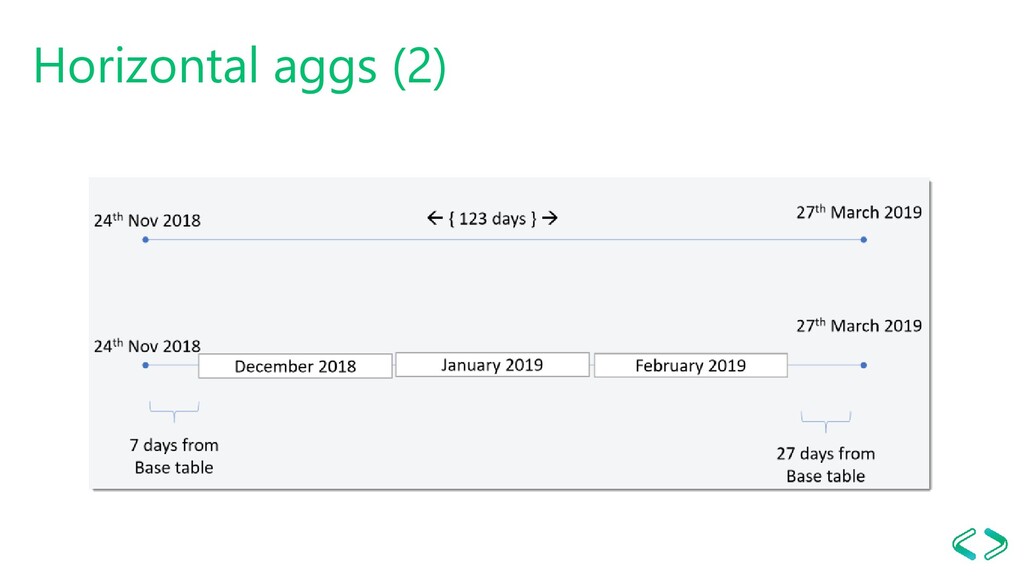
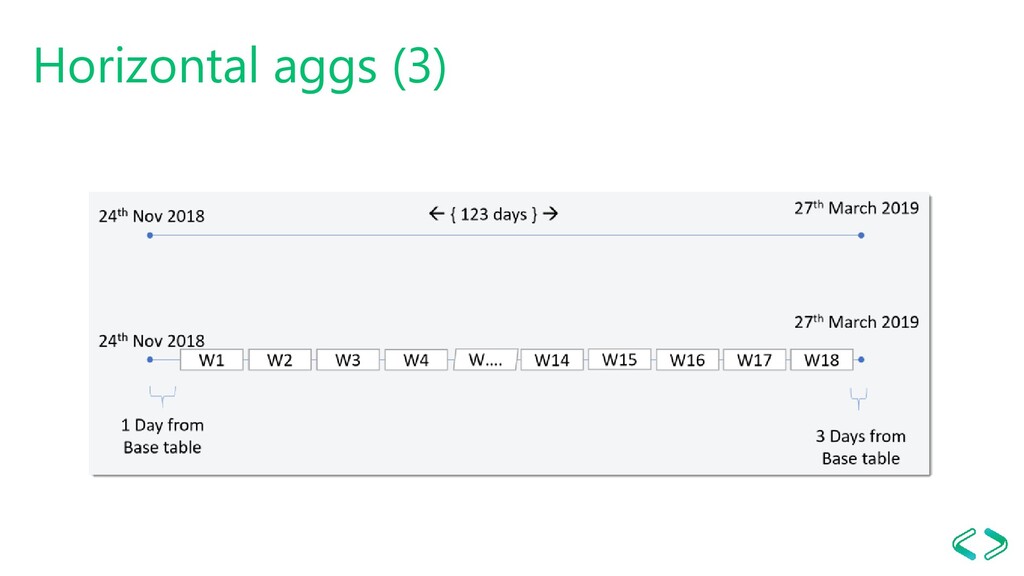
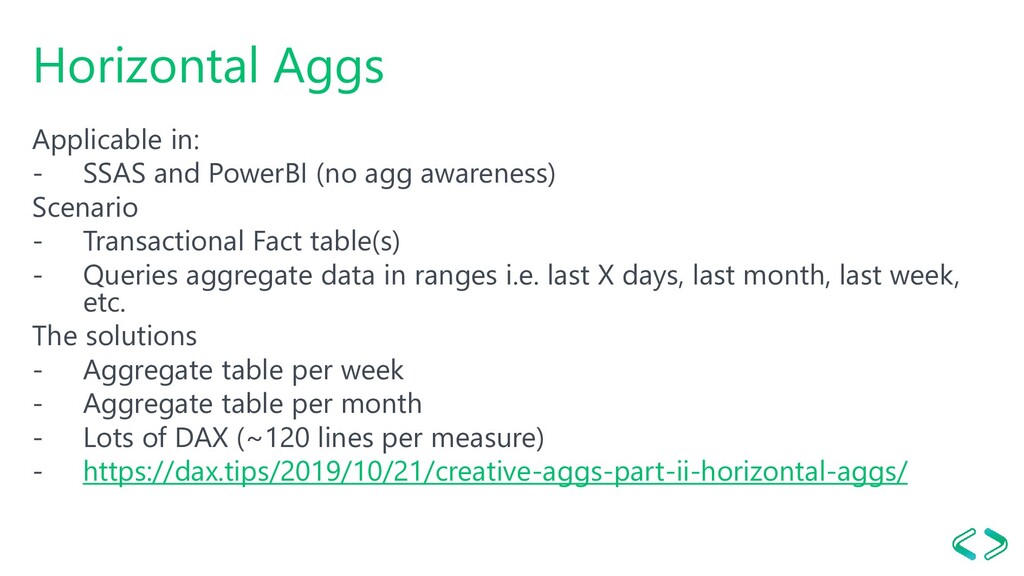
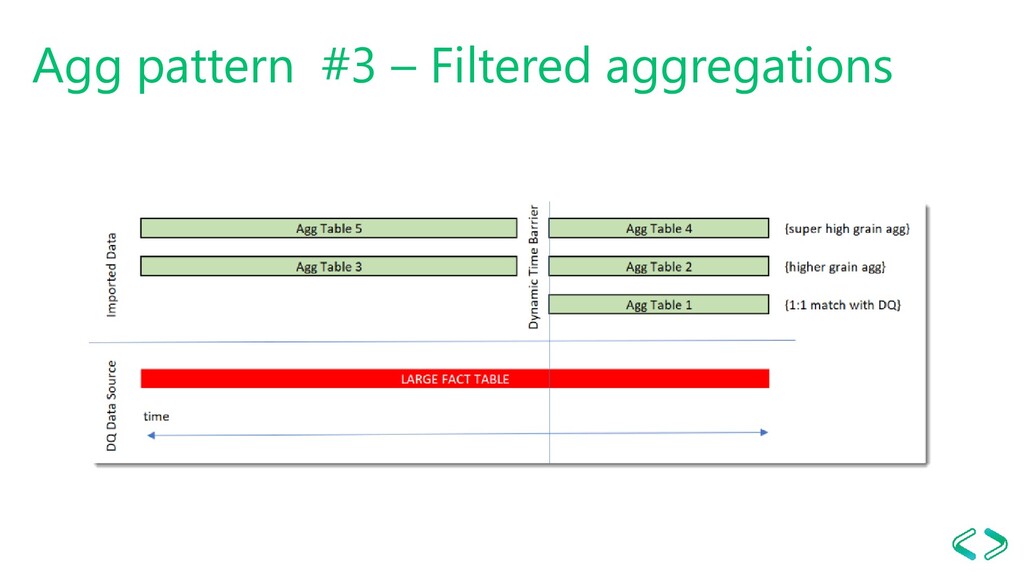
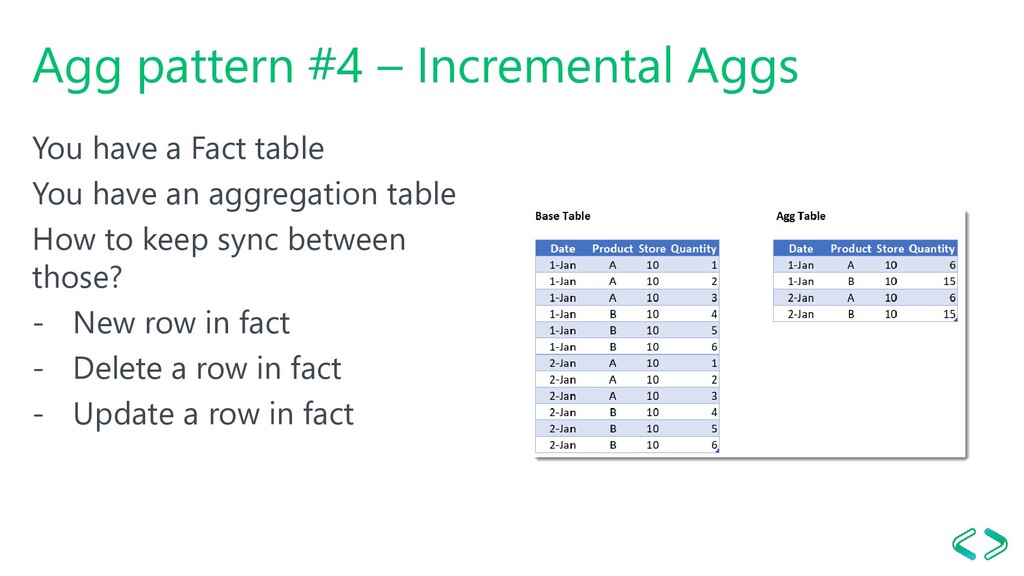
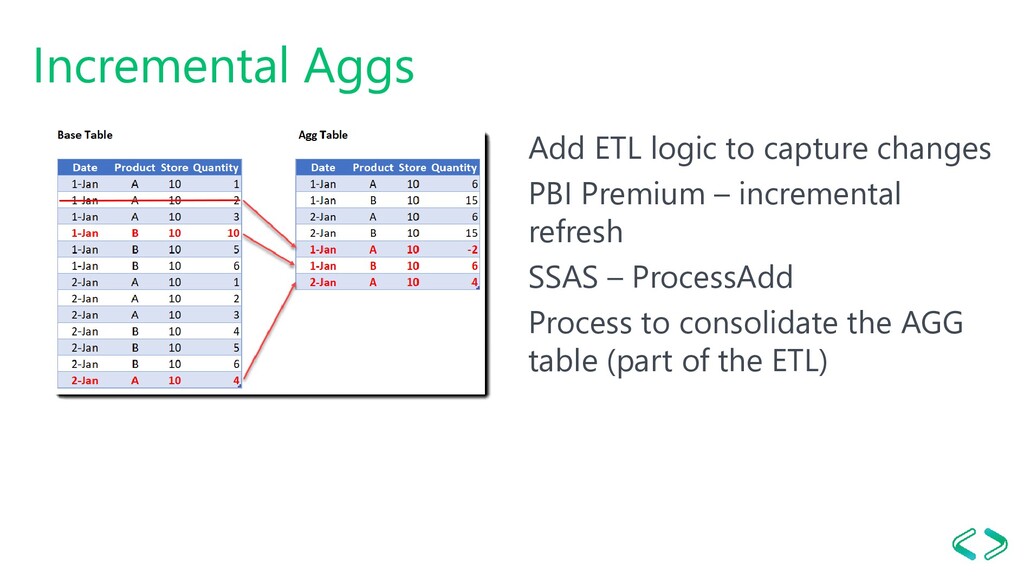
awareness)
    Scenario
    - Transactional Fact table(s)
    - Queries aggregate data in ranges i.e. last X days, last month, last week,
    etc.
    The solutions
    - Aggregate table per week
    - Aggregate table per month
    - Lots of DAX (~120 lines per measure)
    - https://dax.tips/2019/10/21/creative-aggs-part-ii-horizontal-aggs/

    View Slide

  30. DEMO – Row-based TI

    View Slide

  31. Row-based Time Intelligence
    Applicable
    - PowerBI and SSAS
    Scenario
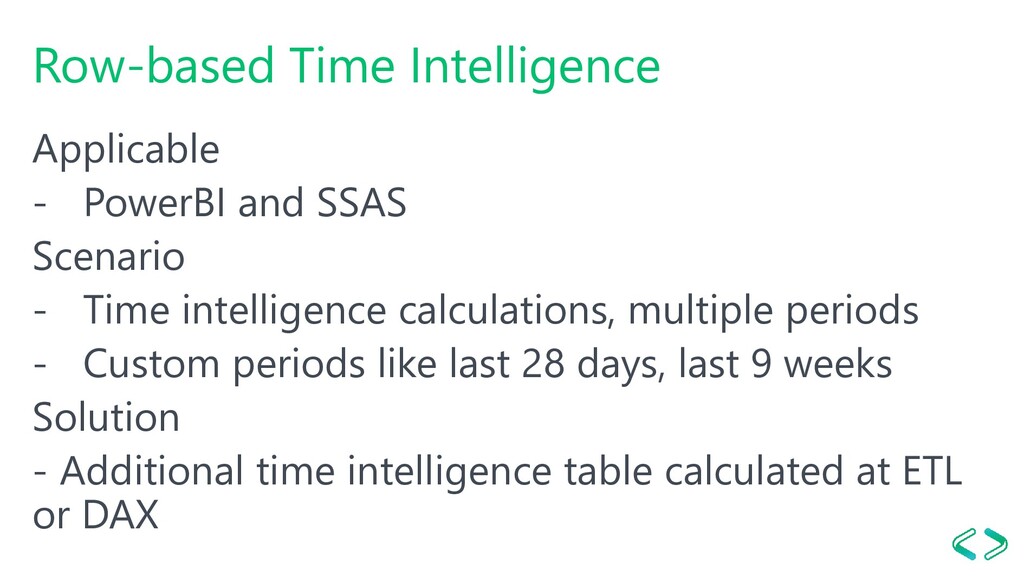
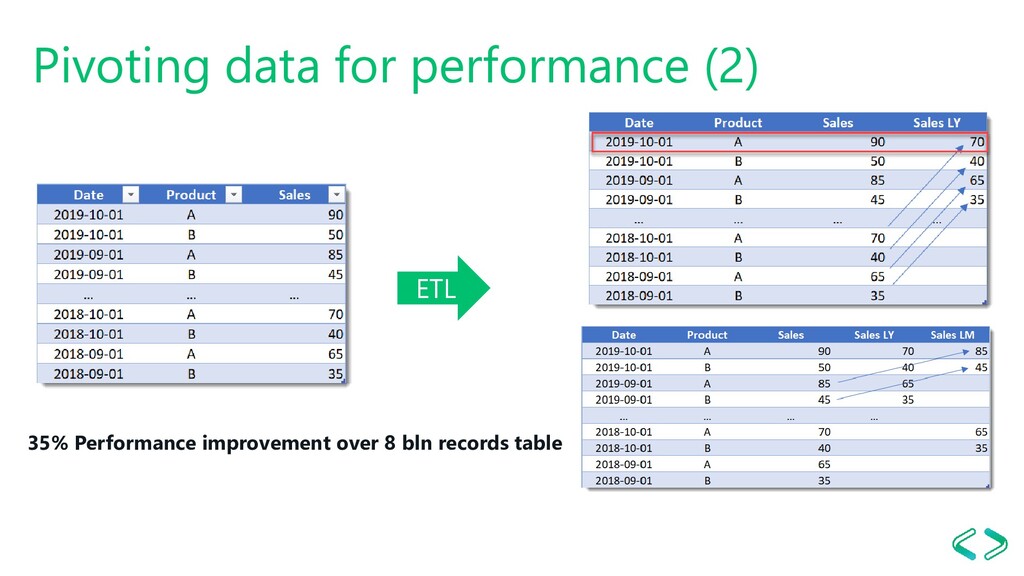
    - Time intelligence calculations, multiple periods
    - Custom periods like last 28 days, last 9 weeks
    Solution
    - Additional time intelligence table calculated at ETL
    or DAX

    View Slide

  32. Agg pattern #2 - Accordion aggregations
    Use TSQL to load the Agg table
    in PowerBI
    Table Rows
    Base Table 8,231,630,715
    Pure Week Agg 2,206,251
    Pure Month Agg 628,175
    Accordion Agg 2,558,871

    View Slide

  33. Accordion aggregations (2)
    1. Create a temp boundary table
    and join it with the fact
    during import (ETL)

    View Slide

  34. Accordion aggregates (3)
    Applicable
    - Best in PowerBI due to 
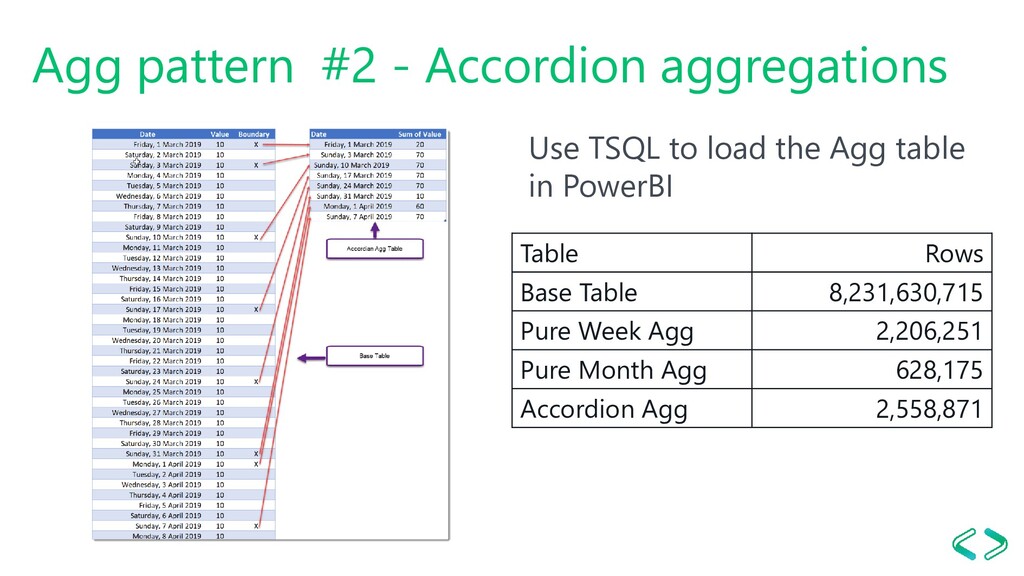
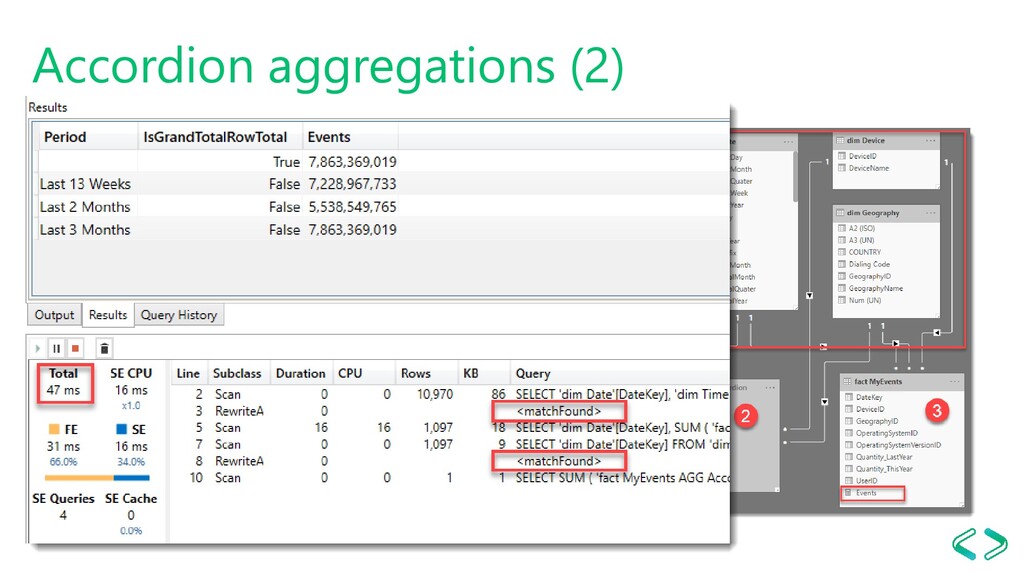
Aggregation Awareness
    Scenario
    - Transactional fact table
    - Monthly, weekly or mixed reporting
    The solution
    - Accordion agg table
    - Can be combined with Row-Based TI

    View Slide

  35. Pivoting data for performance
    ?

    View Slide

  36. Pivoting data for performance (2)
    ETL
    35% Performance improvement over 8 bln records table

    View Slide

  37. Pivoting data for performance (3)
    Applicable
    - PowerBI and SSAS
    Scenario
    - Push TI calculations to ETL
    Solution
    - Pivoting TI data at import time (LY, LM,etc.)

    View Slide

  38. Agg pattern #3 – Filtered aggregations

    View Slide

  39. DEMO – Filtered aggregations

    View Slide

  40. Agg pattern #4 – Incremental Aggs
    You have a Fact table
    You have an aggregation table
    How to keep sync between
    those?
    - New row in fact
    - Delete a row in fact
    - Update a row in fact

    View Slide

  41. Incremental Aggs
    Add ETL logic to capture changes
    PBI Premium – incremental
    refresh
    SSAS – ProcessAdd
    Process to consolidate the AGG
    table (part of the ETL)

    View Slide

  42. Star schema specifics

    View Slide

  43. Sample schema

    View Slide

  44. Optimizing dimensions
    Minimize the number of columns.
    Reduce cardinality (data 
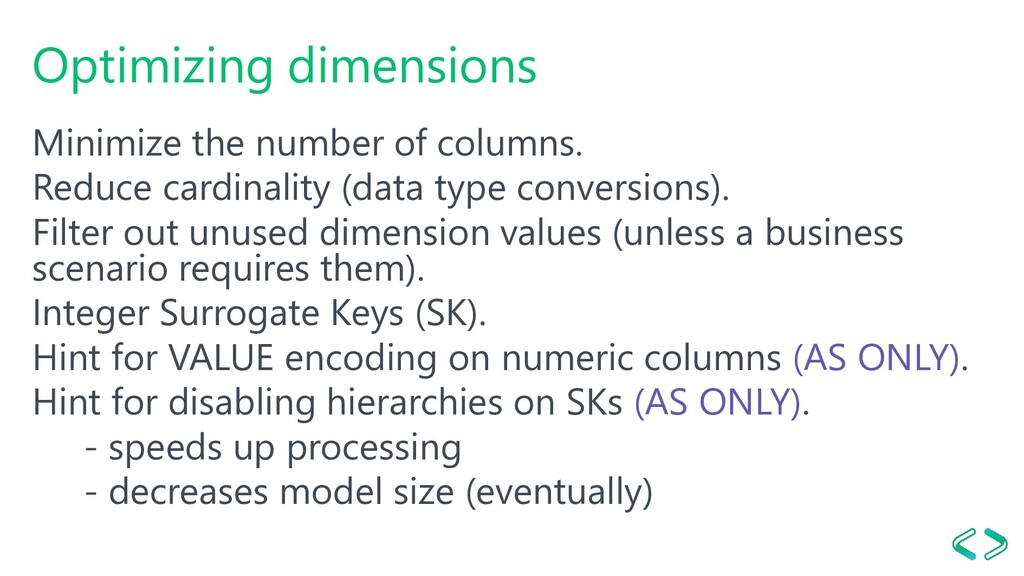
type conversions).
    Filter out unused dimension values (unless a business
    scenario requires them).
    Integer Surrogate Keys (SK).
    Hint for VALUE encoding on numeric columns (AS ONLY).
    Hint for disabling hierarchies on SKs (AS ONLY).
    - speeds up processing
    - decreases model size (eventually)

    View Slide

  45. Optimizing facts
    Replace dimension IDs with their surrogate keys.
    Reduce cardinality (data type conversions).
    Consider moving calculations to the source (to use in
    compression evaluations).
    Ordered by less diverse SKs first (to maximize compression).
    Increased Tabular sample size for deciding Encoding, by
    considering segments and partitions(AS ONLY).
    Hint for VALUE encoding on numeric columns (AS ONLY).
    Hint for disabling hierarchies (AAS and AS2017 CU7 ONLY).

    View Slide

  46. Conclusion
    Use only the data you need
    Star-schema is your 
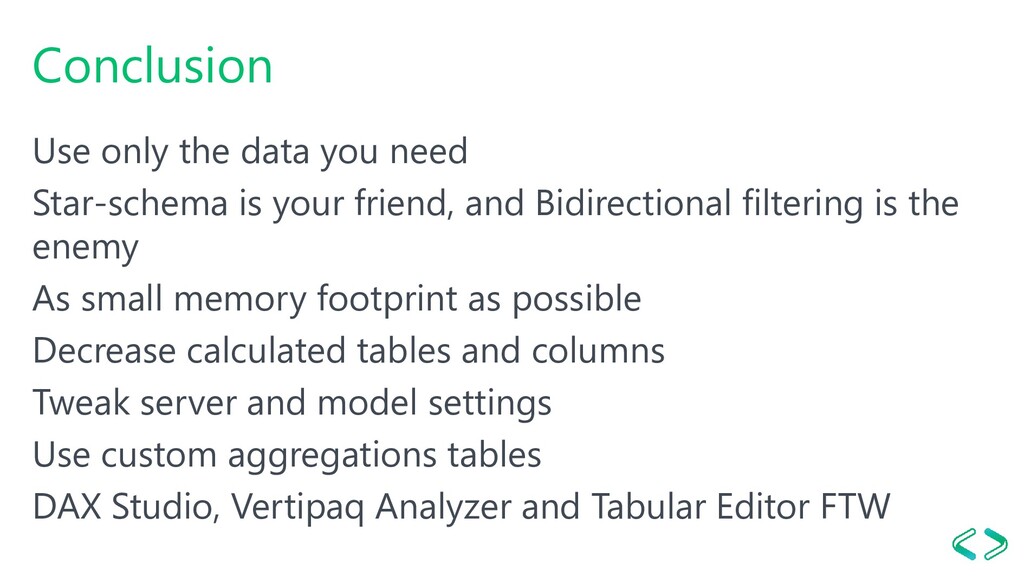
friend, and Bidirectional filtering is the
    enemy
    As small memory footprint as possible
    Decrease calculated tables and columns
    Tweak server and model settings
    Use custom aggregations tables
    DAX Studio, Vertipaq Analyzer and Tabular Editor FTW

    View Slide

  47. Whitepapers and articles
    Performance tuning of tabular models in SQL 
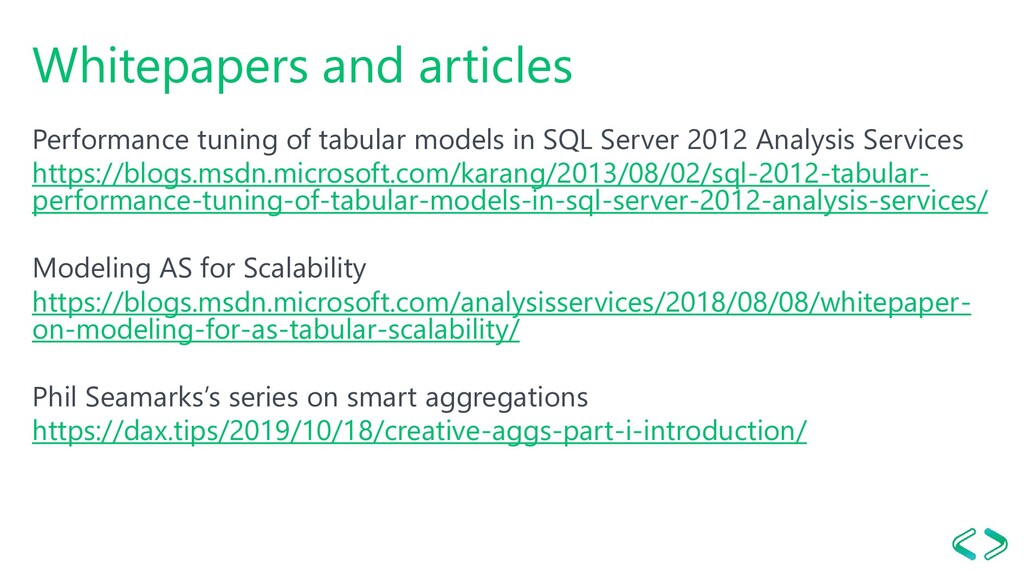
Server 2012 Analysis Services
    https://blogs.msdn.microsoft.com/karang/2013/08/02/sql-2012-tabular-
    performance-tuning-of-tabular-models-in-sql-server-2012-analysis-services/
    Modeling AS for Scalability
    https://blogs.msdn.microsoft.com/analysisservices/2018/08/08/whitepaper-
    on-modeling-for-as-tabular-scalability/
    Phil Seamarks’s series on smart aggregations
    https://dax.tips/2019/10/18/creative-aggs-part-i-introduction/

    View Slide

  48. Used tools
    SQL Server Management Studio
    - DMVs
    SQL Server 
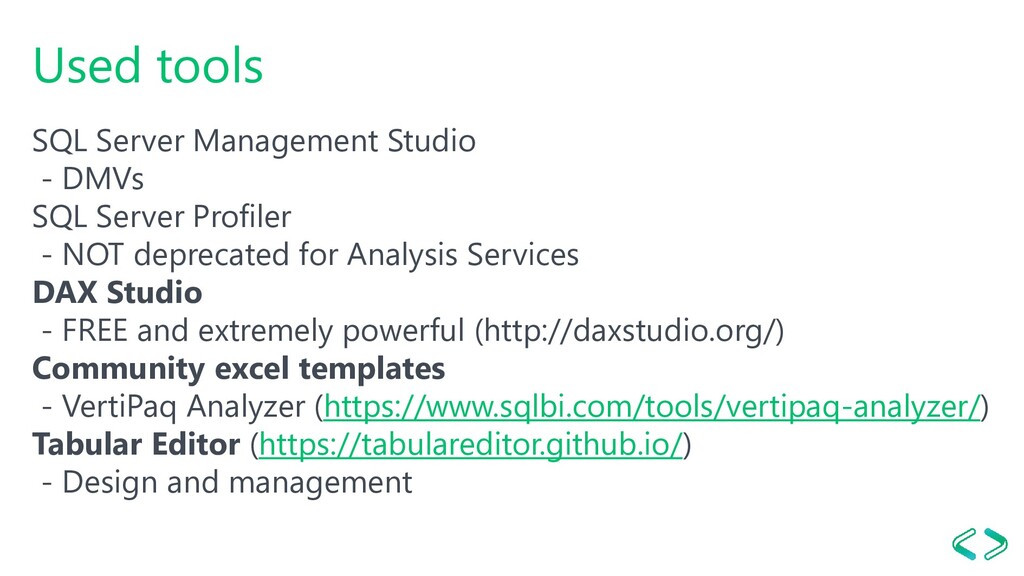
Profiler
    - NOT deprecated for Analysis Services
    DAX Studio
    - FREE and extremely powerful (http://daxstudio.org/)
    Community excel templates
    - VertiPaq Analyzer (https://www.sqlbi.com/tools/vertipaq-analyzer/)
    Tabular Editor (https://tabulareditor.github.io/)
    - Design and management

    View Slide