Upgrade to Pro — share decks privately, control downloads, hide ads and more …

Stop guessing, start knowing: predicting winnin...

Stop guessing, start knowing: predicting winning products with PMax & Search

Are you an expert in PMax and Shopping campaigns at scale, with a solid understanding of product feeds, custom labels, and campaign structures? Then it’s time to go beyond performance monitoring and into predictive strategy.

Here we'll show you:

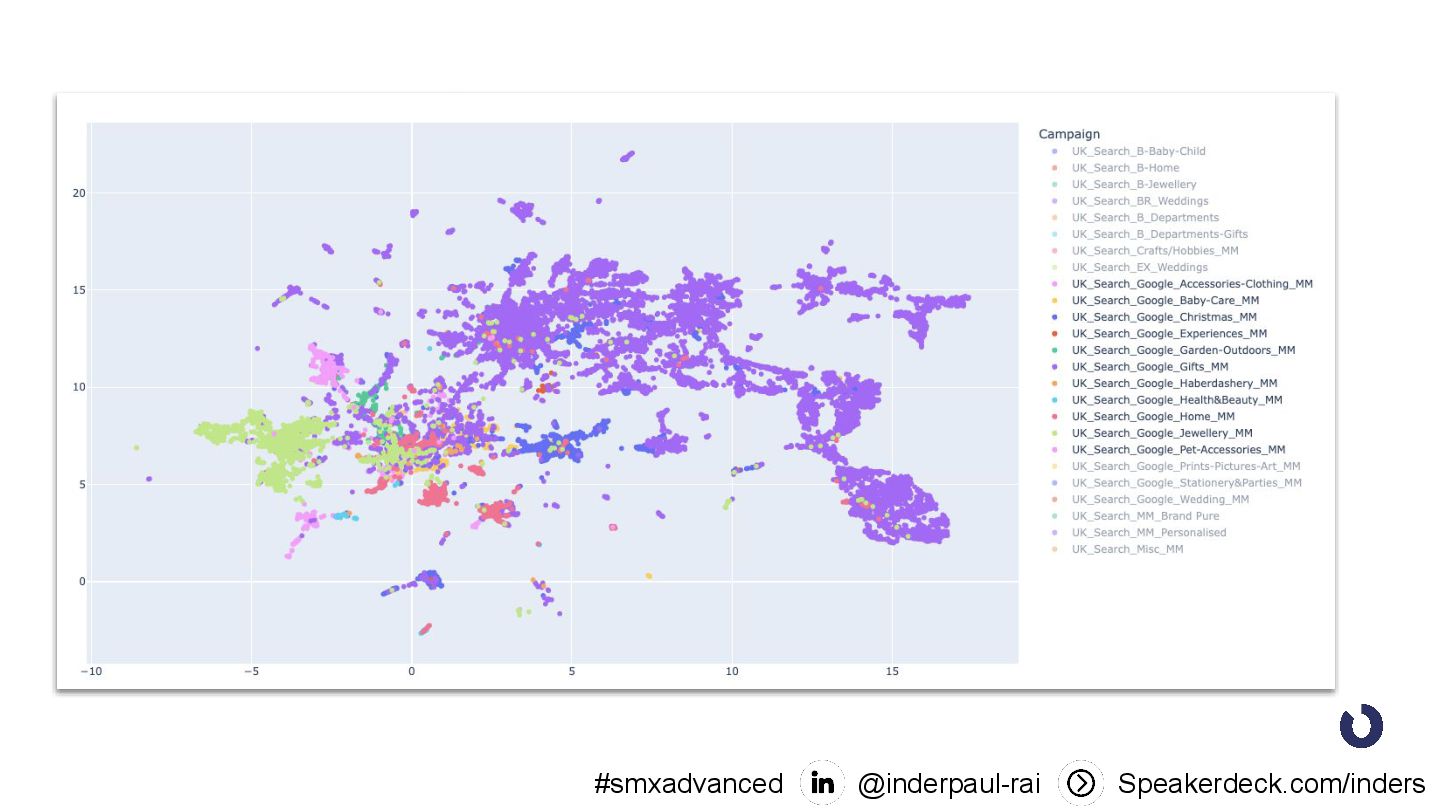
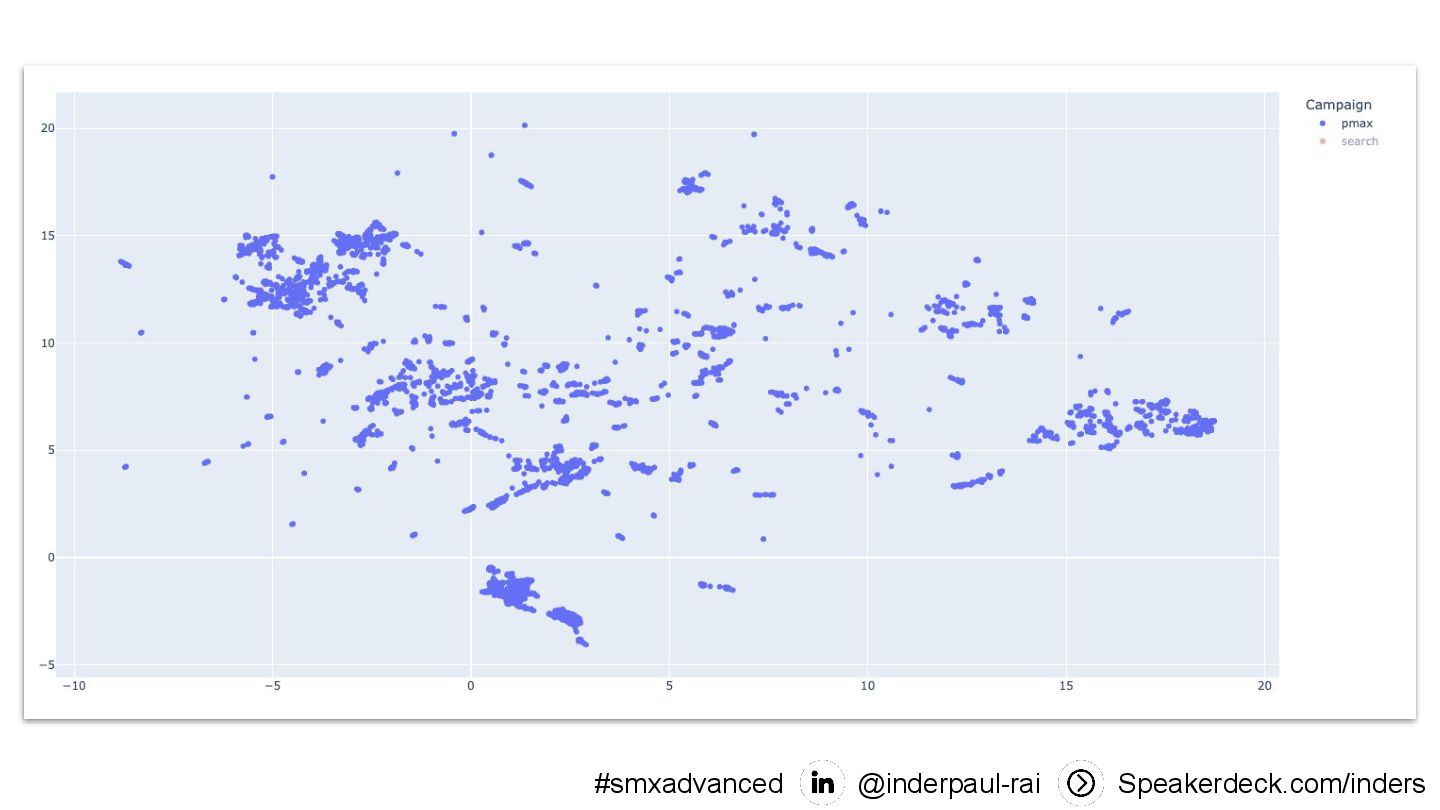
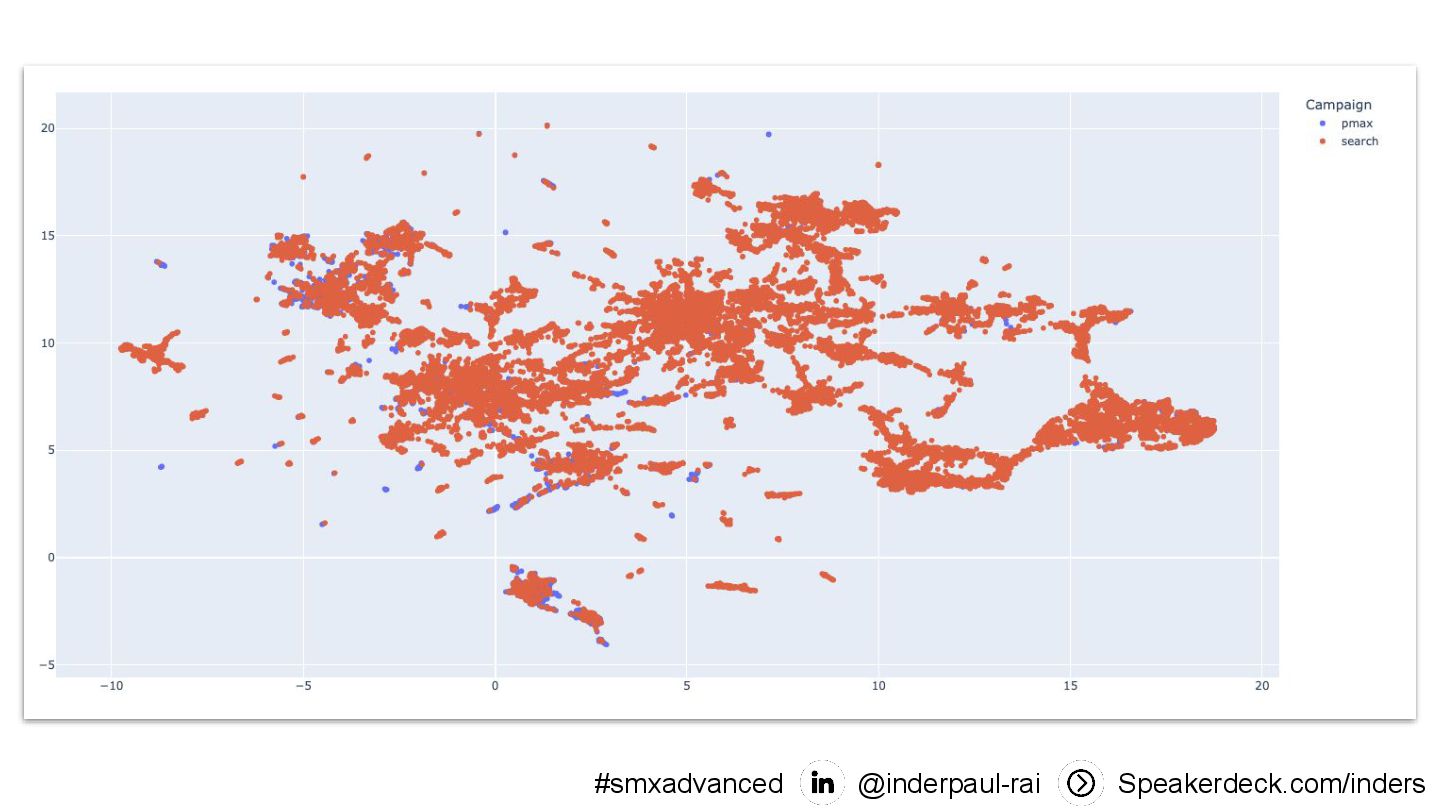
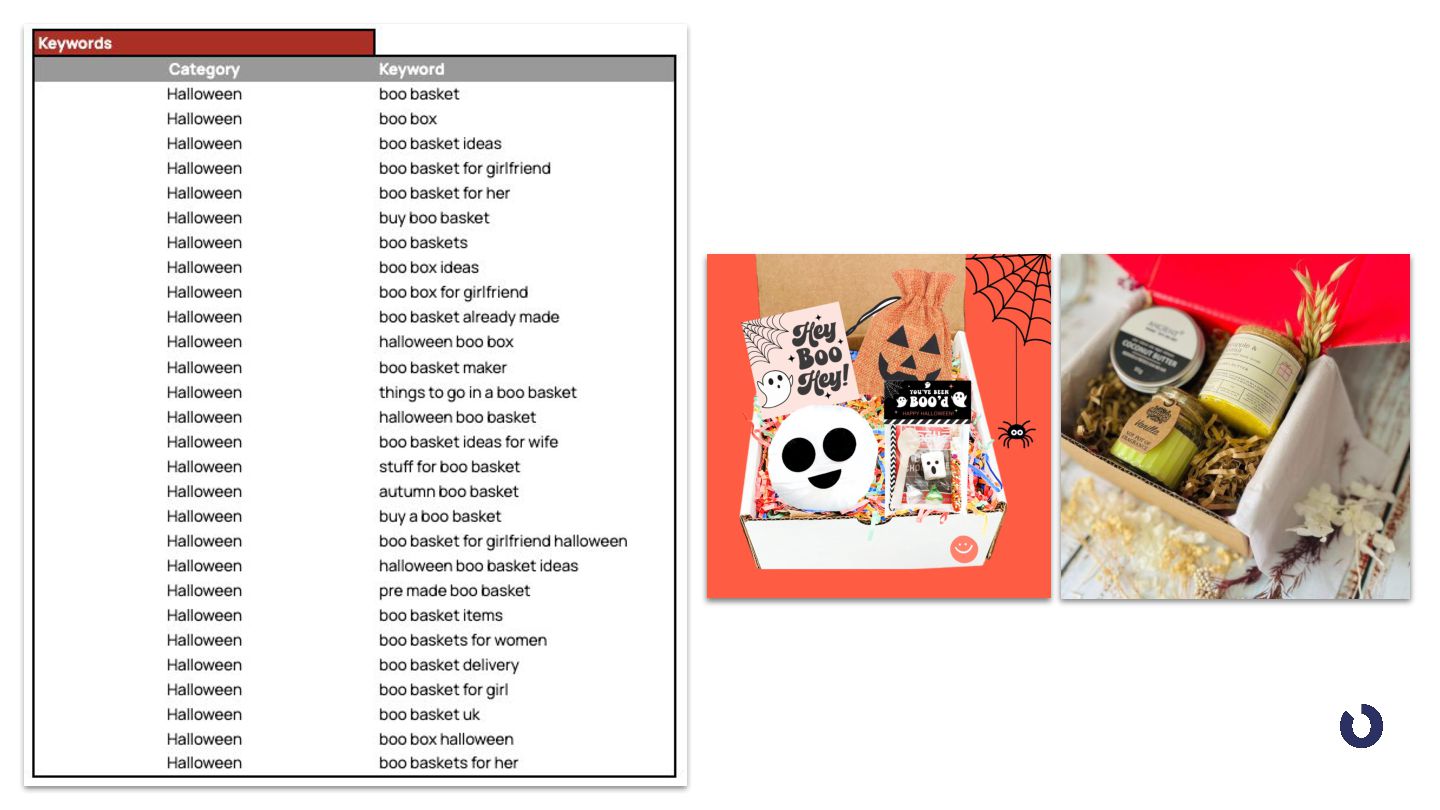
How to map and analyse shared and unique search term coverage across Search and PMax campaigns.

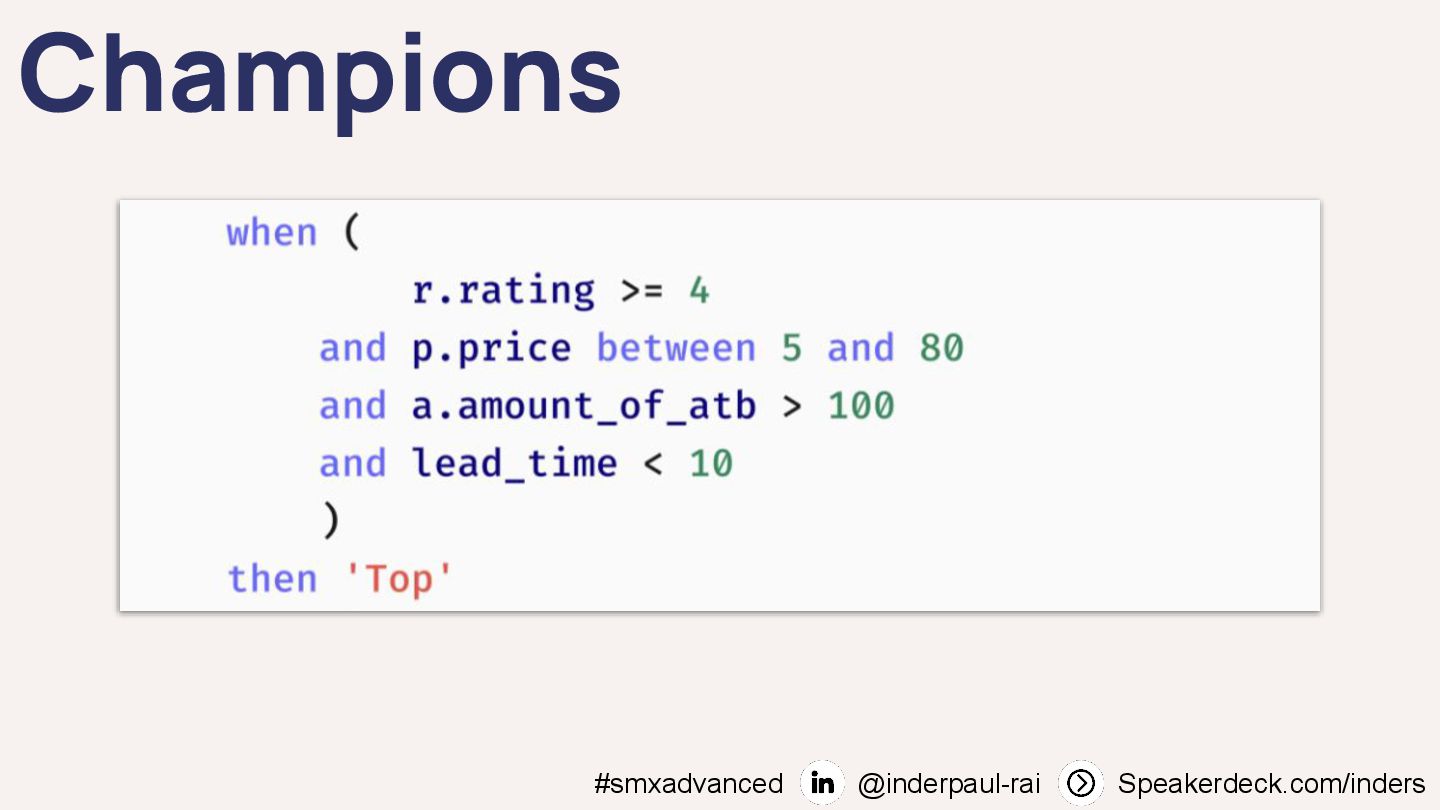
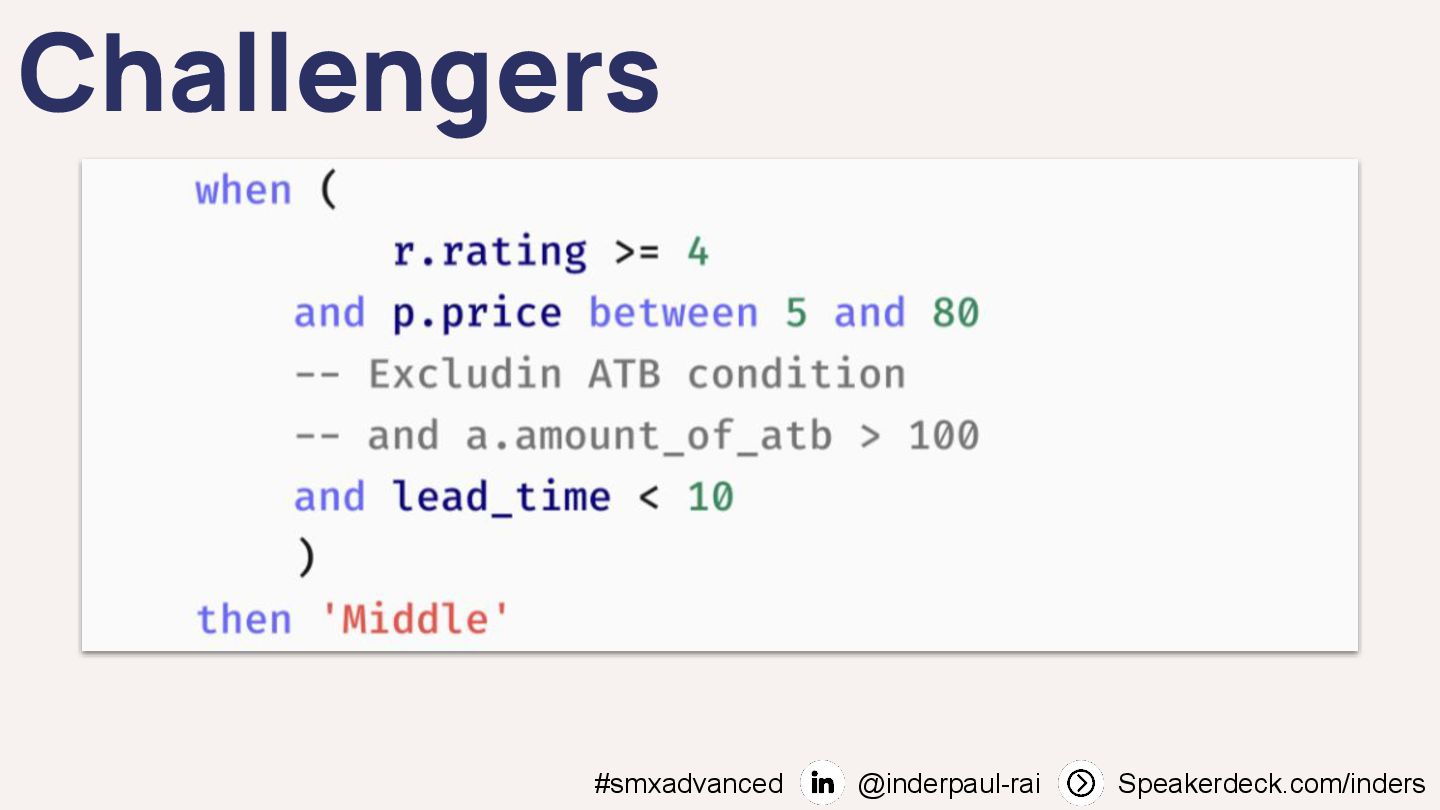
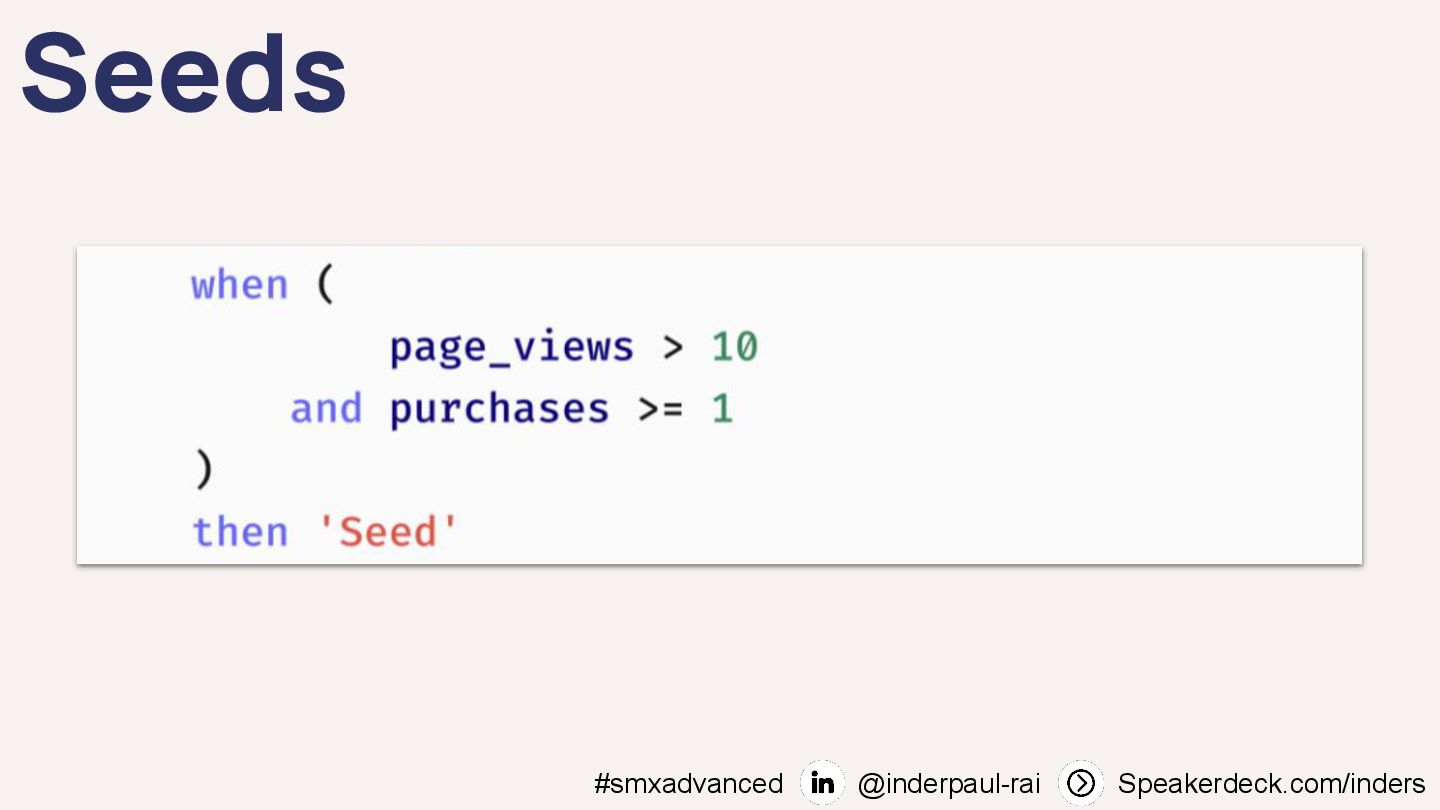
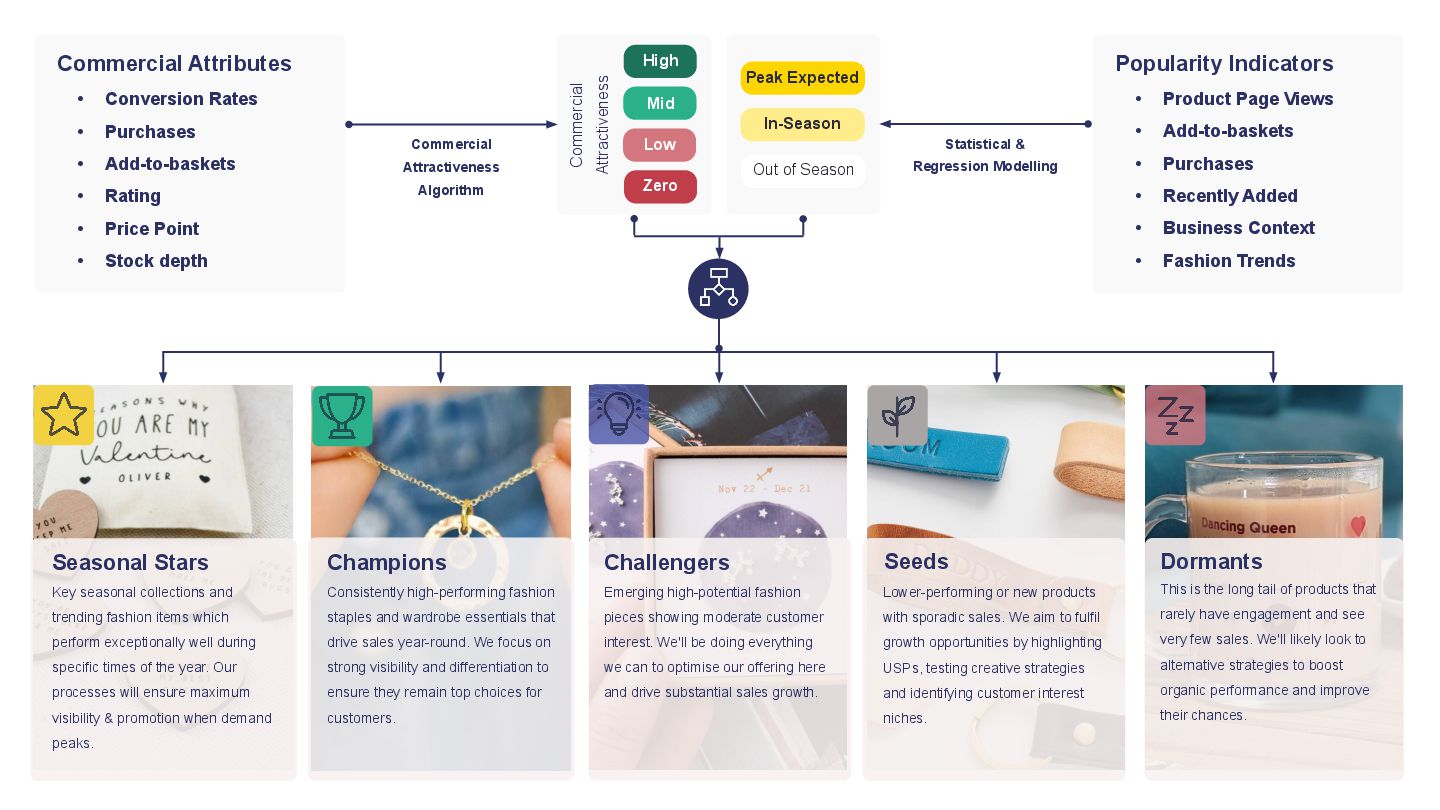
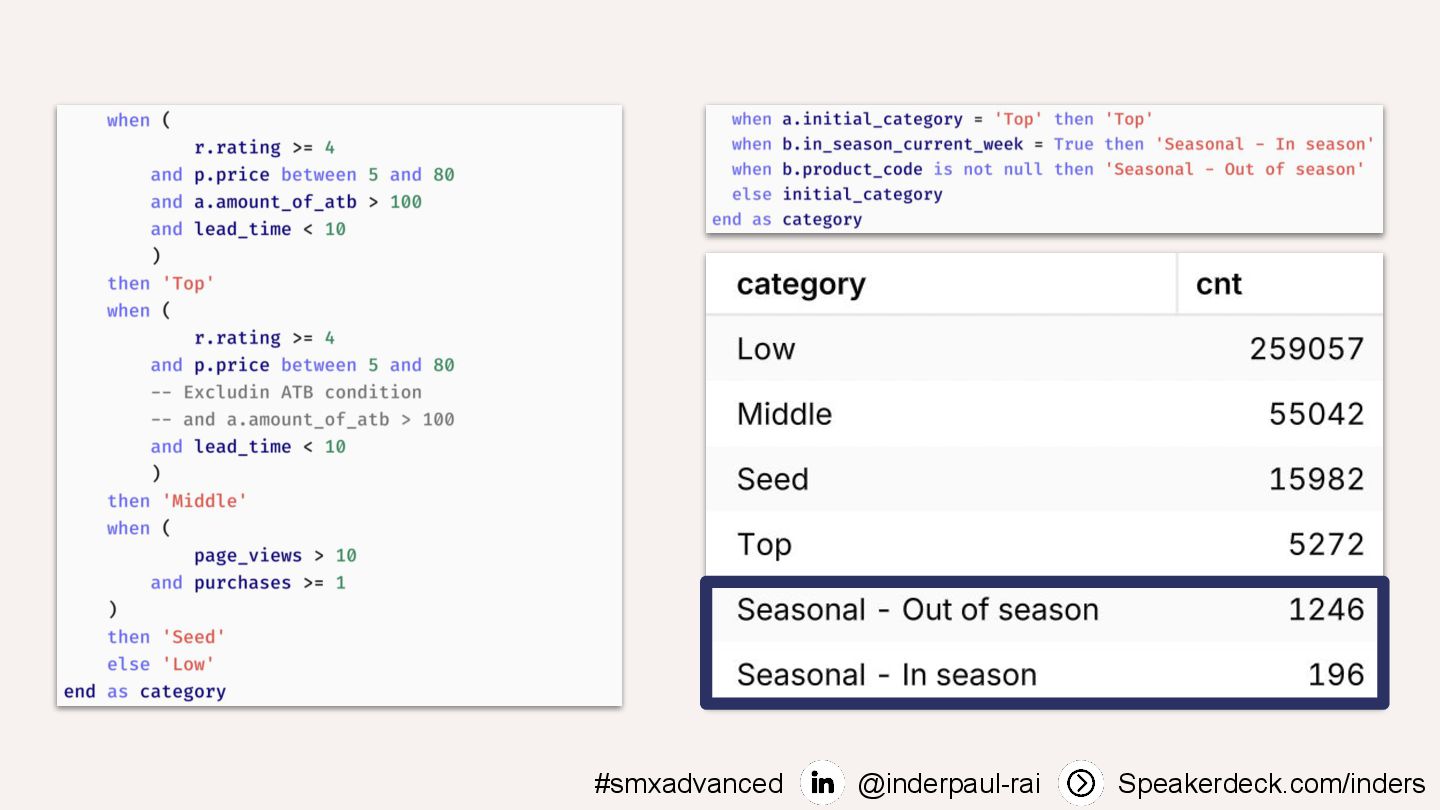
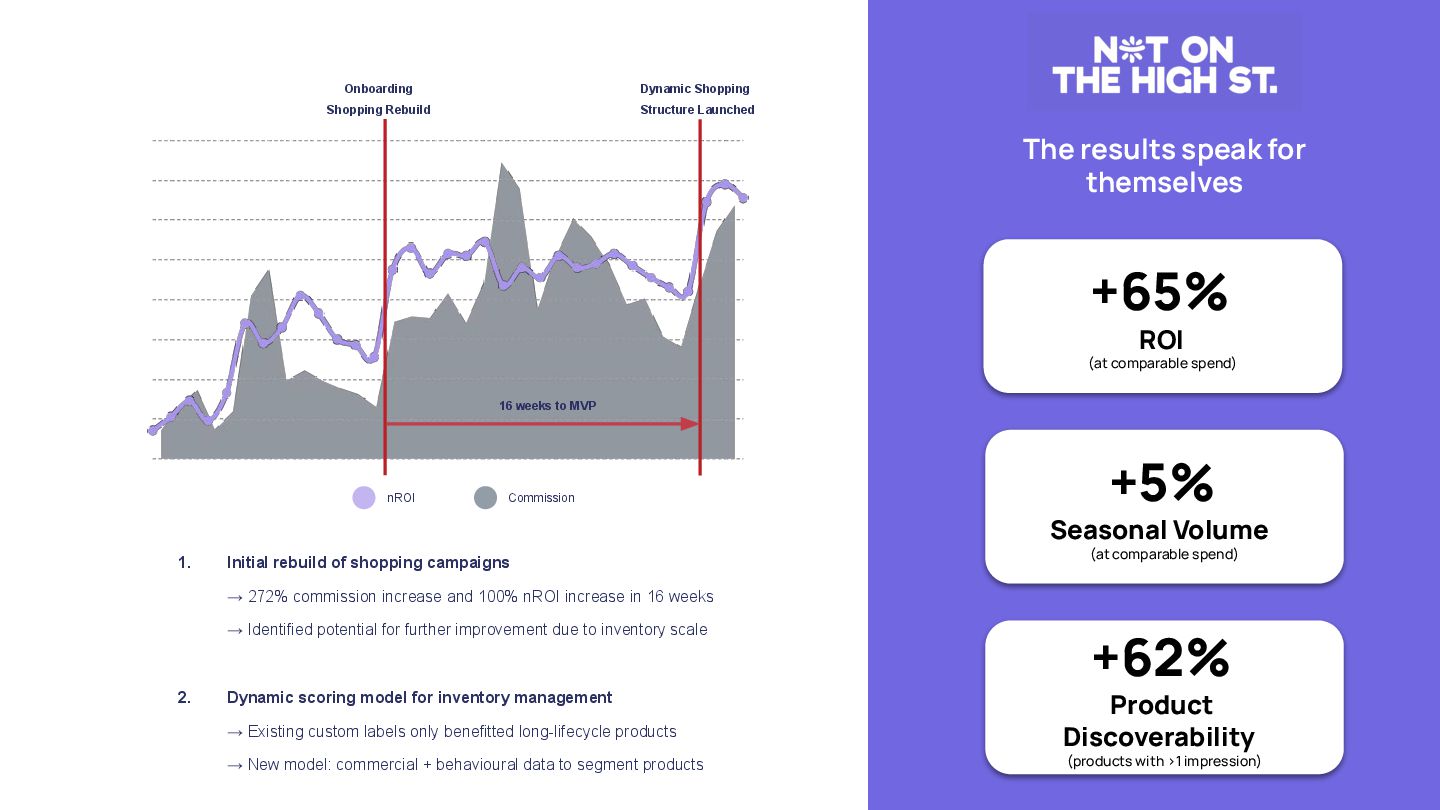
A practical framework to score products based on historical performance and predictive potential for Shopping Ads.

How to use that scoring to adjust feed inputs, prioritise bidding, and inform testing.

Avatar for Indi

Indi

October 01, 2025
Tweet

More Decks by Indi

Other Decks in Marketing & SEO

Transcript

  1. Stop Guessing, Start Knowing: Predicting Product Performance with PMax &

    Search Inderpaul Rai speakerdeck.com/inders @inderpaul-rai @inderpaul_rai
  2. 2017 2018 2020 2021 Exact Match brutalised PMax launched, BMM

    deprecated Search terms restricted RSAs launched
  3. 2017 2018 2020 2021 2025 Exact Match brutalised PMax launched,

    BMM deprecated Search terms restricted RSAs launched AI Max
  4. Benchmarking says we aren’t price competitive Utilising Google Merchant Centre

    we are able to explore price gaps between products versus the competition ➔ 43% of the products are more expensive than the peerset benchmark ➔ 30% of total number of clicks from products are via the “more expensive” classification ➔ Algorithm initially gave visibility but suddenly dropped, even as CR continued to spike ➔ Even if the product is price competitive it’s never resurfaced again to regain traction
  5. Limitations in the shopping ad structure The Problem: One Bucket,

    Mixed Signals Target ROAS: 700% Shopping Campaign: Products £65 to £99.99 To hit the blended ROAS target, budget is distributed to lower converting products in the campaign’s pool of products. This diverts further spend potential of high performing “winners” suppressing their full potential & reducing total profit. The Impact: 🏆 Price-Competitive “Winners” High CvR, easily hits target. Uncompetitive “losers” Low CvR, drags down average. The current setup didn’t account for price competitiveness and impact on conversion rates - we wanted to change this The Solution: Smart Buckets, Clear Signals Target ROAS: 600% Target ROAS: 900% “Winners” £65 to £99.99 “Losers” £65 to £99.99 By separating products, we give the algorithm clear, achievable goals. This allows us to push our winners harder and find the true profitable level for everything else, maximising total profit. The Benefit: 🏆 Stable “winners” eiciency distribution close to average Suppress “losers” via higher ROAS & minimising wastage Becomes…
  6. The Framework: Reworking your portfolio Dormants This is the long

    tail of products that rarely have engagement and see very few sales. We'll likely look to alternative strategies to boost organic performance and improve their chances. Seasonal Stars Key seasonal collections and trending fashion items which perform exceptionally well during specific times of the year. Our processes will ensure maximum visibility & promotion when demand peaks. Champions Consistently high-performing fashion staples and wardrobe essentials that drive sales year-round. We focus on strong visibility and differentiation to ensure they remain top choices for customers. Challengers Emerging high-potential fashion pieces showing moderate customer interest. We'll be doing everything we can to optimise our offering here and drive substantial sales growth. Seeds Lower-performing or new products with sporadic sales. We aim to fulfil growth opportunities by highlighting USPs, testing creative strategies and identifying customer interest niches.
  7. Seeds New or niche products with sporadic sales but potential

    The Goal: Nurture and test, finding the right audience
  8. Seasonal Products that peak during specific times of the year

    Goal: Anticipate and capitalise for max visibility
  9. Dormants Products with declining or no sales that may need

    to be retired The Goal: Evaluate and decide to retire or optimise
  10. Product classification and activation engine Out of Season Peak Expected

    In-Season Popularity Indicators • Product Page Views • Add-to-baskets • Purchases • Recently Added • Business Context • Fashion Trends Statistical & Regression Modelling Commercial Attributes • Conversion Rates • Purchases • Add-to-baskets • Rating • Price Point • Stock depth Commercial Attractiveness Algorithm Commercial Attractiveness High Mid Low Zero Dormants This is the long tail of products that rarely have engagement and see very few sales. We'll likely look to alternative strategies to boost organic performance and improve their chances. Seasonal Stars Key seasonal collections and trending fashion items which perform exceptionally well during specific times of the year. Our processes will ensure maximum visibility & promotion when demand peaks. Champions Consistently high-performing fashion staples and wardrobe essentials that drive sales year-round. We focus on strong visibility and differentiation to ensure they remain top choices for customers. Challengers Emerging high-potential fashion pieces showing moderate customer interest. We'll be doing everything we can to optimise our offering here and drive substantial sales growth. Lower-performing or new products with sporadic sales. We aim to fulfil growth opportunities by highlighting USPs, testing creative strategies and identifying customer interest niches. Seeds
  11. nROI Commission Dynamic Shopping Structure Launched Onboarding Shopping Rebuild 16

    weeks to MVP 1. Initial rebuild of shopping campaigns → 272% commission increase and 100% nROI increase in 16 weeks → Identified potential for further improvement due to inventory scale 2. Dynamic scoring model for inventory management → Existing custom labels only benefitted long-lifecycle products → New model: commercial + behavioural data to segment products The results speak for themselves +65% ROI (at comparable spend) +5% Seasonal Volume (at comparable spend) +62% Product Discoverability (products with >1 impression)