Upgrade to Pro — share decks privately, control downloads, hide ads and more …

The Growth Of The Influencer Economy

The Growth Of The Influencer Economy

Learn More on The Remarkable Rise of Influencer Marketing [Infographic]: https://influencermarketinghub.com/the-rise-of-influencer-marketing/

Influencer Marketing Hub

July 05, 2017
Tweet

Other Decks in Research

Transcript

  1. 2015 2016 420 335 190 2017 +230 New platforms and

    influencer marketing focused agencies in the last 24 months Number of new platforms and agencies in the market
  2. Marketing spend Marketers surveyed are now dedicating budget for influencer

    marketing 37% Marketers surveyed have stand-alone budgets for content marketing. 57%
  3. Nearly 25% FTC & ASC policies of Creators indicated that

    they had received a direct request from a client to not disclose that they were compensated - a direct violation of FTC & ASC policies
  4. Influencer marketing budget over next 12 months 67% 16% 13%

    4% Increase budget Decrease budget Maintain budget Unsure
  5. of Marketers judge Influencer Marketing to be effective of Brands

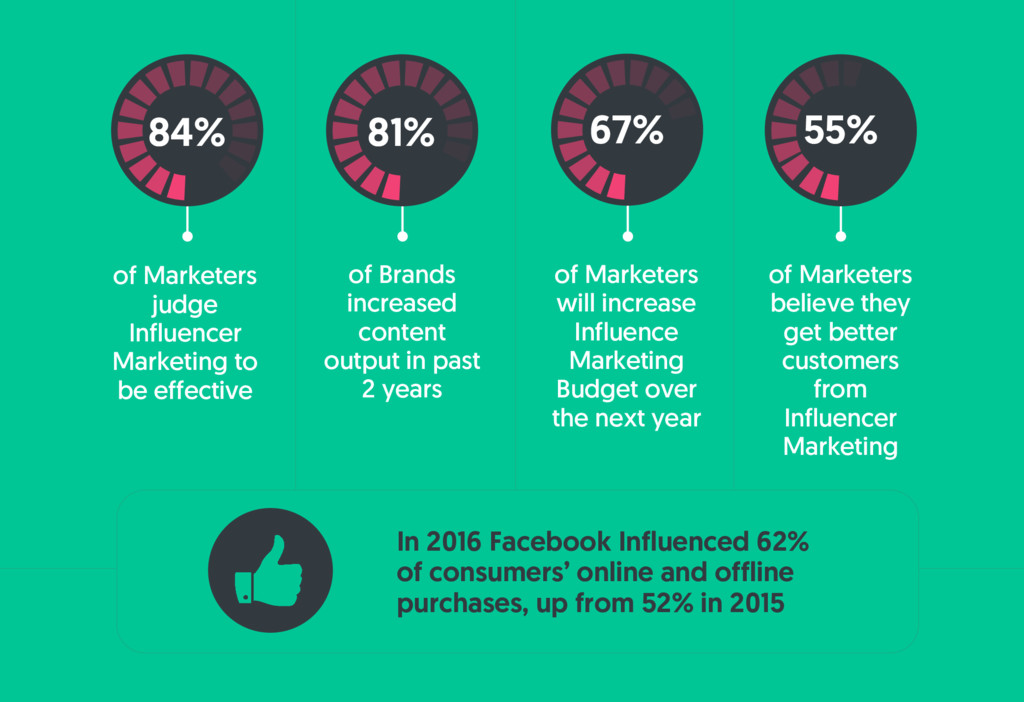
    increased content output in past 2 years of Marketers will increase Influence Marketing Budget over the next year of Marketers believe they get better customers from Influencer Marketing 84% 81% 55% 67% In 2016 Facebook Influenced 62% of consumers’ online and offline purchases, up from 52% in 2015
  6. Influencer marketing Fastest-growing online customer-acquisition method Organic search Email Paid

    search Display advertising Affiliate marketing Others Results from a survey of 272 marketing managers surveyed online Q1 2017 28% 15% 13% 11% 5% 3% 15%
  7. $0 1 2 3 4 5 6 7 8 9

    10 11 12 13 14 15 16 17 18 19 0 20+ 12 24 36 The Average Earned Media Value per $1 spent on Influencer Marketing $7.65
  8. Modeling 113.250 Average Instagram #followers per influencer across 4 leading

    platforms Fitness 105.300 Pets 93.807 Beauty 67.029 Fashion/Design 49.135 Food 47.809 Photography 43.051 Travel 30.619 Lifestyle 22.159 Music 21.122
  9. A look at Instagram Instagram users “like” 4.2 billion posts

    per day 95 million photos and videos per day
  10. Number Of Brands Sponsored Influencer Posts 0 10M 20M 30M

    3.6M 6.8M 12.9M 24.2M 2015 2016 2017 2018 Brand Sponsored Influencer Post Growth (Estimated) #ad #sponsored #spon
  11. Feb’13 Sep’13 Mar’14 Dec’14 Sep’15 Jun’16 Des’16 Apr’17 Instagram User

    Growth Monthly Active Users 150M 300M 450M 600M 700M 100M 150M 200M 300M 500M 400M 600M 700M
  12. Twitter Instagram <1.000 followers <5.000 followers <10.000 followers <100.000 followers

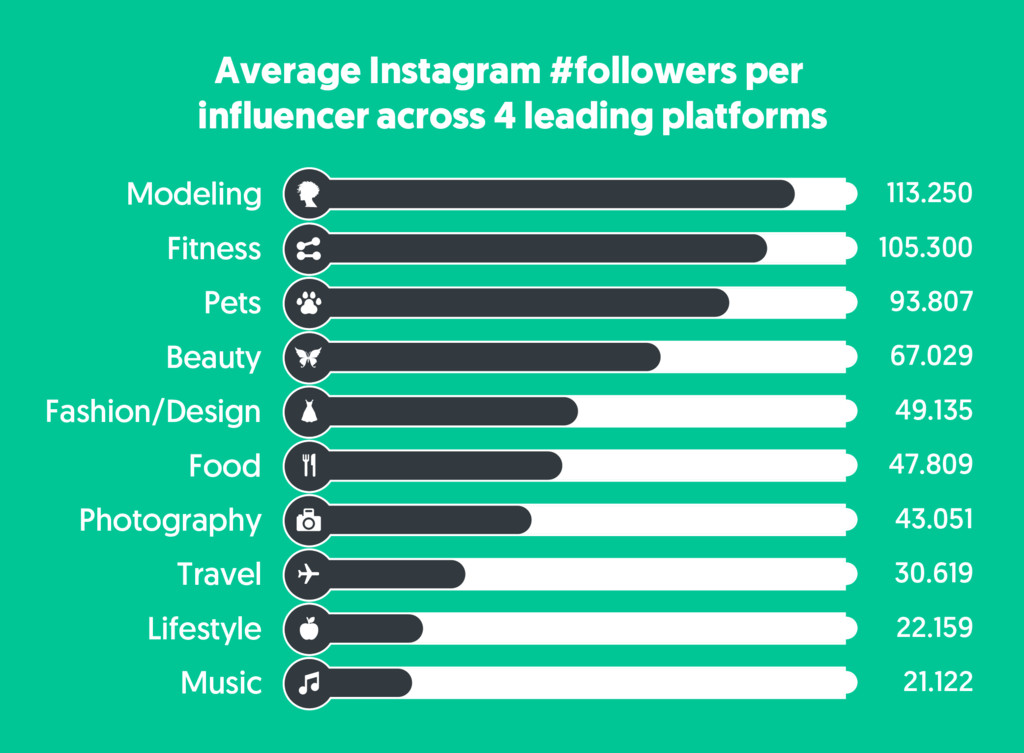
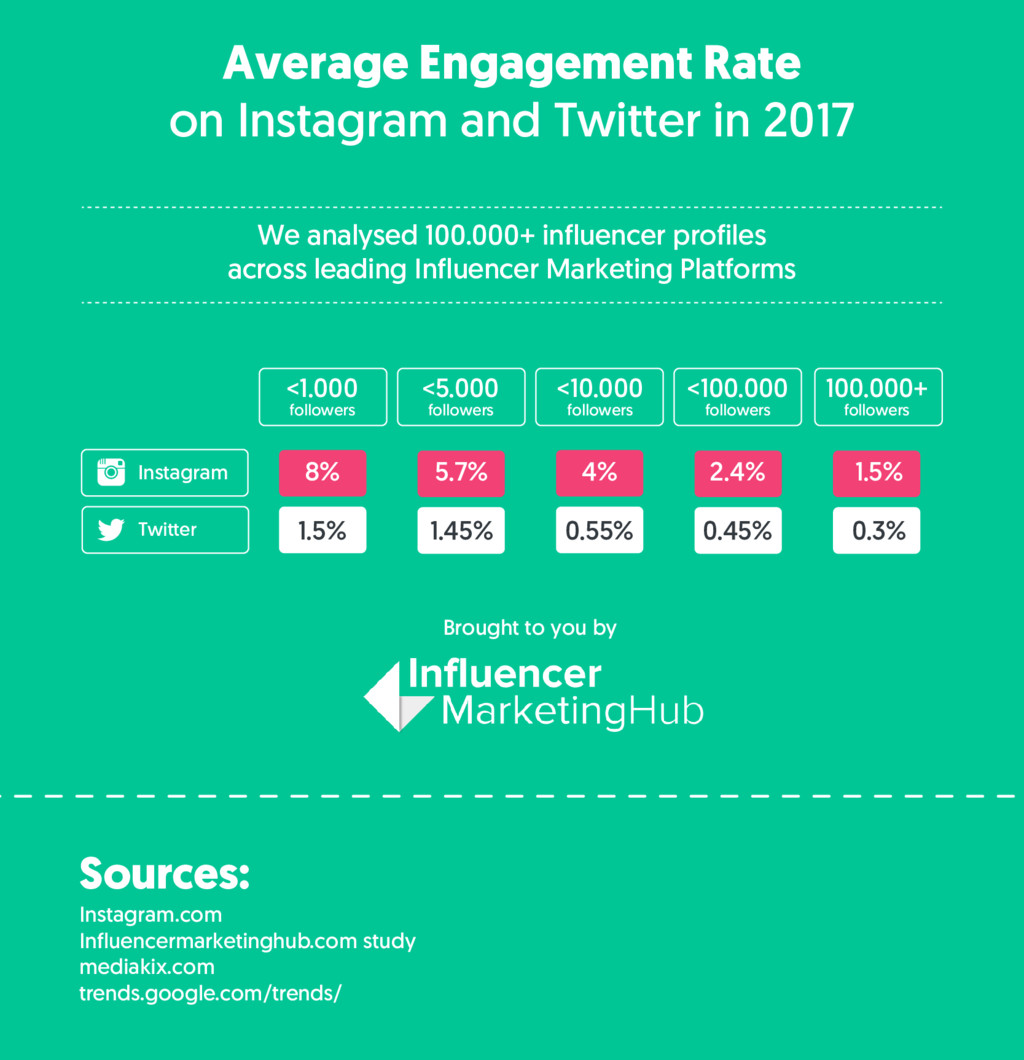
    100.000+ followers 8% 5.7% 4% 2.4% 1.5% 1.5% 1.45% 0.55% 0.45% 0.3% Average Engagement Rate on Instagram and Twitter in 2017 Sources: Instagram.com Influencermarketinghub.com study mediakix.com trends.google.com/trends/ We analysed 100.000+ influencer profiles across leading Influencer Marketing Platforms Brought to you by