Upgrade to Pro — share decks privately, control downloads, hide ads and more …

Growth Strategy of Fukuoka

japan area innovation
February 10, 2014
59

Growth Strategy of Fukuoka

japan area innovation

February 10, 2014
Tweet

Transcript

  1. Growth Strategy of Fukuoka a case of the Public Private

    Partnership Fukuoka Directive Council Director General Taichi Goto [email protected] 08.01.2013 SASEBO Future Seminar
  2. What is Fukuoka D.C? ▪Goal Sustainable growth of the Fukuoka

    region by reinforcing international competitiveness  Increase in region’s net added-value  Net added-value=operating profits+labor costs+depreciation costs+ rents+taxes and duties+patent fees ▪4 Resolutions(from prospectus) Globalization of regional economy Partnership of Industry-Academy-Government-Citizens Swift action in Implementation Contribution to Kyushu, Japan and development of humans  Members consists of 56 regular members, 6 special members, 22 supporting members © Fukuoka Directive Council 3
  3. Why and what kind of growth is needed?  Growth

    is indispensable for sustainable community development. Gross regional product through economic activities, that is the increase in net added-value *Net added-value=operating profits+labor costs+depreciation costs+rents+taxes and duties+patent fees If growth stops Funds to invest for the future will be exhausted ・Disparities will become severer • Difficulties in financial reconstruction • Disabilities in independent area management People and money scatter • Difficulties in even maintaining the status quo The relative position in the international economy will drop • Superiority among firm competitions will decrease • The current absolute income level will also decline Leadership for Japan Fukuoka will continue to enjoy population growth for a while and has a higher potential to grow compared to other regions in the country • Fukuoka has it’s role to lead the economy of Kyushu and the entire country.
  4. Data from: basic resident register, national census, Fukuoka residentsʼ economic

    accounting etc. Subject area  The Fukuoka metropolitan region = designated regional administration area(9 cities and 8 towns) (*)Subject area of the Fukuoka Directive Council 珂 Fukuoka metropolitan region Number of cities/towns 9 cities/8 towns Population(Oct.2009) 2,408,106 Non-Japanese pop.(Oct.2004) 20,379 Employment(Oct.2004) 1,076,116 GRP(FY 2008) 9,285.6 B yen Wholesale sales(June 2007) 13,294.1 B yen Retail sales(June 2007) 2,733.4 B yen Manufacturing production (Dec.2009) 1,618.6 B yen
  5. Approach to making and implementing strategies  Responsible participation of

    the members  Calling in external talents and capitals 6 © Fukuoka Directive Council
  6.  Essence of the strategy is linked to the master

    plan of Fukuoka 7 Fukuoka City Master plan Growth strategy of the Fukuoka metropolitan region ①Making a virtuous cycle of ‘enhancing the quality of life’ and ‘the growth of the city’ ②For the whole of the Fukuoka metropolitan region to develop and to undertake a large scaled role region human resource MICE Urban core start up 8 main industrial fields × 8 business foundations MICE urban core City management strategy Private sector activities and public policy work together human resource
  7.  Proposal by a specialized diet member in the Council

    on Economic and Fiscal Policy 8 Regarded as a model of regional vitalization by the country as well The 7th Council on Economic and Fiscal Policy material 2
  8. Recognizing the state To grow as a business hub along

    with Asia is inevitable and possible. Enhancing strength and seizing chances while acknowledging the history as an international trading city.  Strength  Its strategic position(middle of East Asia)  High quality of life  Its leadership in Kyushu  Concentrated establishment of research and educational institutions  Chances  The growth of Asia  Kyushu’s integral deepening 10 © 福岡地域戦略推進協議会|Fukuoka Directive Council ‘Photo from Fukuoka City’
  9. Setting a vision for the future Business hub of East

    Asia A base for business-interaction, - development, -management of Japan, China, Taiwan and Korea  Sustainable regions  Economy  Human resource  Transportation  Living  Environment  Area management 11 © Fukuoka Directive Council ‘Photo from Fukuoka City’
  10. Numerical targets Goals within 10 years Gross Regional Product(GRP) +2.8

    trillion yen(av. annual growth rate+2.5%) Employment +60 thousand (av. annual growth rate+0.5%) Population +70 thousand (av. annual growth rate+0.3%) 0.0 2.0 4.0 6.0 8.0 10.0 12.0 14.0 2000 2002 2004 2006 2008 2010 2012 2014 2016 2018 2020 1.5% 2.5% 実績 9.9兆円 11.5兆円 +1.2兆円 基本シナリオ ⽬標シナリオ 12.7兆円 +1.6兆円 実績 試算 GRP (兆円) Increment in annual sales aim 440 billion yen 113 billion yen Fukuokaʼs top 5 health food companiesʼ gross sales 2009 (Everlife, MEDIAPRISE, Yazuya, Qʼsai, ASAHI RYOKUKEN) 12 © Fukuoka Directive Council
  11. Setting strategies Reconstructing the source of growth 13 (*)outside the

    area(the outside area of Kyusyu as the subject area to obtain market demand) Infrastructure to support forays outside of the area  The Asian market is still growing  Dynamic expansion of the economic block by the shortening of time distance Strengthening diversity in talent  Decrease in the working age population Making venues for innovative and creative exchanges  Decrease in the number of branch officers/stores  Diminution of the hinterland, Kyushu’s market © Fukuoka Directive Council ‘Photo from Fukuoka City’
  12. Phased expansion of actions short term Increase in the number

    of visitors (MICE etc...) mid term Business development (Social experiments etc…) long term Growth in the exporting industry (inducing job creation) Process planning 14 Future vision Business hub of East Asia Goal for 2020 GRP+2.8 trillion yen Employment +60000 Population +70000 2011 Strategy 2012 F/S 2013 project Fukuoka D.C. phase1 © Fukuoka Directive Council
  13. 8priority industrial areas 8business bases Economic bases Promotion of small

    & medium enterprises Procurement of funds Human resource development Social Experiments City planning City center Waterfront Traffic network Residential environment 高 中 低 数億円 数十億円 数百億円 事業採算性 (勝算、実現可能性) (担い手の見通し) ⑤ ⑤ ⑦ ⑧ ⑪ ⑥ ⑫ ⑫ ⑩ ⑨ ⑨ ⑩ ⑥ ⑦ ⑤ ⑪ ⑧ Growth (The market size 10 years later) (extending effect to Kyushu) high 中 low hundreds of millions billions Tens of billions (yen) Black= Fukuoka metropolitan region Red = Japan (av.) Profitability (chance of success, feasibility) (prospective persons in charge) Narrowing down the priority areas tourism +27billion yen〜 (+1.5%/year〜) environment +190billion yen〜 (+2.1%/year〜) food +120billion yen〜 (+1.5%/year〜) ⑤Industrializing higher education ⑥Digital content industry ⑦Fashion industry ⑧Customer attraction/interaction industry ⑨Sophistication in mail order business ⑩Sixth sector industrialization and globalization of food ⑪Sophistication in lifestyle related services ⑫Attraction of global firms/ facilities Disparity (Inevitability, characteristics of Fukuoka) 15 © Fukuoka Directive Council
  14. Establishing project participating working groups (WG)  Working Group (WG)

    Determination of the specific project to assign Feasibility study Project plan creation  Council Marketing Fostering of human resources Relationships 16 General assembly Chairman, Vice-chairman Board Advisor Auditor Secretariat Tourism WG Environment WG Food WG Human resource WG Urban regeneration WG © Fukuoka Directive Council
  15. SWOT analysis opportunities threats The growth of Asia Kyushuʼs integral

    deepening Depopulation Great East Japan Earthquake World economic crisis Japanʼs diminishing international competitiveness strength Its strategic position (middle of East Asia) High quality of life Its leadership in Kyushu To grow as a business hub, along with Asiaʼs growth To create a comfortable environment for diverse human resources to work and live weakness Low social diversity Fragmented leadership Swift and responsible promotion through Industry-Academy- Public-Private partnership Maintenance of employment through Innovation of the domestic-demand-led industry
  16. 0 100 200 300 400 500 600 0 2,000 4,000

    6,000 8,000 10,000 12,000 1996 1997 1998 1999 2000 2001 2002 2003 2004 2005 2006 2007 2008 2009 2010 2011 福 岡 市 と 福 岡 都 市 圏 G R P ( 実 質 ) 8市8町 福岡市 全国(右目盛) (単位:10億円) (単位:兆円) 全 国 の G D P ( 実 質 ) (年度) 2007 2000 予測 2008年度 8市8町は 福岡都市圏の27% 2008年度 福岡市は 福岡都市圏の73%  Fukuoka metropolitan regionʼs Gross Regional Product(GRP) is ca. 10 trillion yen (2007).  The average annual growth rate from 2000 to 2007 was1.7%. Data from: Fukuoka residentsʼ economic accounting, national economic accounting Growth achievements Transition of GRP of Japan, Fukuoka City and the Fukuoka metropolitan region (*)GRP=Gross Regional Product , GDP=Gross Domestic Product
  17. Data from: PricewaterhouseCoopers UK Economic Outlook November 2009 4%〜:San Paolo,

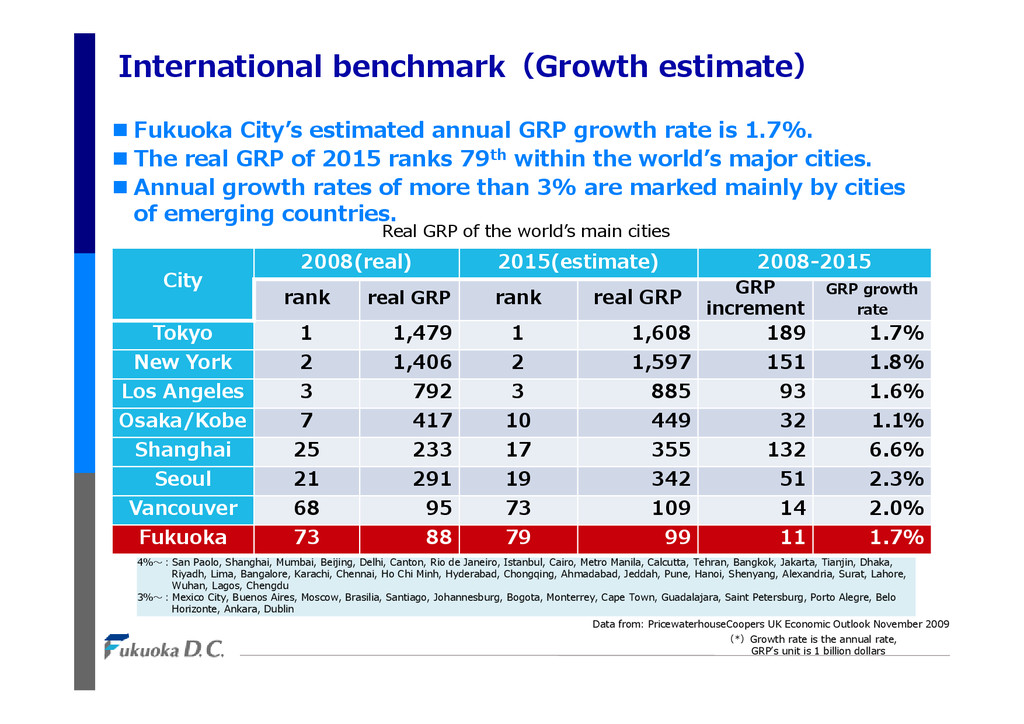
    Shanghai, Mumbai, Beijing, Delhi, Canton, Rio de Janeiro, Istanbul, Cairo, Metro Manila, Calcutta, Tehran, Bangkok, Jakarta, Tianjin, Dhaka, Riyadh, Lima, Bangalore, Karachi, Chennai, Ho Chi Minh, Hyderabad, Chongqing, Ahmadabad, Jeddah, Pune, Hanoi, Shenyang, Alexandria, Surat, Lahore, Wuhan, Lagos, Chengdu 3%〜:Mexico City, Buenos Aires, Moscow, Brasilia, Santiago, Johannesburg, Bogota, Monterrey, Cape Town, Guadalajara, Saint Petersburg, Porto Alegre, Belo Horizonte, Ankara, Dublin City 2008(real) 2015(estimate) 2008-2015 rank real GRP rank real GRP GRP increment GRP growth rate Tokyo 1 1,479 1 1,608 189 1.7% New York 2 1,406 2 1,597 151 1.8% Los Angeles 3 792 3 885 93 1.6% Osaka/Kobe 7 417 10 449 32 1.1% Shanghai 25 233 17 355 132 6.6% Seoul 21 291 19 342 51 2.3% Vancouver 68 95 73 109 14 2.0% Fukuoka 73 88 79 99 11 1.7% International benchmark(Growth estimate)  Fukuoka Cityʼs estimated annual GRP growth rate is 1.7%.  The real GRP of 2015 ranks 79th within the worldʼs major cities.  Annual growth rates of more than 3% are marked mainly by cities of emerging countries. Real GRP of the worldʼs main cities (*)Growth rate is the annual rate, GRPʼs unit is 1 billion dollars
  18. GRP estimate of the Fukuoka metropolitan region +1.59兆円 GRP(trillion yen)

    (year) Annual rate of 1.5% Annual rate of 3.0% Data from: Resident’s economic accounting etc.... Sensitivity analysis of growth target  1.5%, the trend estimation of the average annual GRP growth rate, is predicated on the present level of labor and fund input  Supposing the +α as1.5%, the annual sales increase needed will be 648 billion yen. Fukuoka’s top 5 health food companies’(*1) total gross sales of 2009 was 113 billion yen (*1)Top 5 health food companies: Everlife, MEDIAPRISE, Yazuya, Q’sai, ASAHI RYOKUKEN (*2)The weighted average (cf.19.4% nationally) , weighted for the industrial component proportion of Fukuoka from the statistical data of Fukuoka Prefecture based on the national data by industry from the Financial data handbook by industry (source : Development Bank of Japan2010) Growth in a year: 177 billion yen (A) Net added-value rate(*): 27.3% (B) Sales increase needed: A÷B=648 billion yen
  19.  Decrease in wholesales/retails due to industrial reorganization and branch

    reduction.  Increase in service, real estate, transportation/communications due to population growth etc...  Increase in manufacturing industry by taking in demands from the outside regions. 0 500 1,000 1,500 2,000 2,500 3,000 2000 2007 2000 2007 2000 2007 2000 2007 2000 2007 2000 2007 製造業 卸売・小売 不動産 運輸・通信 サービス その他 8市8町 福岡市 0 2,000 4,000 6,000 8,000 10,000 12,000 2000 2007 全産業計 (年度) (10億円) (10億円) 748 975 2,302 2,456 2,194 934 812 934 1,122 2,750 +227 ▲154 +189 +557 +122 1,784 1,955 +171 10,039 +1,112 8,928 (右⽬盛) 2011.9.8 Strategy Forum Fukuoka 22 Industrial characteristics of the Fukuoka metropolitan region (*)ʼManufactureʼ includes mining, ʻothersʼ are finance/insurance, construction, electricity/gas/water, agriculture/forestry/fishery, government sector etc... Gross (real) output of the Fukuoka region by industry Data from: Statistical data of Fukuoka
  20.  Wholesales/retails, transportation/communications and service are highly predominant within the

    country.  Agriculture/forestry/fishery and manufacturing has low predominance within the country.  Manufacturing, government sector, service, real estate have high growth rates. 農林水産 製造業 建設 電気・ガス・水道 卸売・小売 金融・保険 不動産 運輸・通信 サービス 政府部門他 0.0 0.5 1.0 1.5 2.0 2.5 -6% -4% -2% 0% 2% 4% 6% 特 化 係 数 2007年度/2000年度(年平均) 小円は各産業の全国平均成 長率を表しているもの。 小円の大きさは付加価値額 の規模とは比例していない。 Specialized coefficient and growth rate of the Fukuoka metropolitan region by industry Predominance and growth by industry (*) Each sphere of each industry shows the weight of the net income. 2007/2000 is the growth rate of the net income. Specialized coefficient is of the year 2007 and real. It is defined as a division of ʻthe weight of the net income of industry A within all the other industries of the Fukuoka metropolitan regionʼ by ʻthe weight of industry A within the whole countryʼ. For example, if the weight of industry A is 30% within the Fukuoka metropolitan region and 20% within the whole country, the specialized coefficient will be 1.5. growth predominance Data from: Statistical data of Fukuoka, residentsʼ economic accounting
  21. Distribution of investment in main city foundation development of the

    Fukuoka metropolitan region [Urban development] Directional shift according to the maturity of the society  By corresponding to regional growth and investing in the whole region, the structure of the city has been almost completed.  The need of directional shift from quantity to quality in urban development.  Providing high quality urban space and strengthening industrial foundation are needed to reconstruct the source of growth. Data from: Fukuoka City Comprehensive Planning, Kyushu Data Book, interview sources 3000 2500 2000 1500 1000 500 0(億円) legend 01:main dot prj_public 01:main dot prj_private 02:Fukuoka City Subway 03:Outer Fukuoka ring road 04:Fukuoka City Highway 05:other main lines prj 06:main plane prj_public 06:main plane prj_private
  22.  Working-age population (15〜64) decreased by 70 thousand (1.64 million→1.57

    million)  Elderly population aged 65 and over increased by 180 thousand(450 thousand→630 thousand). 0 5 10 15 20 25 0-4 5-9 10-14 15-19 20-24 25-29 30-34 35-39 40-44 45-49 50-54 55-59 60-64 65-69 70-74 75-79 80-84 85- 万人 2010(H22) 65歳以上18.4% 2020(H32) 65歳以上24.8% 歳 Population proportion of the Fukuoka metropolitan region by age (2010-2020) Data from: National Institute of Population and Social Security Research(moderate-range projection) Fukuoka metropolitan regionʼs depopulation in working age
  23. (千⼈) 13,295 13,464 13,264 12,484 11,566 1,969 2,234 2,382 2,424

    2,387 0 500 1,000 1,500 2,000 2,500 3,000 3,500 4,000 0 2,000 4,000 6,000 8,000 10,000 12,000 14,000 16,000 1990 2000 2010 2020 2030 九州 福岡都市圏(右目盛) (thousand) 1990 2000 2010 2020 2030 estimation  The population of Kyushu peaked in 2000 before the decline, followed by gradual increase in its declining rate. The population of the Fukuoka metropolitan region is forecasted to reach its peak in 2020 before turning to downward trend. Population transition in the 7 prefectures of Kyushu and the Fukuoka metropolitan region Data from: Measured statistics (1990〜2000) from national census Estimated statistics (2010〜2030) from National Institute of Population and Social Security Research(moderate-range projection) [Population] Market of Kyusyu, the hinterland, is shrinking
  24. [Population]Boost in Foreign tourists  Foreign tourists increased due to

    the calling at port of cruise ships.  Net added-value by tourism consumption is 147.3 billion yen, which contributes as 2% of GRP. Data from: Statistical Survey on Legal Migrants Transition of the number of visitors entering Fukuoka Airport/Hakata Port by nationality 698 Fukuoka Airport 426 Hakata Port 272 761 Fukuoka Airport 484 Hakata Port 277 (*)The net added-value rate of 48.7%, calcurated from Japanʼs gross tourism consumption of 23.6 trillion yen and the net added-value of 11.5 trillion yen of 2008, was applied to the calculation of Fukuoka Cityʼs net added-value. Multiplying the tourism consumption of 302.2 billion yen from the Fukuoka City Tourism Statistics of 2008 by the net come of 48.7% mentioned above, Fukuoka Cityʼs net income is 147.3 billion yen Breakdown of 302.2 billion yen of tourism consumption: day trip 12829 yen × 11.61 million people + accommodation 30721 yen × 4.99 million 626 Fukuoka Airport 387 Hakata Port 239 (thousand) 47 63 115 413 448 477 91 85 78 75 101 91 0 200 400 600 800 2006年 2008年 2010年 その他 台湾 韓国 中国
  25. 3.0 % 17.4 % 15.3% 10.6% 8.5% 7.9% 6.6% 

    The number of conventions held is large, but there is still plenty of room for strengthening internationality and scale etc… Kyushu University holding the largest number of international conventions is contributing [Population]Room for strengthening international convention (*)The percentages indicate the rate of foreigners within the participants The numbers of total participants and foreign participants per one international convention (2009) city international conventionls Foreign participants Total participants Tokyoʼs 23 wards 497 23,218 152,193 Fukuoka 206 5,626 114,103 Yokoham a 179 9,846 327,513 Kyoto 164 12,941 107,347 Nagoya 124 12,090 69,416 Osaka 94 5,421 82,300 Sapporo 82 3,971 49,958 Kobe 76 5,859 55,092 Sendai 60 2,734 32,136 Comparison between the numbers of total participants and foreign ones in international conventions (2009) データ出所:国際会議統計
  26.  Except for Tokyo/Osaka large/medium enterprises that can form the

    core of the industrial clusters are few. The number of offices by firm size (2009) type large medium small/medium capital over 1 billion 100 million to 1 billion less than 1 million Tokyo 23 wards 2,699 1.2% 7,881 3.4% 220,650 95.4% Osaka city 497 0.7% 1,467 2.1% 69,462 97.3% Nagoya city 182 0.4% 694 1.5% 44,525 98.1% Fukuoka metropolitan region 84 0.3% 430 1.4% 29,954 98.3% Fukuoka city 75 0.3% 386 1.8% 21,114 97.9% Sapporo city 62 0.2% 381 1.3% 28,424 98.5% Sendai city 37 0.3% 207 1.4% 14,148 98.3% Hiroshima city 45 0.2% 193 1.0% 19,495 98.8% others 2,209 0.2% 11,421 0.8% 1,346,957 99.0% Japan 5,806 0.3% 22,630 1.3% 1,764,775 98.4% Data from: Economic census (2009) ・ [Economy by branch offices] The low number of large and medium enterprises
  27. [Economy by branch offices] Decline in the number of branch

    offices  The number of branch offices have started to decrease from 2000 due to centralization of firm management etc. and the central function of Fukuoka business has been weakened. Number of branch ofi ces Fukuoka Tokyo Osaka Transition in numbers of branch offices in major cities Source: Japanʼs urban system and regional structure Aichi University of Education Kazutoshi Abe
  28.  Asian countriesʼ GDP has shown a V-shaped recovery thanks

    to the growth in China and India.  The growth rate of the expenditure in the service area is also high in Asian countries with population bonus as a background factor. Comparison of GDP level after the Lehman shock Data from: Development Bank of Japan Advanced countries Asian countries BRICs [Exporting industry]The growing Asian market (*)The expenses in the service industry in Asian countries has grown 18.5% from 2005 to 2010
  29.  ʻShanghai-Tokyoʼ and ʻTokyo-Osakaʼ will have a scale of 50

    million people due to the shortening of time distance.  A wider point of view that transcends the scale of Kyushuʻs economic area will be needed in the future. Source: ʻShigeru Itoʼs Ground Design of Tokyo 2030ʼ (Area Management Nov.2011) Tokyo Tokyo〜Osaka Osaka ca. 500㎞ 2.5hrs by super express (1.1hrs by linear motor train) Nanjing Shanghai〜Nanjing ca. 350㎞ 2hrs by super express Shanghai [Exporting industry] Creation of a wide economic bloc taking place in the surroundings
  30. Promotion of area strategy by working groups (WG) Tourism WG

    (WG members: 17 organizations)  Susumu Ishihara Vice Chairman of the Kyushu Economic Federation  Masaki Yamashita JTB, Manager of Tourism Nation Promotion Environment WG (WG menbers:26 organizations)  Hiroto Yasuura Trustee/vice-president of Kyushu University  Makoto Maeda Kyushu University Headquarters of intellectual property/associate professor Food WG (WG members: 13 orgaizations)  Yoshihiko Nakamura Fukuoka Chamber of Commerce and Industry/ Senior Executive Officer  Koichi Gono Director of the office of Economy Tourism Culture of Fukuoka Human resource WG (WG members: 11 organizations)  Eiichi Nakamura Director of General Affairs and Policy Planning Department ▪Akiko Katou Visiting director of the editorial committee of the Nishinippon Shimbun Urban regeneration WG (WG members: 31 organizations)  Koichi Hashida Vice-executive of Fukuoka Association of Corporate  Kenichi Fujinaga Vice-president of Kyudenko Corporation  Shigeyuki Takasaki Director and Managing Executive officer of Nishi-Nippon Railroad  Yuzuru Hongo Senior managing director of Kyushu Railway Company 34 © Fukuoka Directive Council
  31. 35

  32. Tourism WG  The promotion of the MICE strategy Goal

    the number of international conventions (UIA standard) 50 (2020) ← 28 (2011)  Tourism agency designation of a global MICE strategy city 6 main fields  Medicine  Smart city  Food  Contents  Sports  Asia City planning centered on MICE  Short-term: expansion and enhancement of attractiveness of current facilities  Long-term: consideration of ground design: WF region development, portfolio of facilities all around Kyushu Structuring Destination Marketing & Management Platform (DMP)  Creating a one-stop system of Inviting/accepting MICE (scheduled to be launched in 2014)
  33. Environment WG  Structuring Fukuoka version smart city 37 Convention

    competitions/meetings/in ternational conventions Incentive Invitations/preferen tiality/inspection Exhibition Event exhibitions/events Meeting meetings/training/ seminars Smart energy Global business Global city Smart mobility country operator, Other organizations (transportation, energy etc...) Open data Data industrialization Strengthening of MICE marketing function to succeed in international competitions Structuring organized communicative function with Diverse stakeholders Strengthening of the evaluation and feedback function of the MICE principle MICE information base Structuring a smart energy model (HEMS/MEMS/BEMS etc…) (coordination with BIM (3D software)) ーdistributing electricity in each area (block) after receiving it collectively in a high voltageー Smart energy Control center Smart mobility information base (geographical space information system) Traffic connection information service operation test Utilization of person trip data using smartphone probes F k k V L M l i di Fukuoka V-Low Multimedia broadcasting experiment Smart mobility Asia 2013 Ito University Avenue Project Disaster・Alarm Information
  34. Food WG  Visualization and optimization of sales channels 

    Setting brand concepts: prior exportation/ marketing/ forming personal connections  Structuring a network of the concerning people: planning international exhibitions of the food industry and forming its main managing body International exhibition of the Food & Entertainment Industry Creation of new markets/ business Development in infrastructural functions Agriculture/foresting/fishery Cold chain logistics Material processing etc... Processed/semi-processed goods … Food processing machines … Restaurants/ hotels/ fast foods Tableware/ interior/ exterior Fostering of human resources/staffing game/ software tourism finance/VC health care service communications/IT media/publication Industries relating with food Relating surrounding industries
  35. 40 Urban regeneration WG  Promotion of catalyst projects based

    on the city center revitalization strategy Spatial preparation  Innovation anchor/ public space/ water front Realization policy  Transportation, area promotion, economic financial policies etc…  Deregulation (revision of the harbor district’s area regulations)by Fukuoka City and determination on the policy to strengthen the MICE function I: Initial period Formation and visualization of fundamental conditions of Innovating economy by implementing catalyst projects Ⅱ: Maturity period Development and expansion to the Surroundings Development and function accumulation/ reinforcement of innovation economy Creation of innovation anchors  Innovation anchor of Hakata and the surrounding areas  Innovation anchor of Tenjin/ Daimyo district  Exhibition center of the Center Pier (expansion) Creation of symbolic public space/ waterfront  Streetscape of Meiji Street  Streetscape of Hakata Ekimae Street  Riverfront Promenade (prior development)  River side block renovation of Meiji Street  Bayfront Promenade (prior develoopment) <Catalyst projects> A phased image of spatial development Source:created by FDC City Revitalization Section