May 14, 2013 Kosuke Motani Chief Senior Economist, Economist Department Japan Research Institute, Limited [email protected] ΠϝʔδΛදࣔͰ͖·ͤΜɻϝϞϦෆͷͨΊʹΠϝʔδΛ։͘͜ͱ͕Ͱ͖ͳ͍͔ɺΠϝʔδ͕ഁଛ͍ͯ͠Δ Մೳੑ͕͋Γ·͢ɻίϯϐϡʔλʔΛ࠶ىಈͯ͠࠶ϑΝΠϧΛ։͍͍ͯͩ͘͞ɻͦΕͰ͍ x ͕දࣔ͞Ε Δ߹ɺΠϝʔδΛআͯ͠ૠೖ͍ͯͩ͘͠͞ɻ
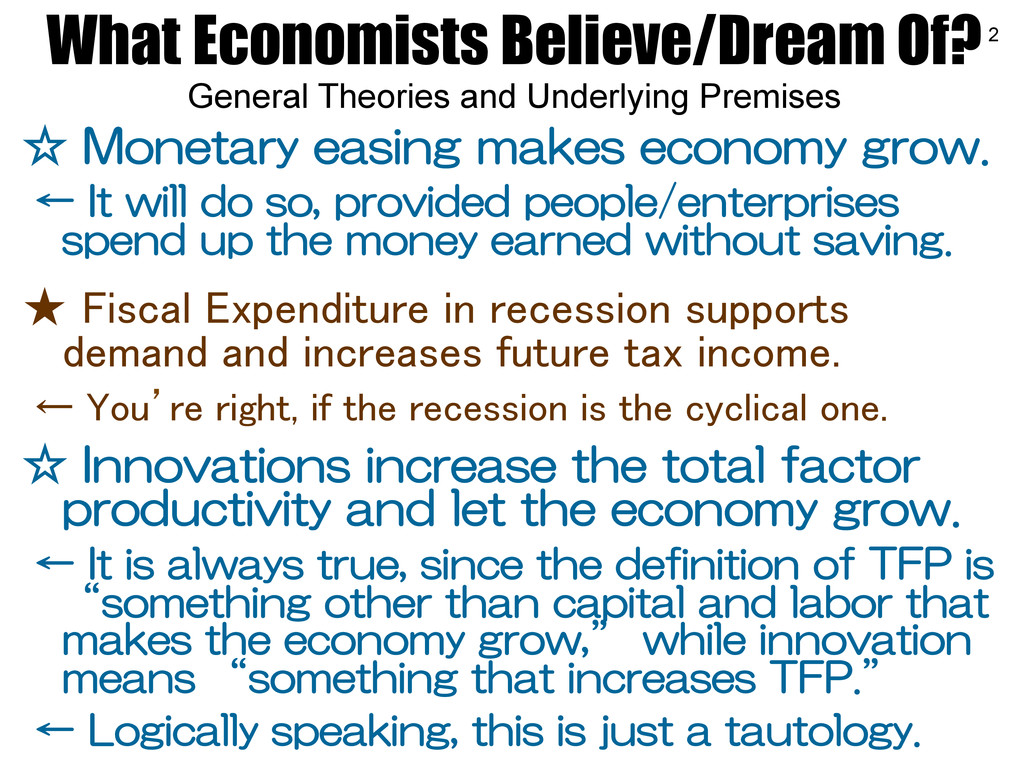
do so, provided people/enterprises spend up the money earned without saving. ★ Fiscal Expenditure in recession supports demand and increases future tax income. ← You’re right, if the recession is the cyclical one. ☆ Innovations increase the total factor productivity and let the economy grow. ← It is always true, since the definition of TFP is “something other than capital and labor that makes the economy grow,” while innovation means “something that increases TFP.” ← Logically speaking, this is just a tautology. What Economists Believe/Dream Of? General Theories and Underlying Premises
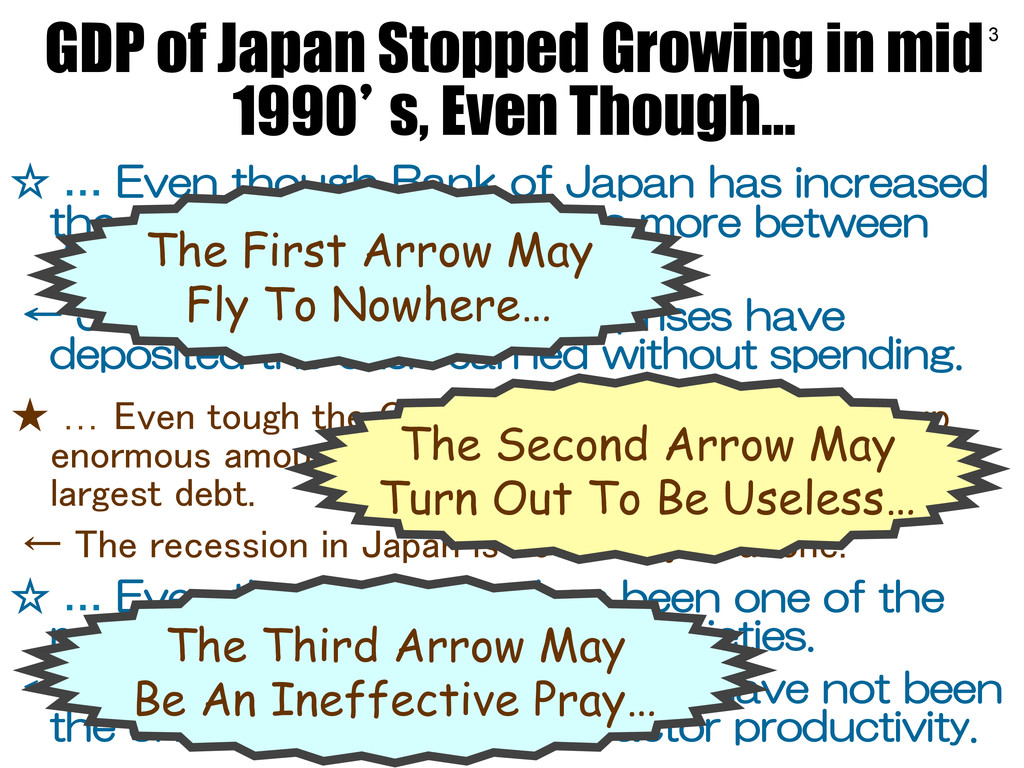
the monetary base 2.5 times more between 1995 and 2005. ← Japanese riches and enterprises have deposited the cash earned without spending. ★ … Even tough the Government has been spending up enormous amount of money until it owes the world’s largest debt. ← The recession in Japan is not the cyclical one. ☆ … Even though Japan has been one of the most aggressively innovative societies. ← Innovations occurred in Japan have not been the one that increase total factor productivity. GDP of Japan Stopped Growing in mid 1990’s, Even Though… The First Arrow May Fly To Nowhere… The Second Arrow May Turn Out To Be Useless… The Third Arrow May Be An Ineffective Pray…
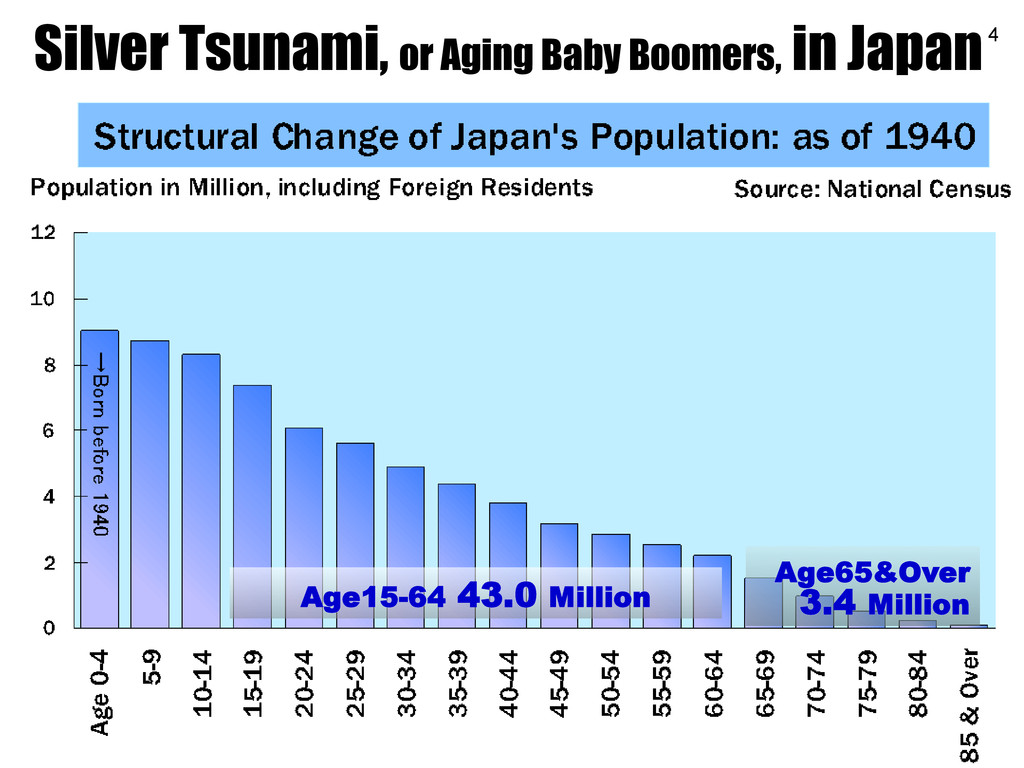
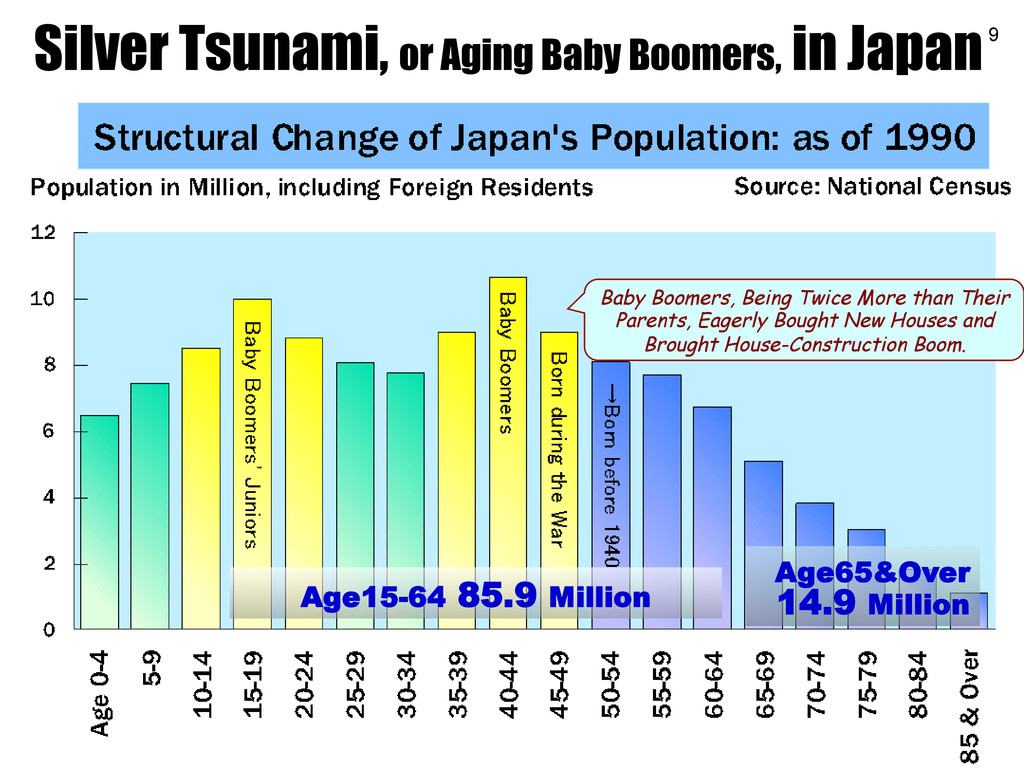
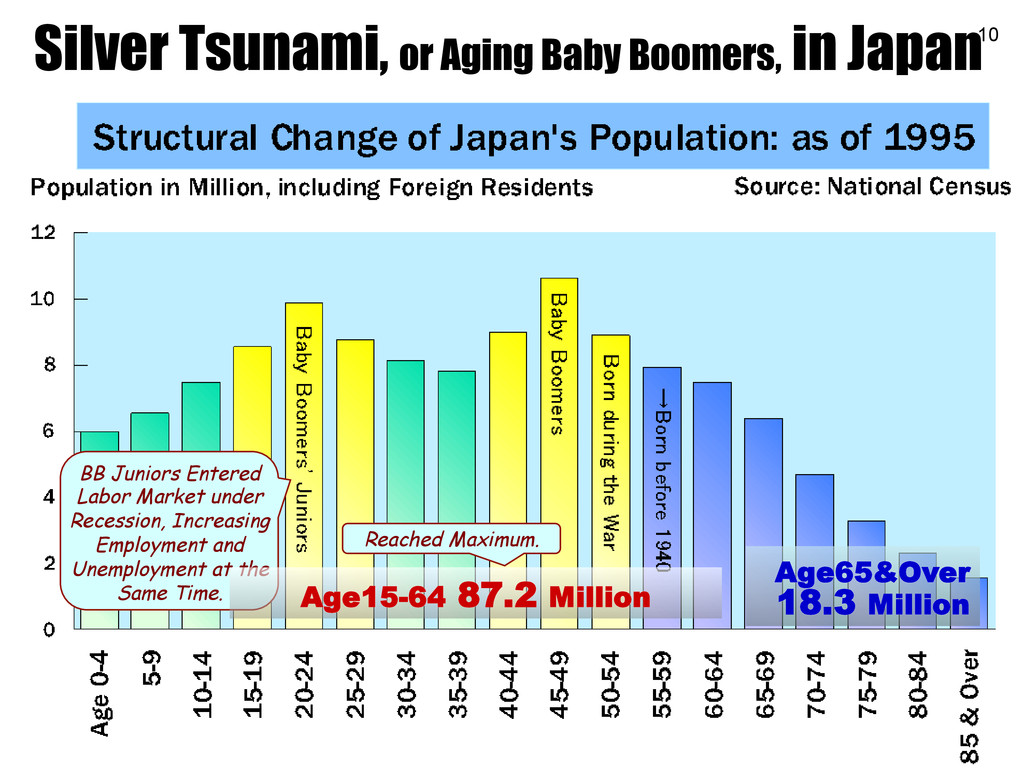
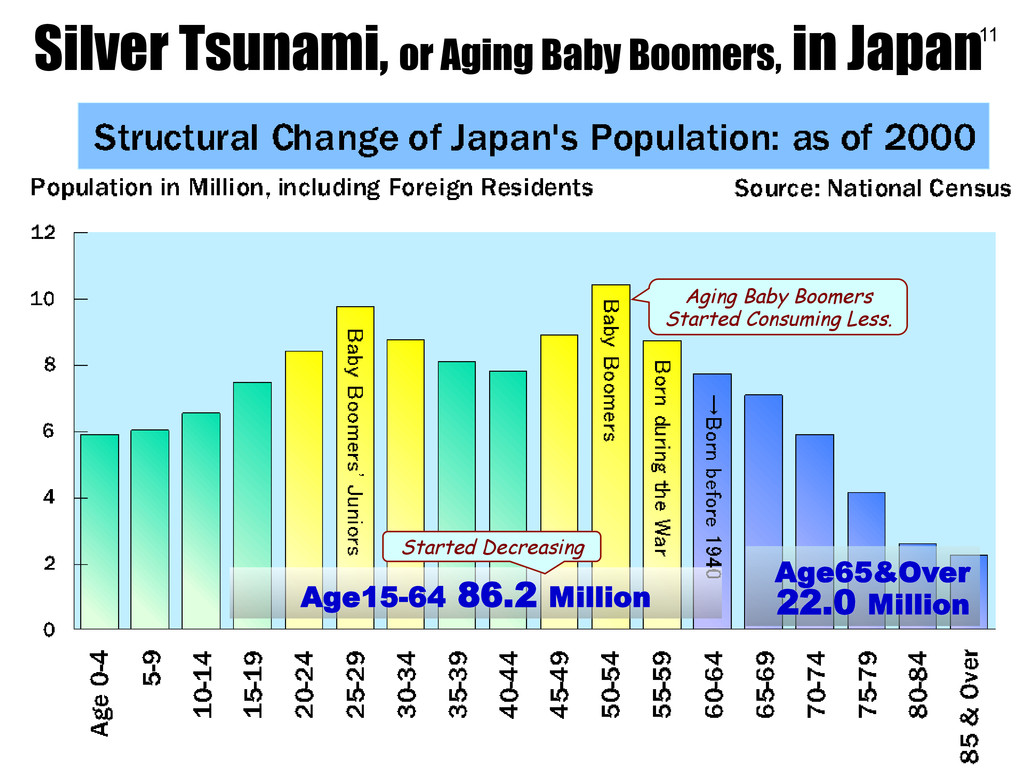
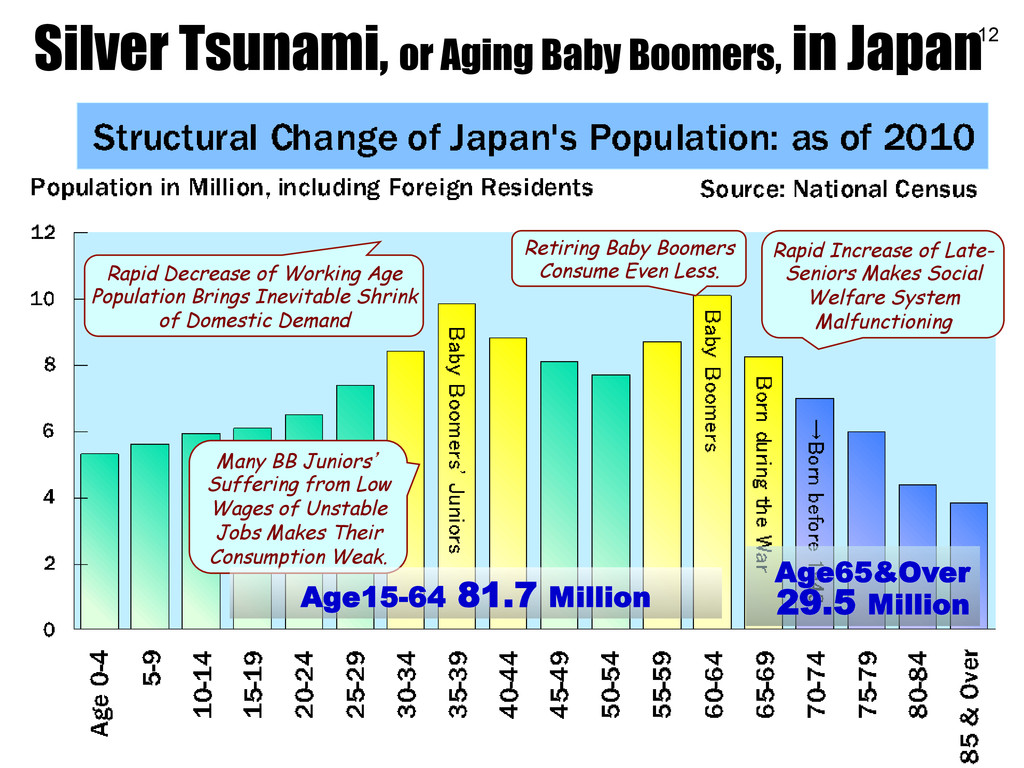
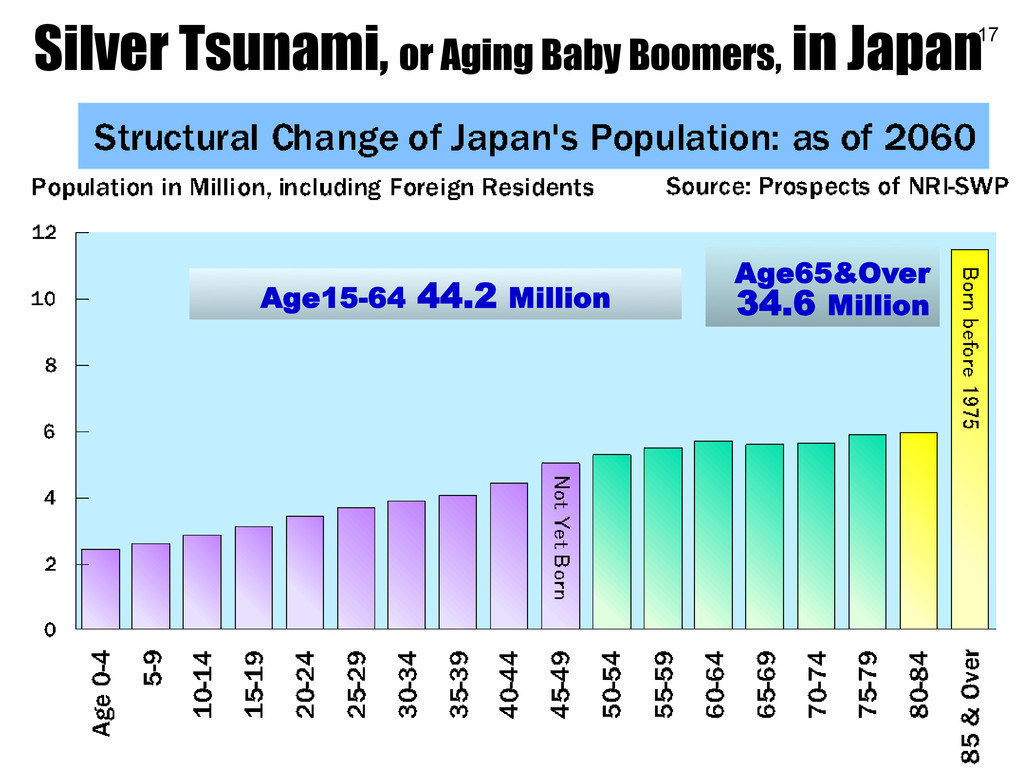
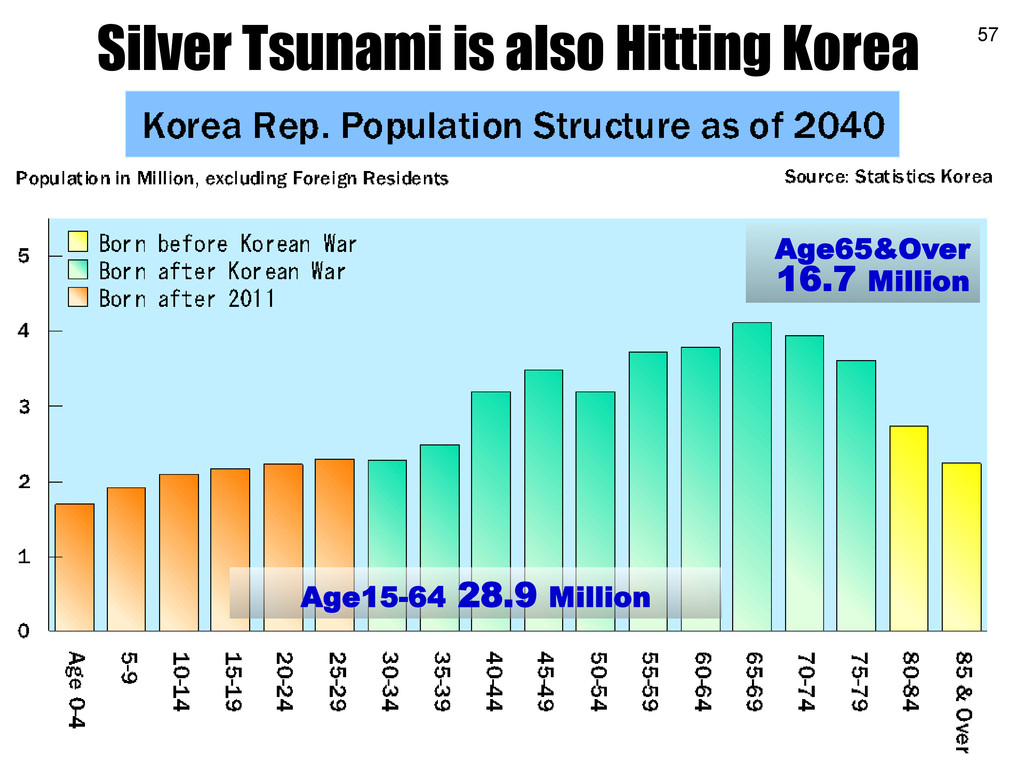
Malfunctioning Retiring Baby Boomers Consume Even Less. Rapid Decrease of Working Age Population Brings Inevitable Shrink of Domestic Demand Many BB Juniors’ Suffering from Low Wages of Unstable Jobs Makes Their Consumption Weak. Age15-64 81.7 Million Age65&Over 29.5 Million Silver Tsunami, or Aging Baby Boomers, in Japan
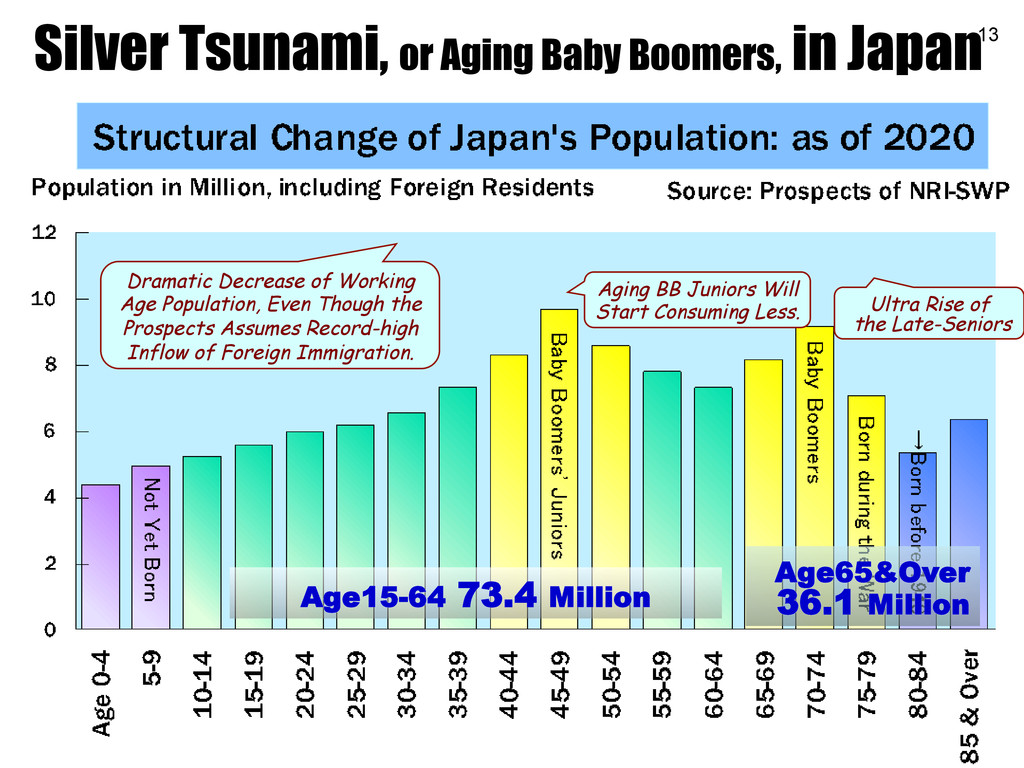
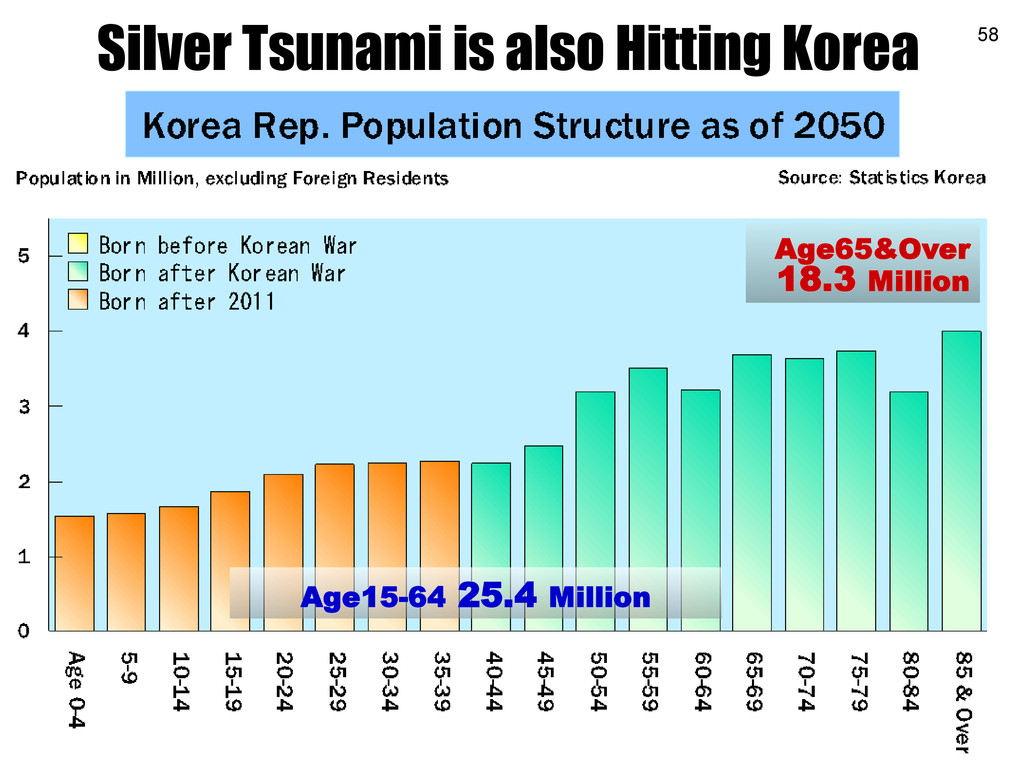
Prospects Assumes Record-high Inflow of Foreign Immigration. Aging BB Juniors Will Start Consuming Less. Ultra Rise of the Late-Seniors Age15-64 73.4 Million Age65&Over 36.1 Million Silver Tsunami, or Aging Baby Boomers, in Japan
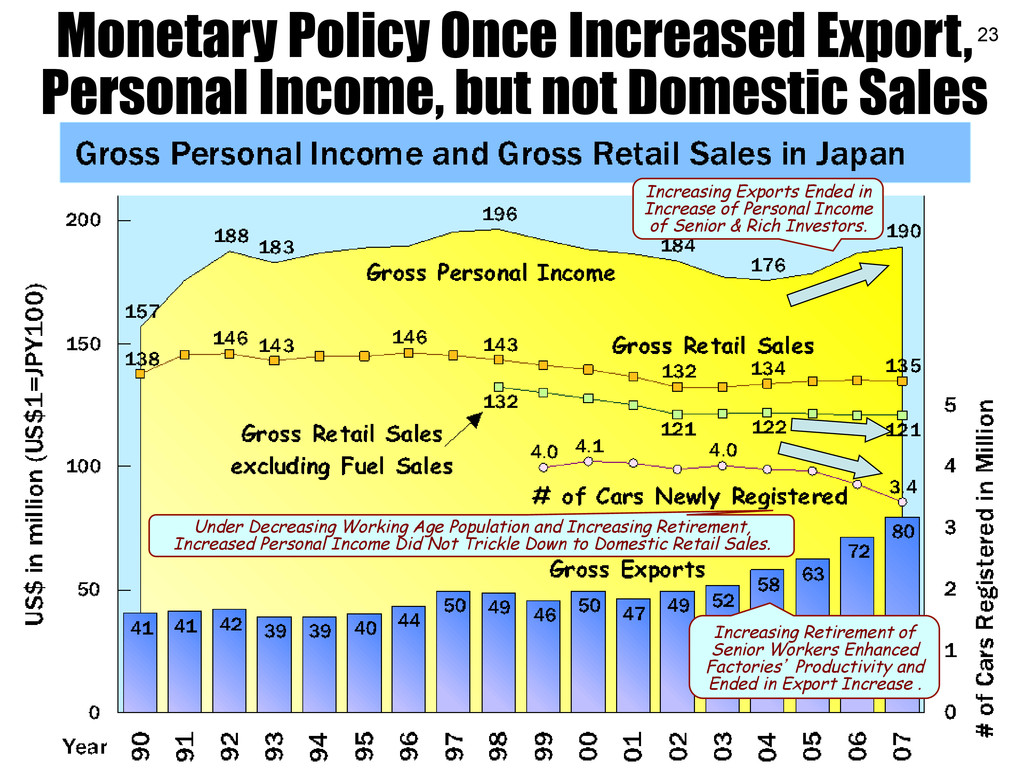
Senior & Rich Investors. Increasing Retirement of Senior Workers Enhanced Factories’ Productivity and Ended in Export Increase . Under Decreasing Working Age Population and Increasing Retirement, Increased Personal Income Did Not Trickle Down to Domestic Retail Sales. Monetary Policy Once Increased Export, Personal Income, but not Domestic Sales
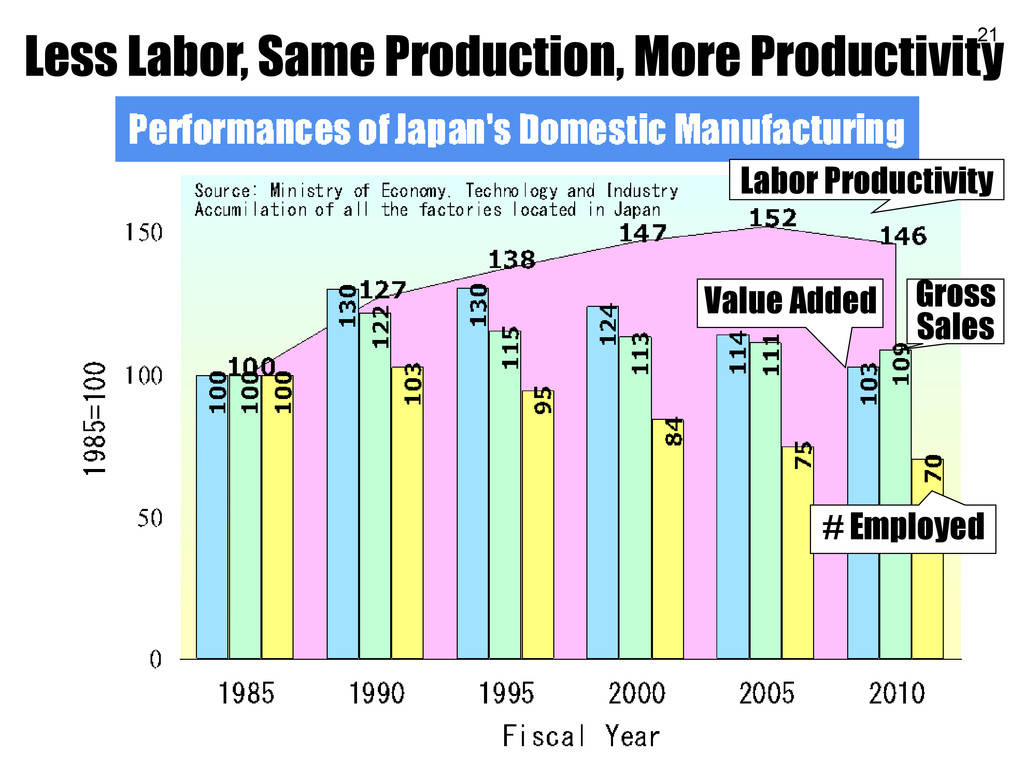
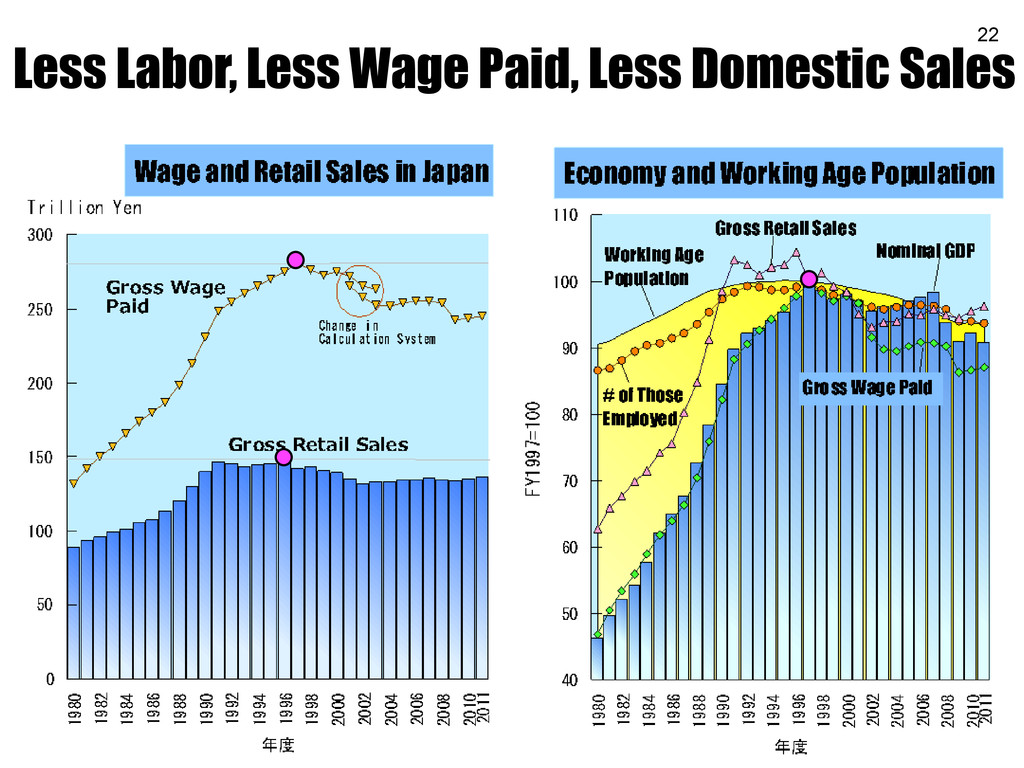
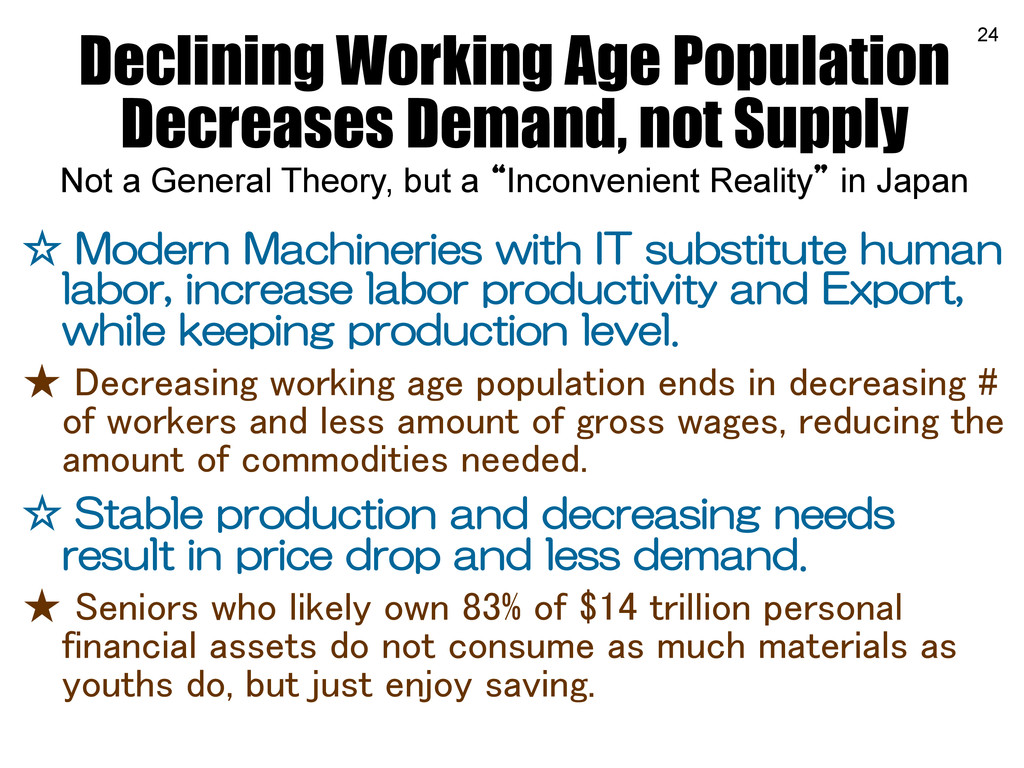
increase labor productivity and Export, while keeping production level. ★ Decreasing working age population ends in decreasing # of workers and less amount of gross wages, reducing the amount of commodities needed. ☆ Stable production and decreasing needs result in price drop and less demand. ★ Seniors who likely own 83% of $14 trillion personal financial assets do not consume as much materials as youths do, but just enjoy saving. Declining Working Age Population Decreases Demand, not Supply Not a General Theory, but a “Inconvenient Reality” in Japan
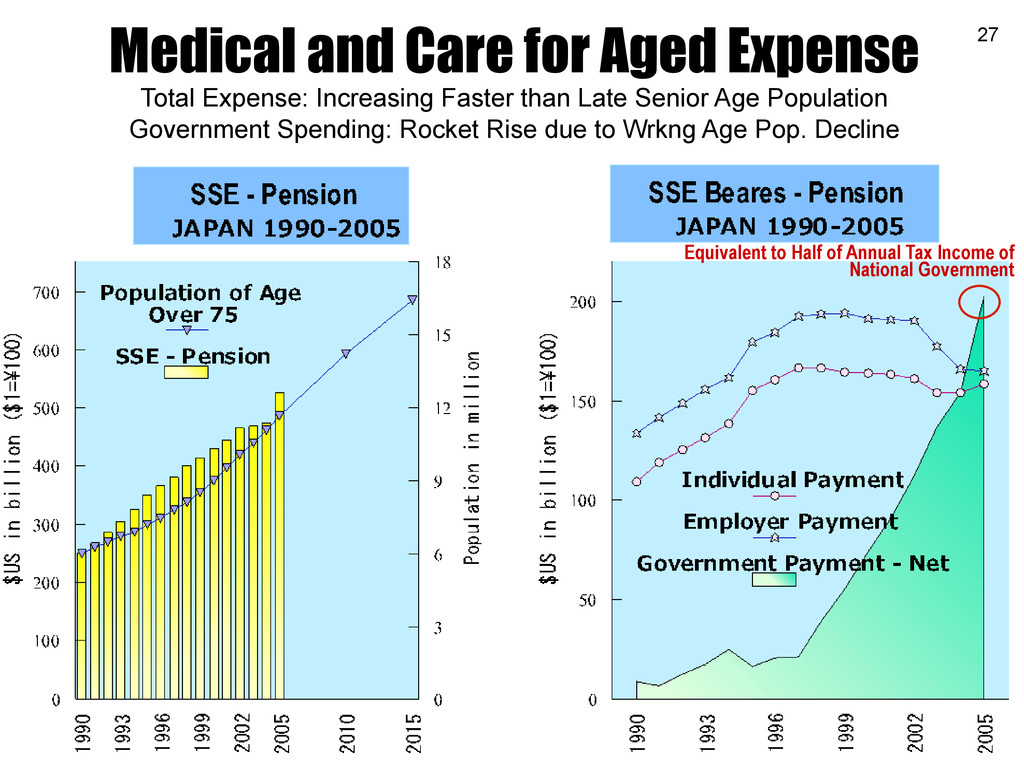
Faster than Late Senior Age Population Government Spending: Rocket Rise due to Wrkng Age Pop. Decline Equivalent to Half of Annual Tax Income of National Government
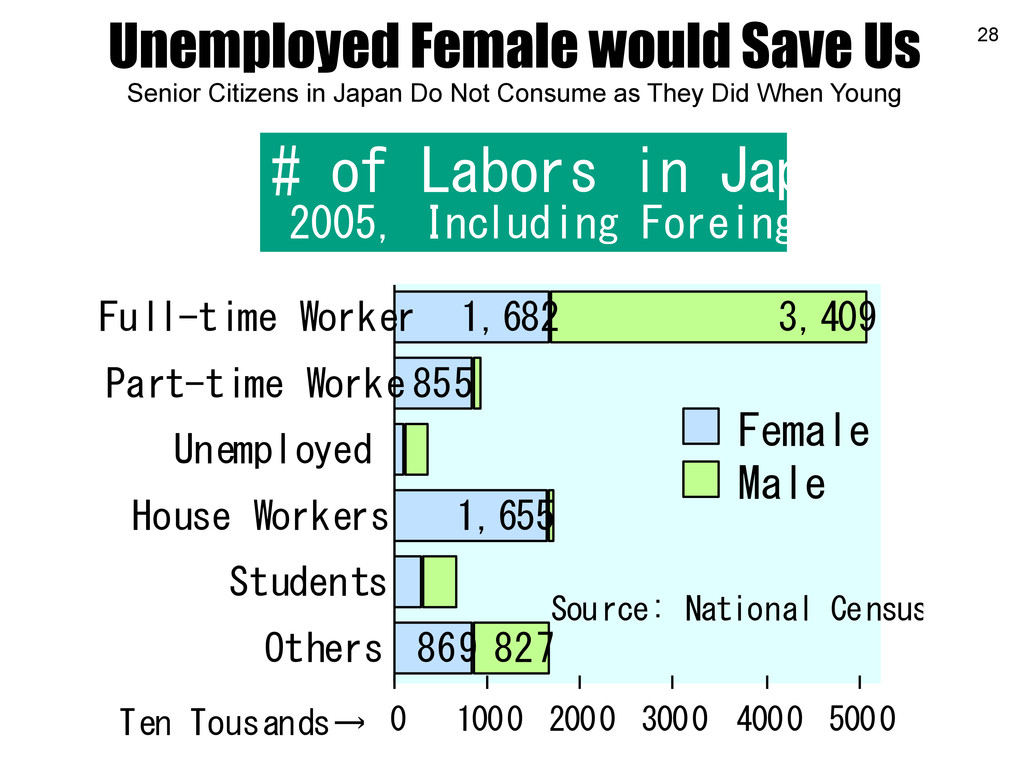
Do Not Consume as They Did When Young 3,409 827 1,682 855 1,655 869 Full-time Worker Part-time Worke Unemployed House Workers Students Others 0 1000 2000 3000 4000 5000 Female Male Source: National Census # of Labors in Japan 2005, Including Foreingers Ten Tousands→
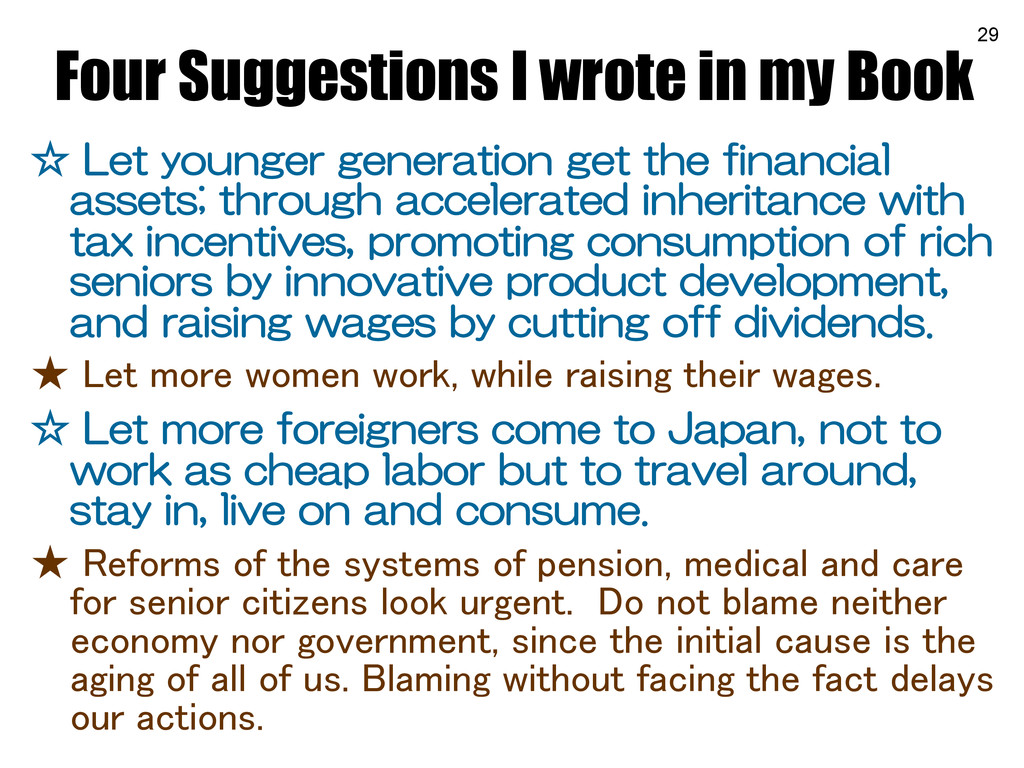
through accelerated inheritance with tax incentives, promoting consumption of rich seniors by innovative product development, and raising wages by cutting off dividends. ★ Let more women work, while raising their wages. ☆ Let more foreigners come to Japan, not to work as cheap labor but to travel around, stay in, live on and consume. ★ Reforms of the systems of pension, medical and care for senior citizens look urgent. Do not blame neither economy nor government, since the initial cause is the aging of all of us. Blaming without facing the fact delays our actions. Four Suggestions I wrote in my Book
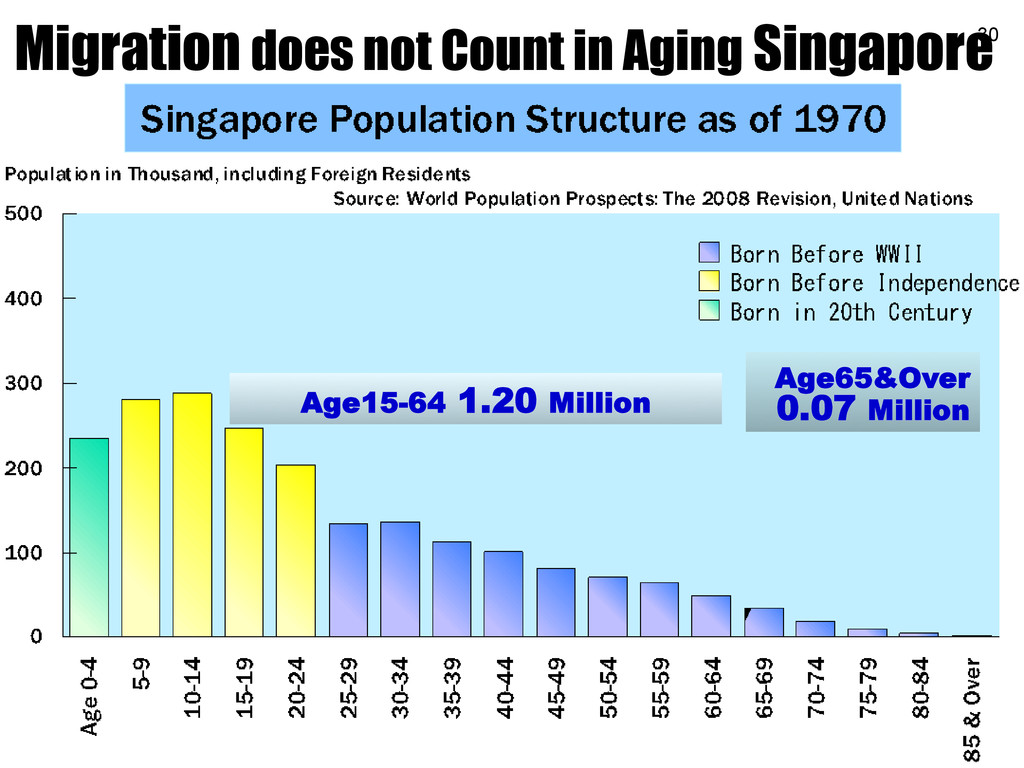
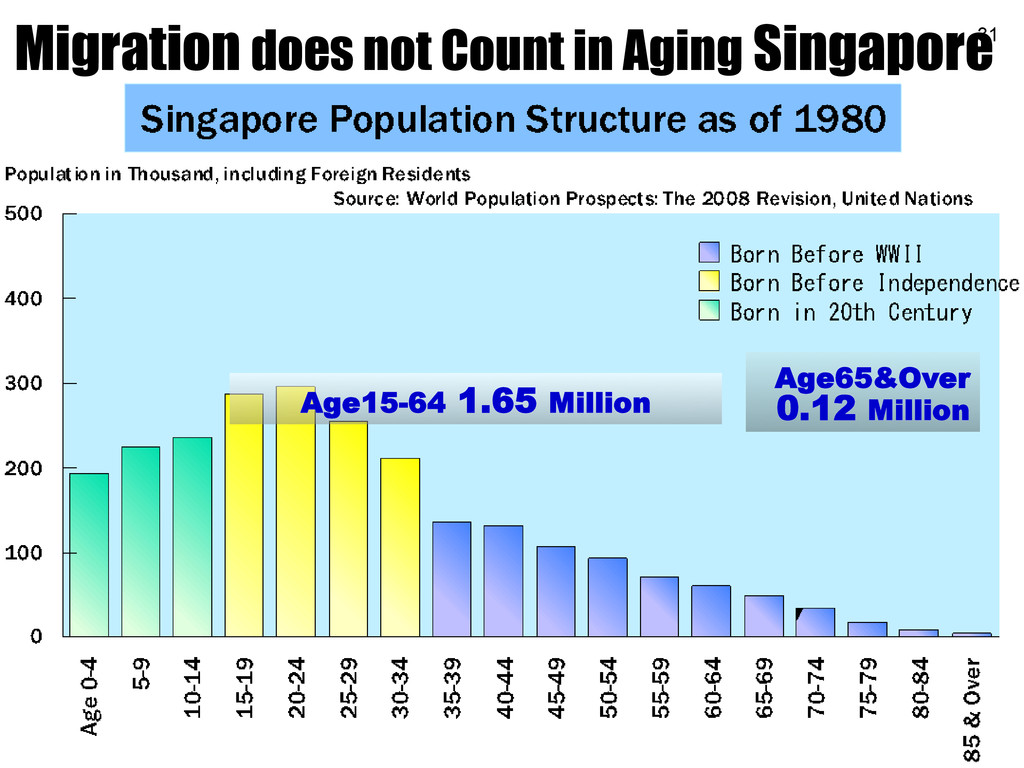
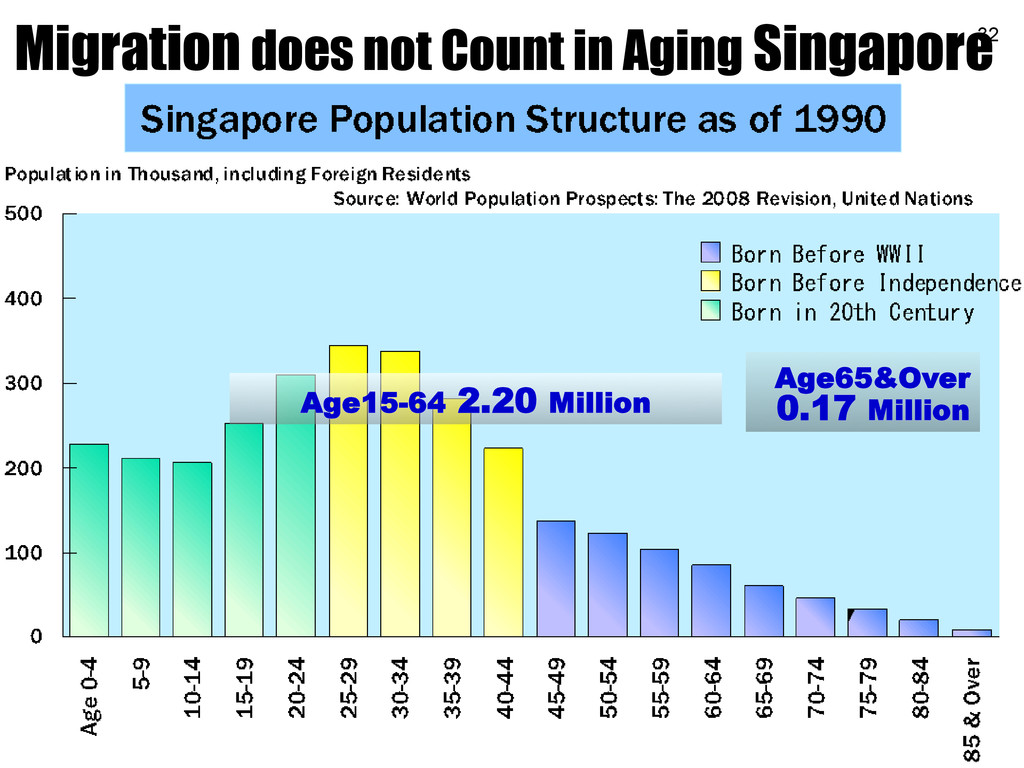
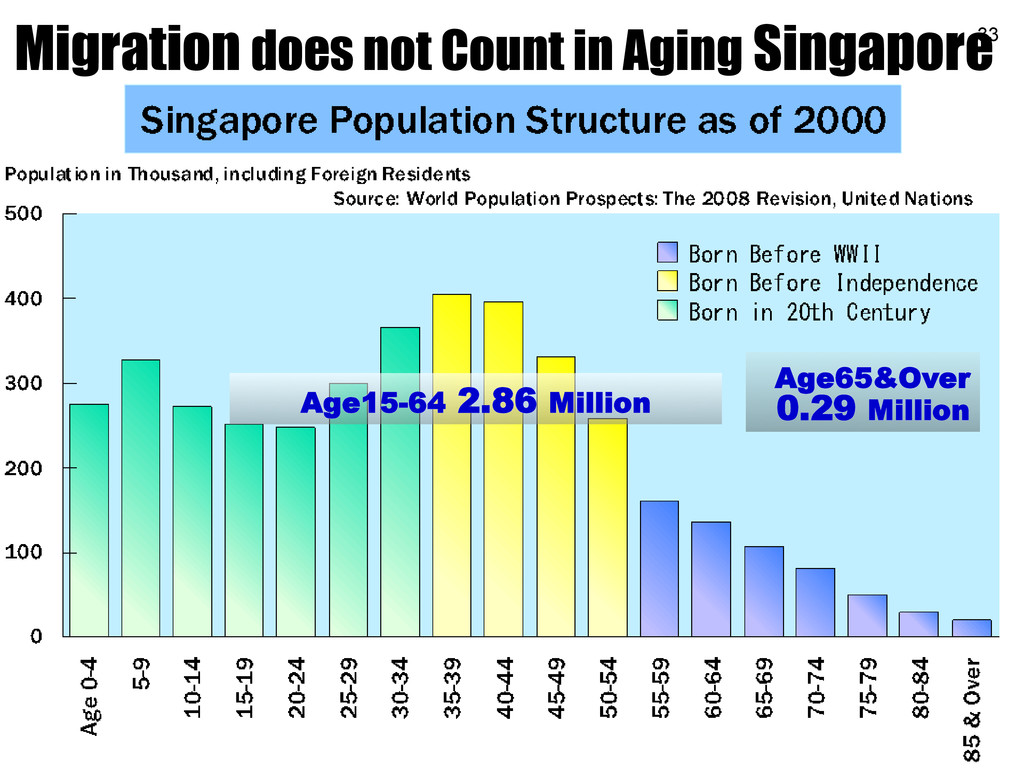
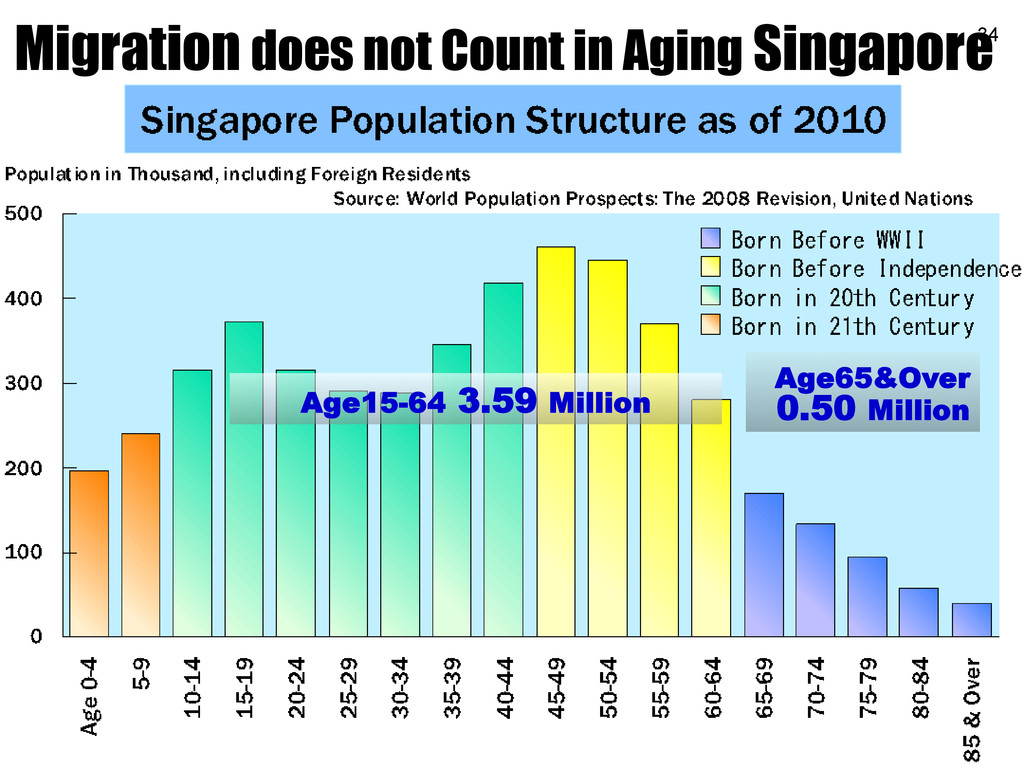
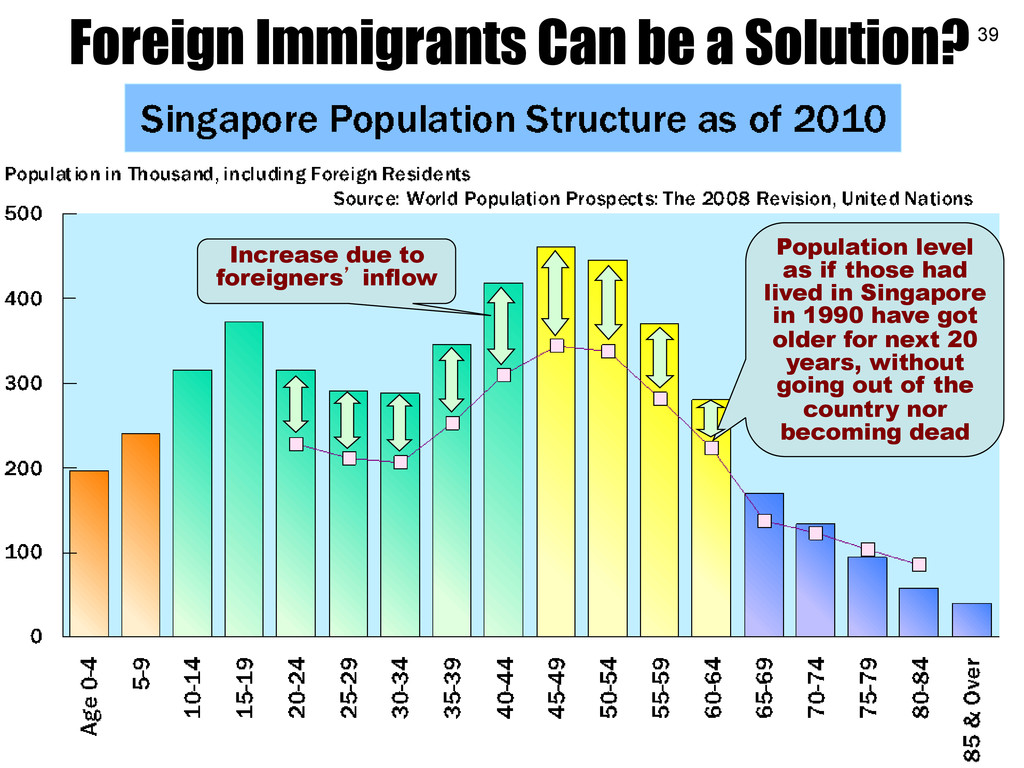
if those had lived in Singapore in 1990 have got older for next 20 years, without going out of the country nor becoming dead Increase due to foreigners’ inflow
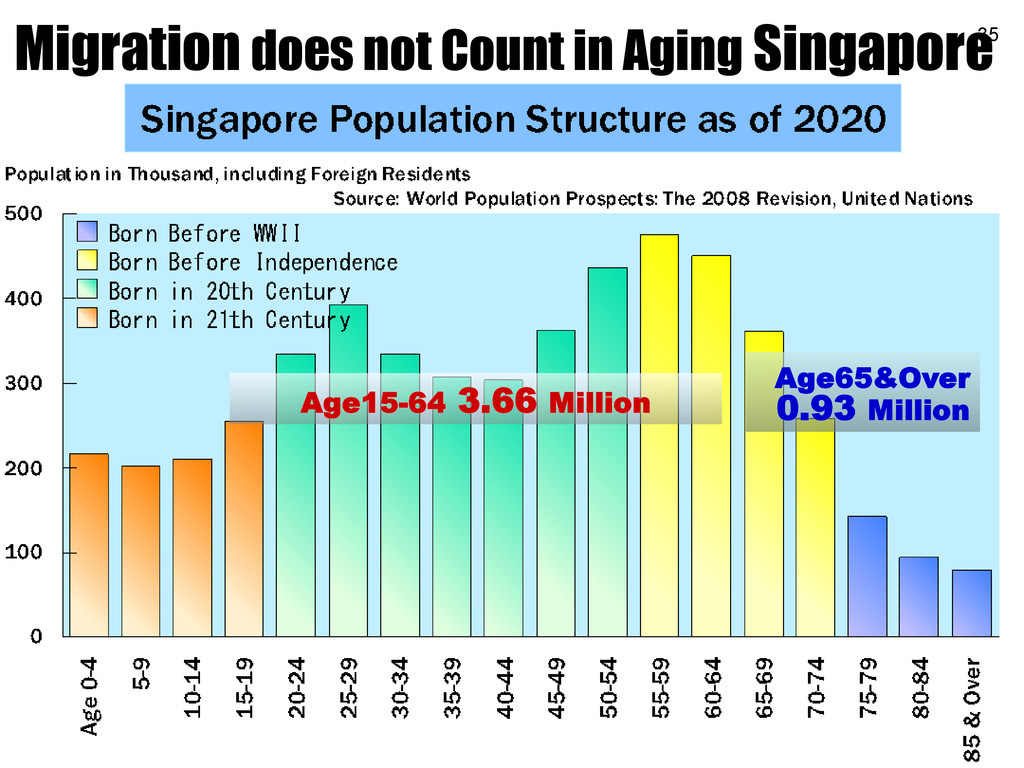
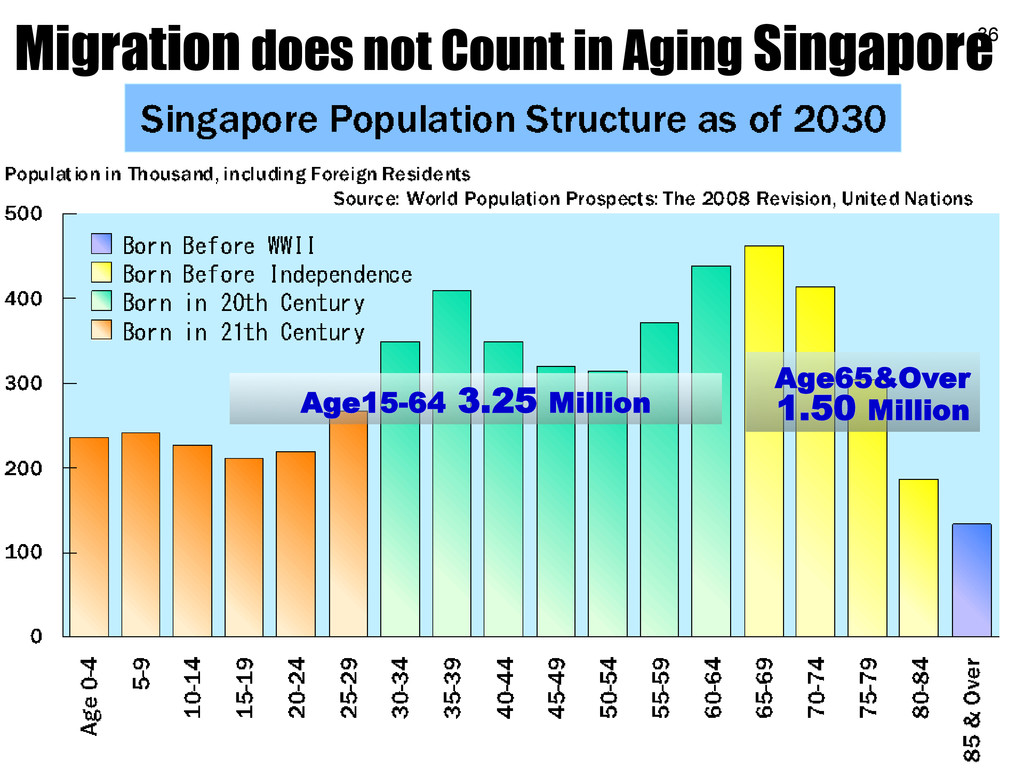
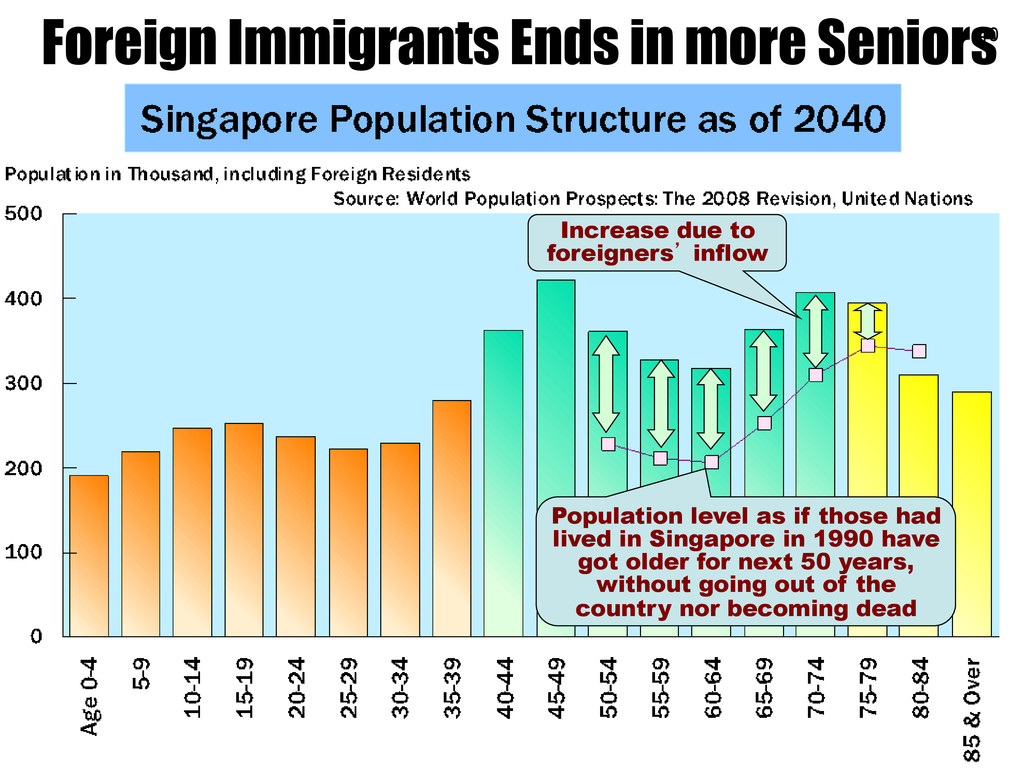
more Seniors Population level as if those had lived in Singapore in 1990 have got older for next 50 years, without going out of the country nor becoming dead
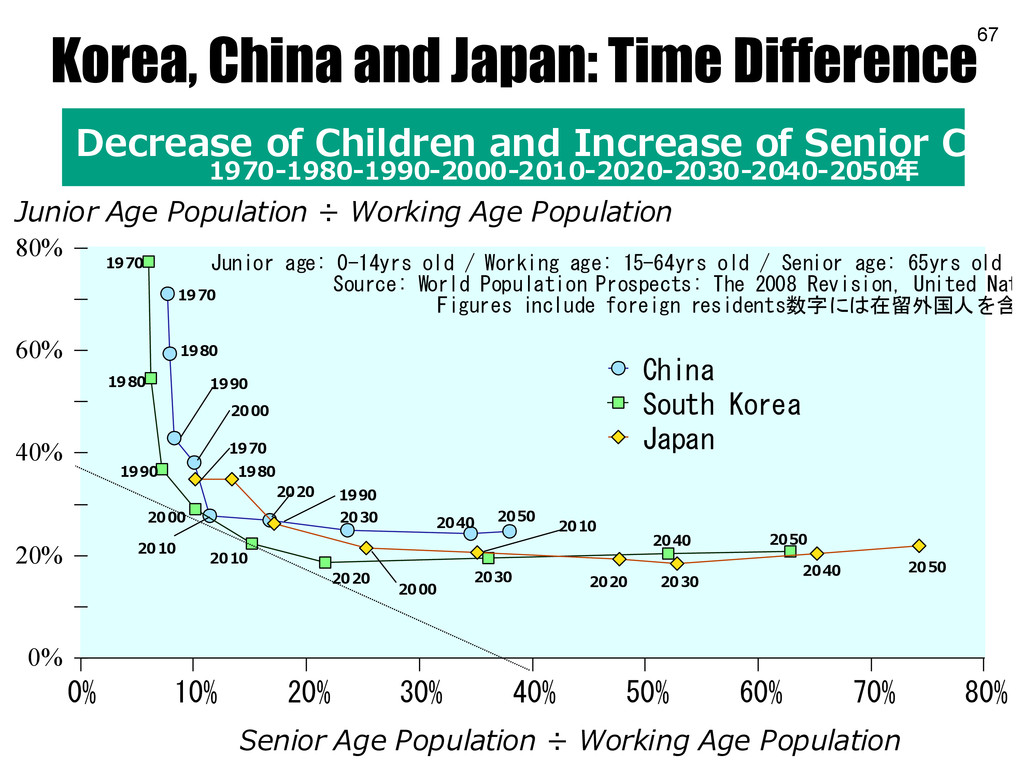
Senior Age Population ÷ Working Age Population 0% 20% 40% 60% 80% Junior Age Population ÷ Working Age Population China South Korea Japan Junior age: 0-14yrs old / Working age: 15-64yrs old / Senior age: 65yrs old an Source: World Population Prospects: The 2008 Revision, United Nati Figures include foreign residents数字には在留外国人を含む Decrease of Children and Increase of Senior Citiz 1970-‐‑‒1980-‐‑‒1990-‐‑‒2000-‐‑‒2010-‐‑‒2020-‐‑‒2030-‐‑‒2040-‐‑‒2050年年 1970 1980 1980 1970 1990 2000 2000 1990 2010 2020 2020 2050 2040 2050 1970 1980 1990 2000 2030 2050 2040 2030 2020 2010 2040 2030 2010 Korea, China and Japan: Time Difference
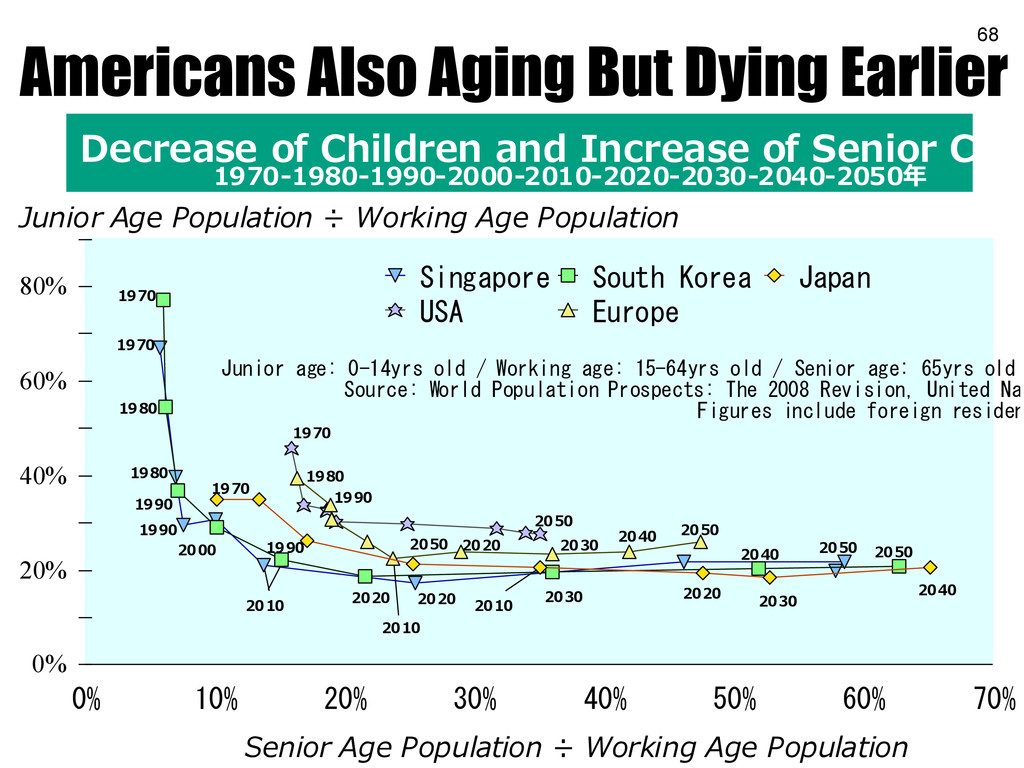
30% 40% 50% 60% 70% Senior Age Population ÷ Working Age Population 0% 20% 40% 60% 80% Junior Age Population ÷ Working Age Population Singapore USA South Korea Europe Japan Junior age: 0-14yrs old / Working age: 15-64yrs old / Senior age: 65yrs old Source: World Population Prospects: The 2008 Revision, United Nat Figures include foreign residen Decrease of Children and Increase of Senior Citiz 1970-‐‑‒1980-‐‑‒1990-‐‑‒2000-‐‑‒2010-‐‑‒2020-‐‑‒2030-‐‑‒2040-‐‑‒2050年年 2040 2030 2020 2050 2040 2030 2020 2010 2000 1990 1980 1970 2050 2050 2050 1970 1980 1990 1970 2010 2040 2030 2020 1980 1990 2010 1990 1970 2050 2020