Upgrade to Pro
— share decks privately, control downloads, hide ads and more …
Speaker Deck
Features
Speaker Deck
PRO
Sign in
Sign up for free
Search
Search
Profiling
Search
Jasdev Singh
February 21, 2016
Technology
82
0
Share
Embed
Copy iframe code
Copy JS code
Copy link
Start on current slide
Profiling
Chapter review from objc.io's Core Data book at Tumblr's iOS Book Club
Jasdev Singh
February 21, 2016
More Decks by Jasdev Singh
See All by Jasdev Singh
Tuning for Speed
jasdev
0
93
Hidden Gems in Swift
jasdev
6
1.4k
Tranformations - Core Animation
jasdev
0
110
Swift 2.2 & 3.0 Changes
jasdev
1
720
Accessing Data
jasdev
0
100
Lessons in Building APIs
jasdev
0
130
UVA ACM Interview Tips
jasdev
0
120
Other Decks in Technology
See All in Technology
変更し続けられるシステムをどう保つか — AI時代のSSoTという設計原則
kawauso
0
190
AI Coding Agent時代のcdk-nagガードレール 〜組織ルールを強制CIで守り抜く設計の挑戦〜
mhrtech
3
430
個人開発で育てる「大規模設計の苗床」 - AI時代の1人開発から始める業務への知識接続 / The Seedbed for Large-Scale Design - From AI-Era Solo Projects to Professional Knowledge
bitkey
PRO
1
280
誤解だらけの開発生産性 / Myths and Misconceptions about Developer Productivity
i35_267
2
820
企業でAWS Organizationsを動かすための組織設計の考え方
nrinetcom
PRO
1
110
SREとQA 二人三脚で進めるSLO運用/sre-qa-slo
sugitak
0
980
[2026-07-15] AI Ready なはずだったアーキテクチャと、見えてきた課題・次に目指す状態
wxyzzz
9
4k
Webアプリ認証の全体像 / The Big Picture of Web App Authentication
kitano_yuichi
0
180
Terraform共通モジュールをチーム横断で“変えられる”運用へ ― リリースと適用の分離
kekke_n
1
3.4k
シンガポールで登壇してきます
yama3133
0
250
CDKで書くECSのベストプラクティス、 改めて考え直す2026 #cdkconf2026
makies
3
830
壊して学ぶAWS CDK: そのcdk deployで消えるもの、残るもの
k_adachi_01
1
420
Featured
See All Featured
Imperfection Machines: The Place of Print at Facebook
scottboms
270
14k
The Hidden Cost of Media on the Web [PixelPalooza 2025]
tammyeverts
2
350
Pawsitive SEO: Lessons from My Dog (and Many Mistakes) on Thriving as a Consultant in the Age of AI
davidcarrasco
0
190
Evolving SEO for Evolving Search Engines
ryanjones
0
240
Color Theory Basics | Prateek | Gurzu
gurzu
0
390
Test your architecture with Archunit
thirion
1
2.3k
Embracing the Ebb and Flow
colly
88
5.1k
Into the Great Unknown - MozCon
thekraken
41
2.6k
From Legacy to Launchpad: Building Startup-Ready Communities
dugsong
0
260
The Power of CSS Pseudo Elements
geoffreycrofte
82
6.4k
HTML-Aware ERB: The Path to Reactive Rendering @ RubyCon 2026, Rimini, Italy
marcoroth
2
340
Self-Hosted WebAssembly Runtime for Runtime-Neutral Checkpoint/Restore in Edge–Cloud Continuum
chikuwait
0
650
Transcript
13 - Profiling Core Data iOS Book Club Jasdev Singh
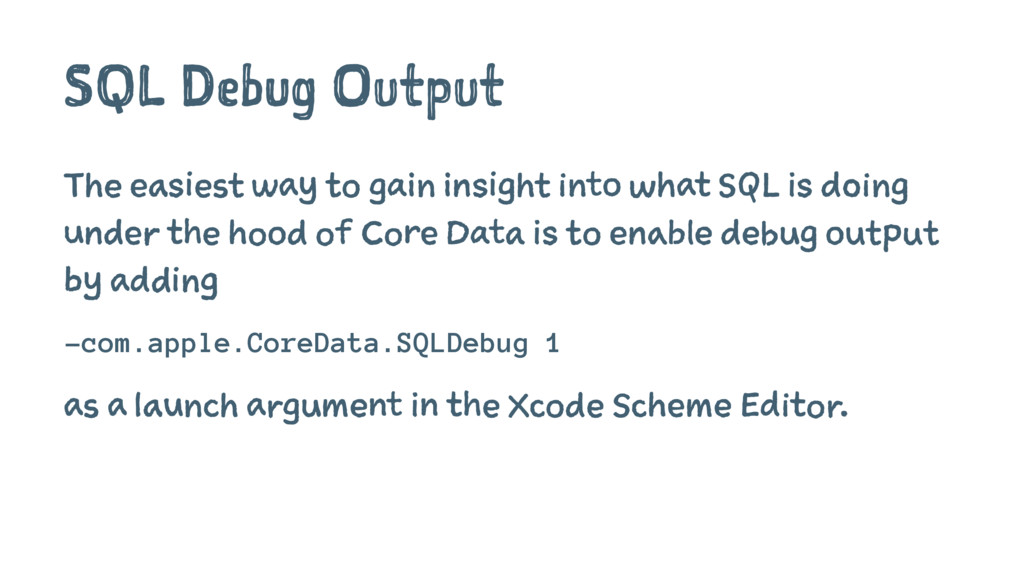
SQL Debug Output The easiest way to gain insight into
what SQL is doing under the hood of Core Data is to enable debug output by adding -com.apple.CoreData.SQLDebug 1 as a launch argument in the Xcode Scheme Editor.
SQL Pro Tip Once you extract underlying queries from SQL,
you can use SQL's EXPLAIN command to get a further breakdown on the execution plan for it.
Core Data Instruments Predefined templates include the Fetches, Saves, Faults,
and Cache Misses instruments
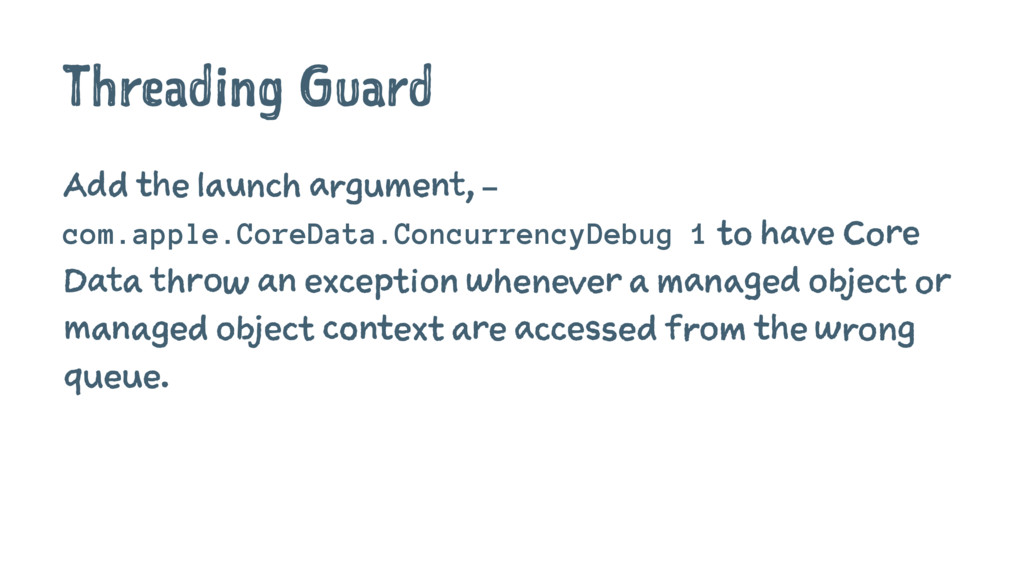
Threading Guard Add the launch argument, - com.apple.CoreData.ConcurrencyDebug 1 to
have Core Data throw an exception whenever a managed object or managed object context are accessed from the wrong queue.
Summary 4 Launch flags to help investigate issues 4 Pair
SQL output with EXPLAIN 4 Core Data instruments are !