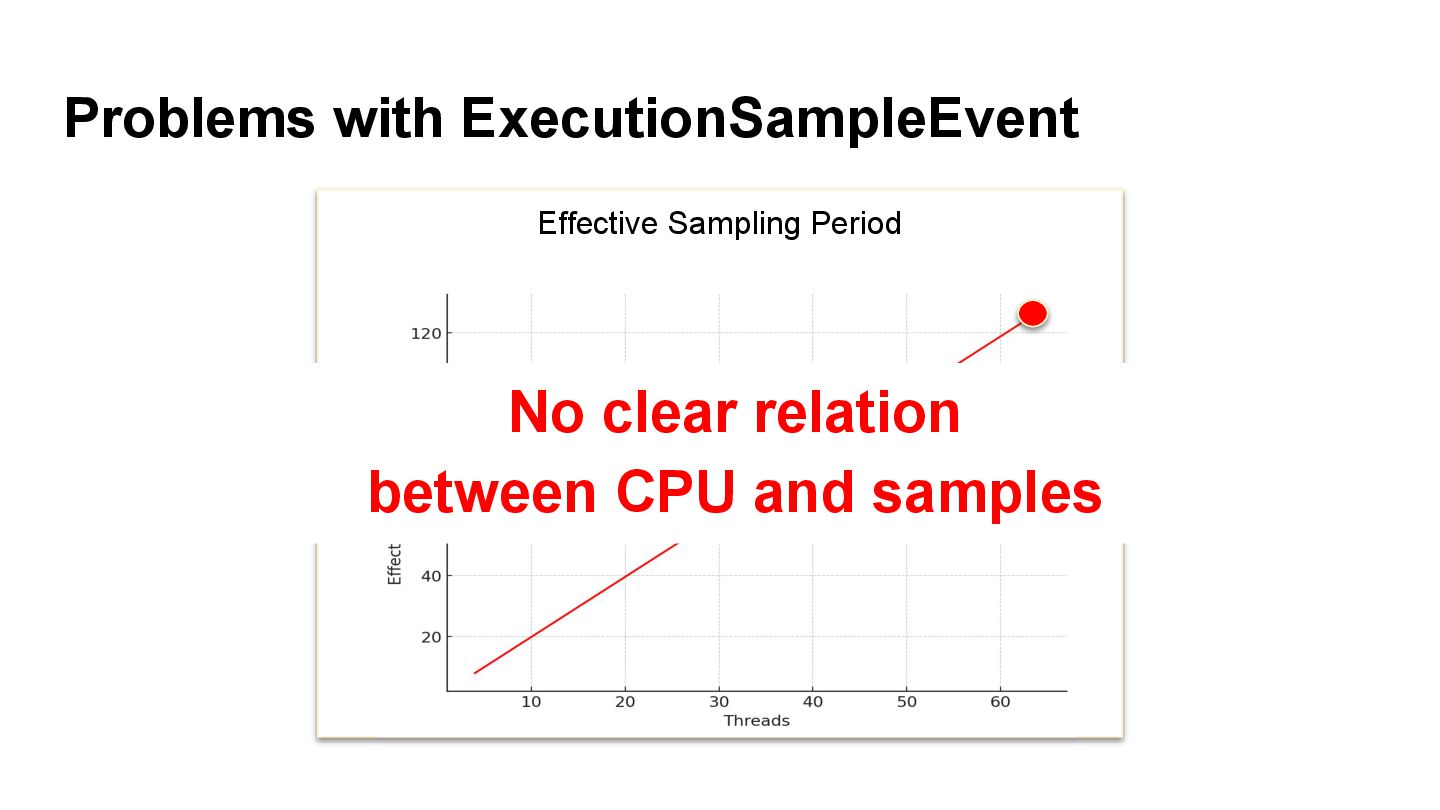
Java developers struggle with the trade-off between precise profiling and application stability. Unofficial methods like AsyncGetCallTrace offer precision but risk crashes, while official APIs such as JVMTI, JMX, and StackWalker are stable but biased due to safepoint polling. Java Flight Recorder (JFR) reduces this bias but introduces interpolation errors. This talk addresses these challenges with three key topics: • Combining precise sampling with JFR’s stability to remove biases without sacrificing reliability. • Using eBPF probes and examining JVM internals for safer, detailed profiling. • Enhancing precision with user-supplied profiling contexts. We will review the history of Java profilers and discuss the future of JVM profiling, with a focus on CPU profiling. Attendees will gain insights into new methods aimed at achieving accurate, stable performance analysis in Java applications, comparing them with async-profiler and existing tools.
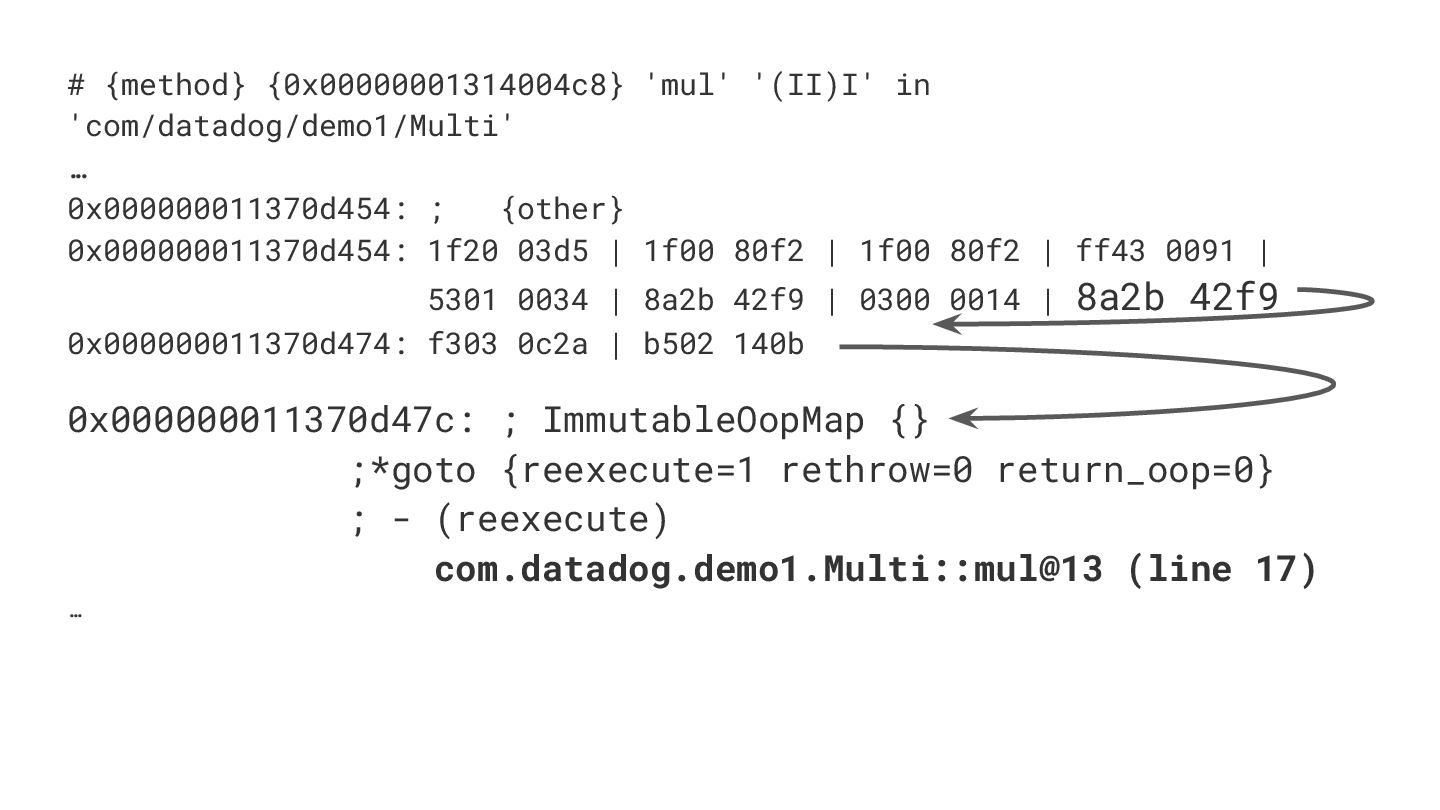
![[1] https://speakerdeck.com/parttimenerd/inner-workings-of-safepoints [2] https://psy-lob-saw.blogspot.com/2015/12/safepoints.html Safepoints, anybody?](https://files.speakerdeck.com/presentations/92c9aec6ec3b48b1a05123ab7dbd12f0/slide_26.jpg)
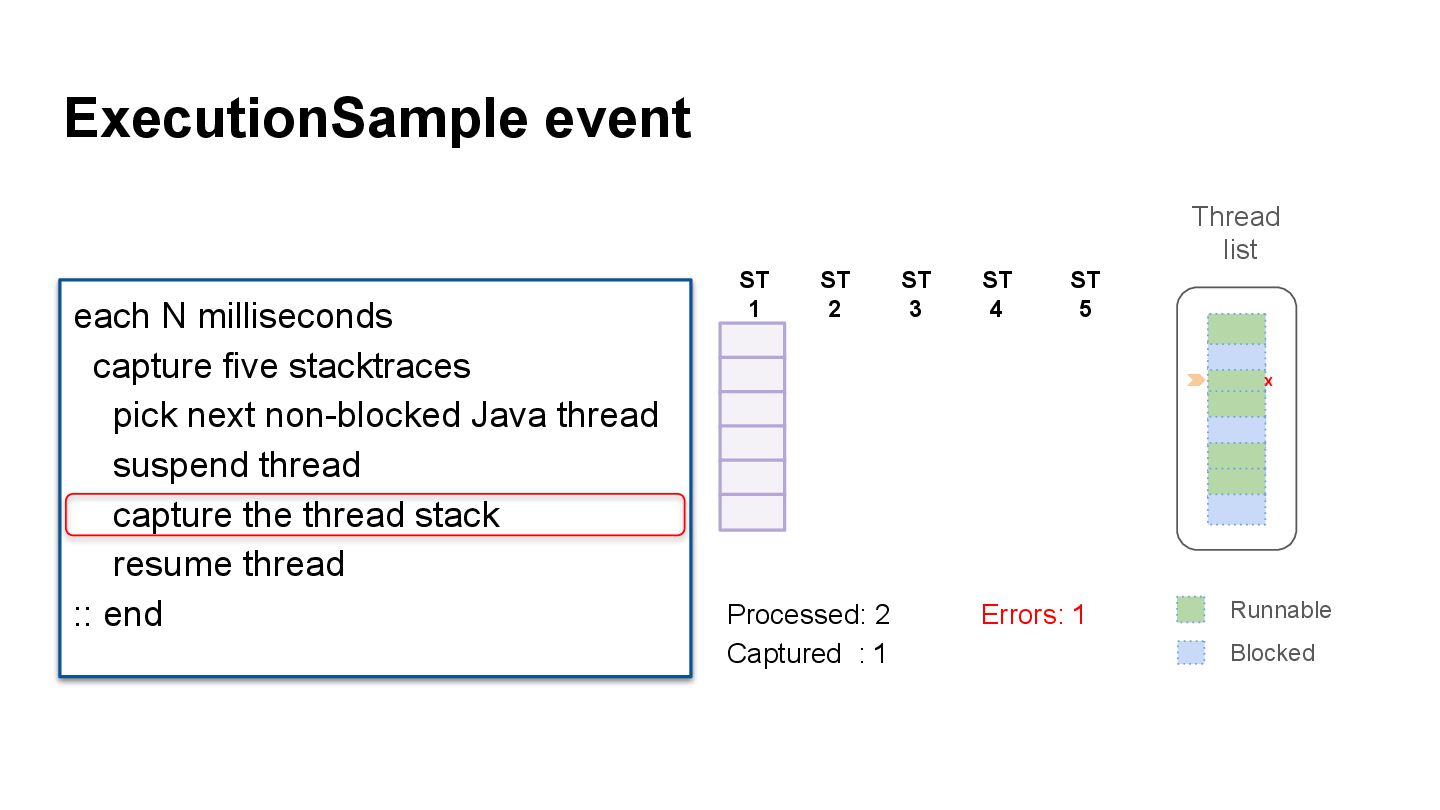
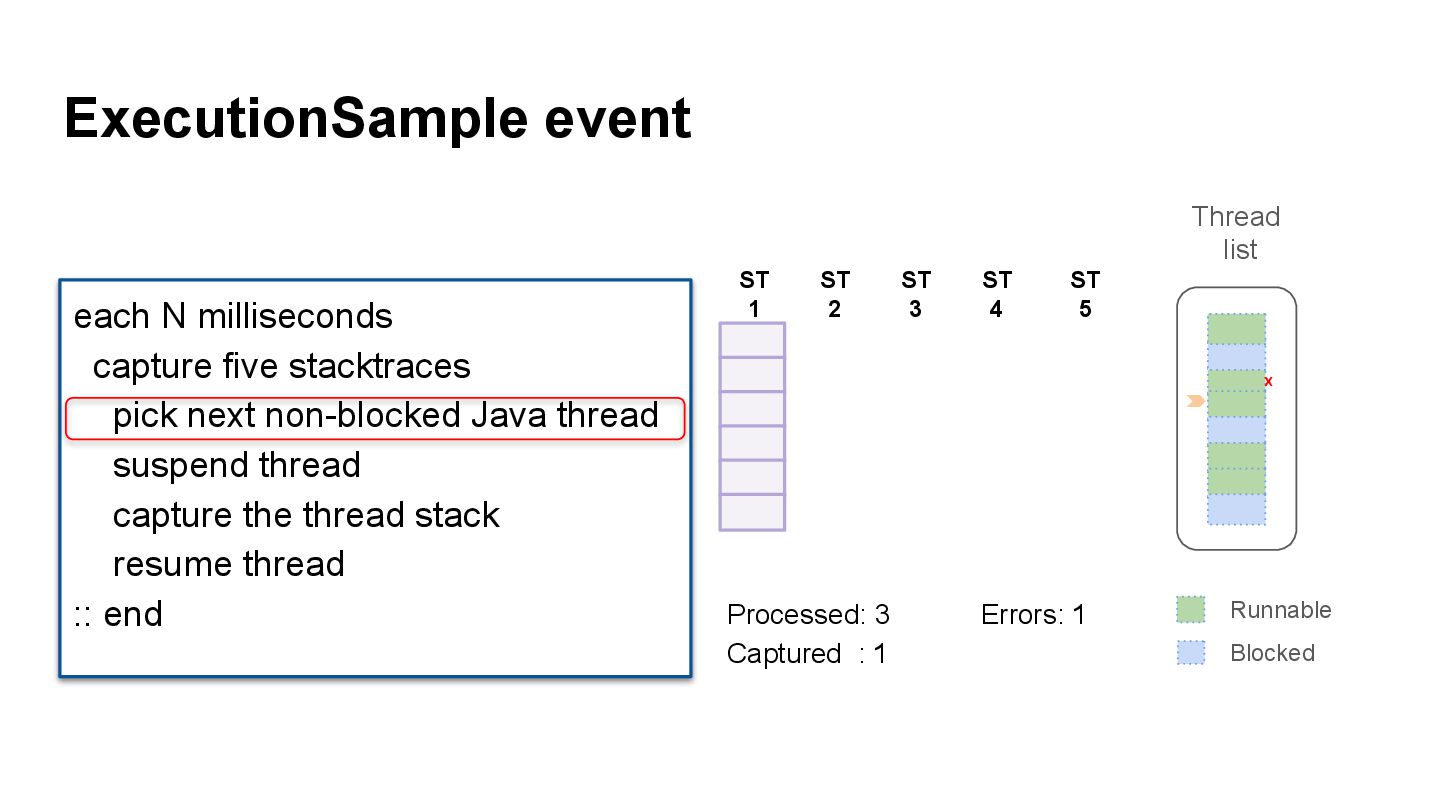
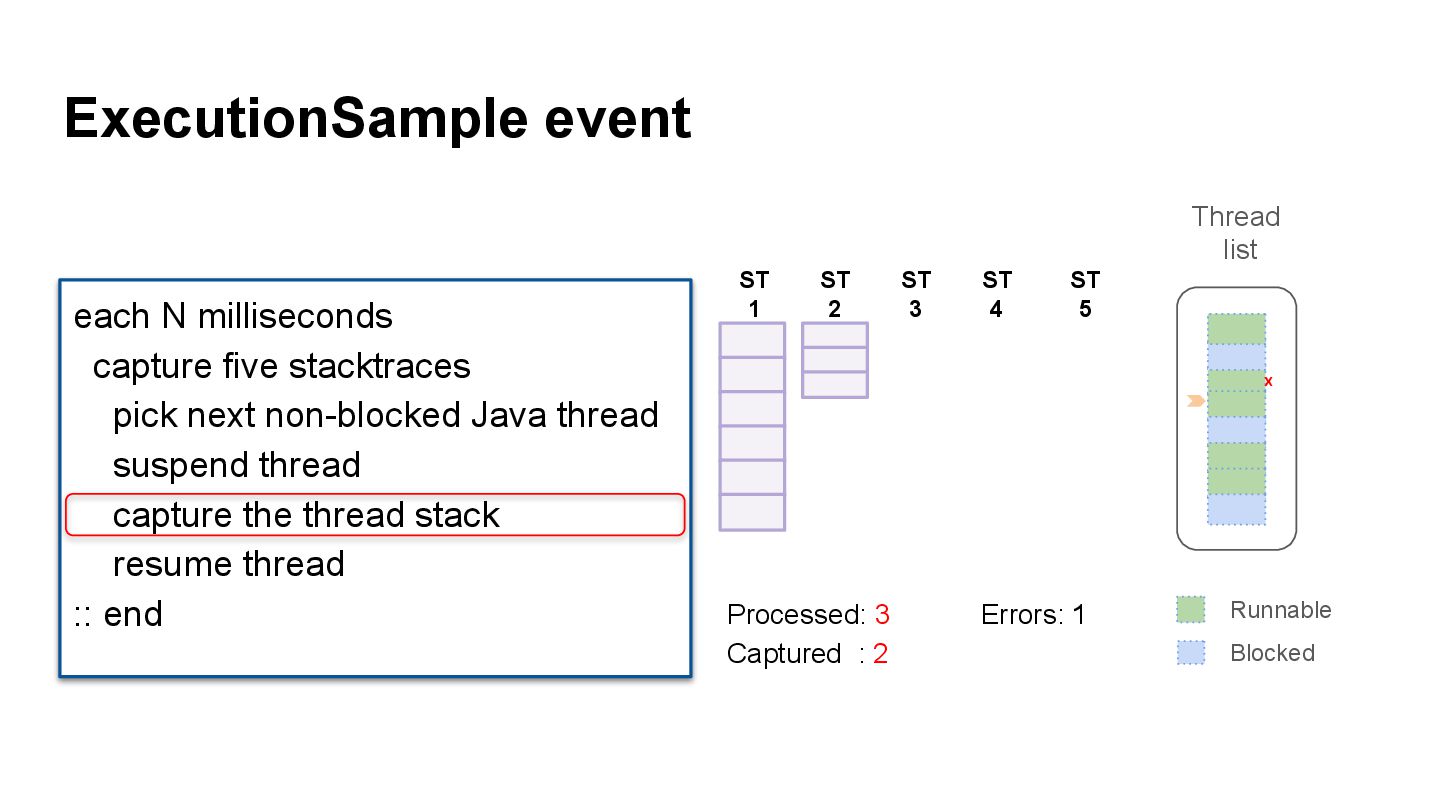
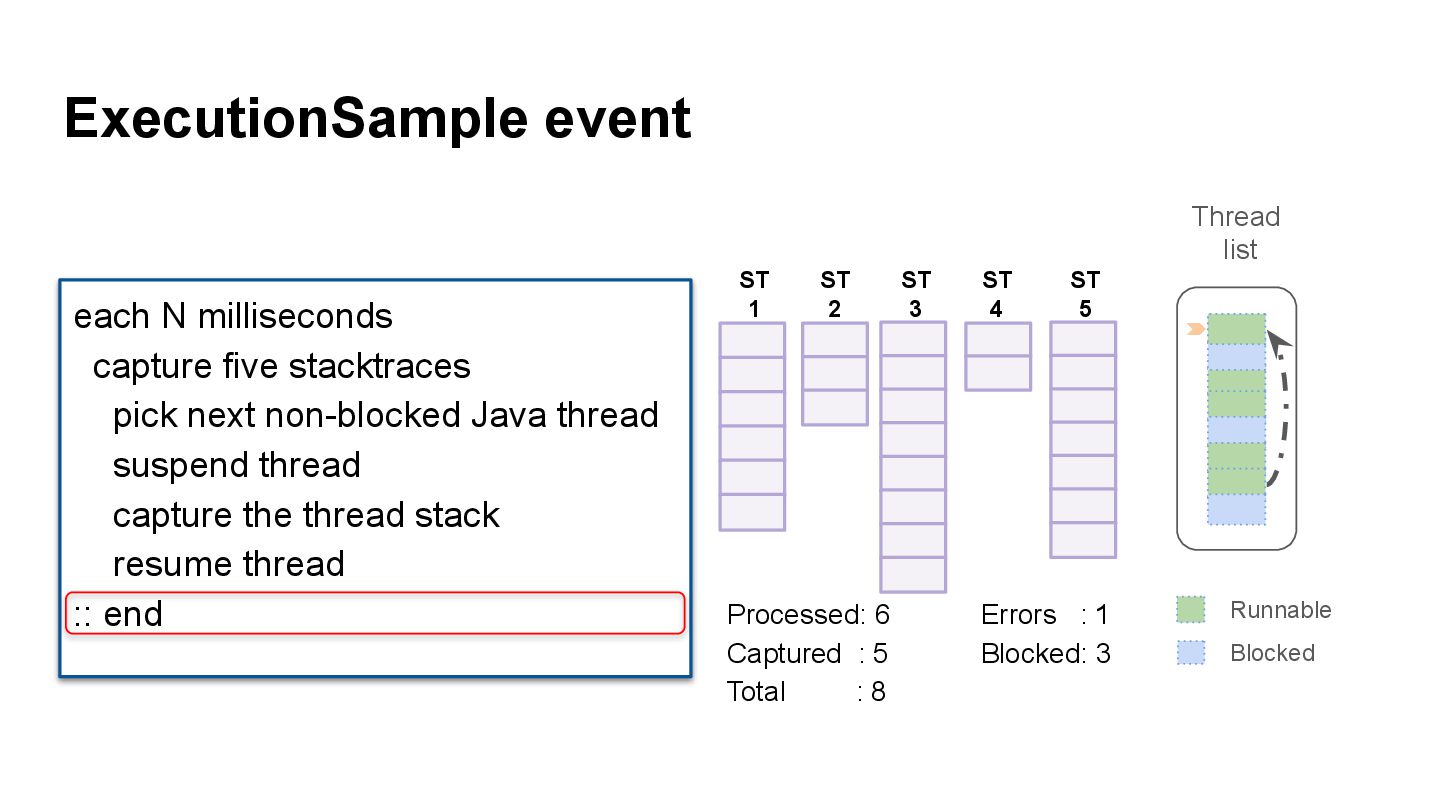
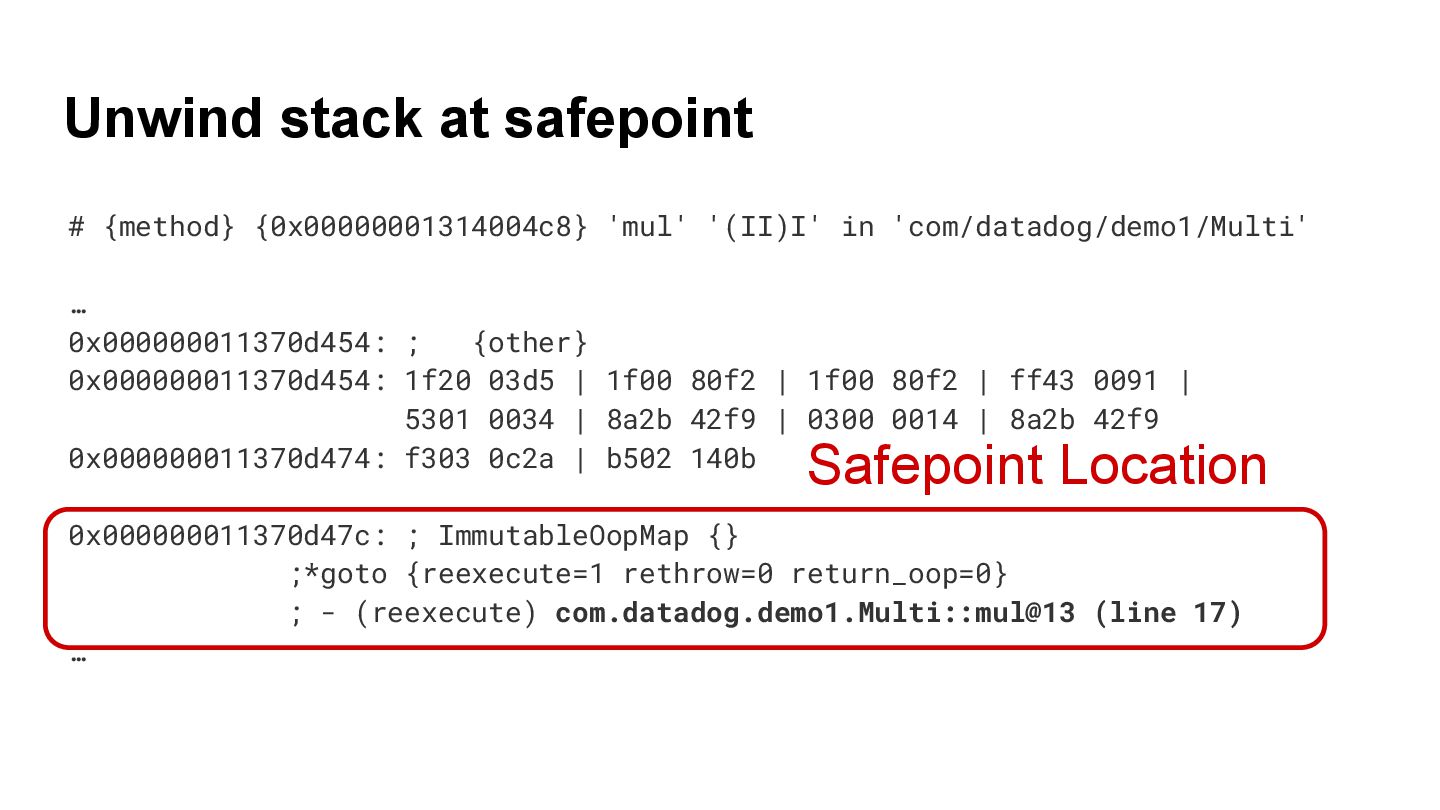
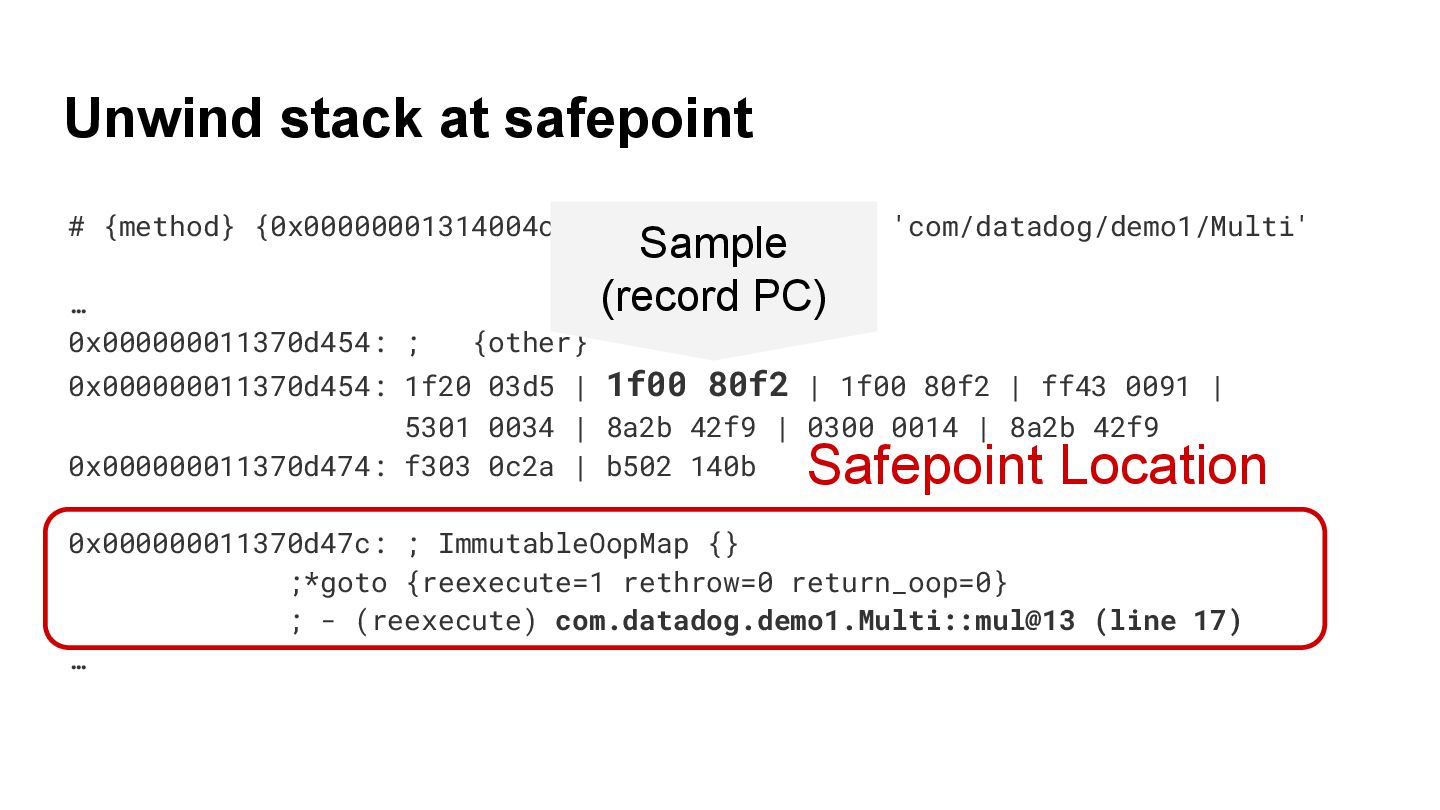
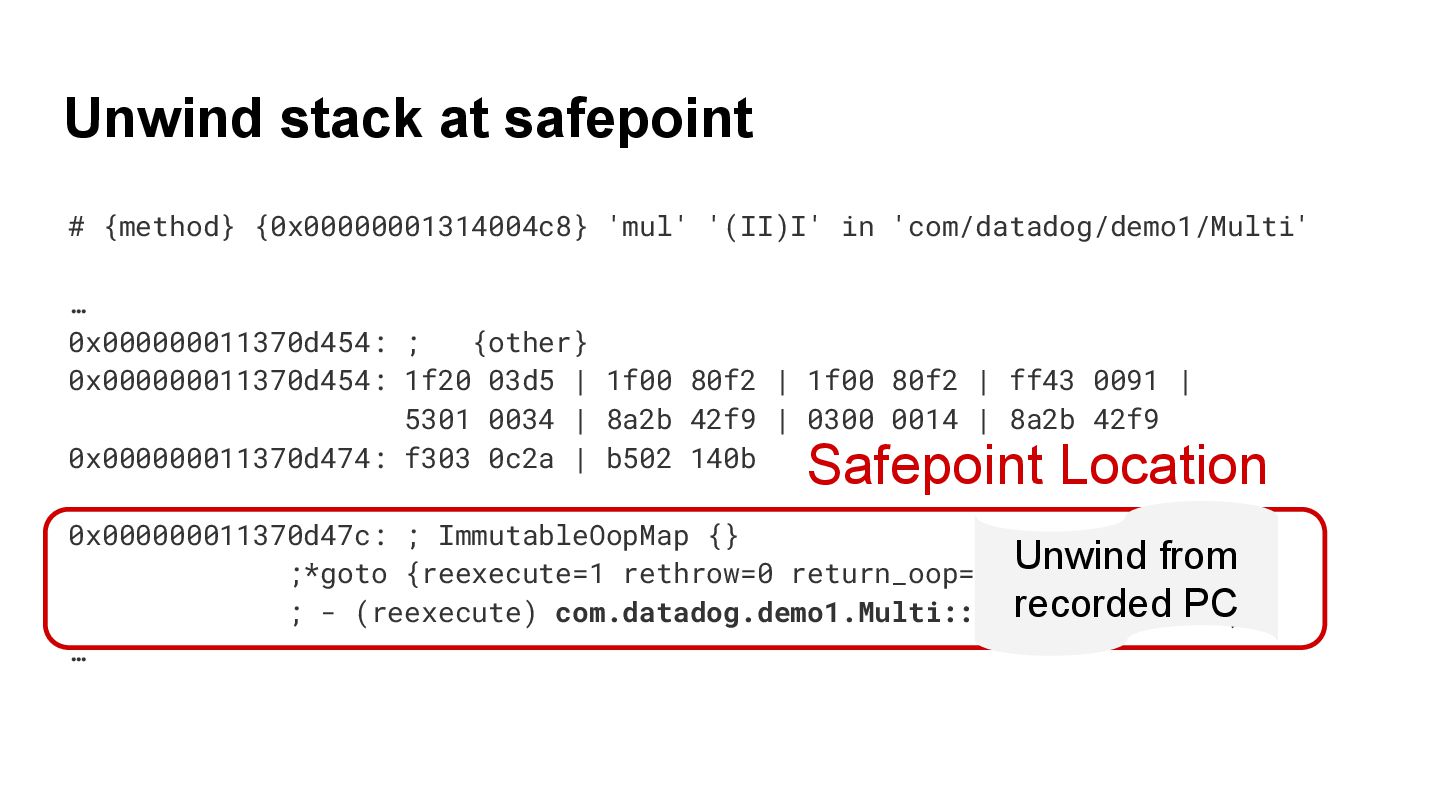
![Improving CPUTimeExecutionSample event Unwind Java stack at a safepoint [1]](https://files.speakerdeck.com/presentations/92c9aec6ec3b48b1a05123ab7dbd12f0/slide_41.jpg)
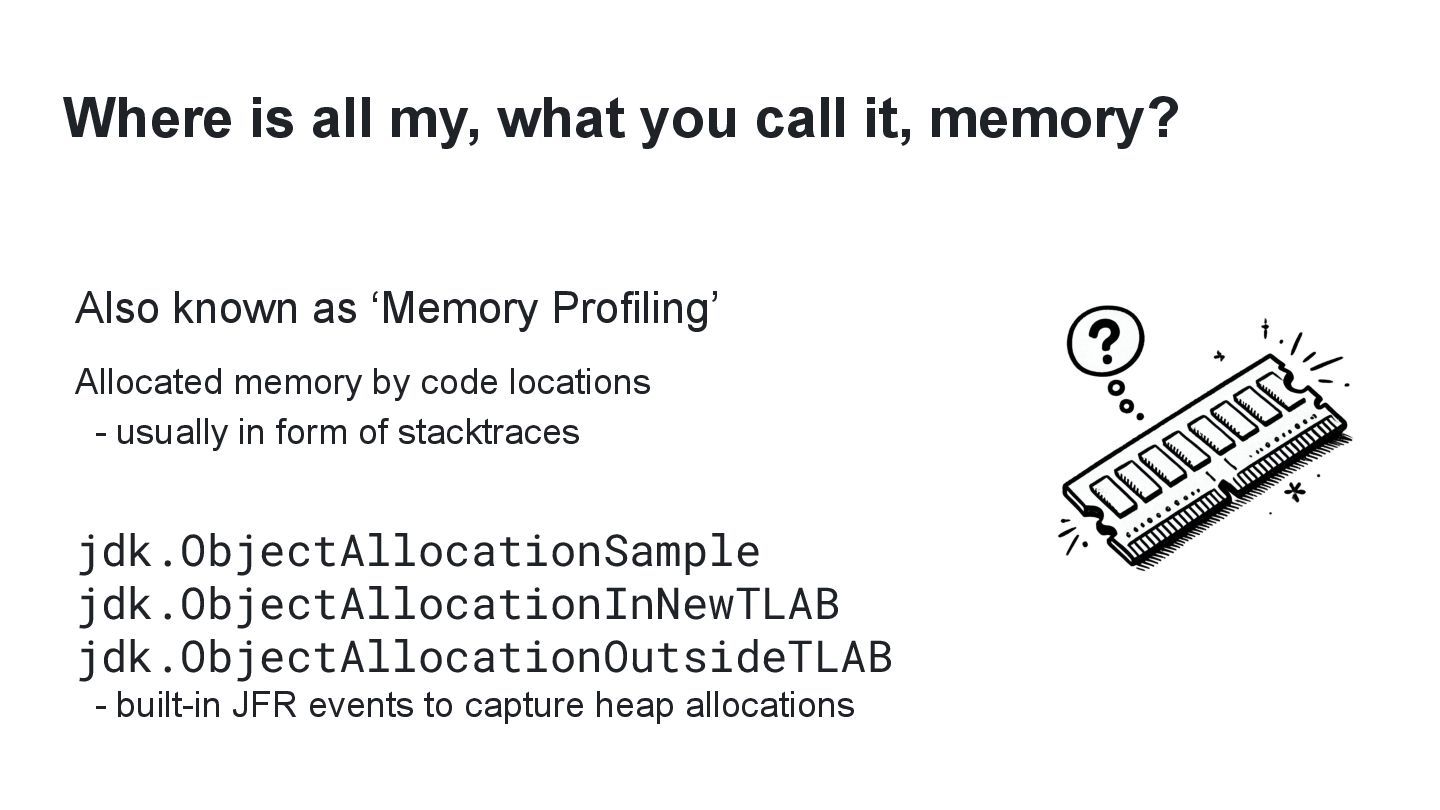
![TLAB spill and JFR events Java Heap Small [JFR Event]](https://files.speakerdeck.com/presentations/92c9aec6ec3b48b1a05123ab7dbd12f0/slide_50.jpg)
![A (100B) B (211B) A (100B) A (100B) C[] (411B)](https://files.speakerdeck.com/presentations/92c9aec6ec3b48b1a05123ab7dbd12f0/slide_53.jpg)
![A (100B) B (211B) A (100B) A (100B) C[] (411B)](https://files.speakerdeck.com/presentations/92c9aec6ec3b48b1a05123ab7dbd12f0/slide_60.jpg)
![A (100B) B (211B) A (100B) A (100B) C[] (411B)](https://files.speakerdeck.com/presentations/92c9aec6ec3b48b1a05123ab7dbd12f0/slide_61.jpg)
![OpenTelemetry (OTel) eBPF profiler OTel (Open Telemetry) [1] - CNCF](https://files.speakerdeck.com/presentations/92c9aec6ec3b48b1a05123ab7dbd12f0/slide_76.jpg)
![OpenTelemetry (OTel) eBPF profiler OTel (Open Telemetry) [1] - CNCF](https://files.speakerdeck.com/presentations/92c9aec6ec3b48b1a05123ab7dbd12f0/slide_77.jpg)