Upgrade to Pro — share decks privately, control downloads, hide ads and more …

Can Cascades Be Predicted?

Can Cascades Be Predicted?

Presented at WWW 2014.

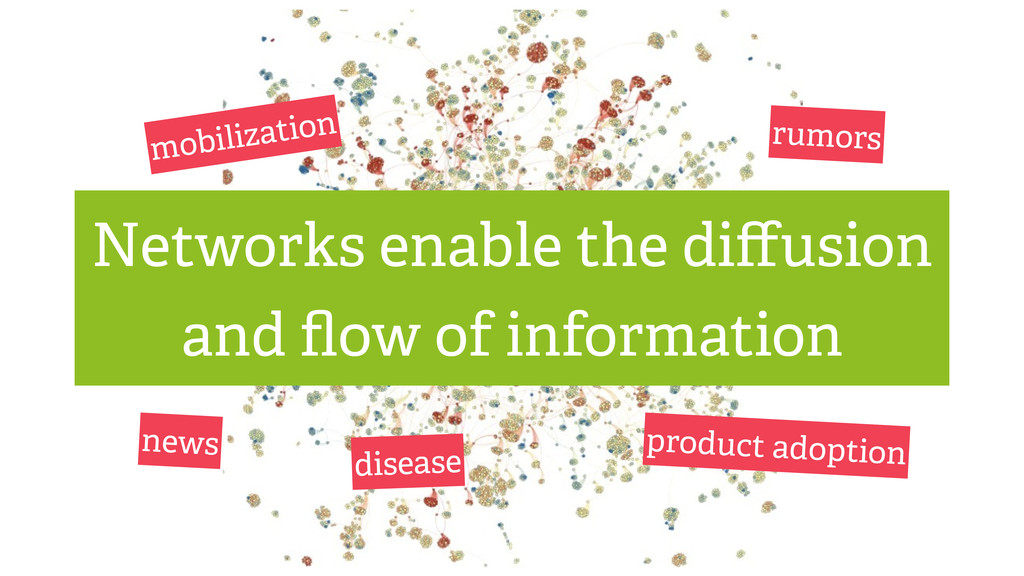
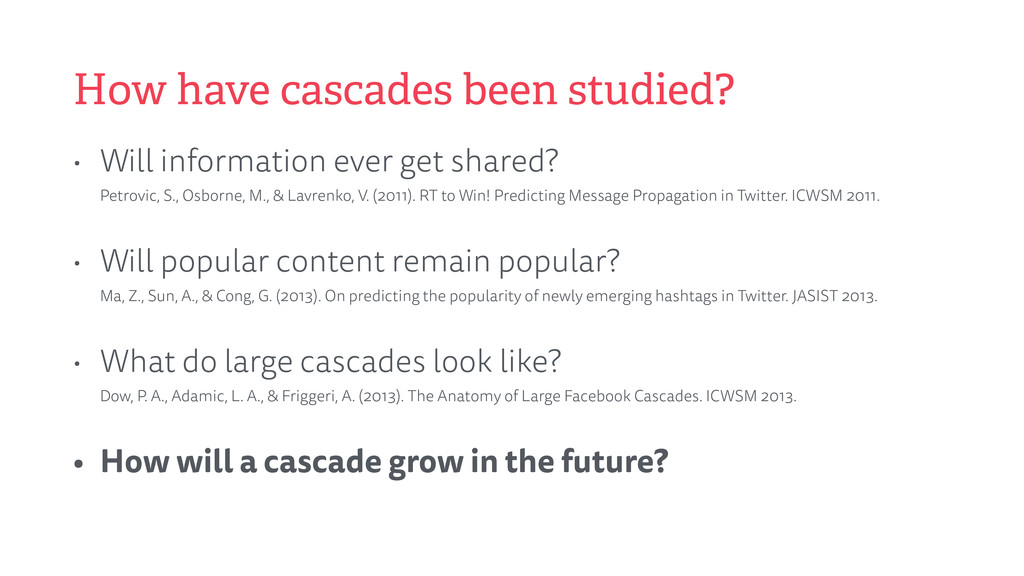
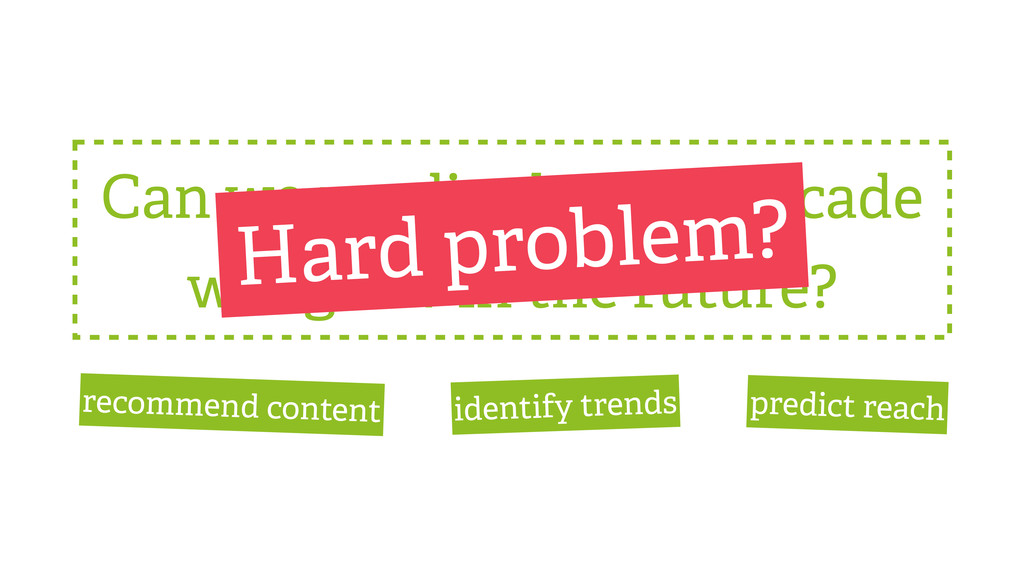
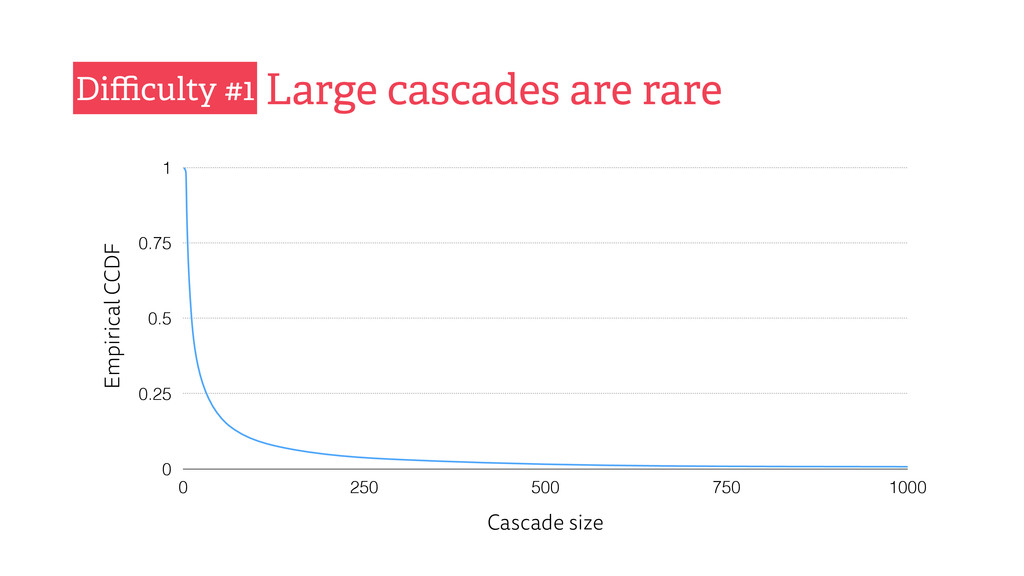
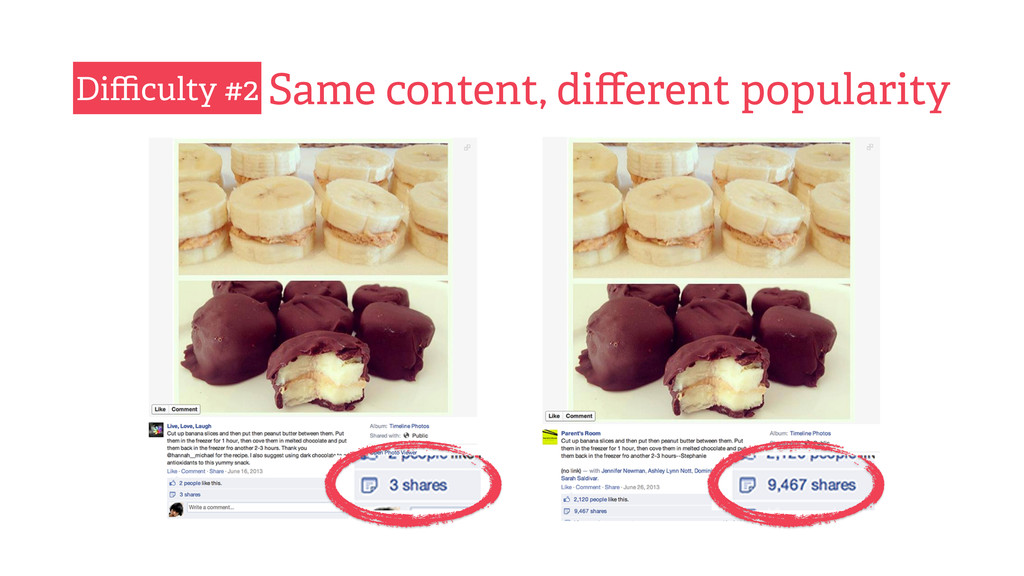
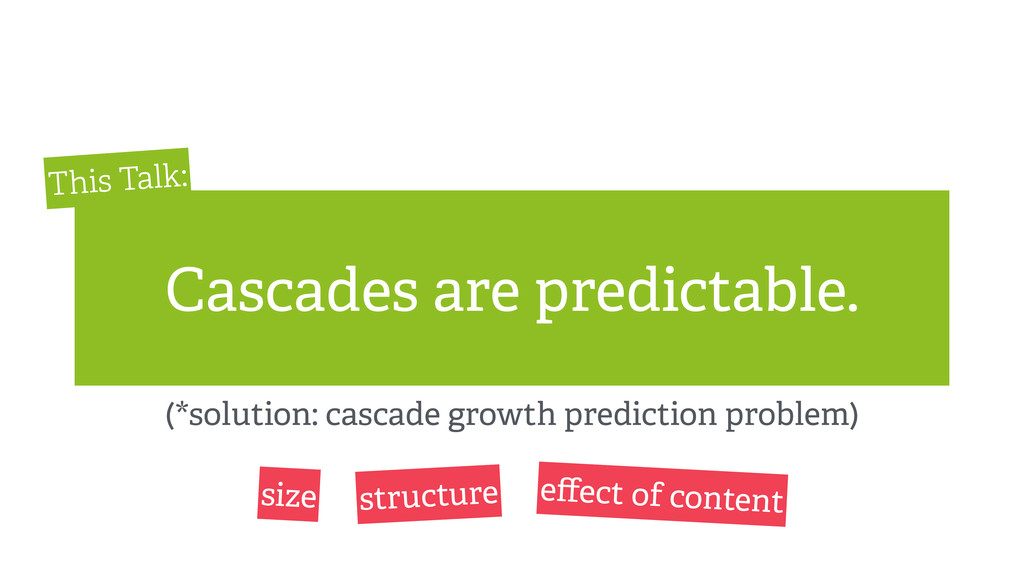
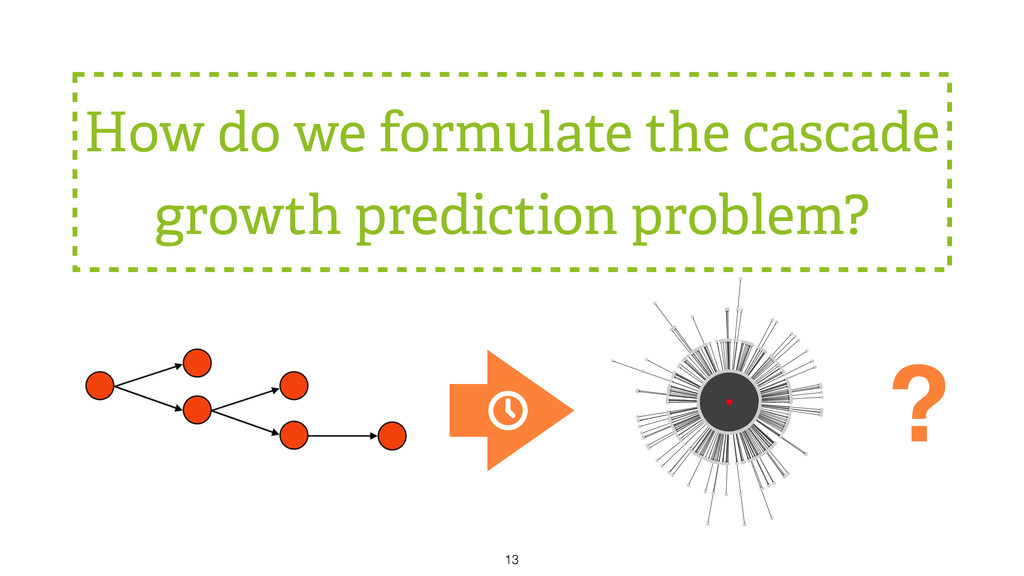
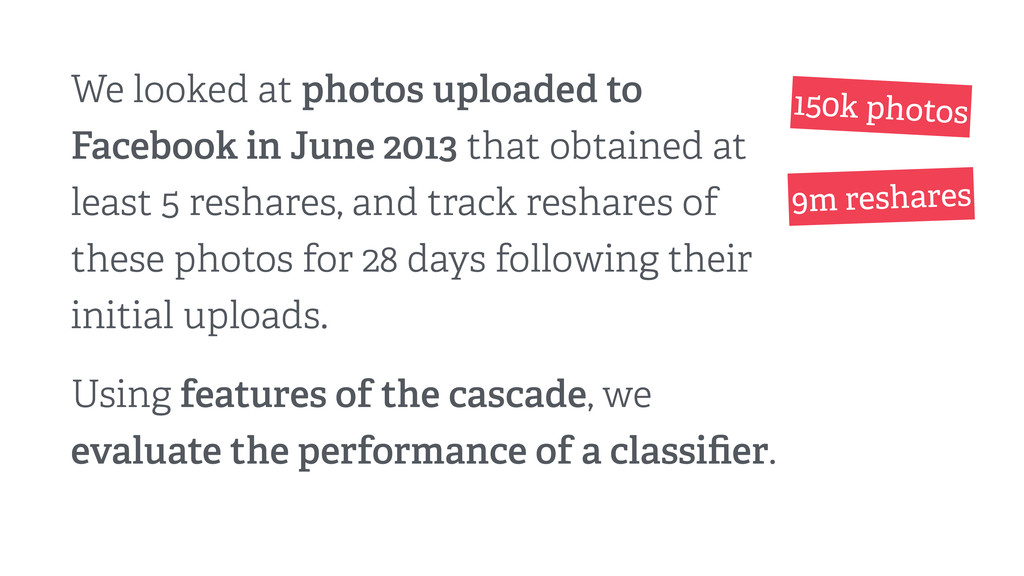
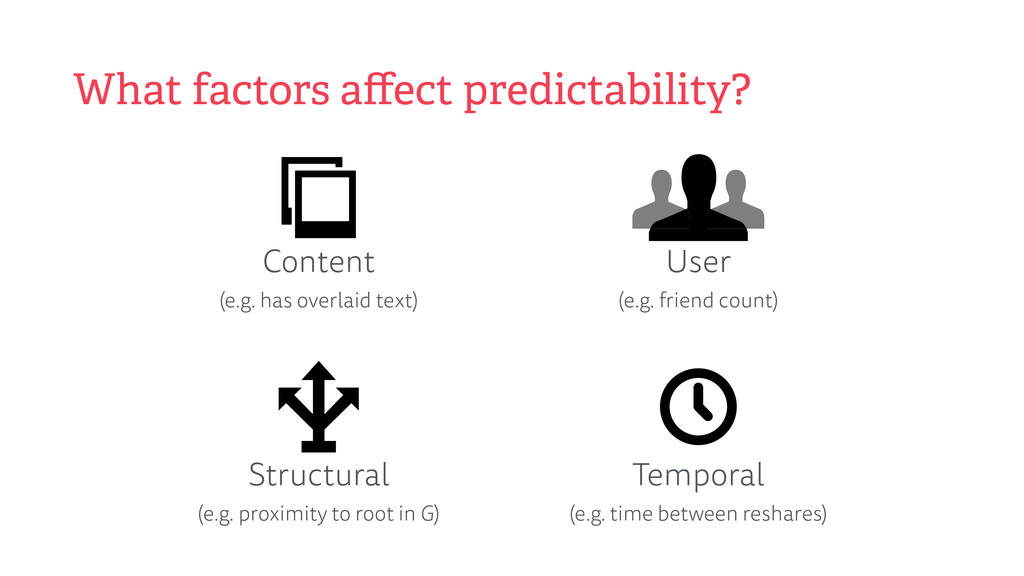
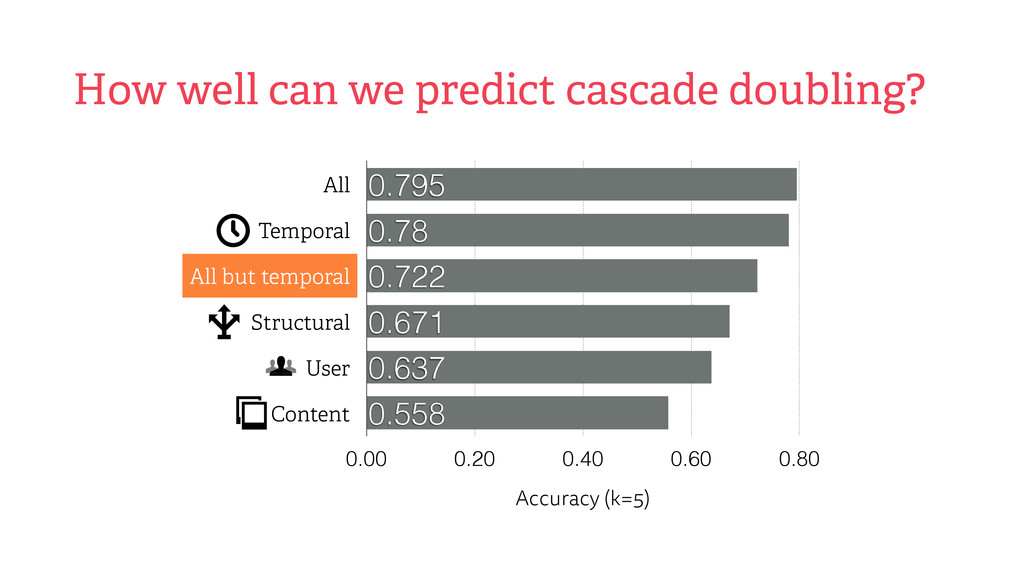
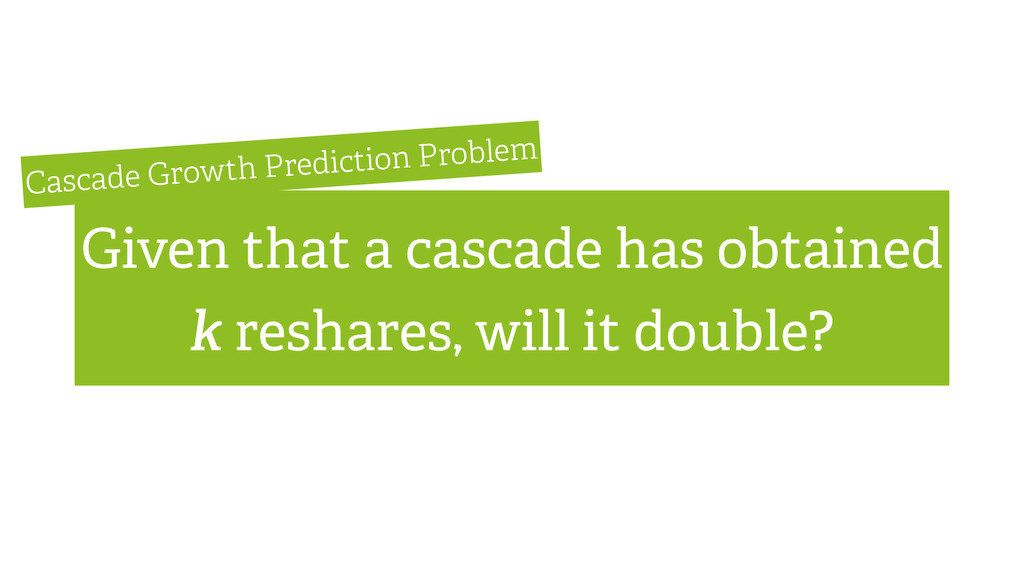
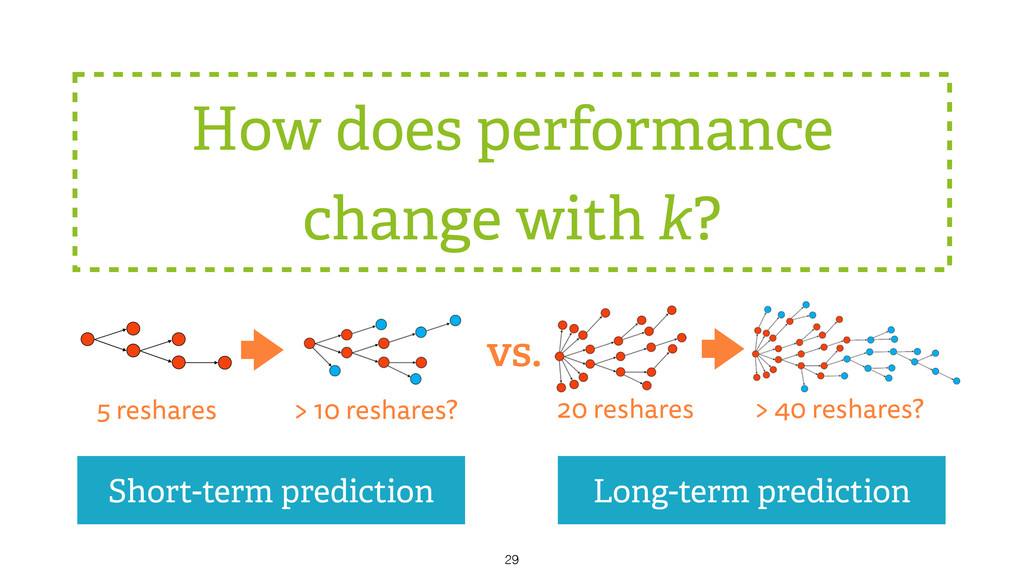
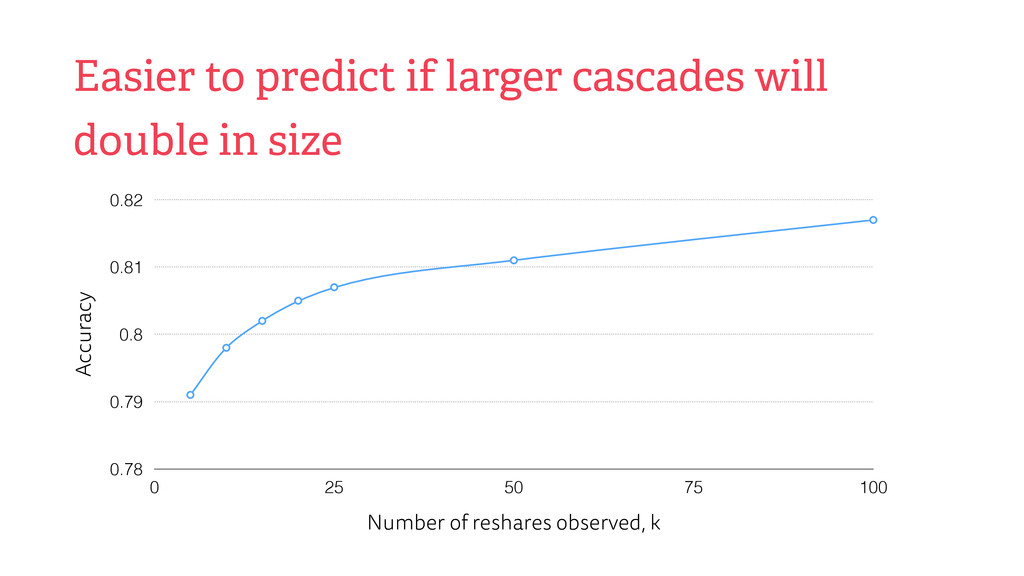
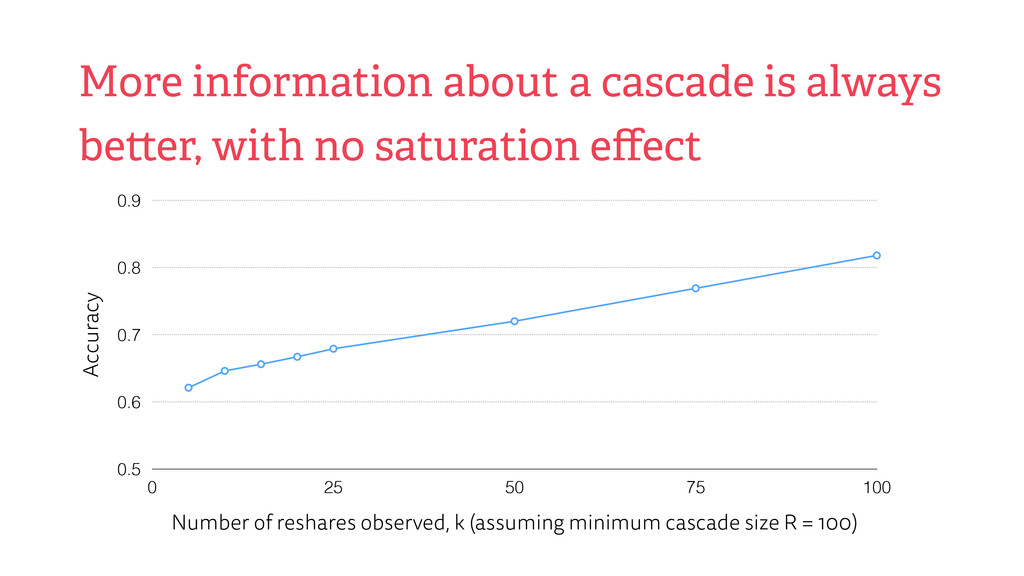
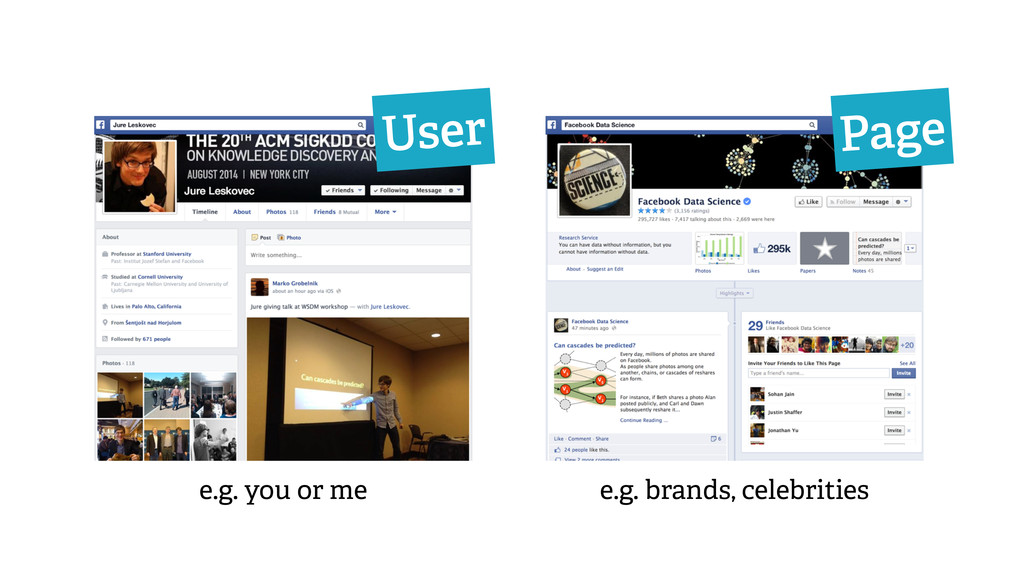
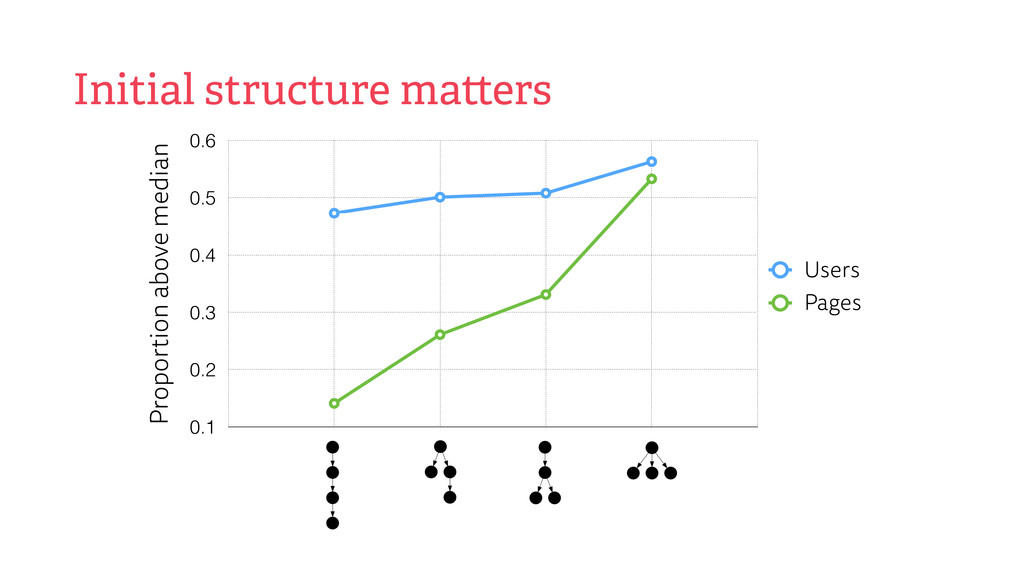
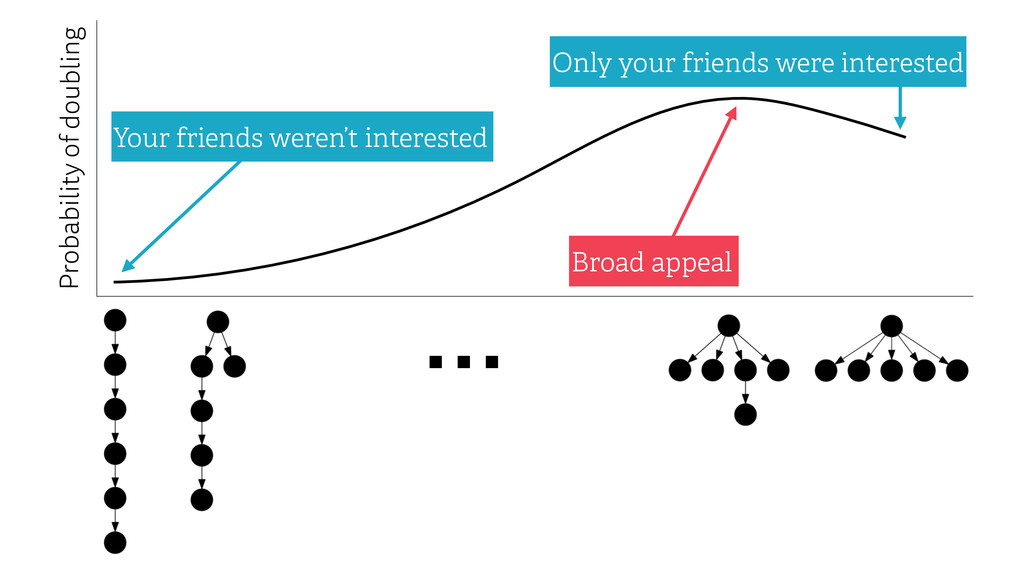
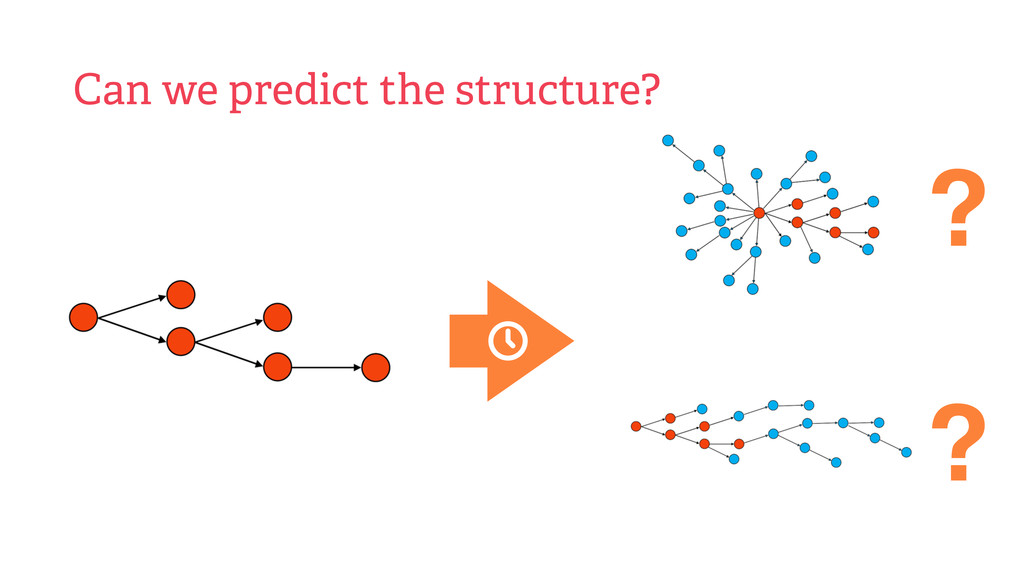
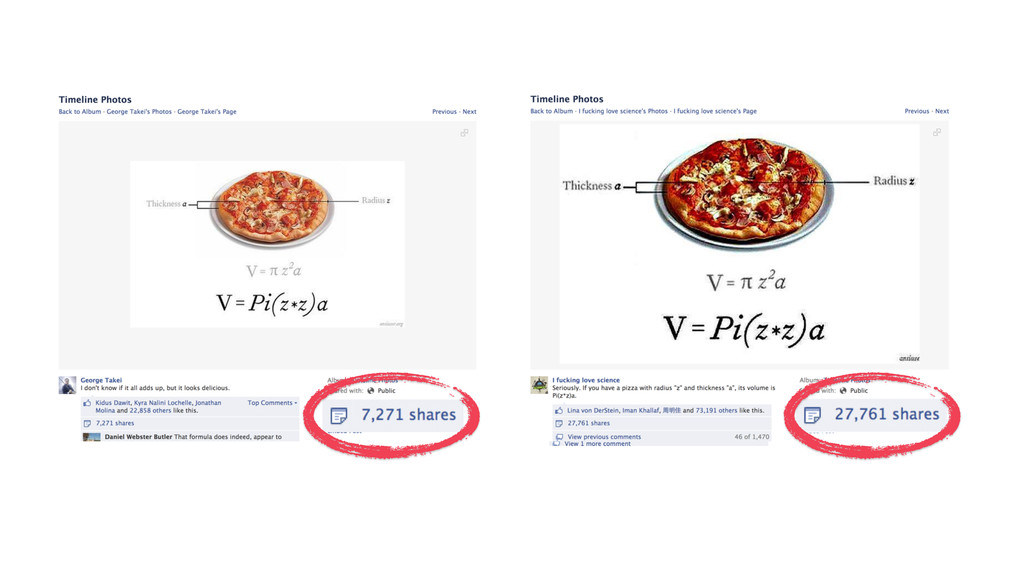
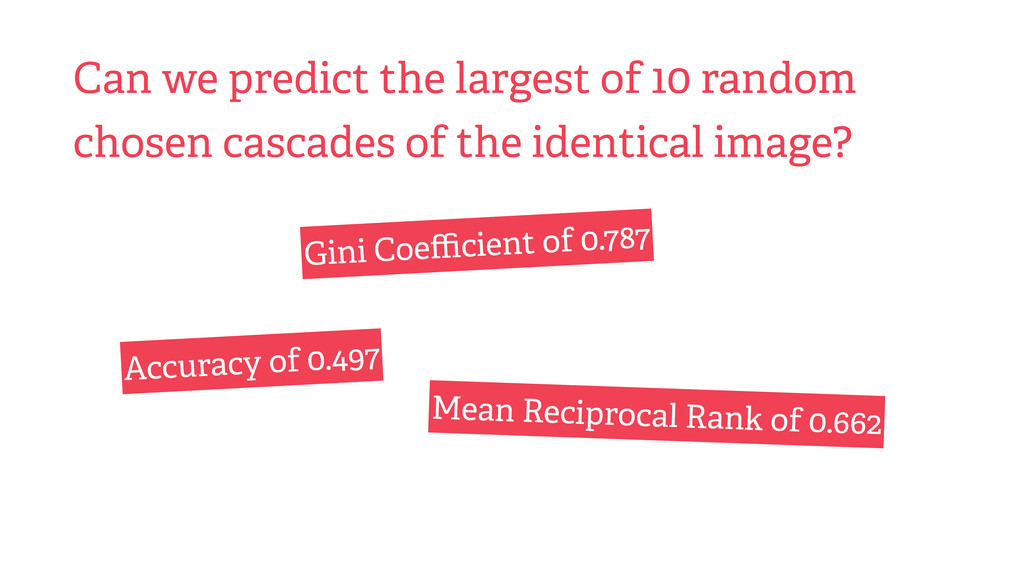
On many social networking web sites such as Facebook and Twitter, resharing or reposting functionality allows users to share others' content with their own friends or followers. As content is reshared from user to user, large cascades of reshares can form. In this work, we develop a framework for addressing cascade prediction problems. On a large sample of photo reshare cascades on Facebook, we find strong performance in predicting whether a cascade will continue to grow in the future. We find that the relative growth of a cascade becomes more predictable as we observe more of its reshares, that temporal and structural features are key predictors of cascade size, and that initially, breadth, rather than depth in a cascade is a better indicator of larger cascades. This prediction performance is robust in the sense that multiple distinct classes of features all achieve similar performance. Observing independent cascades of the same content, we find that while these cascades differ greatly in size, we are still able to predict which ends up the largest.

Justin Cheng

April 11, 2014
Tweet

More Decks by Justin Cheng

Other Decks in Research

Transcript

  1. Can Cascades be predicted? Justin Cheng Lada Adamic Alex Dow

    Jon Kleinberg Jure Leskovec Stanford Facebook Facebook Cornell Stanford
  2. How have cascades been studied? • Will information ever get

    shared?
 Petrovic, S., Osborne, M., & Lavrenko, V. (2011). RT to Win! Predicting Message Propagation in Twitter. ICWSM 2011. • Will popular content remain popular?
 Ma, Z., Sun, A., & Cong, G. (2013). On predicting the popularity of newly emerging hashtags in Twitter. JASIST 2013. • What do large cascades look like?
 Dow, P. A., Adamic, L. A., & Friggeri, A. (2013). The Anatomy of Large Facebook Cascades. ICWSM 2013. • How will a cascade grow in the future?
  3. Can we predict how a cascade will grow in the

    future? recommend content identify trends predict reach Hard problem?
  4. Large cascades are rare Empirical CCDF 0 0.25 0.5 0.75

    1 Cascade size 0 250 500 750 1000 Difficulty #1
  5. Increasing the strength of social influence increased both inequality and

    unpredictability of success. Salganik, M. J., Dodds, P. S., & Watts, D. J. (2006). Experimental study of inequality and unpredictability in an artificial cultural market.
  6. ? How big will a small cascade get? Most cascades

    are small (outliers skew results) Possibility #2
  7. Just look at the large cascades? ? ? Possibility #3

    Selection Bias (only considers small subset of data)
  8. Will a cascade reach the median size? ? ? k

    reshares less than the median f(k) more than the median f(k) Our Approach
  9. Empirical median cascade size, f(k) 0 10 20 30 40

    50 Number of reshares observed, k 5 10 15 20 25
  10. Let X = { cascades of size ≥ k }.

    Then the median of X is 2k. (see paper)
  11. Will a cascade reach the median size? ? ? k

    reshares less than the median f(k) more than the median f(k)
  12. Will a cascade double in size? ? ? ≤ 2k

    reshares = f(k) > 2k reshares = f(k) k reshares
  13. Given that a cascade has obtained k reshares, will it

    double? Cascade Growth Prediction Problem balanced can track growth over time
  14. We looked at photos uploaded to Facebook in June 2013

    that obtained at least 5 reshares, and track reshares of these photos for 28 days following their initial uploads. Using features of the cascade, we evaluate the performance of a classifier. 150k photos 9m reshares
  15. What factors affect predictability? Content
 (e.g. has overlaid text) User


    (e.g. friend count) Structural
 (e.g. proximity to root in G) Temporal
 (e.g. time between reshares)
  16. How well can we predict cascade doubling? All Temporal All

    but temporal Structural User Content Accuracy (k=5) 0.00 0.20 0.40 0.60 0.80 0.558 0.637 0.671 0.722 0.78 0.795 All but temporal
  17. Given that a cascade has obtained k reshares, will it

    double? Cascade Growth Prediction Problem
  18. How does performance change with k? 27 > 10 reshares?

    5 reshares > 40 reshares? 20 reshares vs.
  19. How does performance change with k? 28 > 10 reshares?

    5 reshares > 40 reshares? 20 reshares vs. Less data More data
  20. How does performance change with k? 29 > 10 reshares?

    5 reshares > 40 reshares? 20 reshares vs. Short-term prediction Long-term prediction
  21. Easier to predict if larger cascades will double in size

    Accuracy 0.78 0.79 0.8 0.81 0.82 Number of reshares observed, k 0 25 50 75 100
  22. Fix the minimum cascade size R ≥ k. How does

    performance change with k? 31 >40 reshares? 5 reshares > 40 reshares? 20 reshares vs.
  23. Fix the minimum cascade size R ≥ k. How does

    performance change with k? 32 >40 reshares? 5 reshares > 40 reshares? 20 reshares vs. Is there a saturation effect?
  24. Accuracy 0.5 0.6 0.7 0.8 0.9 Number of reshares observed,

    k (assuming minimum cascade size R = 100) 0 25 50 75 100 More information about a cascade is always be er, with no saturation effect
  25. The original post (and poster) get less important with increasing

    k Original poster’s friend count Correlation 0 0.07 0.14 0.21 0.28 Minimum cascade size k 0 25 50 75 100 Whether the photo is a meme Correlation 0 0.03 0.06 0.09 0.12 Minimum cascade size k 0 25 50 75 100
  26. Successful cascades get many views quickly, but with low, or

    high conversion rates? # users who saw the first k reshares Correlation -1 -0.75 -0.5 -0.25 0 0.25 0.5 0.75 1 Minimum cascade size k 0 25 50 75 100 ? Unique views per unit time Correlation 0 0.065 0.13 0.195 0.26 Minimum cascade size k 0 25 50 75 100
  27. Successful cascades get many views quickly, and achieve high conversion

    rates Unique views per unit time Correlation 0 0.065 0.13 0.195 0.26 Minimum cascade size k 0 25 50 75 100 # users who saw the first k reshares Correlation -0.18 -0.135 -0.09 -0.045 0 Minimum cascade size k 0 25 50 75 100
  28. Wiener index (mean all-pairs shortest distance) Anderson, A., Goel, S.,

    Hofman, J. & Watts, D. J. The structural virality of online diffusion. d = 1.98 d = 2.47 d = 14.4
  29. Page cascades are driven by hub nodes Wiener index 0

    10 20 30 40 Cascade Size [1, 10) [10, 100) [100, 1000) [1000, 10000) [10000, 100000) Users Pages
  30. Will a cascade have structural virality above the median? Accuracy

    of 0.725 Temporal and structural features equally predictive Pages are easier than users to predict
  31. Increasing the strength of social influence increased both inequality and

    unpredictability of success. Salganik, M. J., Dodds, P. S., & Watts, D. J. (2006). Experimental study of inequality and unpredictability in an artificial cultural market.
  32. We consider clusters of identical photos uploaded to Facebook. For

    each cluster, we select ten random cascades, and predict which was the largest (random guessing: 10%). 983 clusters 13m reshares 38k photo uploads
  33. Can we predict the largest of 10 random chosen cascades

    of the identical image? Accuracy of 0.497 Mean Reciprocal Rank of 0.662 Gini Coefficient of 0.787
  34. How do I make my posts “go viral”? • Favor

    memes (i.e. post popular content) • Be a page and have lots of followers (i.e. be popular) • Know what your friends like, and what your friends’ friends like (i.e. be a marketing guru)
  35. Cascades are predictable. The cascade growth prediction problem allows us

    to accurately predict the future growth of a cascade. Justin Cheng Lada Adamic Alex Dow Jon Kleinberg Jure Leskovec (Technology Review has a good summary: h p://bit.ly/trcascades)