Upgrade to Pro — share decks privately, control downloads, hide ads and more …

Distributed Tracing Understand how your components work together - Microxchg 2018

Distributed Tracing Understand how your components work together - Microxchg 2018

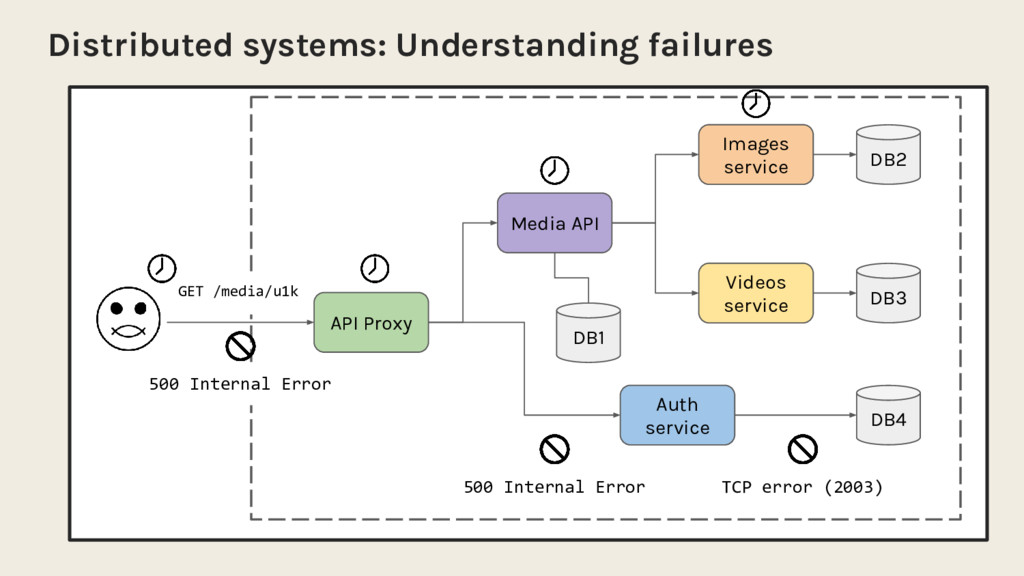
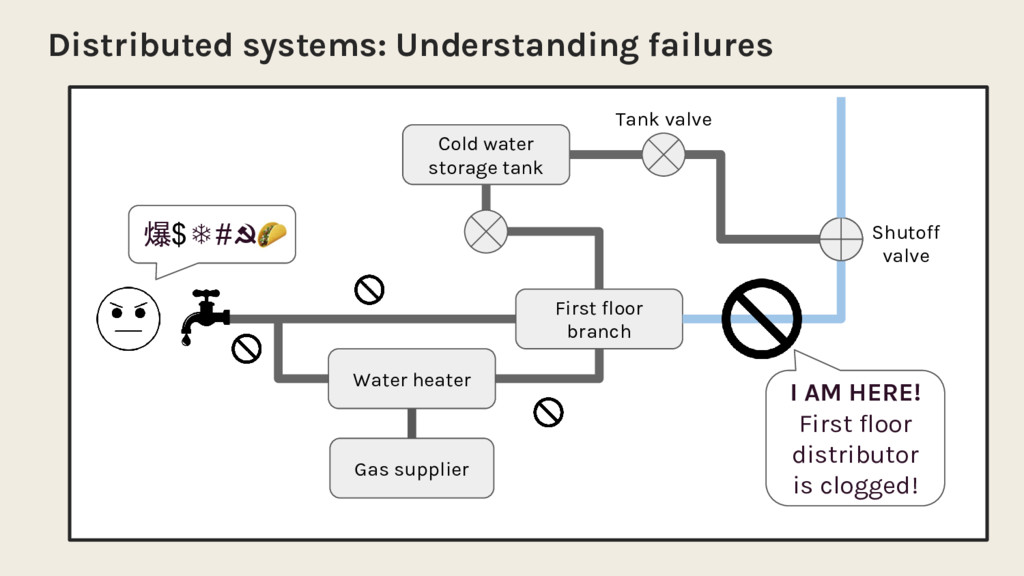
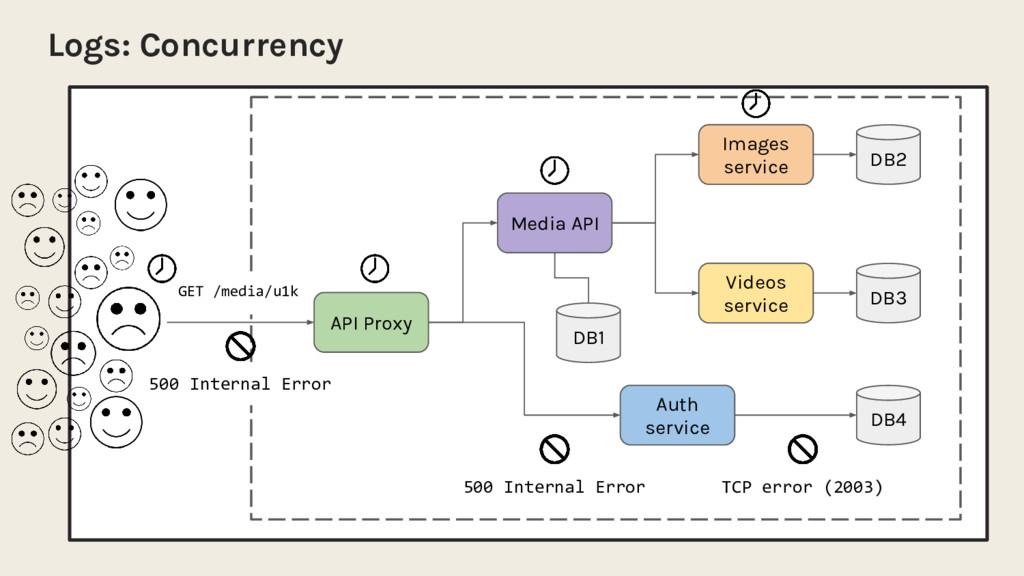
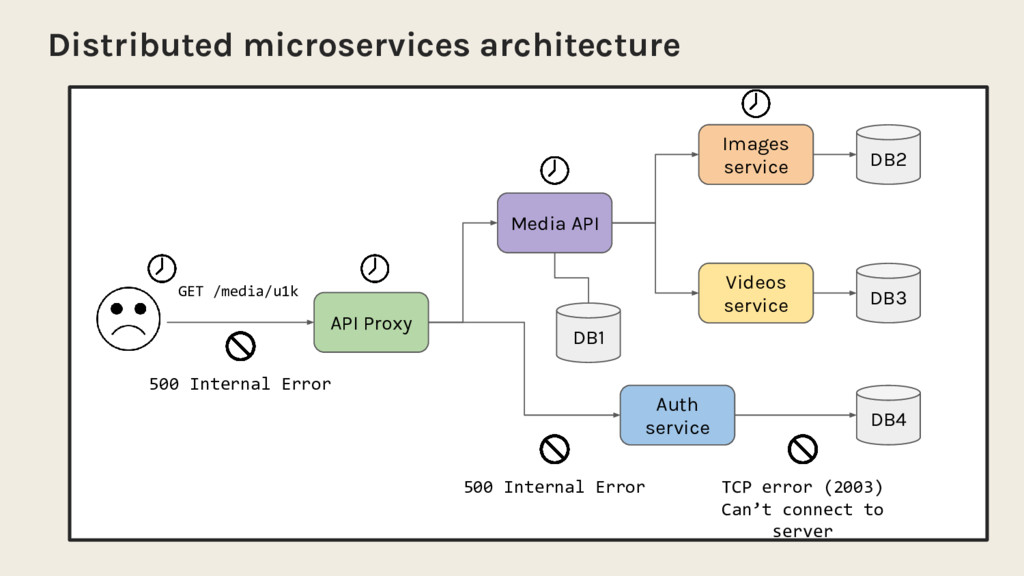
Monitoring and understanding failures in monoliths or small systems starts with looking at a single component in isolation. Multi-service architecture invalidates this assumption because end-user requests now traverse dozens of components. Looking at a service in isolation simply does not give you enough information: each is just one side of a bigger story.

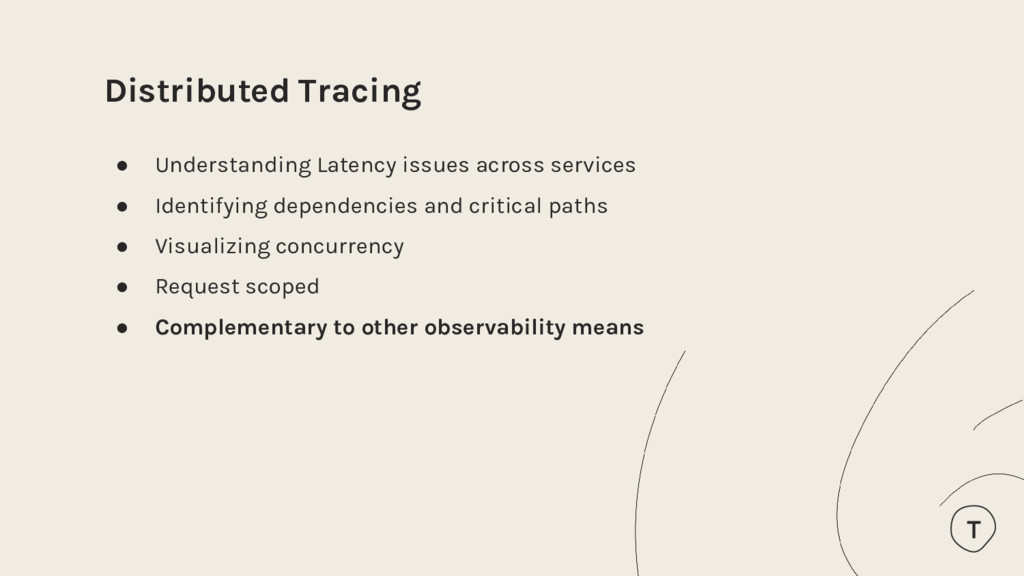
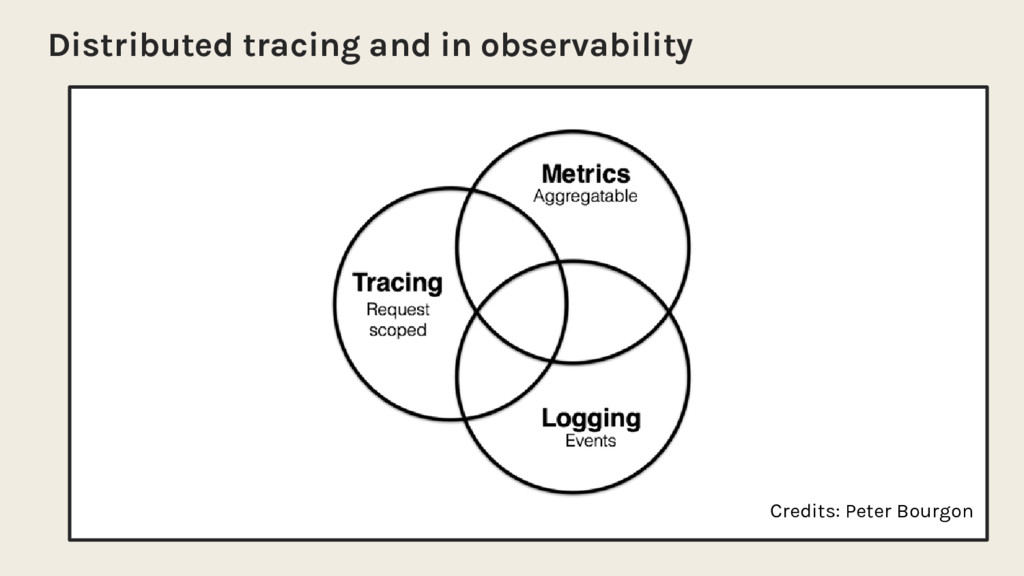
Distributed Tracing summarizes all sides of the story into a shared timeline. Distributed Tracing tools place the bright spot over the relationship between components from the very top of the stack to the deepest component in the system which gives the feeling of working with a single system, while working in distributed environments.

In this talk we will look at how distributed tracing works, what you can use it for and have a look at how tools like Zipkin solve these problems.

José Carlos Chávez

March 23, 2018
Tweet

More Decks by José Carlos Chávez

Other Decks in Technology

Transcript

  1. About me José Carlos Chávez • Software Engineer at Typeform

    focused on the responses services aggregate. • Zipkin core team, DataDog consultant and open source contributor for Distributed Tracing projects.
  2. Distributed systems A collection of independent components appears to its

    users as a single coherent system. Characteristics: • Concurrency • No global clock • Independent failures
  3. Water heater Gas supplier Cold water storage tank Shutoff valve

    First floor branch Tank valve 爆$❄#☭ Distributed systems
  4. Auth service Images service Videos service DB2 DB3 DB4 TCP

    error (2003) 500 Internal Error 500 Internal Error GET /media/u1k API Proxy Distributed systems: Understanding failures DB1 Media API
  5. Water heater Gas supplier Cold water storage tank Shutoff valve

    First floor branch Tank valve 爆$❄#☭ I AM HERE! First floor distributor is clogged! Distributed systems: Understanding failures
  6. API Proxy Auth service Media API Images service Videos service

    DB2 DB3 DB4 TCP error (2003) 500 Internal Error 500 Internal Error GET /media/u1k Logs: Concurrency DB1
  7. [24/Oct/2017 13:50:07 +0000] “GET /media HTTP/1.1” 200 … **0/13548” [24/Oct/2017

    13:50:07 +0000] “GET /media HTTP/1.1” 200 … **0/23948” [24/Oct/2017 13:50:08 +0000] “GET /media HTTP/1.1” 200 … **0/12396” [24/Oct/2017 13:50:07 +0000] “GET /videos HTTP/1.1” 200 … **0/23748” [24/Oct/2017 13:50:07 +0000] “GET /images HTTP/1.1” 200 … **0/23248” [24/Oct/2017 13:50:07 +0000] “GET /auth HTTP/1.1” 200 … **0/26548” [24/Oct/2017 13:50:07 +0000] “POST /media HTTP/1.1” 200 … **0/13148” [24/Oct/2017 13:50:07 +0000] “GET /media HTTP/1.1” 200 … **0/2588” [24/Oct/2017 13:50:07 +0000] “GET /auth HTTP/1.1” 500 … **0/3248” [24/Oct/2017 13:50:07 +0000] “POST /media HTTP/1.1” 200 … **0/23548” [24/Oct/2017 13:50:07 +0000] “GET /images HTTP/1.1” 200 … **0/22598” [24/Oct/2017 13:50:07 +0000] “GET /videos HTTP/1.1” 200 … **0/13948” ... ? ? Logs
  8. Distributed Tracing • Understanding Latency issues across services • Identifying

    dependencies and critical paths • Visualizing concurrency • Request scoped • Complementary to other observability means
  9. API Proxy Auth service Media API Images service Videos service

    DB2 DB3 DB4 TCP error (2003) Can’t connect to server 500 Internal Error 500 Internal Error GET /media/u1k Distributed microservices architecture DB1
  10. [24/Oct/2017 13:50:07 +0000] “GET /media HTTP/1.1” 200 … **0/13548” [24/Oct/2017

    13:50:07 +0000] “GET /media HTTP/1.1” 200 … **0/23948” [24/Oct/2017 13:50:08 +0000] “GET /media HTTP/1.1” 200 … **0/12396” [24/Oct/2017 13:50:07 +0000] “GET /videos HTTP/1.1” 200 … **0/23748” [24/Oct/2017 13:50:07 +0000] “GET /images HTTP/1.1” 200 … **0/23248” [24/Oct/2017 13:50:07 +0000] “GET /auth HTTP/1.1” 200 … **0/26548” [24/Oct/2017 13:50:07 +0000] “POST /media HTTP/1.1” 200 … **0/13148” [24/Oct/2017 13:50:07 +0000] “GET /media HTTP/1.1” 200 … **0/2588” [24/Oct/2017 13:50:07 +0000] “GET /auth HTTP/1.1” 500 … **0/3248” [24/Oct/2017 13:50:07 +0000] “POST /media HTTP/1.1” 200 … **0/23548” [24/Oct/2017 13:50:07 +0000] “GET /images HTTP/1.1” 200 … **0/22598” [24/Oct/2017 13:50:07 +0000] “GET /videos HTTP/1.1” 200 … **0/13948” ... Logs
  11. API Proxy Media service Auth Videos Images | Time [1508410470]

    error TCP (2003) 500 [1508410442] no cache for resource, retrieving from DB db_2_inst1 error error Distributed tracing
  12. Elements of Distributed Tracing • A trace shows an execution

    path through a distributed system • A context includes information that should be propagated across services • A span in the trace represents a logical unit of work (with a beginning and end) • Tags and logs (optional) add complementary information to spans.
  13. Client / Producer Extract() Inject() Span 2 Span 1 Extract()

    TraceID: fAf3oXLoDS ParentID: ... SpanID: dZ0qHIBa1A Sampled: true ... TraceID: fAf3oXLoDS ParentID: dZ0qHIBa1A SpanID: oYa7m31wq5 Sampled: true ... Elements of Distributed Tracing
  14. Benefits of Distributed Tracing • Effective monitoring • System insight,

    clarifies non trivial interactions • Visibility to critical paths and dependencies • Observe E2E latency in near real time • Request scoped, not request’s lifecycle scoped.
  15. What about overhead? • Observability tools are unintrusive • Sampling

    reduces overhead • Instrumentation can be delegated to common frameworks • (Don’t) trace every single operation
  16. (open)Zipkin • Distributed tracing tool • Based on Google Dapper

    (2010) • Created by twitter (2012) • Open source (2015) • Mature tracing model • Strong community: ◦ @zipkinproject ◦ github.com/openzipkin ◦ gitter.im/openzipkin
  17. Service (instrumented) Transport Collect spans Collector API UI Storage DB

    Visualize Retrieve data Store spans http/kafka/grpc Receive spans Deserialize and schedule for storage Cassandra/MySQL/ElasticSearch Zipkin: architecture