Upgrade to Pro — share decks privately, control downloads, hide ads and more …

DCI The Cost of Competing

Avatar for Jeff Gill Jeff Gill
August 09, 2026
240

DCI The Cost of Competing

In depth analysis of the link between budget and placement as well as examination of the brewing sustainability criss within the Drum Corps activity.

Avatar for Jeff Gill

Jeff Gill

August 09, 2026

Transcript

  1. A R E V I E W B U I

    LT E N T I R E LY F R O M P U B L I C F I L I N G S The Cost of Competing What ten years of tax returns show about drum corps finances Spending to field a show has grown 45% beyond inflation in eight years. Money predicts placement more closely every season. And the activity cannot currently see its own finances well enough to have the argument. Jeff Gill Cavaliers alum · Cavaliers finance committee 2019–2025 · treasurer 2023–2025 Every figure here comes from documents anyone can pull. Line items available on request.
  2. T H E W H O L E A R

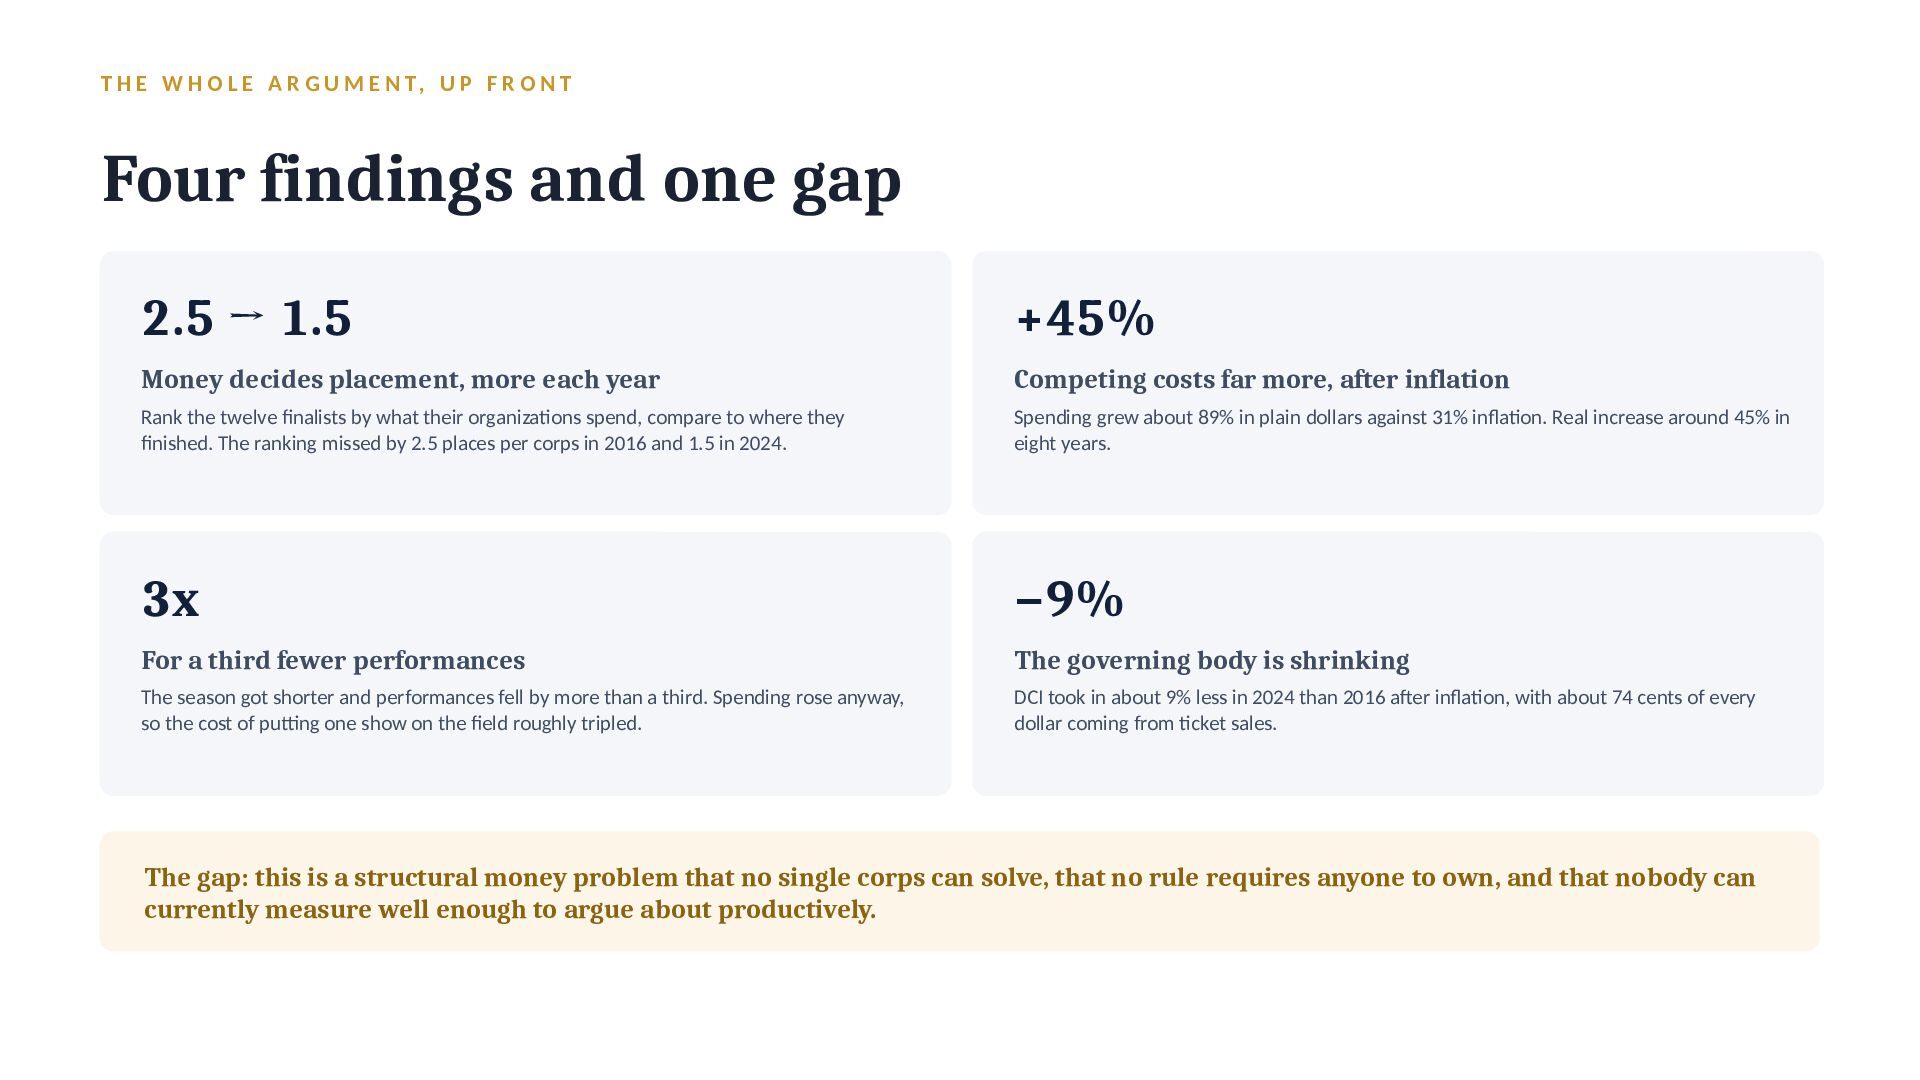
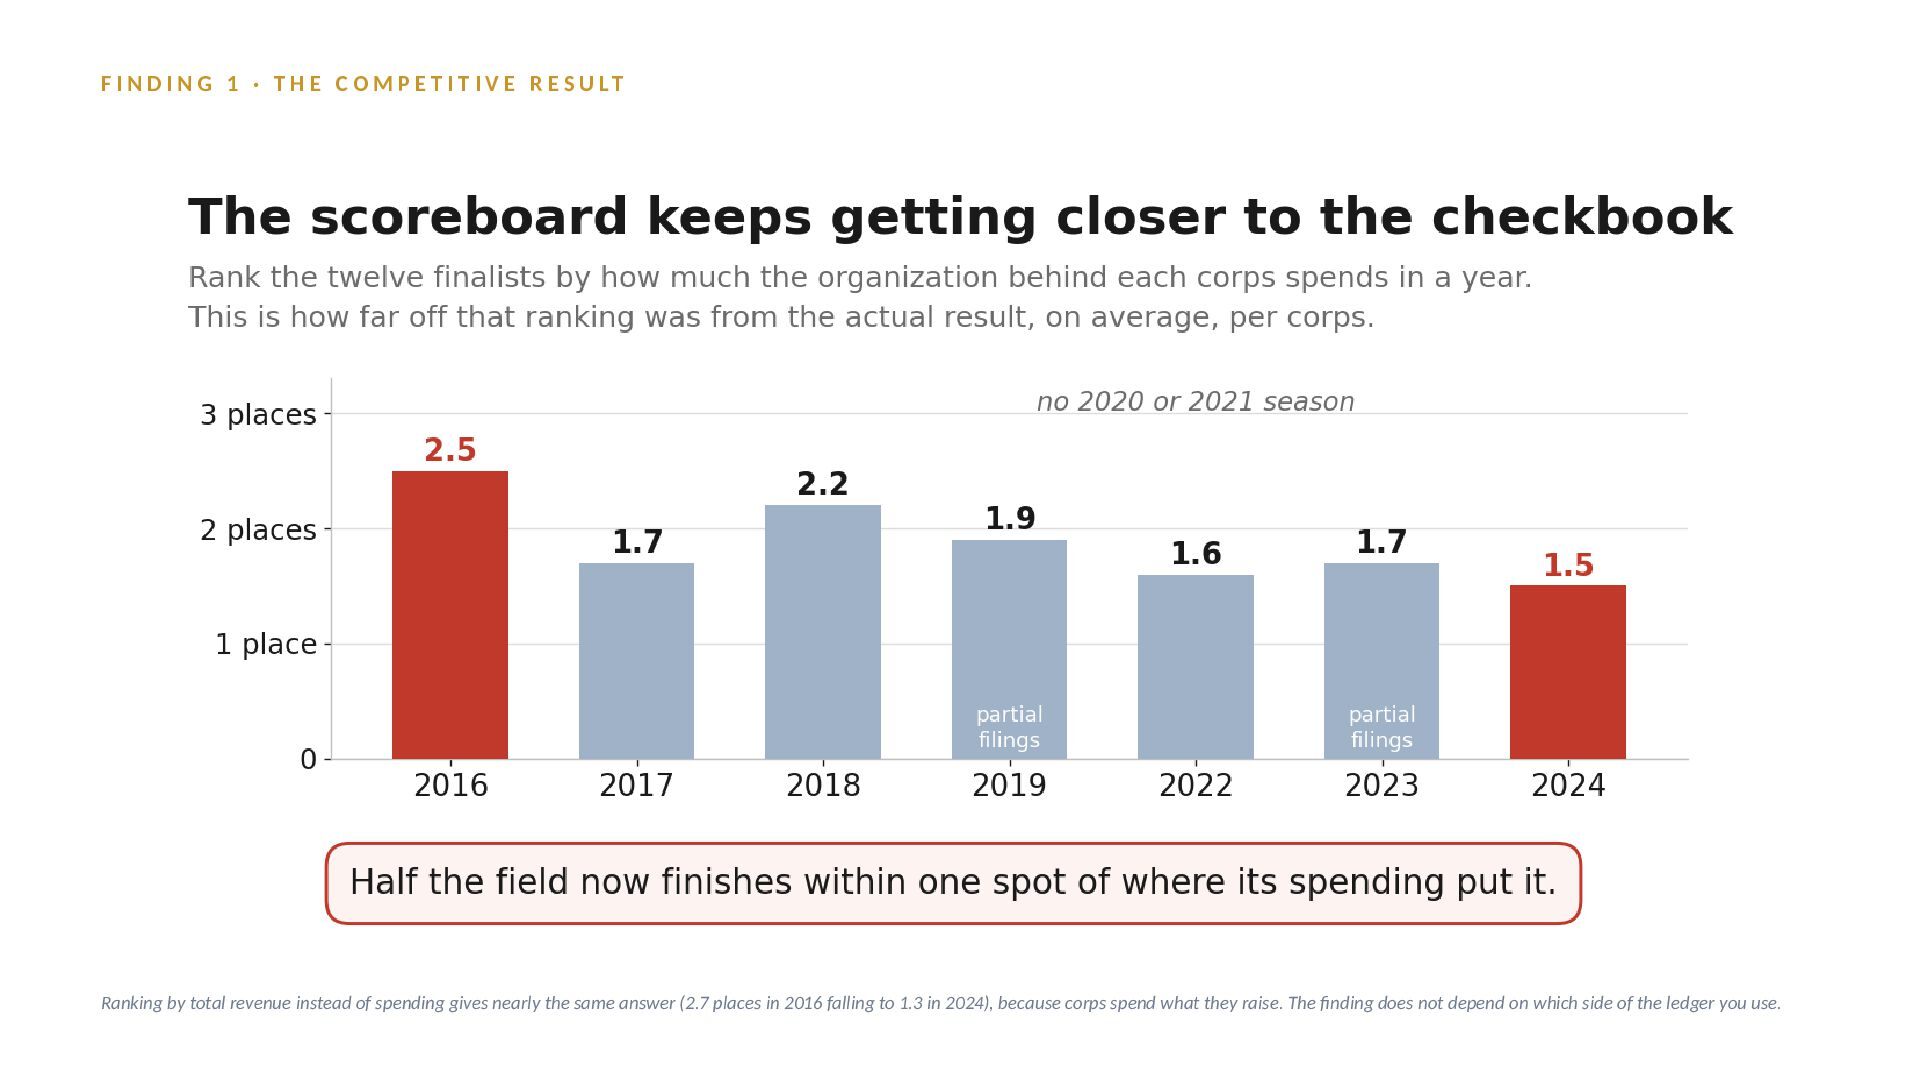
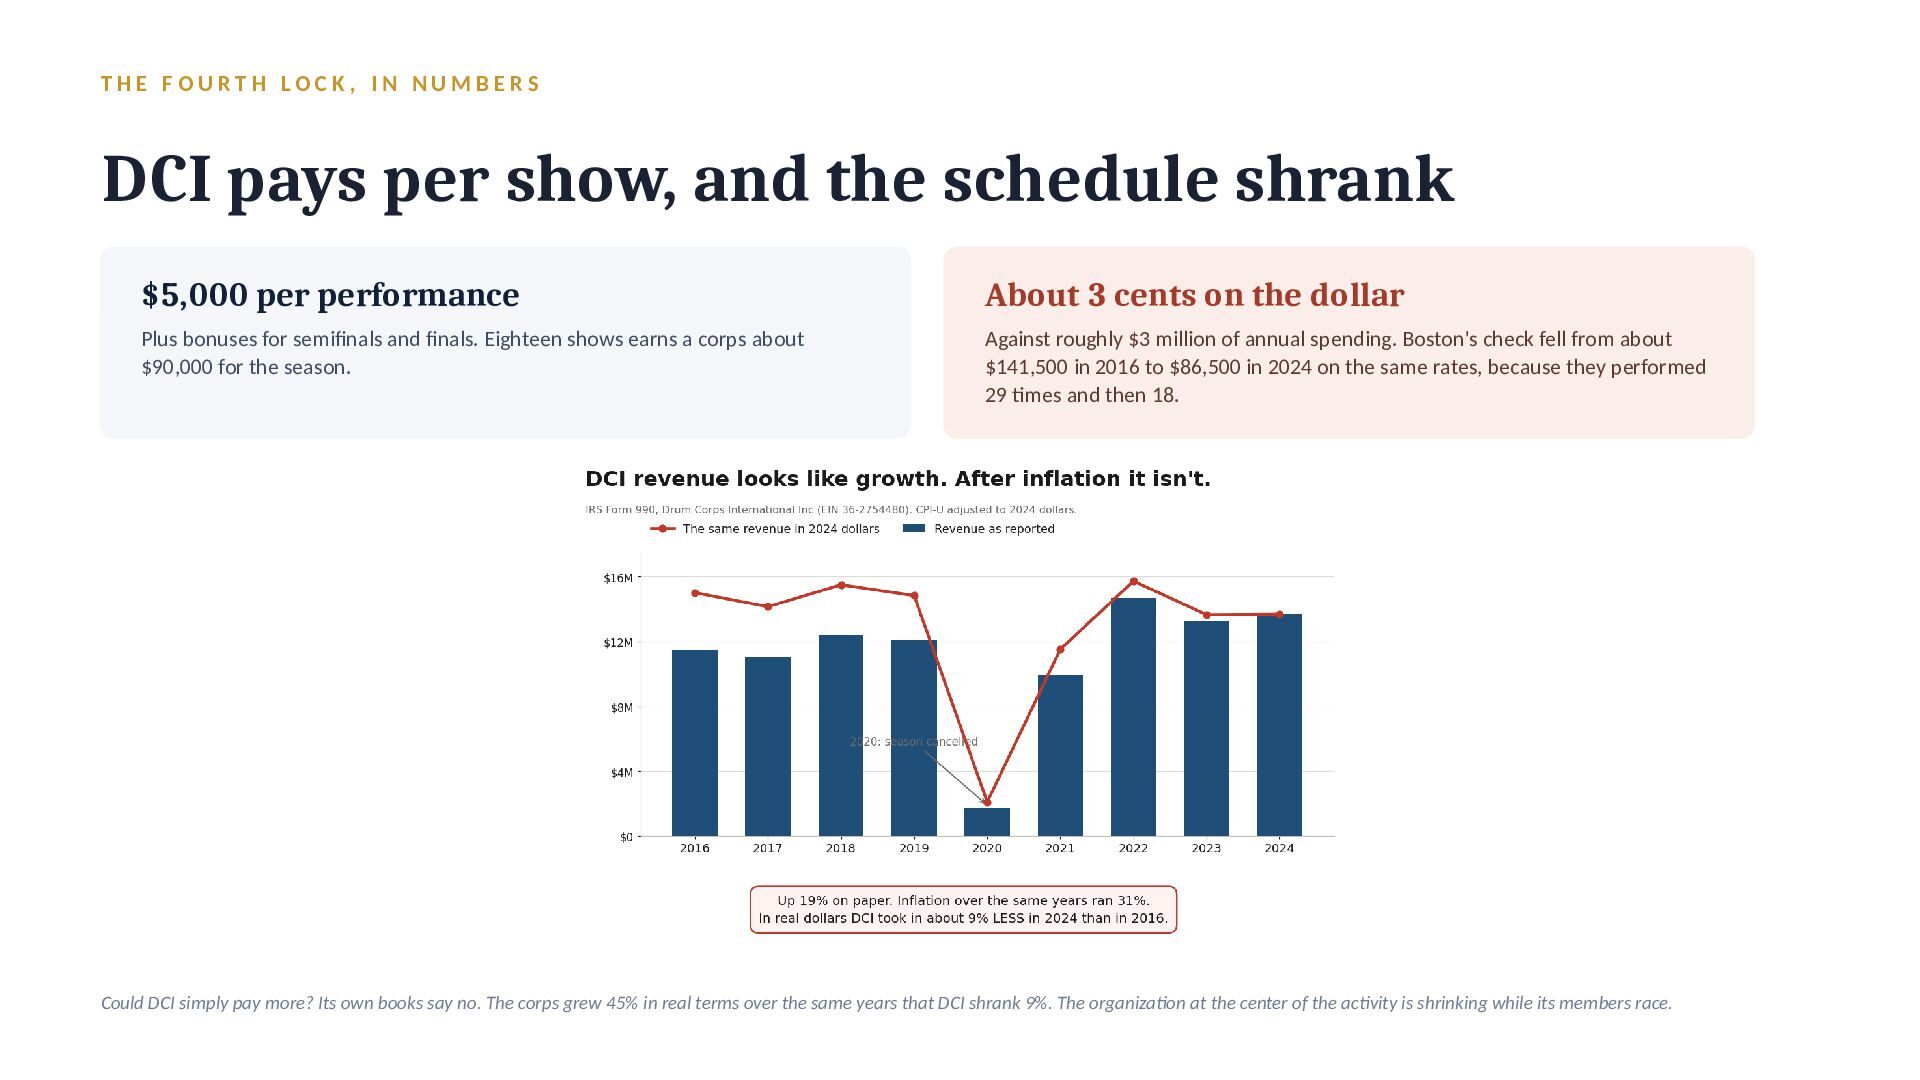
    G U M E N T, U P F R O N T Four findings and one gap 2.5 → 1.5 +45% Money decides placement, more each year Competing costs far more, after inflation Rank the twelve finalists by what their organizations spend, compare to where they finished. The ranking missed by 2.5 places per corps in 2016 and 1.5 in 2024. Spending grew about 89% in plain dollars against 31% inflation. Real increase around 45% in eight years. 3x −9% For a third fewer performances The governing body is shrinking The season got shorter and performances fell by more than a third. Spending rose anyway, so the cost of putting one show on the field roughly tripled. DCI took in about 9% less in 2024 than 2016 after inflation, with about 74 cents of every dollar coming from ticket sales. The gap: this is a structural money problem that no single corps can solve, that no rule requires anyone to own, and that nobody can currently measure well enough to argue about productively.
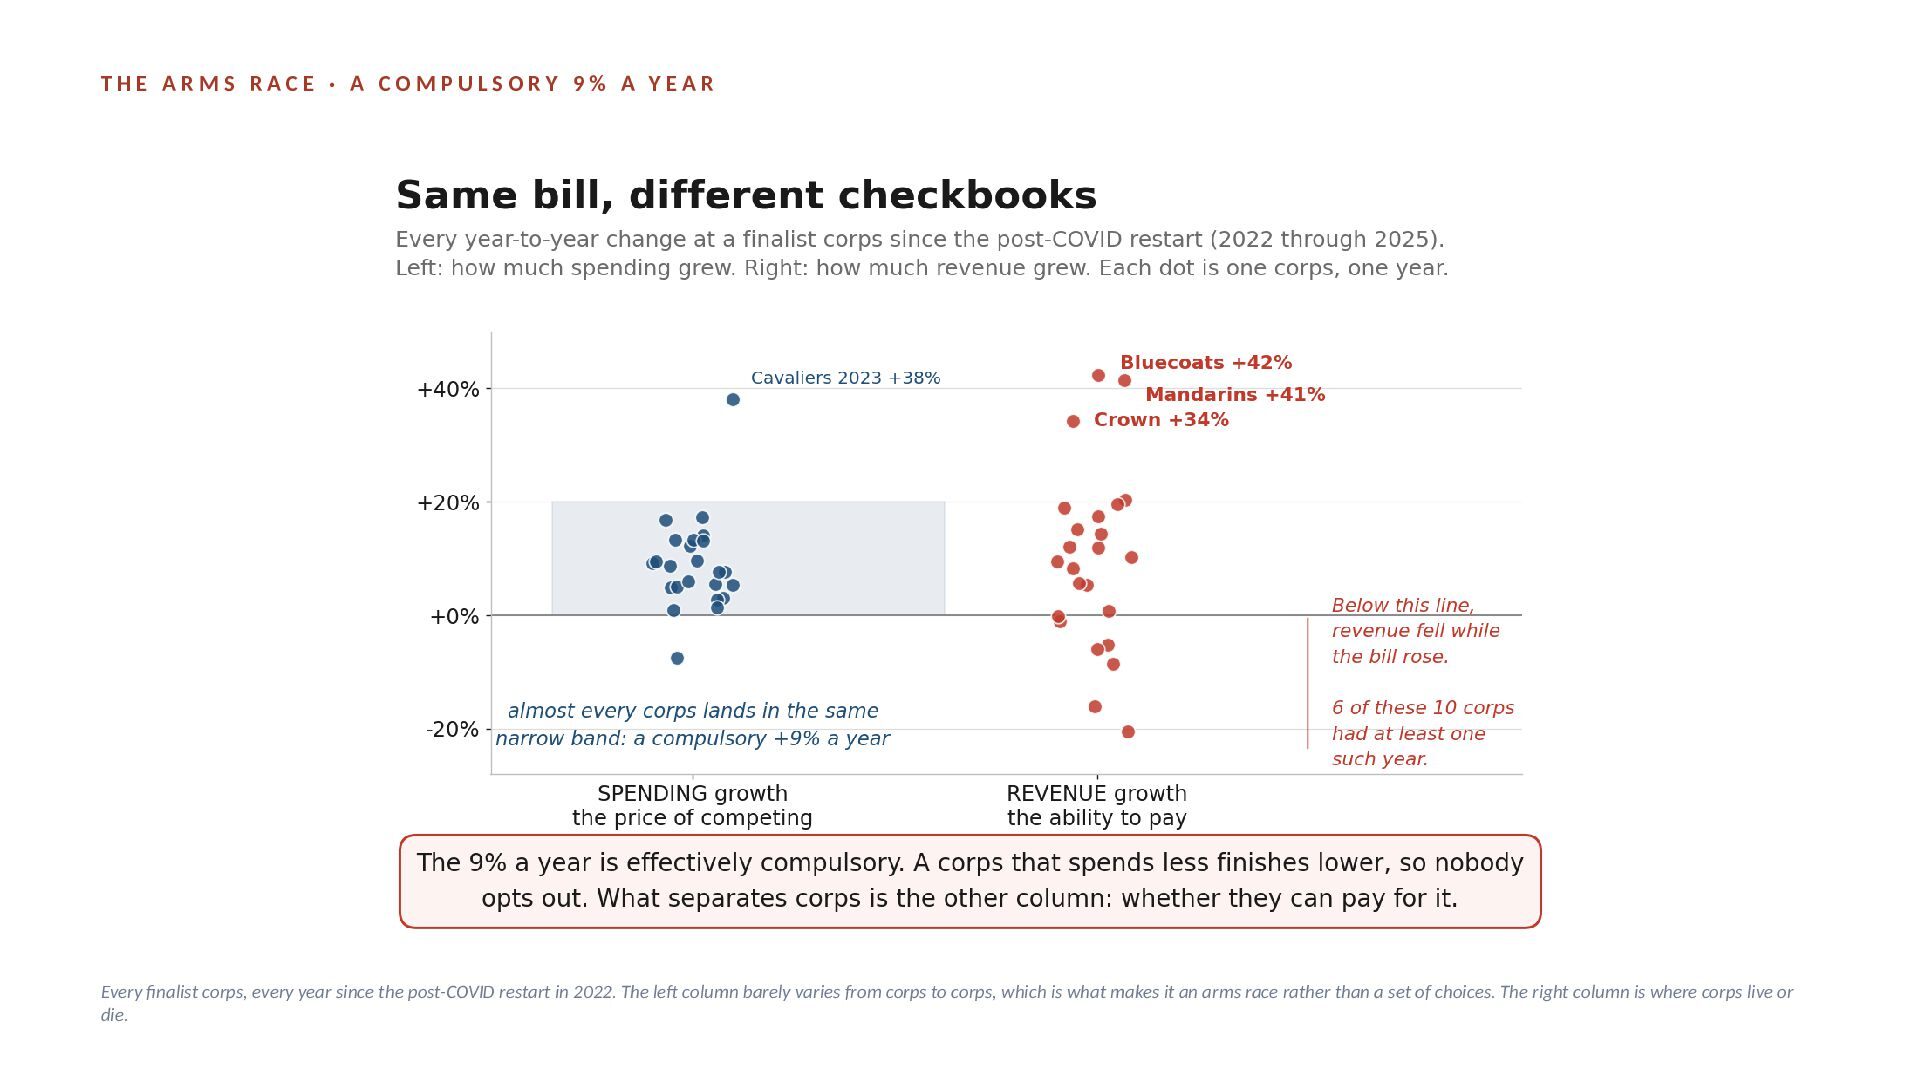
  3. THE ARMS RACE · A COMPULSORY 9% A YEAR Every

    finalist corps, every year since the post-COVID restart in 2022. The left column barely varies from corps to corps, which is what makes it an arms race rather than a set of choices. The right column is where corps live or die.
  4. F I N D I N G 1 · T

    H E C O M P E T I T I V E R E S U LT Ranking by total revenue instead of spending gives nearly the same answer (2.7 places in 2016 falling to 1.3 in 2024), because corps spend what they raise. The finding does not depend on which side of the ledger you use.
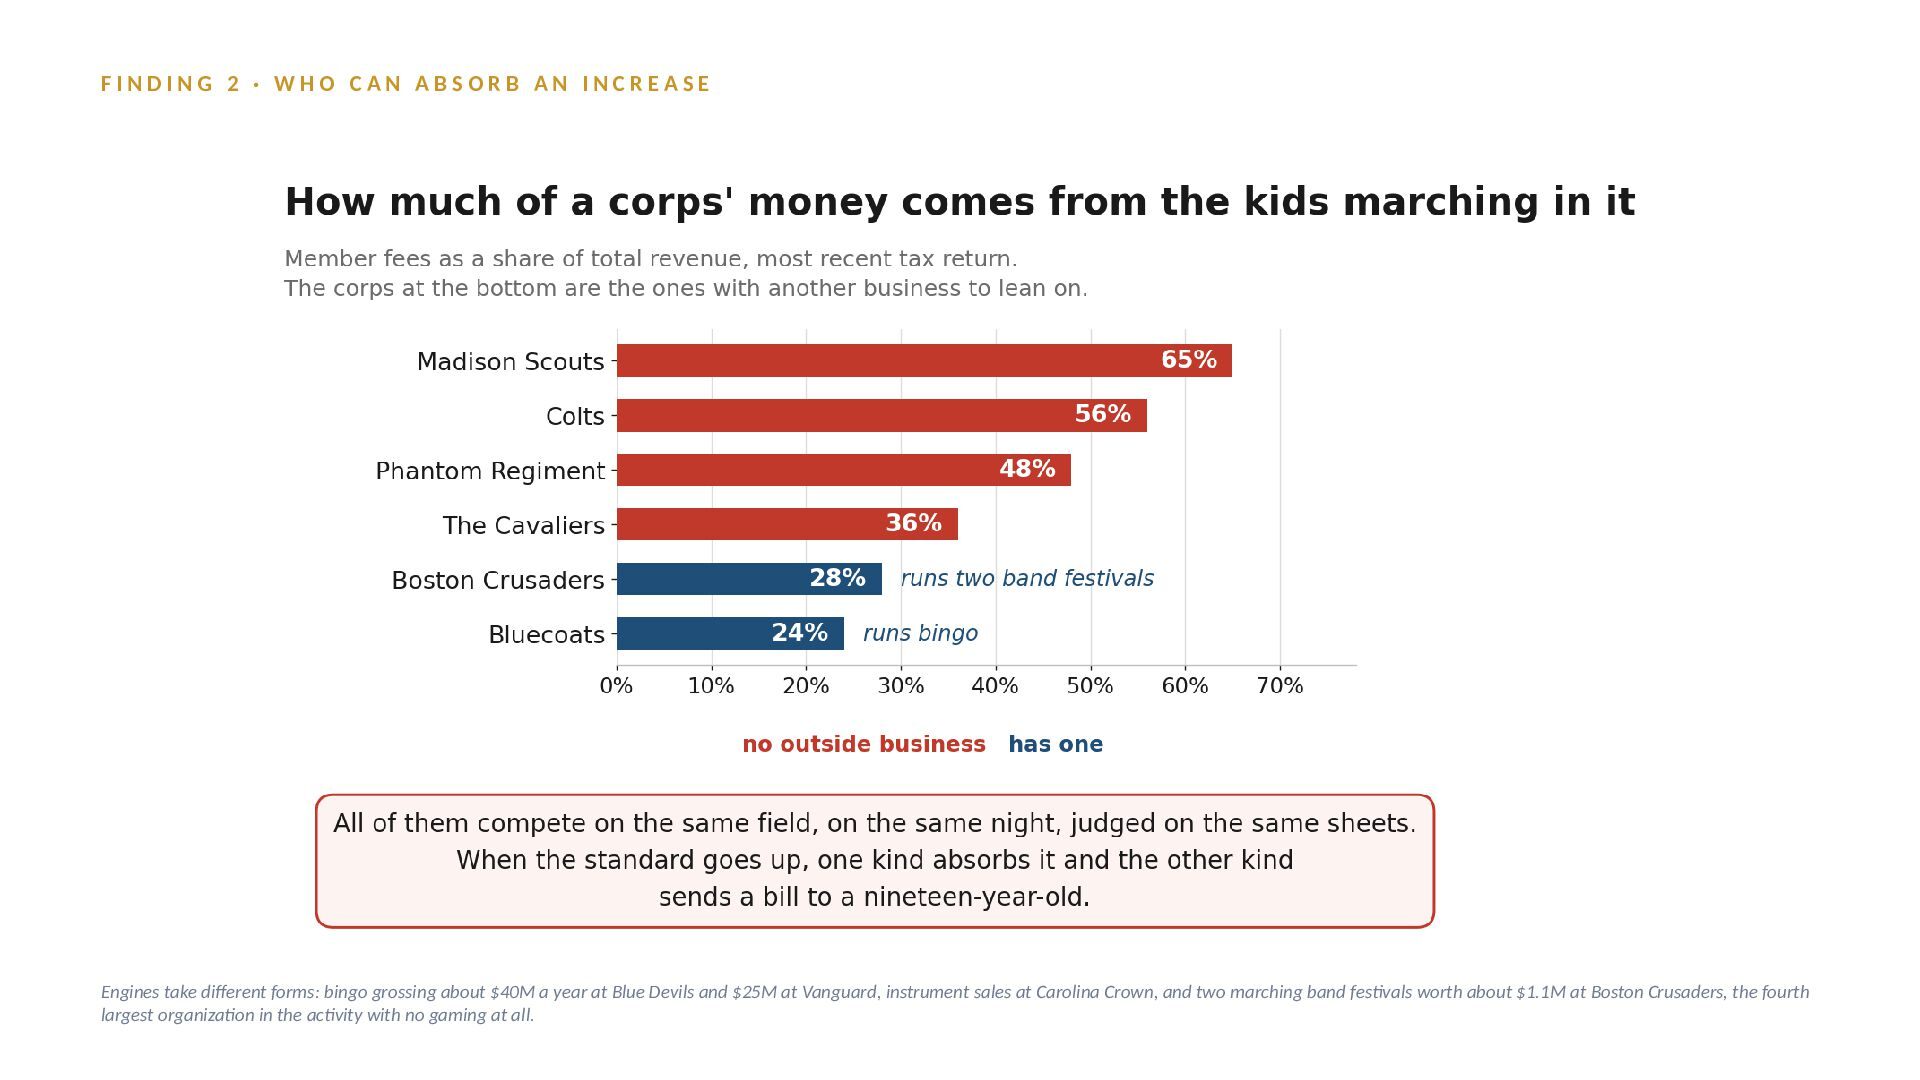
  5. FINDING 2 · WHO CAN ABSORB AN INCREASE Engines take

    different forms: bingo grossing about $40M a year at Blue Devils and $25M at Vanguard, instrument sales at Carolina Crown, and two marching band festivals worth about $1.1M at Boston Crusaders, the fourth largest organization in the activity with no gaming at all.
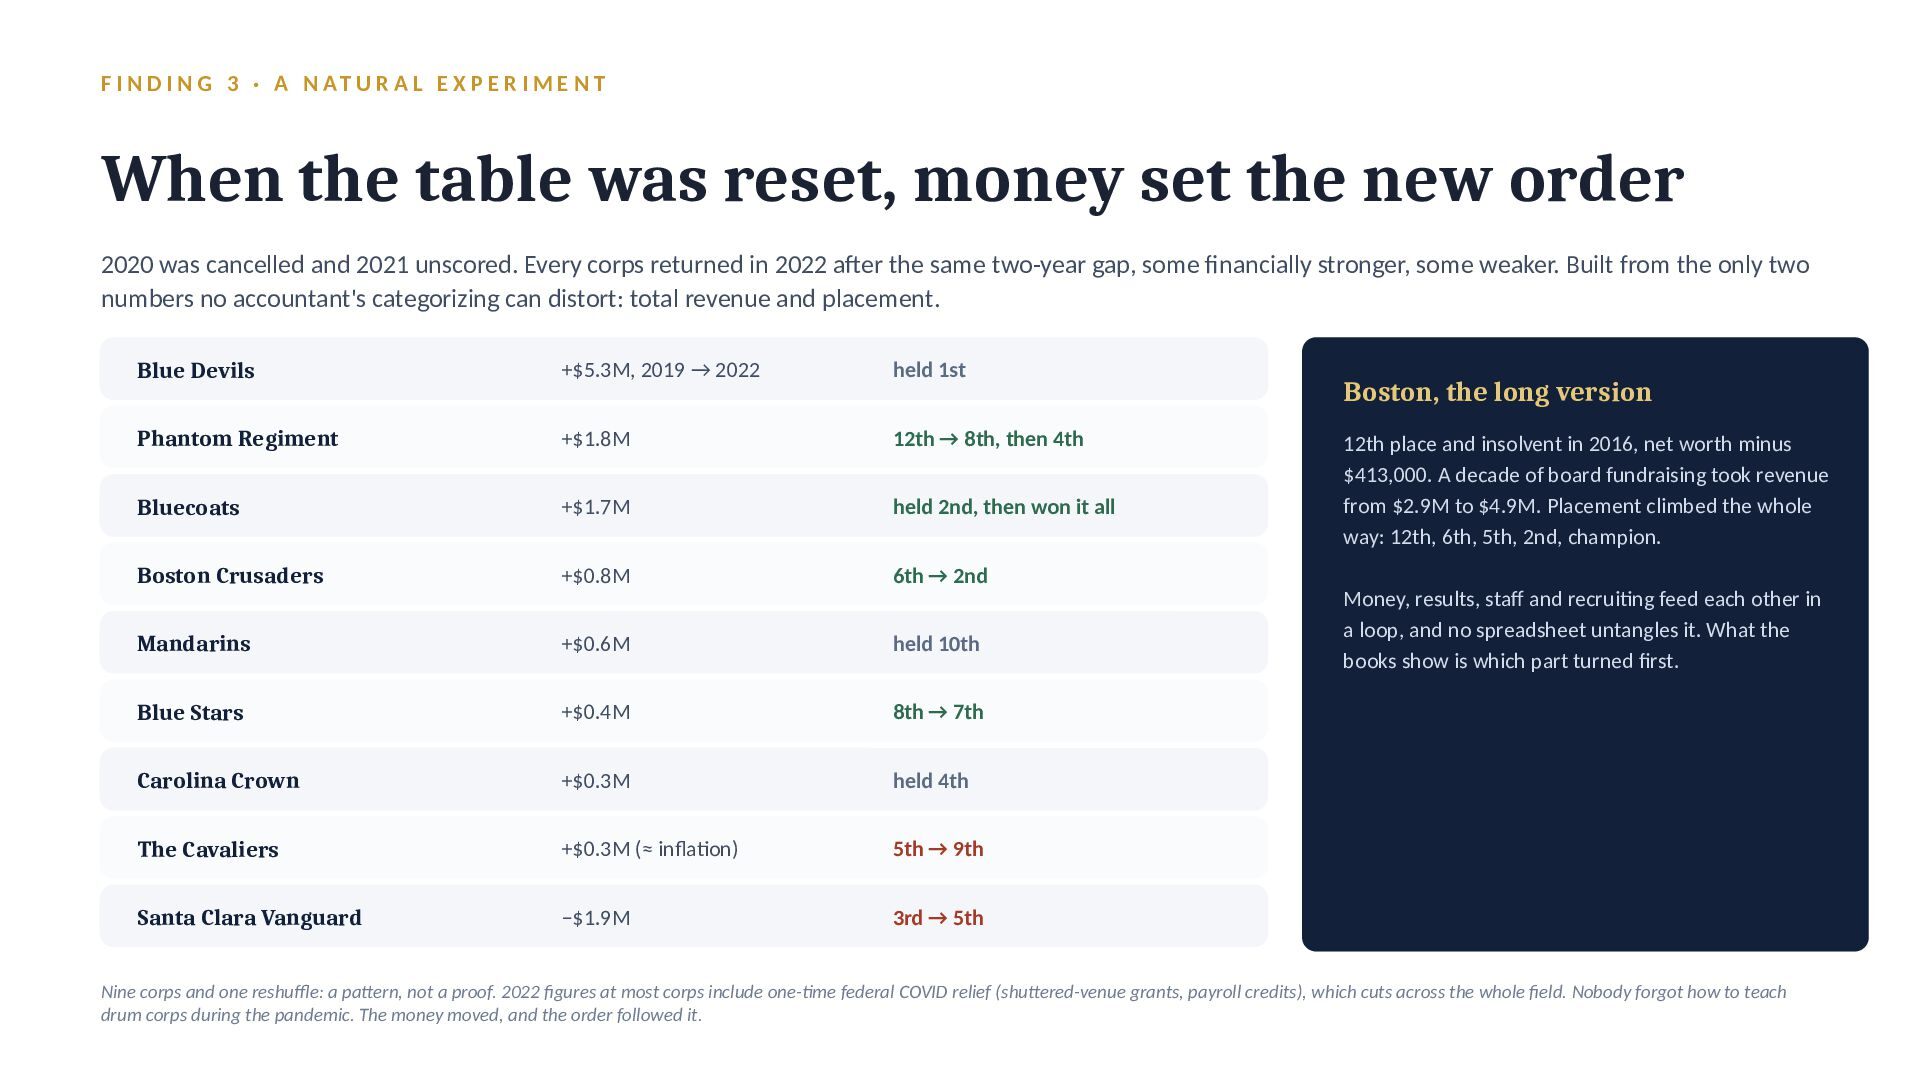
  6. F I N D I N G 3 · A

    N AT U R A L E X P E R I M E N T When the table was reset, money set the new order 2020 was cancelled and 2021 unscored. Every corps returned in 2022 after the same two-year gap, some financially stronger, some weaker. Built from the only two numbers no accountant's categorizing can distort: total revenue and placement. Blue Devils +$5.3M, 2019 → 2022 held 1st Phantom Regiment +$1.8M 12th → 8th, then 4th Bluecoats +$1.7M held 2nd, then won it all Boston Crusaders +$0.8M 6th → 2nd Mandarins +$0.6M held 10th Blue Stars +$0.4M 8th → 7th Carolina Crown +$0.3M held 4th The Cavaliers +$0.3M (≈ inflation) 5th → 9th Santa Clara Vanguard −$1.9M 3rd → 5th Boston, the long version 12th place and insolvent in 2016, net worth minus $413,000. A decade of board fundraising took revenue from $2.9M to $4.9M. Placement climbed the whole way: 12th, 6th, 5th, 2nd, champion. Money, results, staff and recruiting feed each other in a loop, and no spreadsheet untangles it. What the books show is which part turned first. Nine corps and one reshuffle: a pattern, not a proof. 2022 figures at most corps include one-time federal COVID relief (shuttered-venue grants, payroll credits), which cuts across the whole field. Nobody forgot how to teach drum corps during the pandemic. The money moved, and the order followed it.
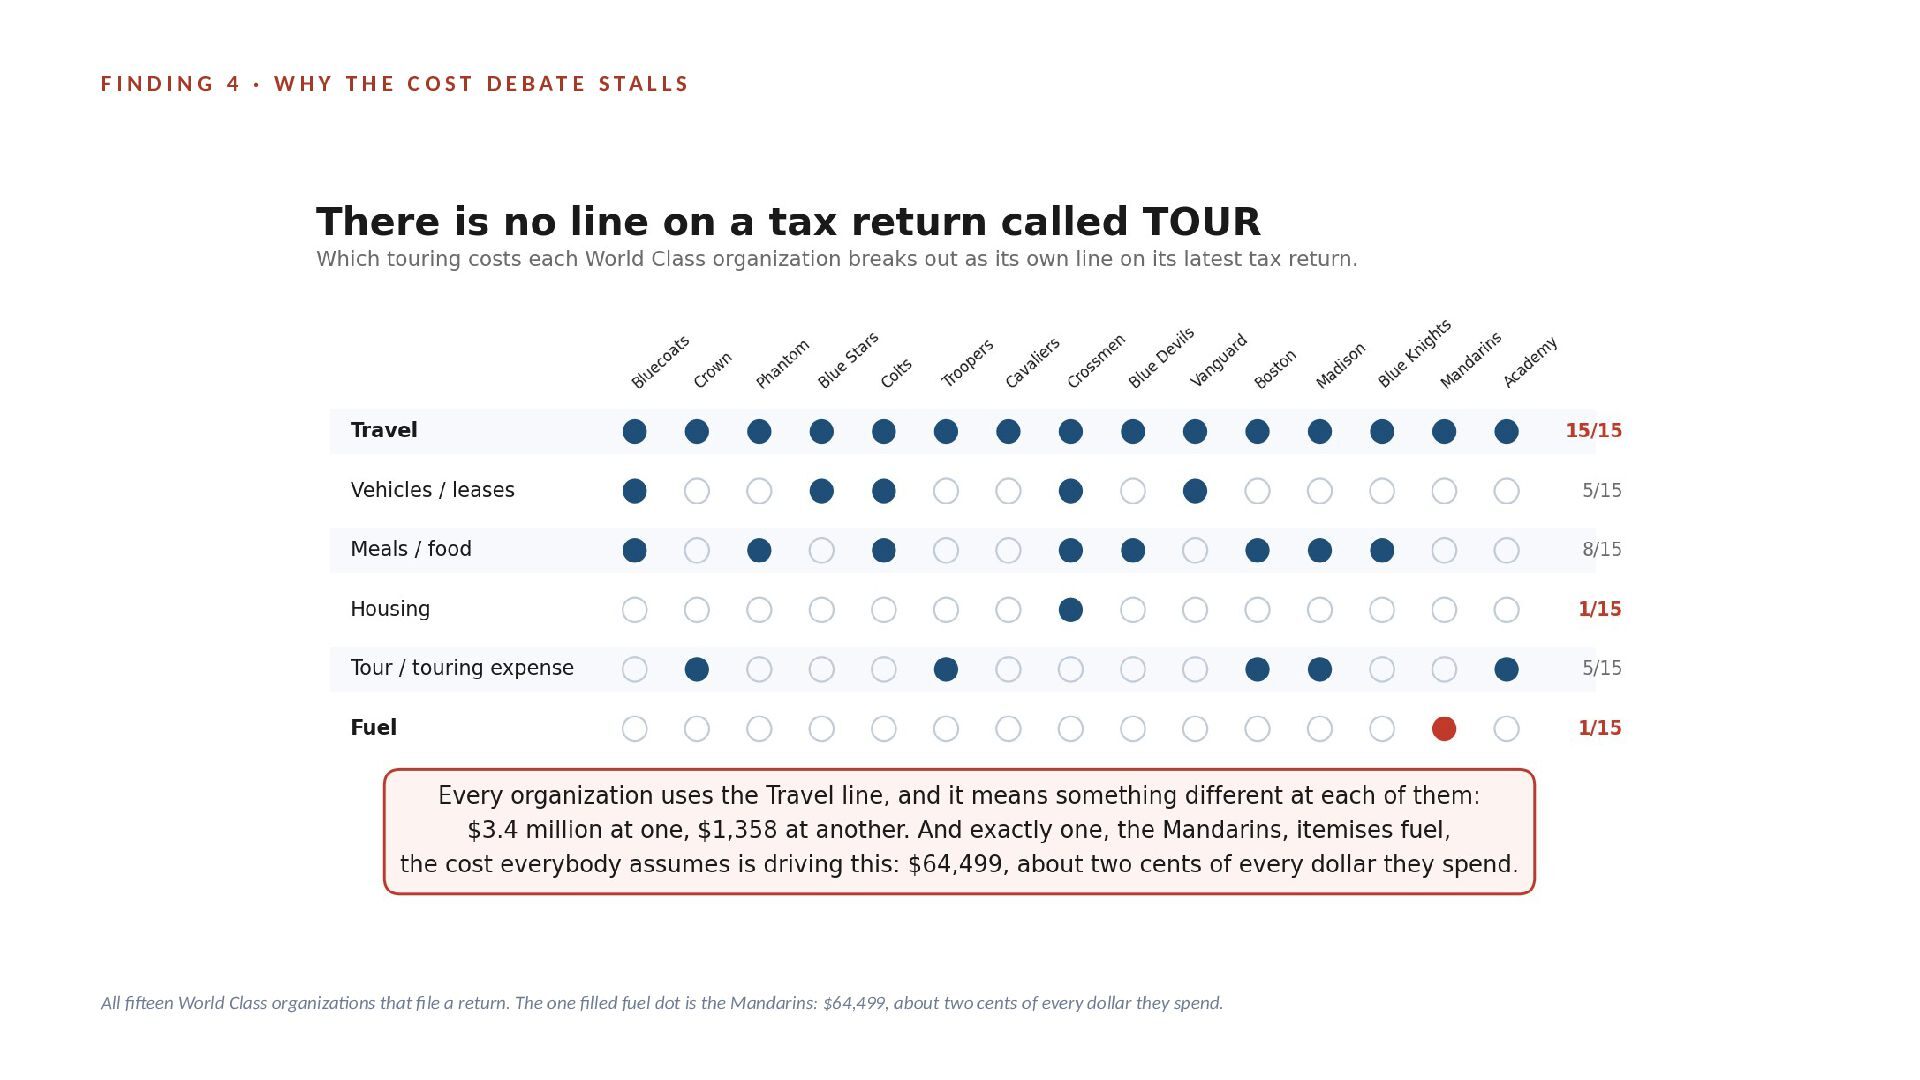
  7. F I N D I N G 4 · W

    H Y T H E C O S T D E B AT E S TA L L S All fifteen World Class organizations that file a return. The one filled fuel dot is the Mandarins: $64,499, about two cents of every dollar they spend.
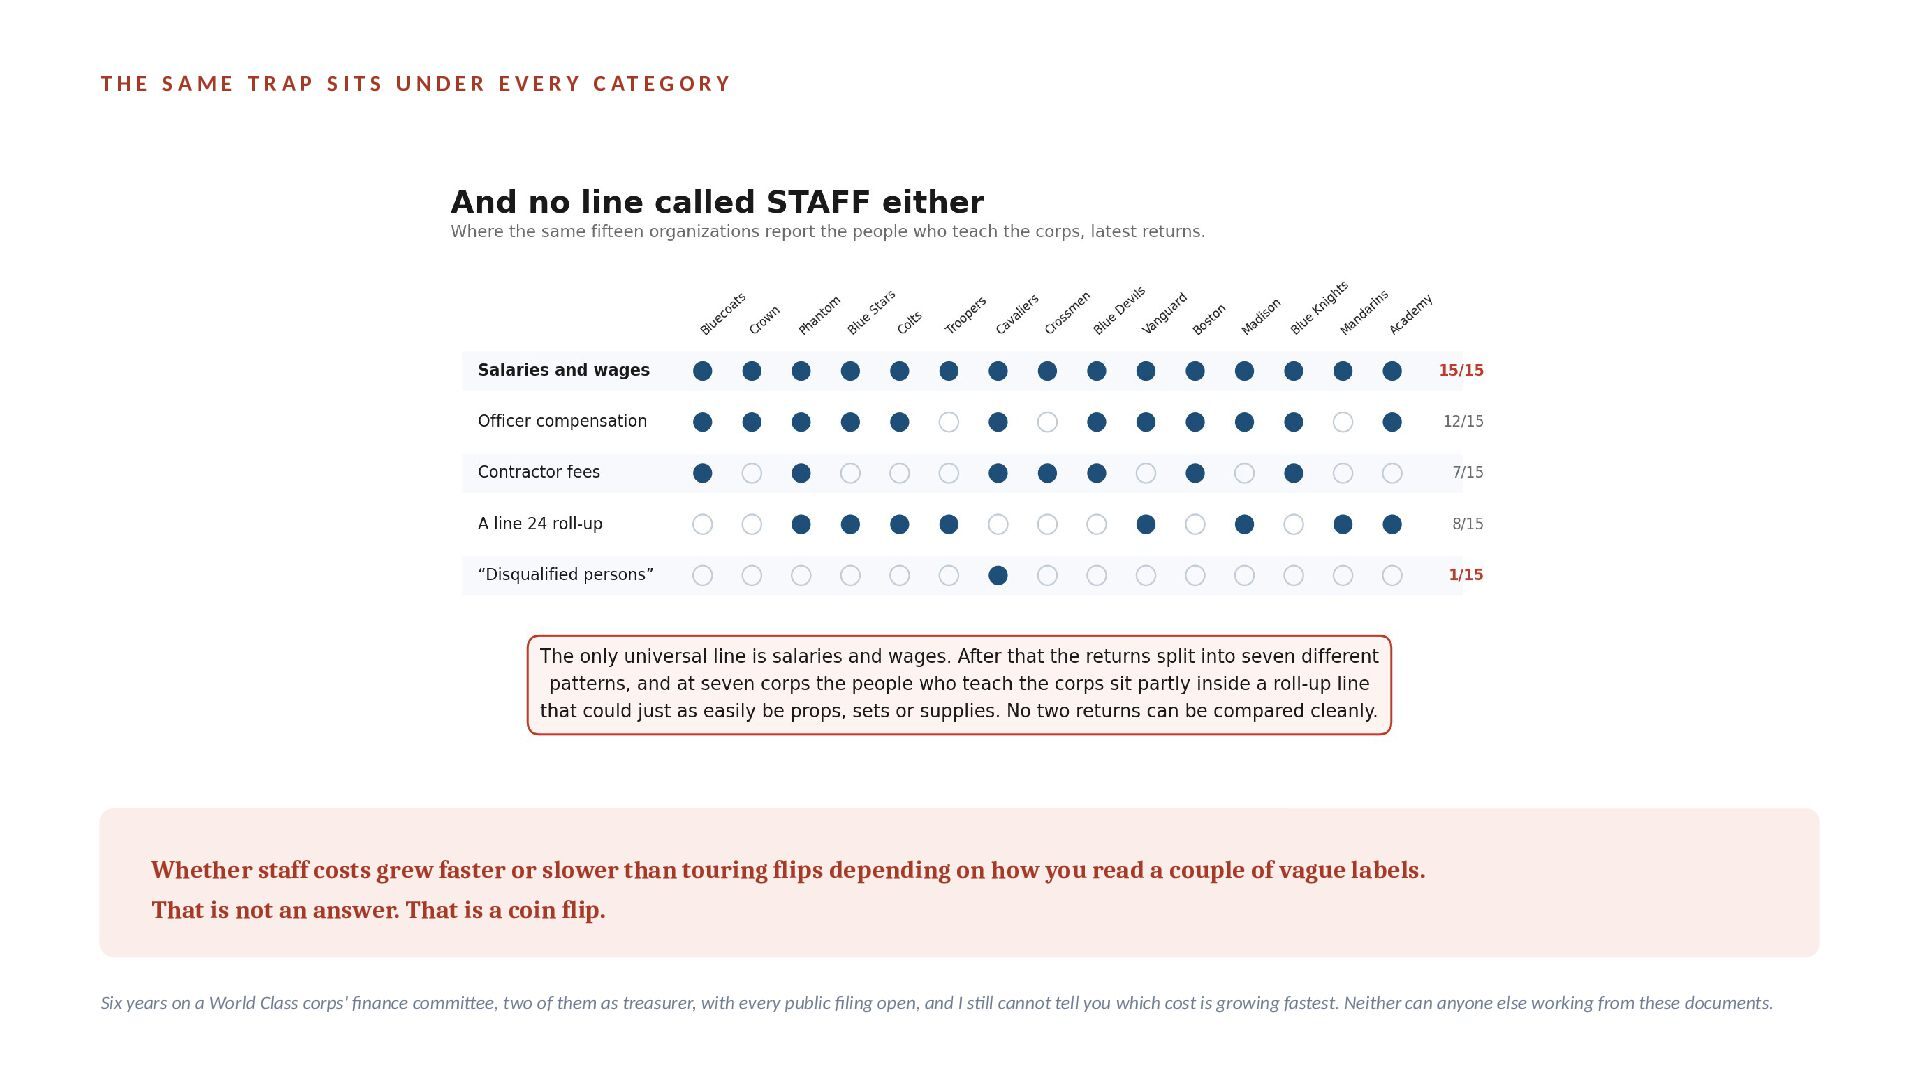
  8. T H E S A M E T R A

    P S I T S U N D E R E V E R Y C AT E G O R Y Whether staff costs grew faster or slower than touring flips depending on how you read a couple of vague labels. That is not an answer. That is a coin flip. Six years on a World Class corps' finance committee, two of them as treasurer, with every public filing open, and I still cannot tell you which cost is growing fastest. Neither can anyone else working from these documents.
  9. F O U R F E AT U R E

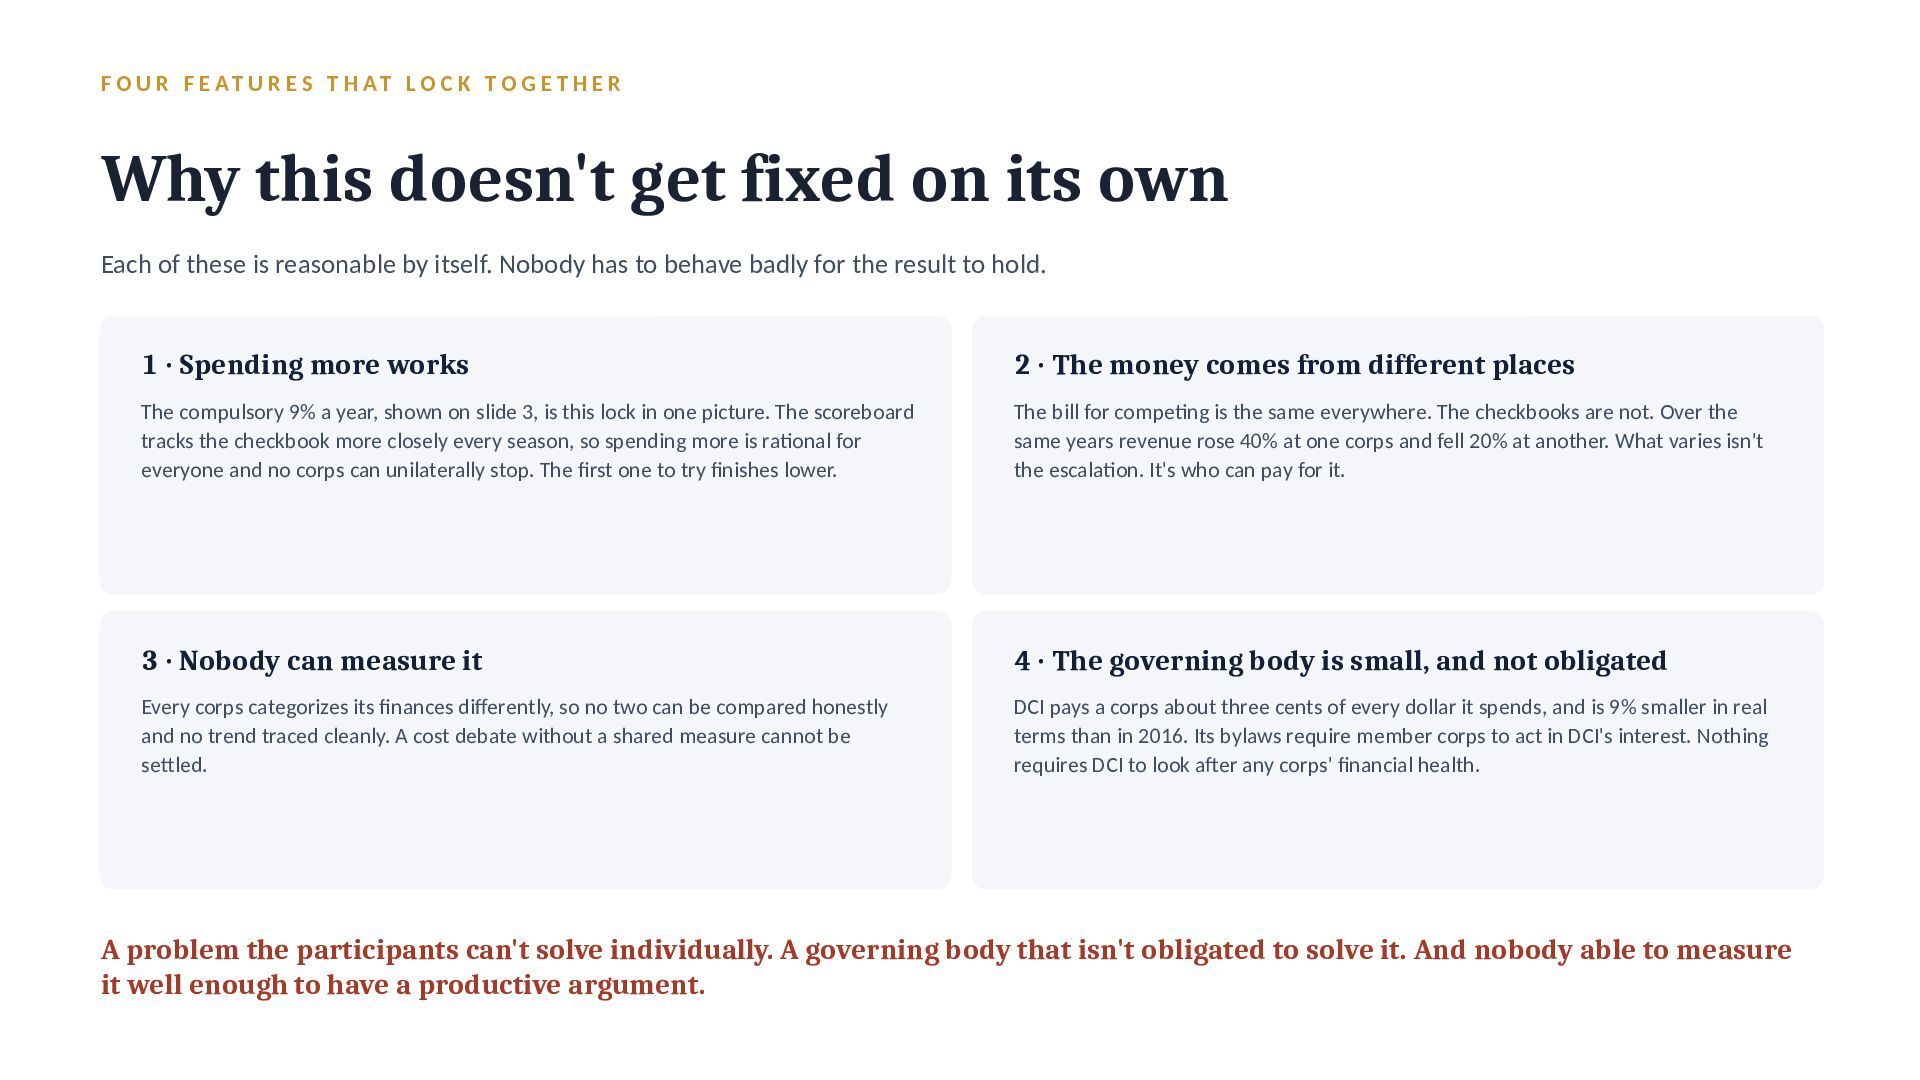
    S T H AT L O C K T O G E T H E R Why this doesn't get fixed on its own Each of these is reasonable by itself. Nobody has to behave badly for the result to hold. 1 · Spending more works 2 · The money comes from different places The compulsory 9% a year, shown on slide 3, is this lock in one picture. The scoreboard tracks the checkbook more closely every season, so spending more is rational for everyone and no corps can unilaterally stop. The first one to try finishes lower. The bill for competing is the same everywhere. The checkbooks are not. Over the same years revenue rose 40% at one corps and fell 20% at another. What varies isn't the escalation. It's who can pay for it. 3 · Nobody can measure it 4 · The governing body is small, and not obligated Every corps categorizes its finances differently, so no two can be compared honestly and no trend traced cleanly. A cost debate without a shared measure cannot be settled. DCI pays a corps about three cents of every dollar it spends, and is 9% smaller in real terms than in 2016. Its bylaws require member corps to act in DCI's interest. Nothing requires DCI to look after any corps' financial health. A problem the participants can't solve individually. A governing body that isn't obligated to solve it. And nobody able to measure it well enough to have a productive argument.
  10. THE FOURTH LOCK, IN NUMBERS DCI pays per show, and

    the schedule shrank $5,000 per performance About 3 cents on the dollar Plus bonuses for semifinals and finals. Eighteen shows earns a corps about $90,000 for the season. Against roughly $3 million of annual spending. Boston's check fell from about $141,500 in 2016 to $86,500 in 2024 on the same rates, because they performed 29 times and then 18. Could DCI simply pay more? Its own books say no. The corps grew 45% in real terms over the same years that DCI shrank 9%. The organization at the center of the activity is shrinking while its members race.
  11. T H R E E T H I N G

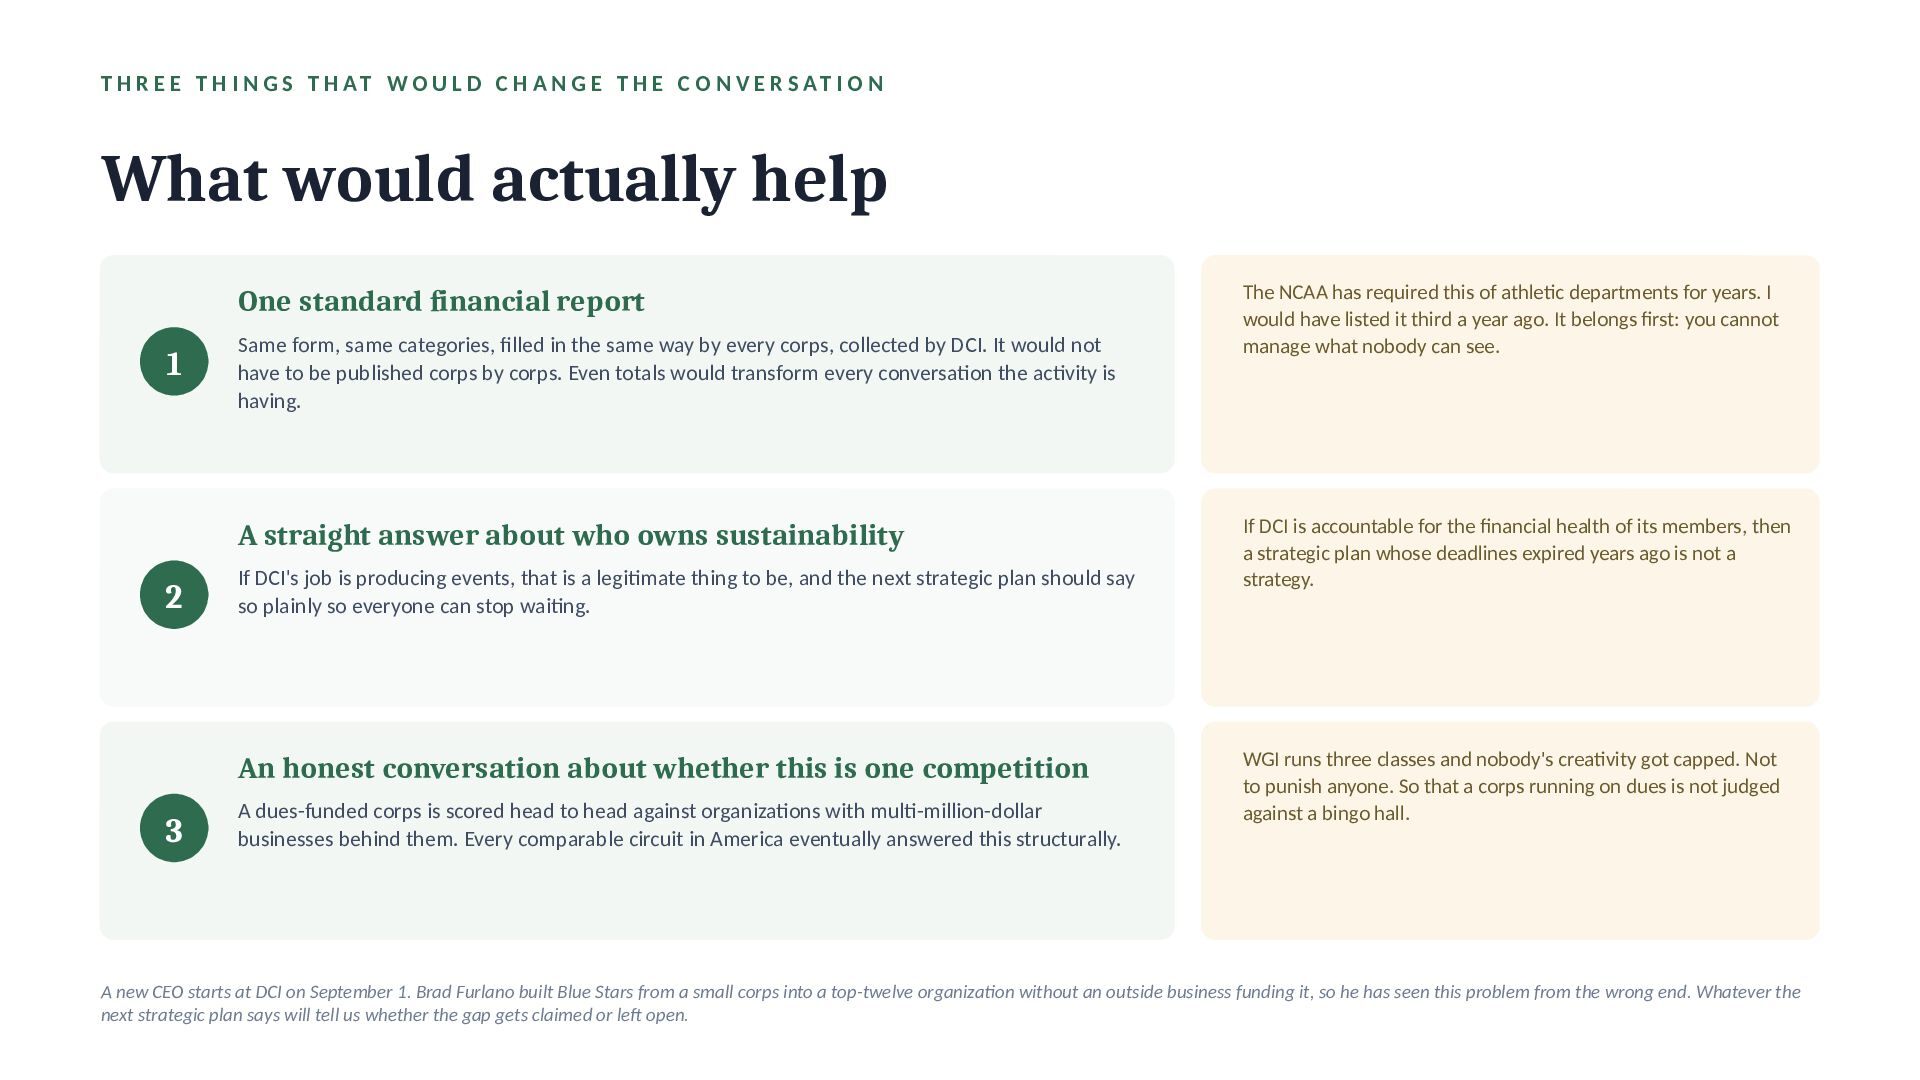
    S T H AT W O U L D C H A N G E T H E C O N V E R S AT I O N What would actually help One standard financial report 1 Same form, same categories, filled in the same way by every corps, collected by DCI. It would not have to be published corps by corps. Even totals would transform every conversation the activity is having. A straight answer about who owns sustainability 2 If DCI's job is producing events, that is a legitimate thing to be, and the next strategic plan should say so plainly so everyone can stop waiting. An honest conversation about whether this is one competition 3 A dues-funded corps is scored head to head against organizations with multi-million-dollar businesses behind them. Every comparable circuit in America eventually answered this structurally. The NCAA has required this of athletic departments for years. I would have listed it third a year ago. It belongs first: you cannot manage what nobody can see. If DCI is accountable for the financial health of its members, then a strategic plan whose deadlines expired years ago is not a strategy. WGI runs three classes and nobody's creativity got capped. Not to punish anyone. So that a corps running on dues is not judged against a bingo hall. A new CEO starts at DCI on September 1. Brad Furlano built Blue Stars from a small corps into a top-twelve organization without an outside business funding it, so he has seen this problem from the wrong end. Whatever the next strategic plan says will tell us whether the gap gets claimed or left open.
  12. THE HONEST LIMITS OF THIS WORK What I still don't

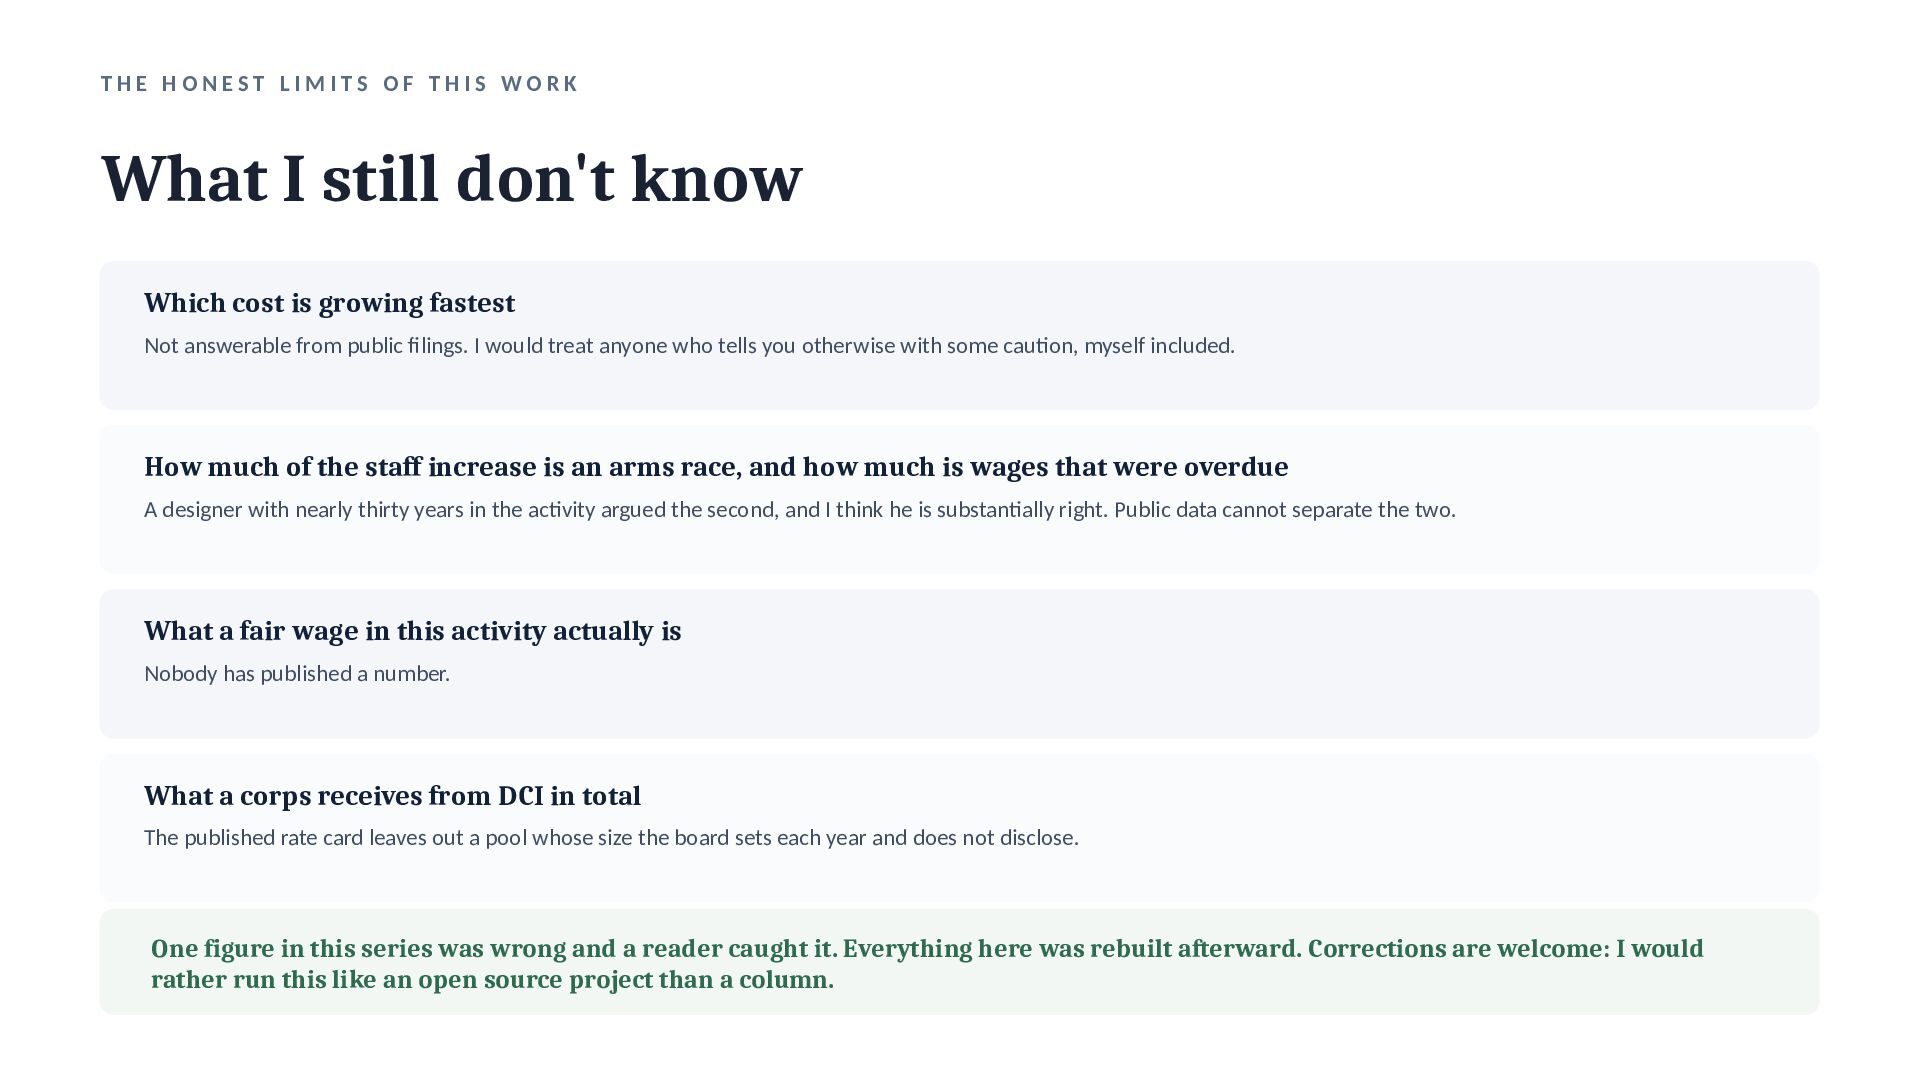
    know Which cost is growing fastest Not answerable from public filings. I would treat anyone who tells you otherwise with some caution, myself included. How much of the staff increase is an arms race, and how much is wages that were overdue A designer with nearly thirty years in the activity argued the second, and I think he is substantially right. Public data cannot separate the two. What a fair wage in this activity actually is Nobody has published a number. What a corps receives from DCI in total The published rate card leaves out a pool whose size the board sets each year and does not disclose. One figure in this series was wrong and a reader caught it. Everything here was rebuilt afterward. Corrections are welcome: I would rather run this like an open source project than a column.
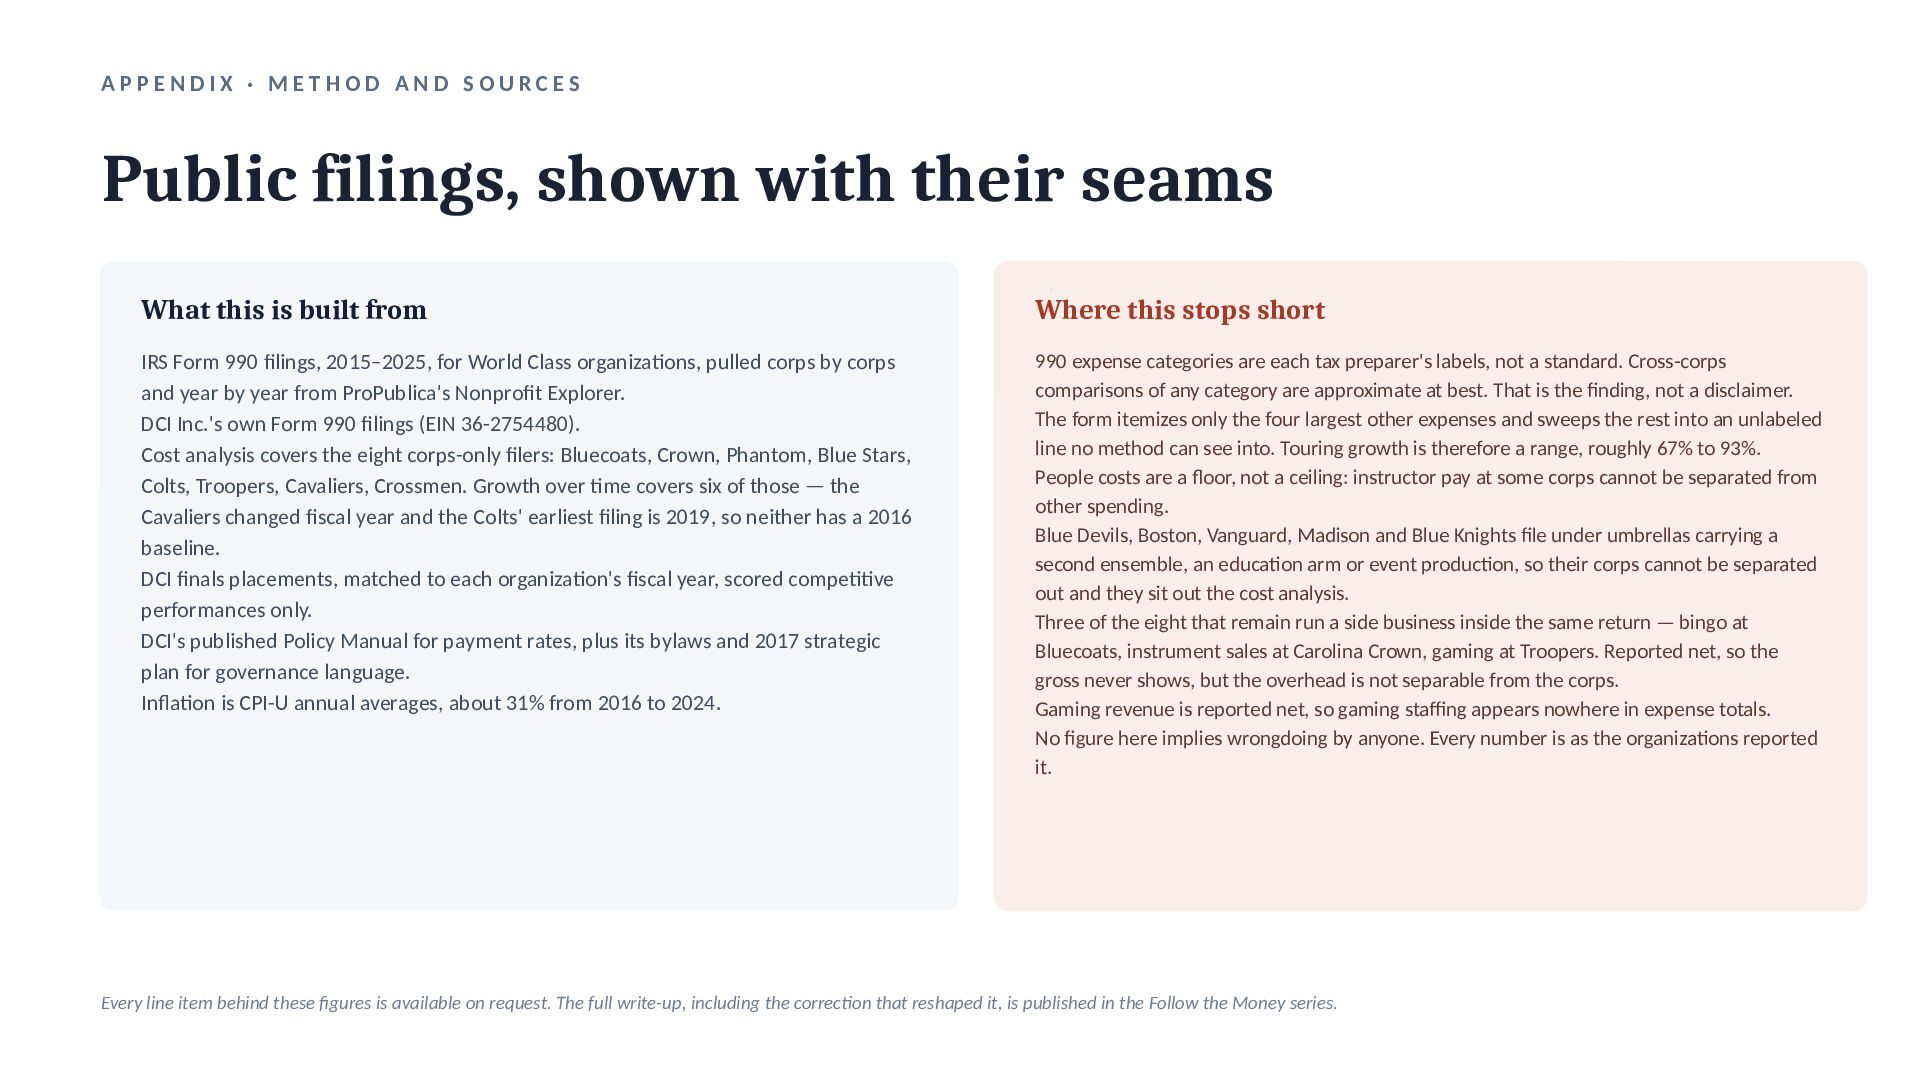
  13. APPENDIX · METHOD AND SOURCES Public filings, shown with their

    seams What this is built from Where this stops short IRS Form 990 filings, 2015–2025, for World Class organizations, pulled corps by corps and year by year from ProPublica's Nonprofit Explorer. DCI Inc.'s own Form 990 filings (EIN 36-2754480). Cost analysis covers the eight corps-only filers: Bluecoats, Crown, Phantom, Blue Stars, Colts, Troopers, Cavaliers, Crossmen. Growth over time covers six of those — the Cavaliers changed fiscal year and the Colts' earliest filing is 2019, so neither has a 2016 baseline. DCI finals placements, matched to each organization's fiscal year, scored competitive performances only. DCI's published Policy Manual for payment rates, plus its bylaws and 2017 strategic plan for governance language. Inflation is CPI-U annual averages, about 31% from 2016 to 2024. 990 expense categories are each tax preparer's labels, not a standard. Cross-corps comparisons of any category are approximate at best. That is the finding, not a disclaimer. The form itemizes only the four largest other expenses and sweeps the rest into an unlabeled line no method can see into. Touring growth is therefore a range, roughly 67% to 93%. People costs are a floor, not a ceiling: instructor pay at some corps cannot be separated from other spending. Blue Devils, Boston, Vanguard, Madison and Blue Knights file under umbrellas carrying a second ensemble, an education arm or event production, so their corps cannot be separated out and they sit out the cost analysis. Three of the eight that remain run a side business inside the same return — bingo at Bluecoats, instrument sales at Carolina Crown, gaming at Troopers. Reported net, so the gross never shows, but the overhead is not separable from the corps. Gaming revenue is reported net, so gaming staffing appears nowhere in expense totals. No figure here implies wrongdoing by anyone. Every number is as the organizations reported it. Every line item behind these figures is available on request. The full write-up, including the correction that reshaped it, is published in the Follow the Money series.