Upgrade to Pro — share decks privately, control downloads, hide ads and more …

Why Hunger Amidst Plenty?

Jess Fanzo
April 10, 2019

Why Hunger Amidst Plenty?

We are living in a complex world made up of multiple burdens of malnutrition. While the obstacles to address the burden are daunting for citizens, there are tools to solve it. We just need political will, global cooperation, and immediate action.

Jess Fanzo

April 10, 2019
Tweet

More Decks by Jess Fanzo

Other Decks in Research

Transcript

  1. Why Hunger Amidst Plenty? Jessica Fanzo, PhD Bloomberg Distinguished Associate

    Professor of Global Food & Agriculture Policy & Ethics Director of the Global Food Policy & Ethics Program
  2. The Punchline We are living in a complex world made

    up of multiple burdens of malnutrition. While the obstacles to address the burden are daunting for citizens, there are tools to solve it. We just need political will, global cooperation, and immediate action.
  3. Malnutrition in all its forms is universal and massive 149

    million children under five years of age are stunted 49.5 million children under five years of age are wasted 2.1 billion adults are overweight or obese 40 million children under five years of age are overweight Source: Development Initiatives: 2018 Global Nutrition Report; WHO/UNICEF/World Bank Group. Joint Malnutrition Estimates 2019 Globally, one person in three is malnourished today and one in two could be malnourished by 2030 if nothing is done. 821 million of the world’s population are undernourished 88% of countries face overlapping burdens
  4. New innovations in geospatial data shows it varies significantly within

    countries <10 ≥50 30 Prevalence, % 2000 2005 2010 2015 Prevalence of stunting in Africa
  5. World hunger is on the rise • For the third

    year in a row, there has been a rise in world hunger. • The absolute number of undernourished people has increased to nearly 821 million in 2017, from around 804 million in 2016. • These are levels from almost a decade ago. Source: FAO, IFAD, UNICEF, WFP and WHO. 2018. The State of Food Security and Nutrition in the World 2018. Building climate resilience for food security and nutrition. Rome, FAO.
  6. “Hidden” hunger remains significant but is shrouded in mystery ?

    ? ? ? ? ? ? ? It’s often cited that: “Over 2 billion people worldwide suffer from a chronic deficiency of micronutrients, a condition known as hidden hunger.” -- World Health Organisation, 2006 Yet we don’t know the state of micronutrient deficiencies in nutritionally vulnerable populations, such as children under five years of age, women and adolescent girls Source: Development Initiatives: 2018 Global Nutrition Report
  7. Adolescent and adult trends of overweight and obesity is increasing

    Source: Abarca-Gómez, L., Abdeen, Z.A., Hamid, Z.A., Abu-Rmeileh, N.M., Acosta- Cazares, B., Acuin, C., Adams, R.J., Aekplakorn, W., Afsana, K., Aguilar-Salinas, C.A. and Agyemang, C., 2017. Worldwide trends in body-mass index, underweight, overweight, and obesity from 1975 to 2016: a pooled analysis of 2416 population- based measurement studies in 128· 9 million children, adolescents, and adults. The Lancet, 390(10113), pp.2627-2642.
  8. The question remains, why? • Why do we still have

    hunger & undernutrition? • How did we get to this place of paradox: hunger & obesity? • What can we do about it?
  9. Poverty and the “P20” • The P20 are the 1.4

    billion men, women and children who are the poorest 20% of the global population. • The P20 account for 46% of all under five cases of stunting. Source: Development Initiatives 2017 P20 Baseline Report
  10. “Want to improve nutrition? Build a road.” • Rural infrastructure,

    notably transport, energy, irrigation and market infrastructure has been a driver of increased agriculture production (Qureshi et al 2015). • Public investment in secondary road infrastructure was a major determinant of agricultural and rural development and poverty reduction in China (Fan and Chan-Kang 2008). • In India, there were high returns with rural road development in both irrigated and rainfed farming systems (but varied by different farming systems) (Fan et al 2000). Source: Shively GE. Infrastructure mitigates the sensitivity of child growth to local agriculture and rainfall in Nepal and Uganda. Proceedings of the National Academy of Sciences. 2017 Jan 31;114(5):903-8; Qureshi ME, Dixon J, Wood M. Public policies for improving food and nutrition security at different scales. Food Security. 2015 Apr 1;7(2):393-403. Children with higher linear growth and weight gain correlated with greater road and health facility densities, better water sources, more proximate agricultural markets, and greater public grain storage capacity.
  11. Unstable, volatile markets exacerbate food insecurity 0.0 2.0 4.0 6.0

    8.0 10.0 12.0 USA Singapore United Kingdom Switzerland Canada Ireland Australia Austria Germany Denmark % Share of Consumer Expenditures on Food Countries in which consumers spend less than 15% of income on food expenditures 0 10 20 30 40 50 60 Turkmenistan Azerbaijan Guatemala Pakistan Philippines Algeria Kazakhstan Cameroon Kenya Nigeria % Share of Consumer Expenditures on Food Countries in which consumers spend more than 30% of income on food expenditures Source: UN HLPE 2017 Report on Nutrition and Food Systems
  12. Engel’s and Bennett’s Laws remain unfulfilled for many Sources: Semba,

    R.D., 2011. The Historical Evolution of Thought Regarding Multiple Micronutrient Nutrition–. The Journal of nutrition, 142(1), pp.143S-156S; WFP Fill the Nutrient Gap + FAO SOFI RAP 2018
  13. Climate change risks to us and the future planet Source:

    Ripple et al 2018 Bioscience; FAO SOFI report 2018 (Figure 25 page 55); Source: C. Holleman, F. Rembold and O. Crespo (forthcoming). The impact of climate variability and extremes on agriculture and food security: an analysis of the evidence and case studies. FAO Agricultural Development Economics Technical Study 4. Rome, FAO, for classification of countries with high and low exposure to climate extremes; FAO for data on prevalence of undernourishment.
  14. War and conflict don’t help Source: M. Lagi, K.Z. Bertrand

    and Y. Bar-Yam. 2011. The food crises and political instability in North Africa and the Middle East. Cambridge, USA, New England Complex Systems Institute. Produced from FAO 2017 SOFI report. Time dependence of FAO Food Price Index from January 2004 to May 2011. Red dotted vertical lines correspond to beginning dates of “food riots” and protests associated with the major recent unrest in North Africa and the Near East. Overall death toll in parentheses
  15. Harder to get from under with conflict Source: Hendrix C

    (2016) When Hunger Strikes: How Food Security Abroad Matters for National Security at Home. The Chicago Council on Global Affairs, Chicago USA; Global Nutrition Report 2017 Development Initiatives
  16. Intermittent starving despite potential food abundance Sources: Vaitla B, Devereux

    S, Swan SH (2009) Seasonal Hunger: A Neglected Problem with Proven Solutions. PLOS Medicine 6(6): e1000101. https://doi.org/10.1371/journal.pmed.1000101 Lipinski, B. et al. 2013. “Reducing Food Loss and Waste.” Working Paper, Installment 2 of Creating a Sustainable Food Future.Washington, DC: World Resources Institute. Seasonal Hunger Periods And at the same time, significant food loss and waste
  17. Urbanization, globalization, economic growth, technological changes for work, leisure, and

    food processing, mass media growth Source: Popkin and Drewnowski 1993; Crino et al 2016; Revised Fanzo et al 2017 Pattern 3 Receding famine, smallholder, rural • Low variety and diversity of foods • Low consumption of processed foods • Labor-intensive • Increased processed, packaged foods — high fat, sodium, sugar • Caloric beverages and alcohol • Shift in technology, less labor- intensive work and leisure Pattern 4 Modernized, rural, and more peri-urban, urban societies • Reduced highly processed foods • Increased fruit and vegetables • Still less labor-intensive work but increased physical activity for exercise Pattern 5 Educated, mainly urban Slow stunting decline, Slow mortality decline Stunting, Maternal and child Health deficiencies and MNDs Increased life expectancy but increased disability and NCDs Obesity emerges, Diet-related NCDs Extended lifespan, Reduced mortality due to NCDs Reduced obesity, Reduced diet-related NCDs Our lives are transforming…so are our diets and food systems
  18. Sources: United Nations, Department of Economic and Social Affairs, Population

    Division (2017); World Population Prospects: The 2017 Revision, Key Findings and Advance Tables. Working Paper No. ESA/P/WP/248. Much of that transition has to due to population growth & urbanization
  19. While we transform, so too do our food systems Source:

    FAO 2018 Sustainable food systems: Concept and framework. Brief developed by SP4 program. Rome, Italy
  20. Inklings of transformation, transition Sources: Popkin, B.M. and Reardon, T.,

    2018. Obesity and the food system transformation in Latin America. Obesity Reviews; Mergenthaler, M., Weinberger, K. and Qaim, M., 2009. The food system transformation in developing countries: A disaggregate demand analysis for fruits and vegetables in Vietnam. Food Policy, 34(5), pp.426-436; Development Initiatives: 2018 Global Nutrition Report Per capita away from home food yearly expenditures in select Latin American countries 69% packaged foods are not aligned with healthy diets
  21. Source: Global Burden of Disease, IHME, Slide Courtesy of Ashkan

    Afshin, University of Washington What we are left with, are unhealthy dietary patterns
  22. Wealth doesn’t matter that much Consumption of food groups and

    components across income groups, 2016 Upper-middle income Lower-middle income Low income High income 11 6 4 4 41 67 6 12 Vegetables Legumes Trans fat Saturated fat Red meat Processed meat Salt Sugar-sweetened beverages 0%/0g of Nuts and seeds Milk Calcium Fruit Whole grain Omega 3 Polyunsaturated fat TRMEL 200% Of TRMEL 20.5g 435g 1.25g 250g 125g 0.25g 11% Midpoint of TRMEL 60g 0.5% 7% 22.5g 2g 2g 2.5g 360g g g g Source: Development Initiatives: 2018 Global Nutrition Report
  23. These unhealthy dietary patterns, have become a significant risk factor

    of disease and death Source: GBD 2017 Diet Collaborators. Health effects of dietary risks in 195 countries, 1990–2017: a systematic analysis for the Global Burden of Disease Study 2017. The Lancet. In Press. 255 million DALYs are attributable to dietary risk factors 11 million deaths are attributable to dietary risk factors
  24. The percent contribution of malnutrition in all its forms (shown

    in blue as the contributions of undernutrition, high body mass index [BMI], and dietary risks) to disability- adjusted life years lost compared with the burden from the next three largest contributors. Results are shown for all countries and by groups of countries according to the socio-development index (SDI). Source: Swinburn, B.A., Kraak, V.I., Allender, S., Atkins, V.J., Baker, P.I., Bogard, J.R., Brinsden, H., Calvillo, A., De Schutter, O., Devarajan, R. and Ezzati, M., 2019. The global syndemic of obesity, undernutrition, and climate change: The Lancet Commission report. The Lancet, 393(10173), pp.791-846. Global High High- middle Middle Low- middle Low Diets have surpassed tobacco and other factors as the major risk factor of disability
  25. Poverty -- Food Insecurity -- Obesity An evolving conundrum •

    Many in the world, no matter where they live, are affected by both food insecurity and obesity at the same time. • Food-insecure populations are subject to the same, but unique influences in trying to consume a healthful diet: • Limited resources and lack of access to healthy, affordable foods • Cycles of food deprivation and overeating • High levels of stress, anxiety and depression • Limited access to health care • Fewer opportunities for physical activity • Greater exposure to marketing of obesity-promoting products Sources: Jolliffe, 2011; Singh et al., 2011; Zhang & Wang, 2004; Freedman, 2011; Ogden et al., 2010
  26. Geo-localizing socioeconomic status with dietary quality • Higher socioeconomic status

    has been linked with higher-quality diets. • The study examined the geographic distribution of a measure of diet quality, also known as the Healthy Eating Index (HEI) in relation to residential property values in the city of Seattle. • Residential property values, education, and incomes were associated with higher HEI scores. Source: Drewnowski, A., Aggarwal, A., Cook, A., Stewart, O. and Moudon, A.V., 2016. Geographic disparities in healthy eating index scores (HEI–2005 and 2010) by residential property values: findings from Seattle obesity study (SOS). Preventive medicine, 83, pp.46-55. Property value Healthy eating index
  27. Poverty is no longer just about hunger Source: Niessen, L.W.,

    Mohan, D., Akuoku, J.K., Mirelman, A.J., Ahmed, S., Koehlmoos, T.P., Trujillo, A., Khan, J. and Peters, D.H., 2018. Tackling socioeconomic inequalities and non- communicable diseases in low-income and middle-income countries under the Sustainable Development agenda. The Lancet. Increase in publications showing positive associations between obesity and NCDs and poverty 1996 2005
  28. Biology is important in the multiple burdens of malnutrition Godfrey

    KM, Gluckman PD, Hanson MA. Developmental origins of metabolic disease: life course and intergenerational perspectives. Trends in Endocrinology & Metabolism. 2010 Apr 1;21(4):199-205.
  29. What actions can address the burden of malnutrition? • There

    is no one simple measure that can successfully shift the burden at the national or global scale. Rather, a constellation of different approaches and strategies, operating across scales and supply chains, and targeted at different people and organizations will be required. • Fiscal measures. • Regulatory and trade interventions. • Voluntary and industry approaches. • Interventions focusing on the context, defaults and norms of consumption. • Information and education raising approaches.
  30. 1. Care. The challenge of avoiding catastrophic climate breakdown requires

    “rapid, far- reaching and unprecedented changes in all aspects of society.” IPCC, 2018
  31. Reality check: Behaviors and trade-offs Source: International Council for Science

    (ICSU), 2017 A Guide to SDG Interactions: From Science to Implementation.
  32. 2. Push for countries to develop a food systems policy

    “To our knowledge no country has implemented a full range of updated, comprehensive, and evidence informed strategies to encourage a healthier and more equitable food system.” Source: Mozaffarian, D., Angell, S.Y., Lang, T. and Rivera, J.A., 2018. Role of government policy in nutrition—barriers to and opportunities for healthier eating. bmj, 361, p.k2426.
  33. Reality check: Policy coherence is massively challenging Adapted from: HLPE

    (2017). Nutrition and food systems. A report by the High Level Panel of Experts on Food Security and Nutrition of the Committee on World Food Security, Rome, Italy; IPES 2015 Report
  34. 3. Consider the situation a “Syndemic” Source: Swinburn, B.A., Kraak,

    V.I., Allender, S., Atkins, V.J., Baker, P.I., Bogard, J.R., Brinsden, H., Calvillo, A., De Schutter, O., Devarajan, R. and Ezzati, M., 2019. The global syndemic of obesity, undernutrition, and climate change: The Lancet Commission report. The Lancet, 393(10173), pp.791-846. And take on triple-duty actions
  35. Reality check: Funding is dismal • Global obesity costs an

    estimated 2 trillion annually or 2.8% of global GDP. • Cost of ending hunger: estimates range from US$7 billion annually to 2030. • We need more financing for nutrition: ODA only 0.5% on undernutrition, 0.01% on NCDs. Government and multilateral ODA spending on nutrition-specific interventions, 2006–2015 Sources: D. Mason-D’Croz et al., "IMPACT Projections of Investments in Agriculture and Implications for Reducing Hunger in Africa by 2030: Results from the IMPACT Model, Version 3.3," project report, Washington, DC: IFPRI, 2016; Global Nutrition Report 2017; Shekar et al World Bank estimates on nutrition WHA targets 2016; Tremmel et al 2017 Bezos alone is worth 165 billion.
  36. 4. Consider options for keeping the food system within environmental

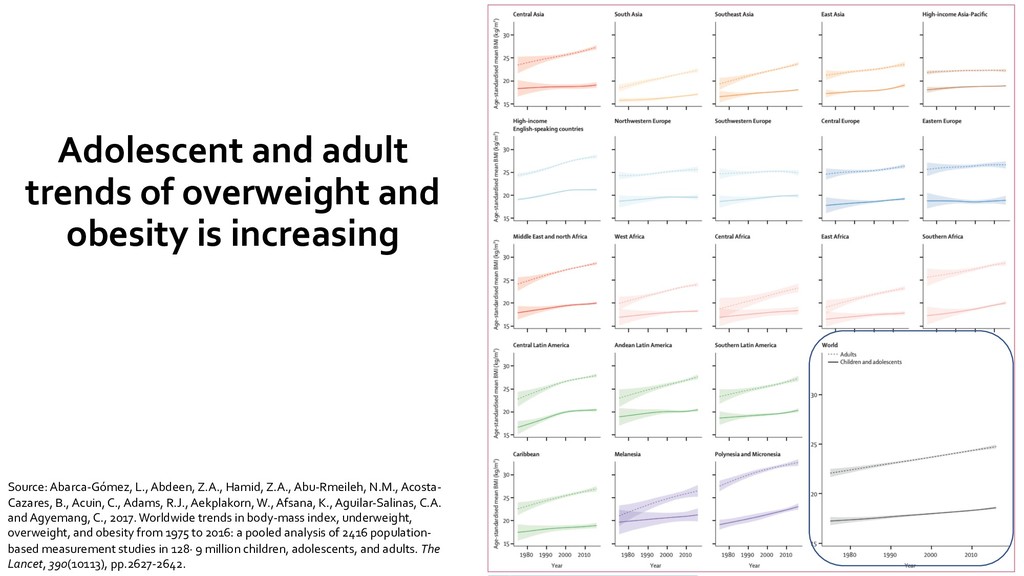
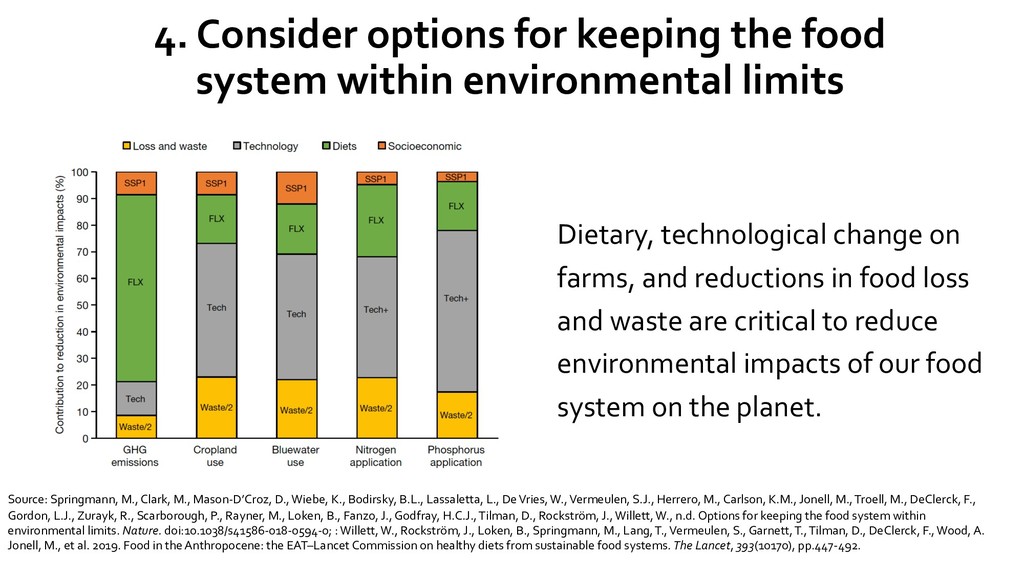
    limits Source: Springmann, M., Clark, M., Mason-D’Croz, D., Wiebe, K., Bodirsky, B.L., Lassaletta, L., De Vries, W., Vermeulen, S.J., Herrero, M., Carlson, K.M., Jonell, M., Troell, M., DeClerck, F., Gordon, L.J., Zurayk, R., Scarborough, P., Rayner, M., Loken, B., Fanzo, J., Godfray, H.C.J., Tilman, D., Rockström, J., Willett, W., n.d. Options for keeping the food system within environmental limits. Nature. doi:10.1038/s41586-018-0594-0; : Willett, W., Rockström, J., Loken, B., Springmann, M., Lang, T., Vermeulen, S., Garnett, T., Tilman, D., DeClerck, F., Wood, A. Jonell, M., et al. 2019. Food in the Anthropocene: the EAT–Lancet Commission on healthy diets from sustainable food systems. The Lancet, 393(10170), pp.447-492. Dietary, technological change on farms, and reductions in food loss and waste are critical to reduce environmental impacts of our food system on the planet.
  37. Reality check: The exceptionality of food "Perhaps the main reason

    nutrition has thrust planetary health into public consciousness is the role of food in culture. Food is essential to life, and diet and culture form the very fabric of life.” -- Editors, Lancet Planetary Health “More than a diet.”
  38. 5. Don’t forget about who will continue to feed the

    world “Twelve thousand years have passed since we began to transform from forager: to settled farmer. It took several thousand years of learning and culture before the transition was nearly complete. The twists of nature that human ingenuity devised have ratcheted up, step by step, our dominance as farmers on the planet. Now we are transforming from farmers to urbanites. Our newest experiment-to feed massive numbers of people from the work of a few-is just beginning. The outcome is yet to be seen.” – Ruth DeFries, The Big Rachet
  39. Reality check: Human capital is undermined by poor nutrition in

    rural areas Sources: Paciorek CJ, Stevens GA, Finucane MM, Ezzati M, Nutrition Impact Model Study Group. Children's height and weight in rural and urban populations in low-income and middle-income countries: a systematic analysis of population-representative data. The Lancet Global Health. 2013 Nov 1;1(5):e300-9; See L. M. Jaacks, M. M. Slining, and B. M. Popkin, “Recent Trends in the Prevalence of Under- and Overweight among Adolescent Girls in Low- and Middle-Income Countries,” Pediatric Obesity 10, no. 6 (2015): 428–435 Number of stunted urban children Number of stunted rural children prevalence of under- and overweight among non-pregnant girls aged 15-18 years in LMICs
  40. 6. Invest in small and medium holder farmers Source: Herrero,

    M., Thornton, P. K., Power, B., Bogard, J. R., Remans, R., Fritz, S., ... & Watson, R. A. (2017). Farming and the geography of nutrient production for human use: a transdisciplinary analysis. The Lancet Planetary Health, 1(1), e33-e42; Jayne, T.S., Chamberlin, J., Traub, L., Sitko, N., Muyanga, M., Yeboah, F.K., Anseeuw, W., Chapoto, A., Wineman, A., Nkonde, C. and Kachule, R., 2016. Africa's changing farm size distribution patterns: the rise of medium-scale farms. Agricultural Economics, 47(S1), pp.197-214. 53-81% of micronutrients in the food supply are produced by small and medium farms. These farms make up 84% of all farms and 33% of the land areas globally and are more predominant in Asia and sub-Saharan Africa Smallholder farmers have more diversified landscapes, making important contributions to the overall dietary diversity for the world’s population. And medium-scale farms are growing in places like Ghana, Tanzania and Zambia control (Jayne et al 2016)!
  41. Reality check: Impacts of rural livelihoods with urbanization • In

    many parts of the world, we are seeing the expansion of cities into peri-urban and rural communities as well as “ruralized” urban areas and “urbanized” rural landscapes. • There are and will be loss of agricultural land due to urban expansion: 1.8–2.4% loss of global croplands by 2030, with substantial regional disparities -- 80% of global cropland loss from urban expansion will take place in Asia and Africa. Source: d’Amour CB, Reitsma F, Baiocchi G, Barthel S, Güneralp B, Erb KH, Haberl H, Creutzig F, Seto KC. Future urban land expansion and implications for global croplands. Proceedings of the National Academy of Sciences. 2017 Aug 22;114(34):8939-44; Satterthwaite D, McGranahan G, Tacoli C. Urbanization and its implications for food and farming. Philosophical Transactions of the Royal Society B: Biological Sciences. 2010 Sep 27;365(1554):2809-20; Bezemer D, Headey D. Agriculture, development, and urban bias. World development. 2008 Aug 1;36(8):1342-64.
  42. 7. Maximize net increase of nutrition along value chains Source:

    Fanzo, J. C., Downs, S., Marshall, Q. E., de Pee, S., & Bloem, M. W. (2017). Value Chain Focus on Food and Nutrition Security. In Nutrition and Health in a Developing World (pp. 753-770). Springer International Publishing.
  43. Reality check: Infrastructure needs catch up to the 21st century

    Source: International Food Policy Research Institute. 2019. 2019 Global Food Policy Report. Washington, DC: International Food Policy Research Institute. https://doi.org/10.2499/9780896293502
  44. 8. Engage and empower women in on- and off-farm opportunities

    • Increases in social capital • Means of gaining information and access to new technologies and farming practices • Social networks that may be accessed in times of hardship • Increases in access to credit • Greater ability to invest in infrastructure and to smooth consumption or production shocks • Increases in human capital and access to education, health and nutrition resources and services
  45. Reality check: Taste, price and convenience are strong drivers Source:

    The International Food Information Council (IFIC) Foundation’s 2018 Food and Health Survey https://foodinsight.org/wp-content/uploads/2018/05/2018-FHS-Report-FINAL.pdf American’s surveyed
  46. 10. Dig deeper We must address the underlying social determinants

    that impact malnutrition. Every country is impacted by poverty but its determinants may be different, or the same… Racial disparities Domestic violence Incarceration & gun violence Drugs and alcohol abuse Food insecurity Obesity and diabetes Tribal disparities Social unrest & border conflict Domestic violence, alcohol abuse Food and water insecurity Stunting and wasting
  47. Individuals, industry or state? • Don’t leave it to the

    individual: There is a lack of evidence for individuals taking action, and attitude-action gaps are evident. Public understanding of nutrition and health of diets is low. • Don’t leave it to industry goodwill or enlightened self-interest: Some in the food industry are acting but their efforts alone are not enough. • Governments need to govern: Policy makers need to create a strong regulatory and fiscal framework, and international trade needs to reflect the importance of food security and healthy diets. • There are many policy actions that can be taken: Global goals to national food policies that span value chains, food environment and consumer demand. • Whole food system approaches are needed: No one approach will do everything. A mix of regulatory, fiscal, voluntary and other approaches is required.