version) Jesus M. Gonzalez-Barahona [email protected] @jgbarah http://speakerdeck.com/jgbarah Bitergia / LibreSoft (URJC) Open Source Summit Paris (France), November 16th 2016 Jesus Gonzalez-Barahona (Bitergia) Open Development Analytics Paris, Nov 2016 1 / 54
Transparency and governance 3 Open development analytics 4 How are changes being reviewed? 5 Dependency 6 Dealing with issues? 7 Diversity 8 The end Jesus Gonzalez-Barahona (Bitergia) Open Development Analytics Paris, Nov 2016 6 / 54
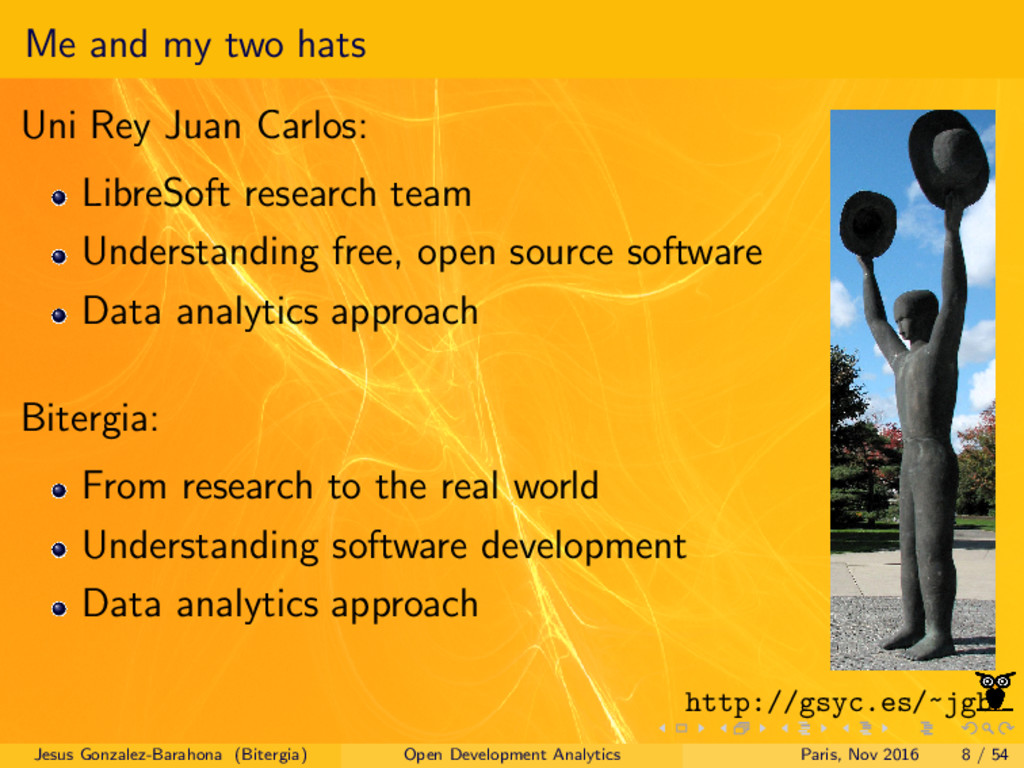
research team Understanding free, open source software Data analytics approach Bitergia: From research to the real world Understanding software development Data analytics approach http://gsyc.es/~jgb Jesus Gonzalez-Barahona (Bitergia) Open Development Analytics Paris, Nov 2016 8 / 54
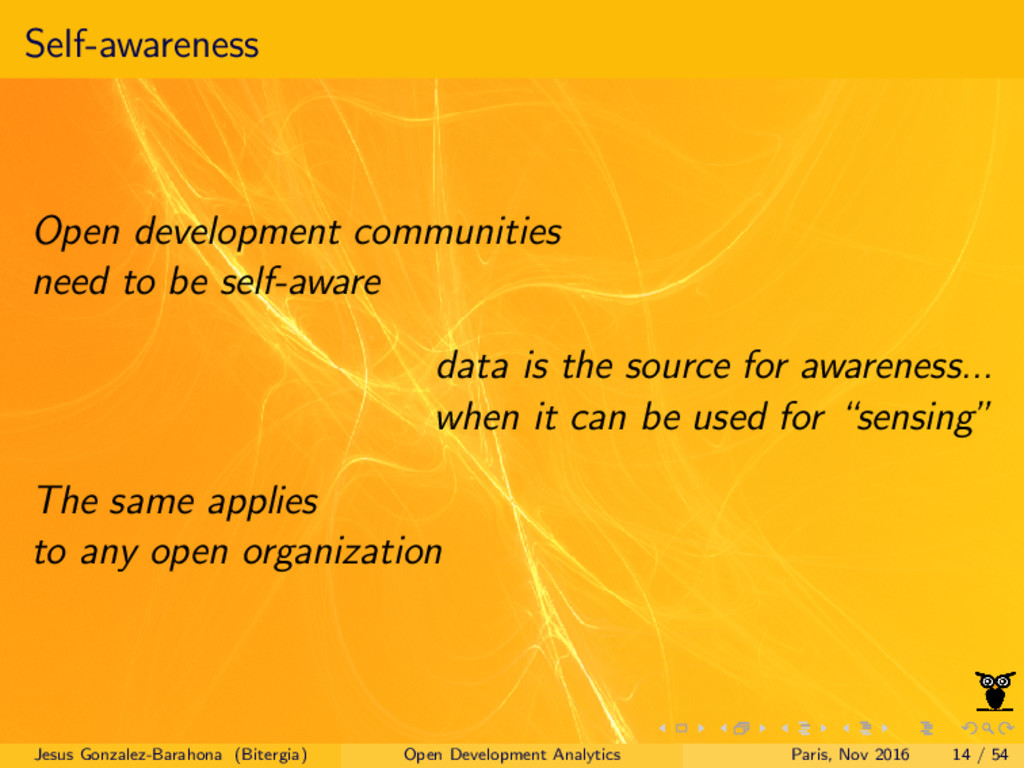
the source for awareness... when it can be used for “sensing” The same applies to any open organization Jesus Gonzalez-Barahona (Bitergia) Open Development Analytics Paris, Nov 2016 14 / 54
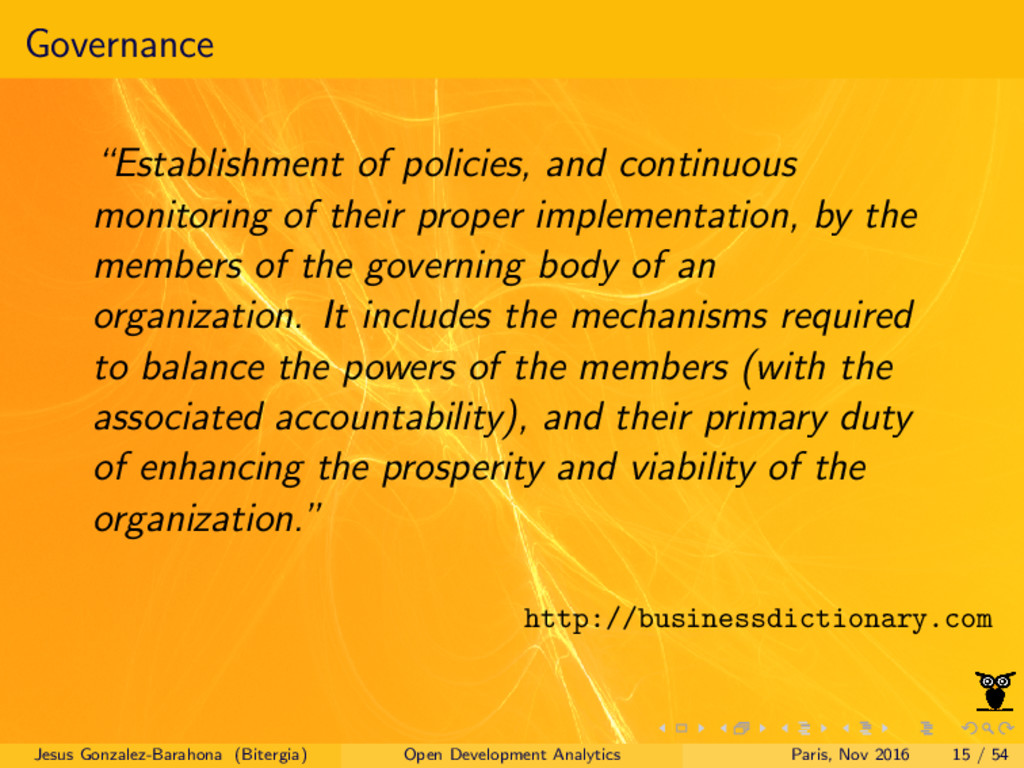
implementation, by the members of the governing body of an organization. It includes the mechanisms required to balance the powers of the members (with the associated accountability), and their primary duty of enhancing the prosperity and viability of the organization.” http://businessdictionary.com Jesus Gonzalez-Barahona (Bitergia) Open Development Analytics Paris, Nov 2016 15 / 54
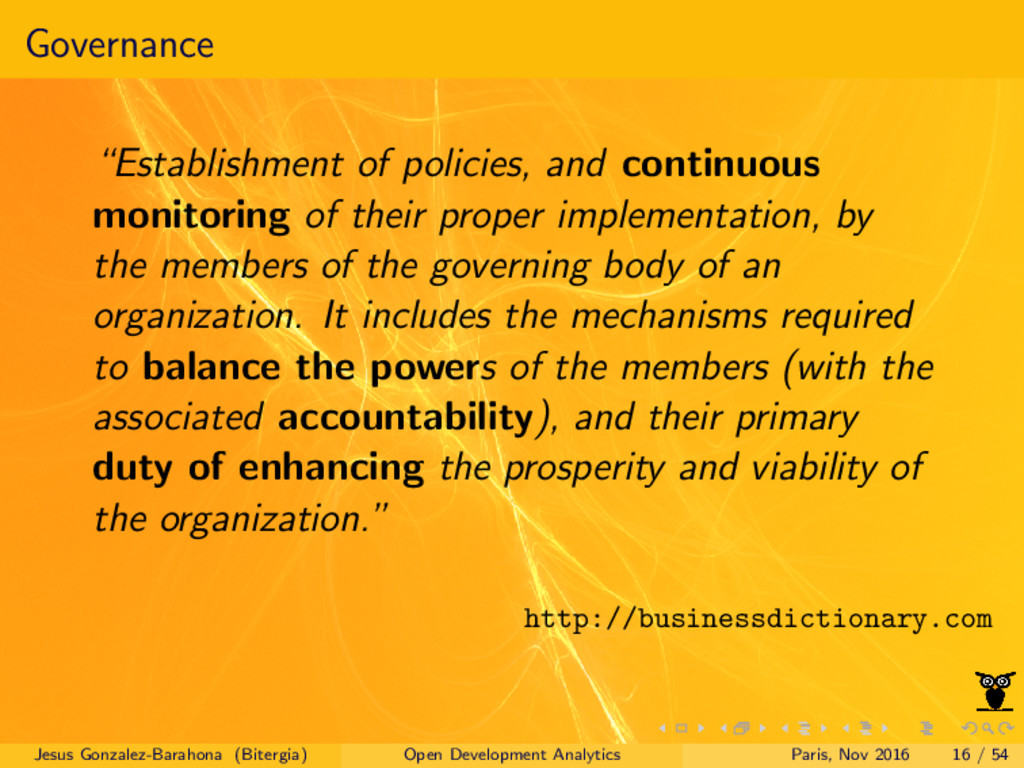
implementation, by the members of the governing body of an organization. It includes the mechanisms required to balance the powers of the members (with the associated accountability), and their primary duty of enhancing the prosperity and viability of the organization.” http://businessdictionary.com Jesus Gonzalez-Barahona (Bitergia) Open Development Analytics Paris, Nov 2016 16 / 54
(fairness) Transparency to third parties (trust) Which for open organizations are kind of the same Jesus Gonzalez-Barahona (Bitergia) Open Development Analytics Paris, Nov 2016 17 / 54
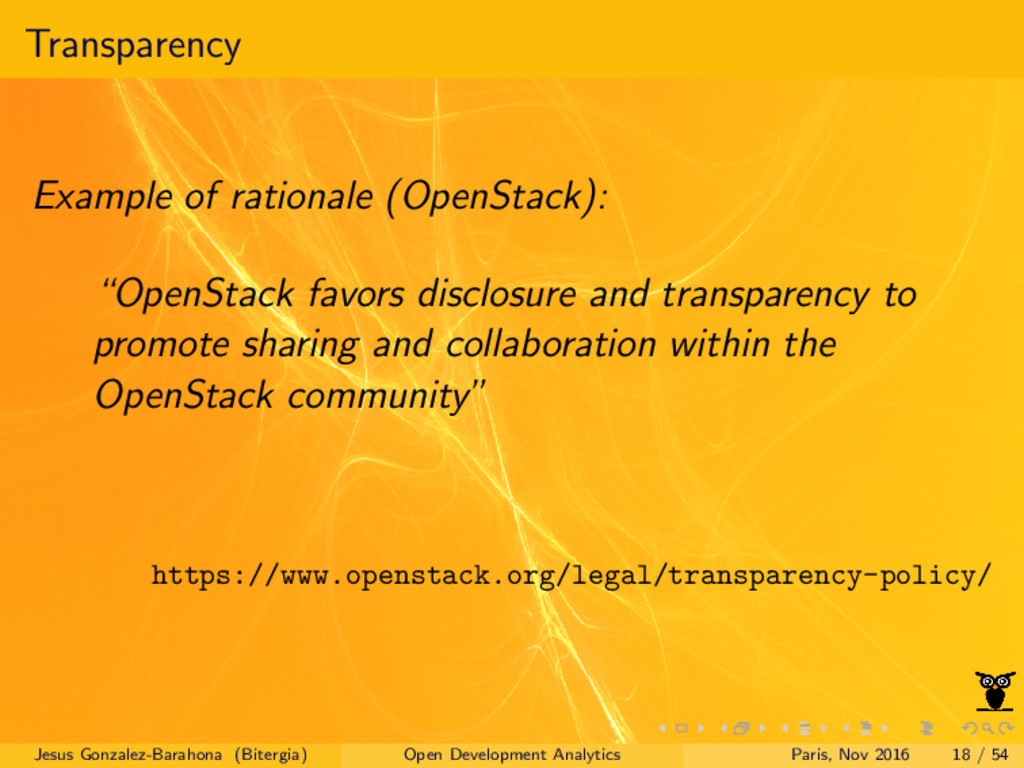
to promote sharing and collaboration within the OpenStack community” https://www.openstack.org/legal/transparency-policy/ Jesus Gonzalez-Barahona (Bitergia) Open Development Analytics Paris, Nov 2016 18 / 54
open we produce a great deal of data about how we develop “Show me the development data” as a step beyond “show me the code” Jesus Gonzalez-Barahona (Bitergia) Open Development Analytics Paris, Nov 2016 21 / 54
community, development for open development projects can be retrieved, organized, analyzed Let’s publish analytics results & data Open Development Analytics: A new standard for transparency Jesus Gonzalez-Barahona (Bitergia) Open Development Analytics Paris, Nov 2016 22 / 54
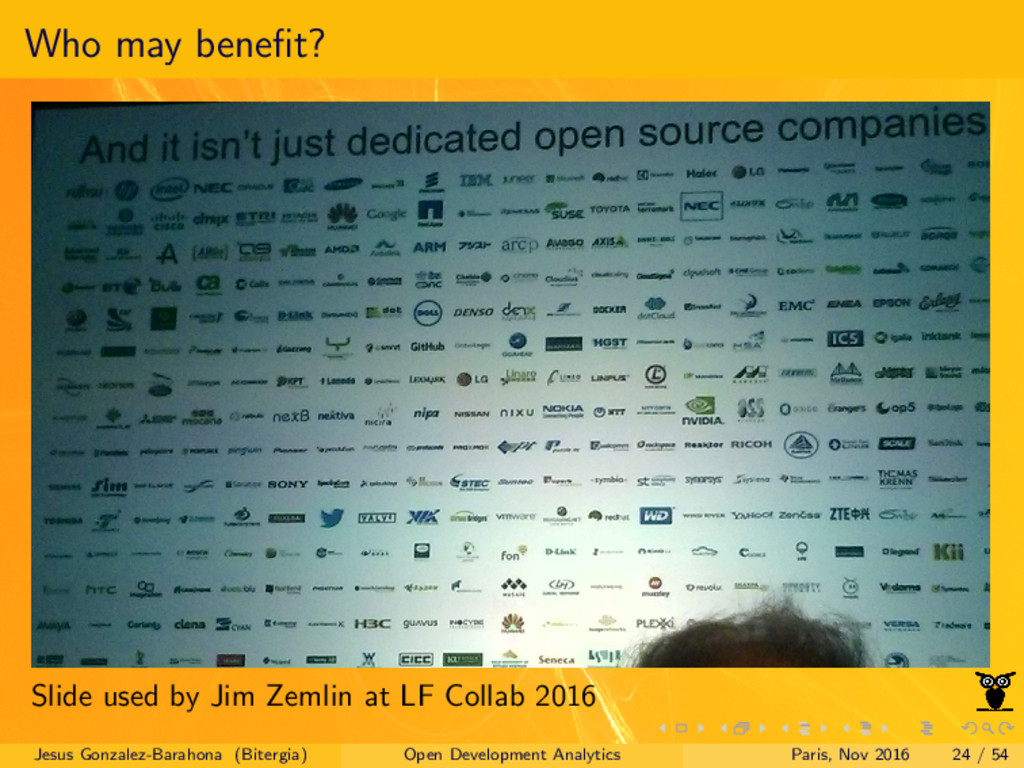
managers Evaluators ... Anyone interested in the health of the project Jesus Gonzalez-Barahona (Bitergia) Open Development Analytics Paris, Nov 2016 23 / 54
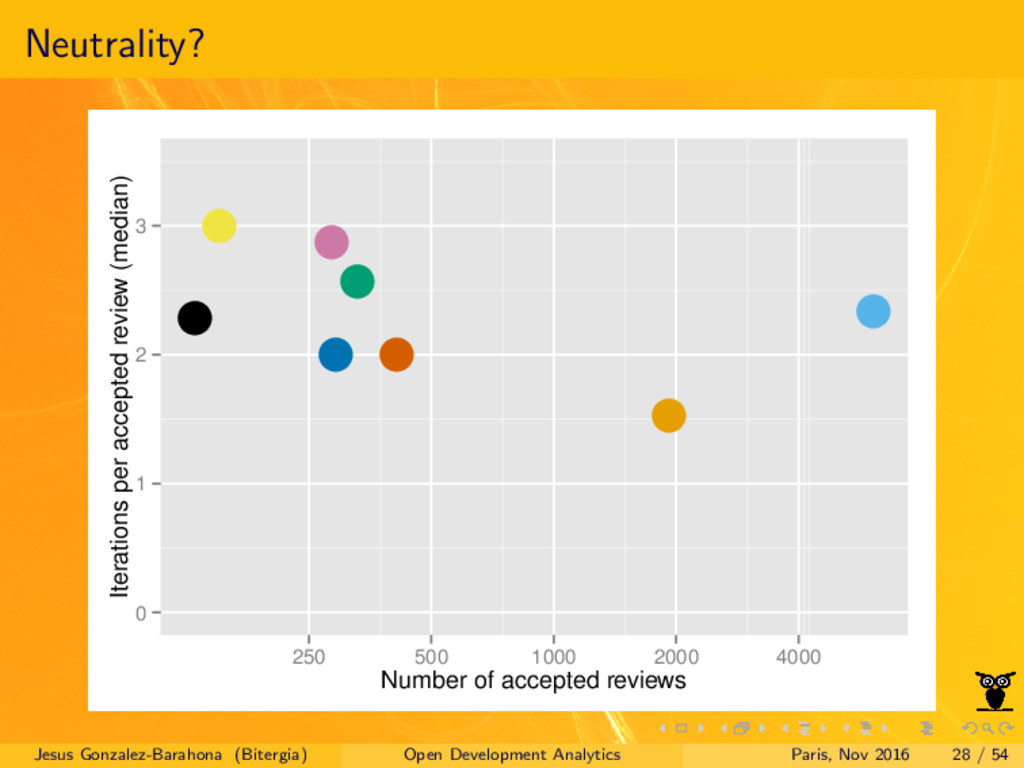
1 2 3 250 500 1000 2000 4000 Number of accepted reviews Iterations per accepted review (median) Jesus Gonzalez-Barahona (Bitergia) Open Development Analytics Paris, Nov 2016 28 / 54
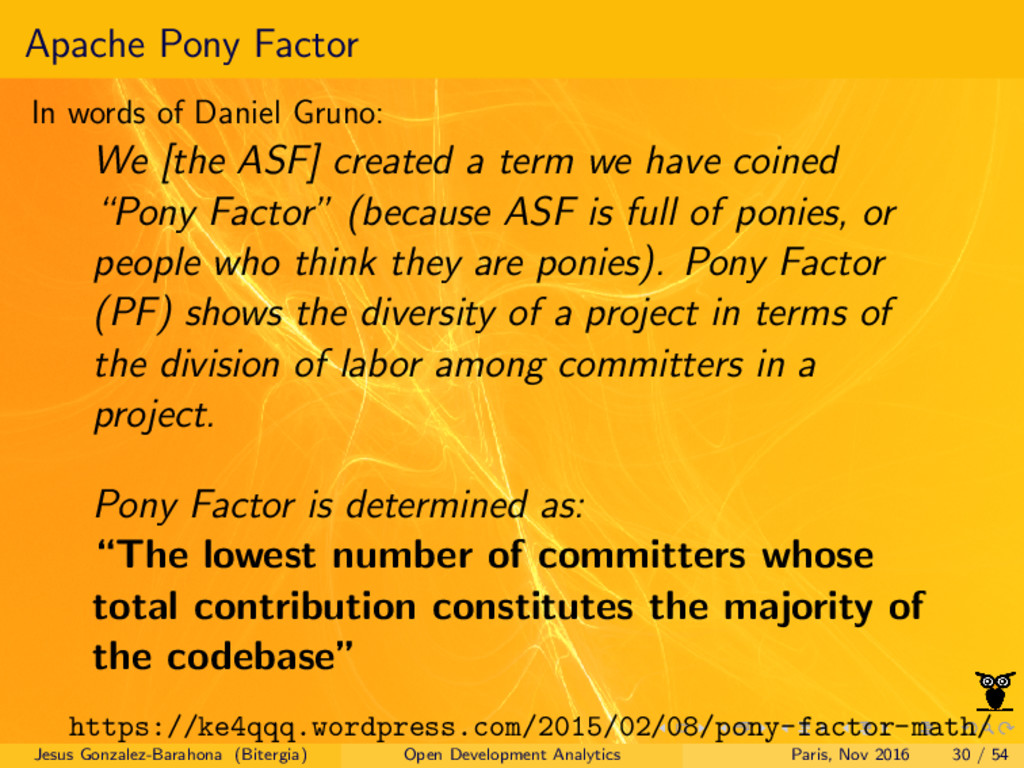
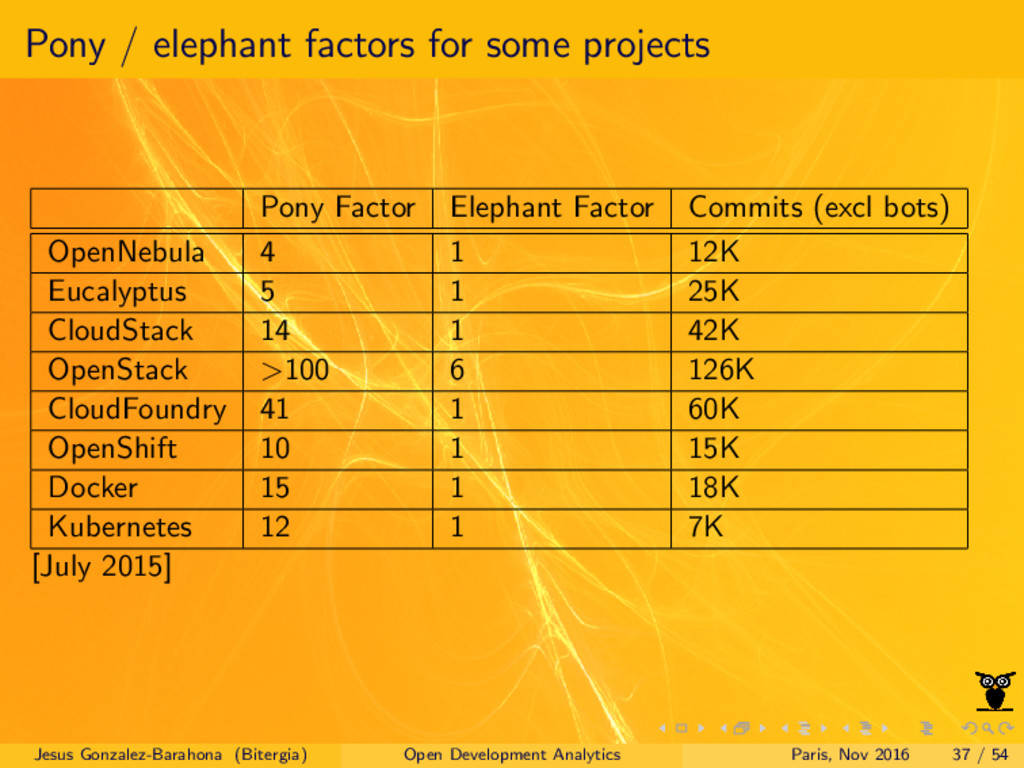
ASF] created a term we have coined “Pony Factor” (because ASF is full of ponies, or people who think they are ponies). Pony Factor (PF) shows the diversity of a project in terms of the division of labor among committers in a project. Pony Factor is determined as: “The lowest number of committers whose total contribution constitutes the majority of the codebase” https://ke4qqq.wordpress.com/2015/02/08/pony-factor-math/ Jesus Gonzalez-Barahona (Bitergia) Open Development Analytics Paris, Nov 2016 30 / 54
companies (elephants). The elephant factor shows the diversity of a project in terms of the division of labor among companies (by mean of developers affiliated with them). Elephant factor is determined as: “The lowest number of companies whose total contribution (in commits by their employees) constitutes the majority of the commits” Jesus Gonzalez-Barahona (Bitergia) Open Development Analytics Paris, Nov 2016 32 / 54
is “owned” by the people who produced it. The code “belongs” to those who wrote it. Zapata factor (work in progress): “The lowest number of developers for whom the total number of lines of code they “own” (were last touched by them) constitutes the majority of the lines of code” Jesus Gonzalez-Barahona (Bitergia) Open Development Analytics Paris, Nov 2016 34 / 54
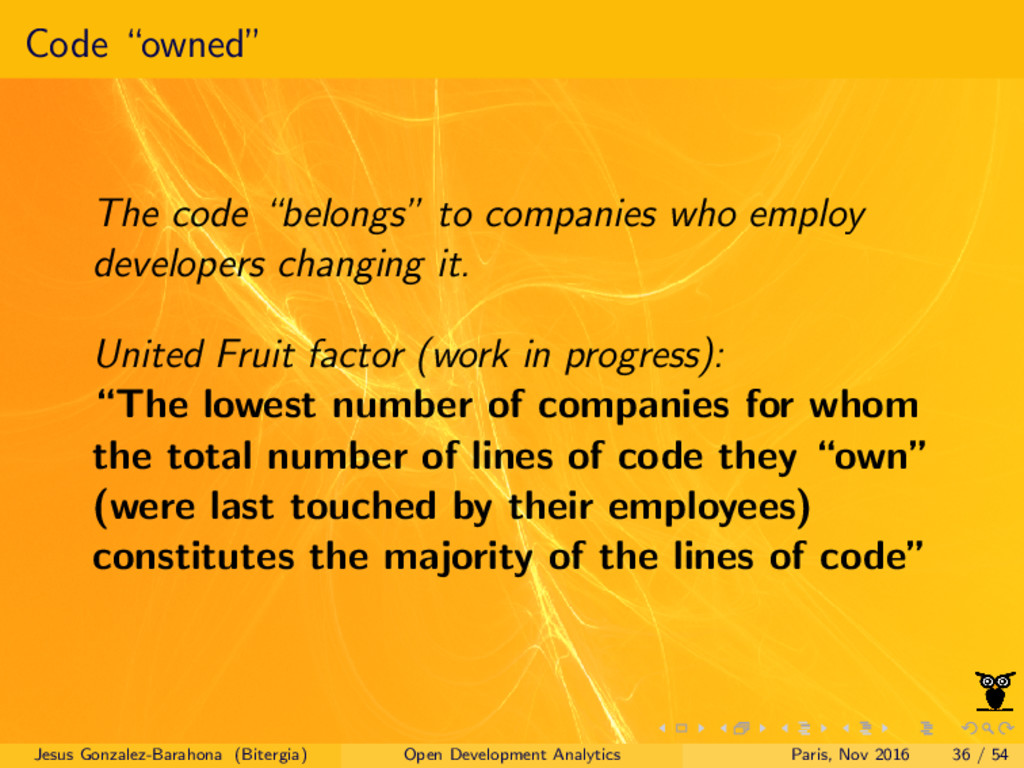
changing it. United Fruit factor (work in progress): “The lowest number of companies for whom the total number of lines of code they “own” (were last touched by their employees) constitutes the majority of the lines of code” Jesus Gonzalez-Barahona (Bitergia) Open Development Analytics Paris, Nov 2016 36 / 54
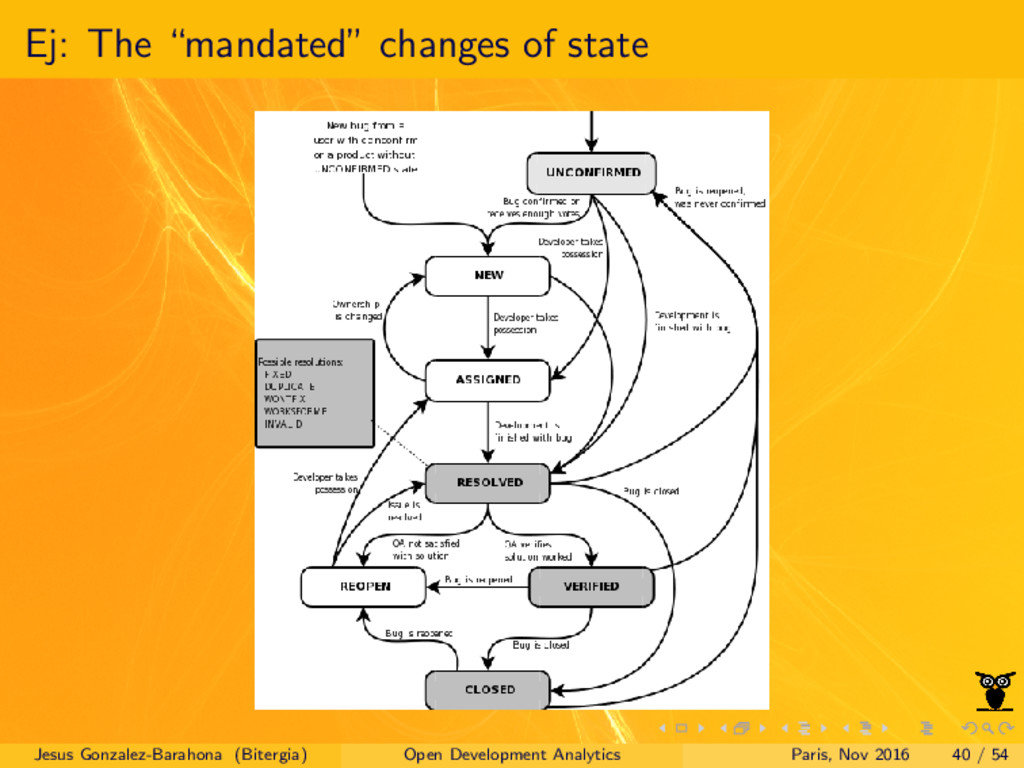
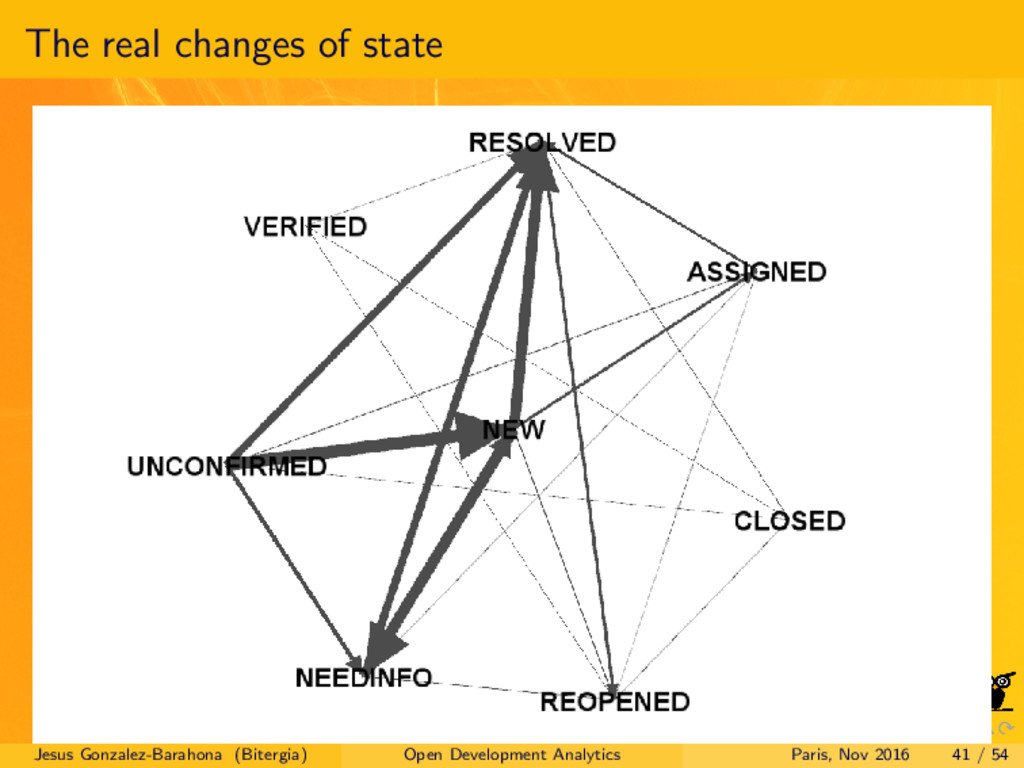
may mandate transitions but are they real? Time to close when same company reporting / fixing? Time to close for external bug reports? Time to close depending on who reports? Who opens tickets that nobody cares about? Jesus Gonzalez-Barahona (Bitergia) Open Development Analytics Paris, Nov 2016 39 / 54
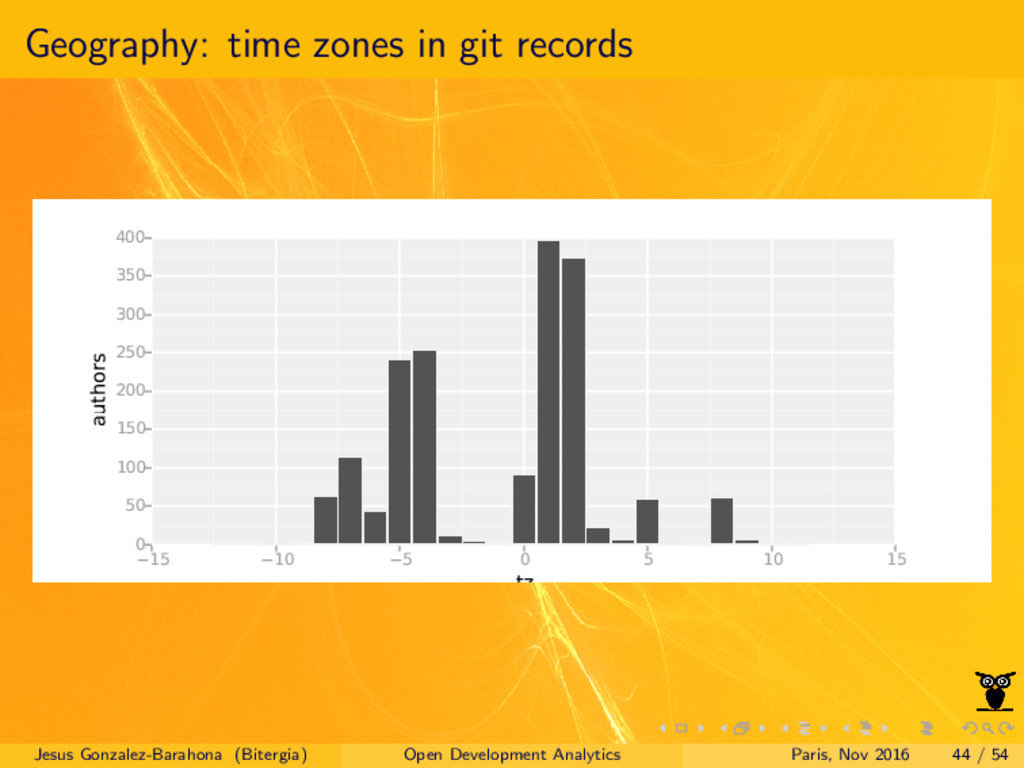
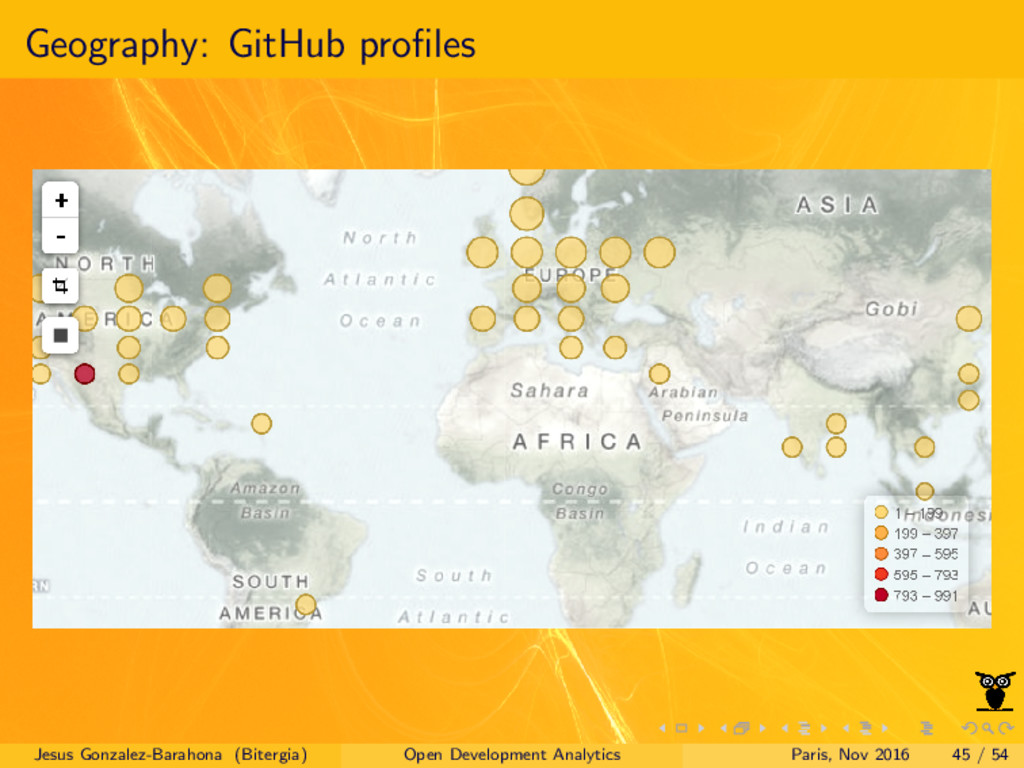
detailed records, but open communties are different Fortunately, some tools leave traces... This allows for better knowledge ...and better tracking of initiatives Example: policies to enlarge the number of developers in XXX region Jesus Gonzalez-Barahona (Bitergia) Open Development Analytics Paris, Nov 2016 43 / 54
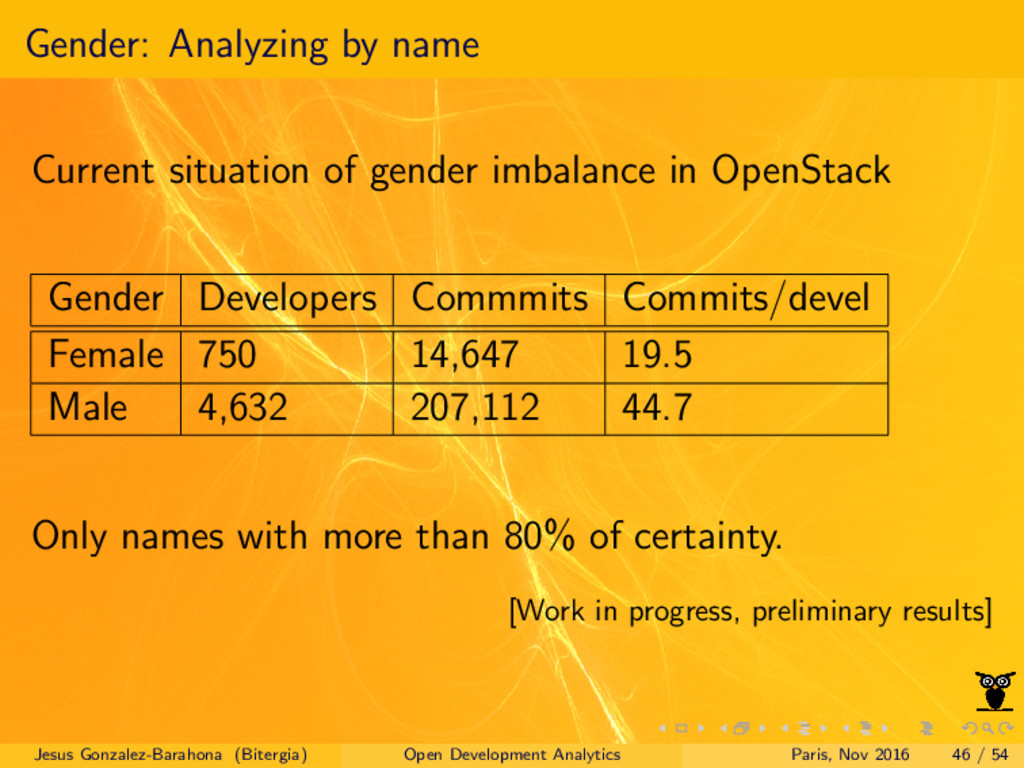
OpenStack Gender Developers Commmits Commits/devel Female 750 14,647 19.5 Male 4,632 207,112 44.7 Only names with more than 80% of certainty. [Work in progress, preliminary results] Jesus Gonzalez-Barahona (Bitergia) Open Development Analytics Paris, Nov 2016 46 / 54
http://2017.msrconf.org 14th International Conference on Mining Software Repositories Co-located with ICSE Buenos Aires, Argentina Save the dates: May 20-21 2017 Start the conversation!!! #msr17 Jesus Gonzalez-Barahona (Bitergia) Open Development Analytics Paris, Nov 2016 51 / 54
distributed under the “Attribution-ShareAlike 3.0” license, by Creative Commons, available at http://creativecommons.org/licenses/by-sa/3.0/ Jesus Gonzalez-Barahona (Bitergia) Open Development Analytics Paris, Nov 2016 52 / 54
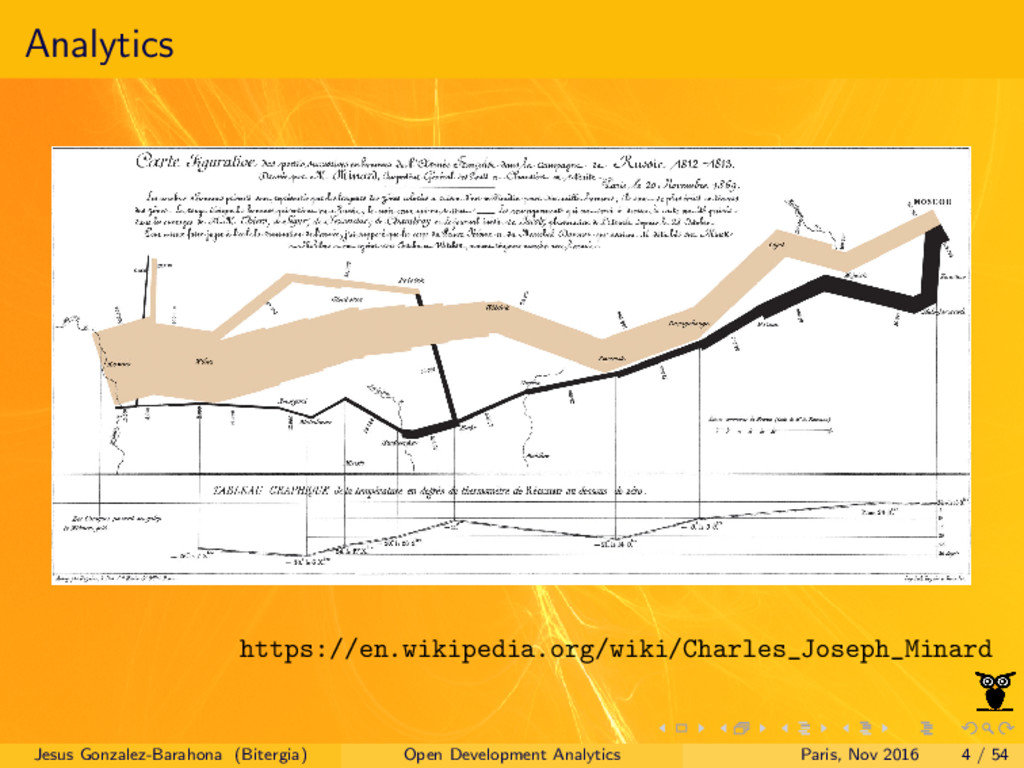
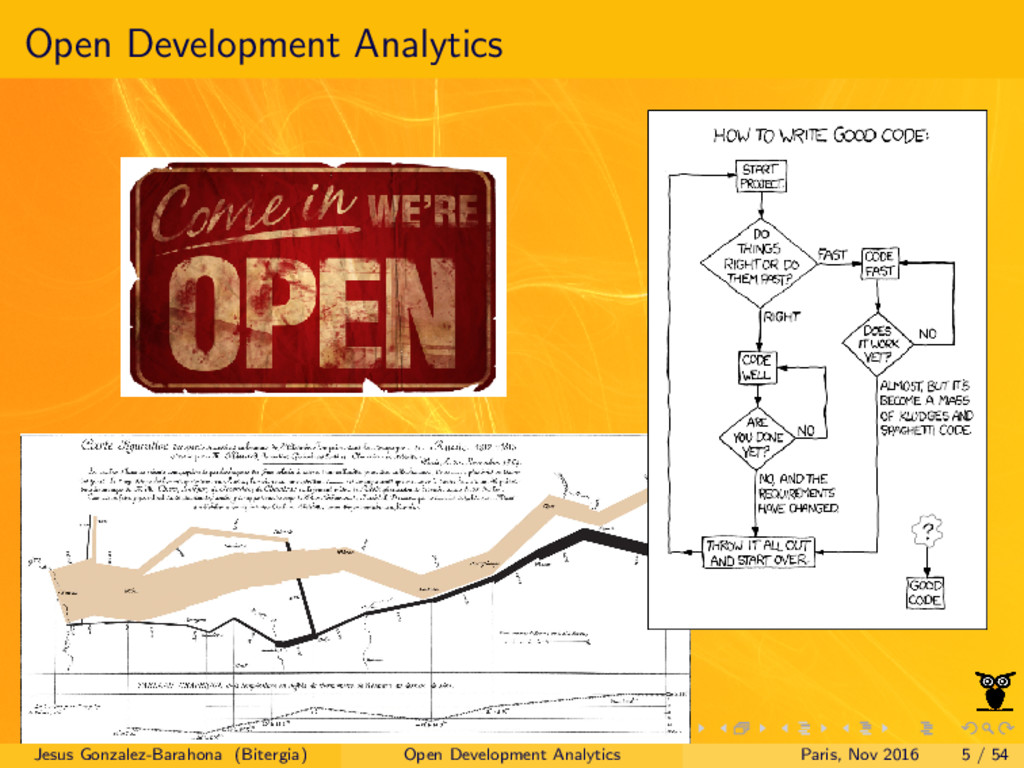
located in Otawa, Canada Picture by Lezumbalaberenjena in Wikimedia Commons License: Public domain https://commons.wikimedia.org/wiki/File: Man_With_Two_Hats_Ottawa_Statue_by_lezumbalaberenjena.jpg “Napoleon’s Russian campaign of 1812” Original by Charles Minard License: Public domain https://en.wikipedia.org/wiki/Charles_Joseph_Minard#/media/File: Minard.png “Aged Come In We’re Open” Picture by Czarina Alegre in Flickr License: Creative Commons Attribution 2.0 https://flic.kr/p/fjGamh Jesus Gonzalez-Barahona (Bitergia) Open Development Analytics Paris, Nov 2016 53 / 54
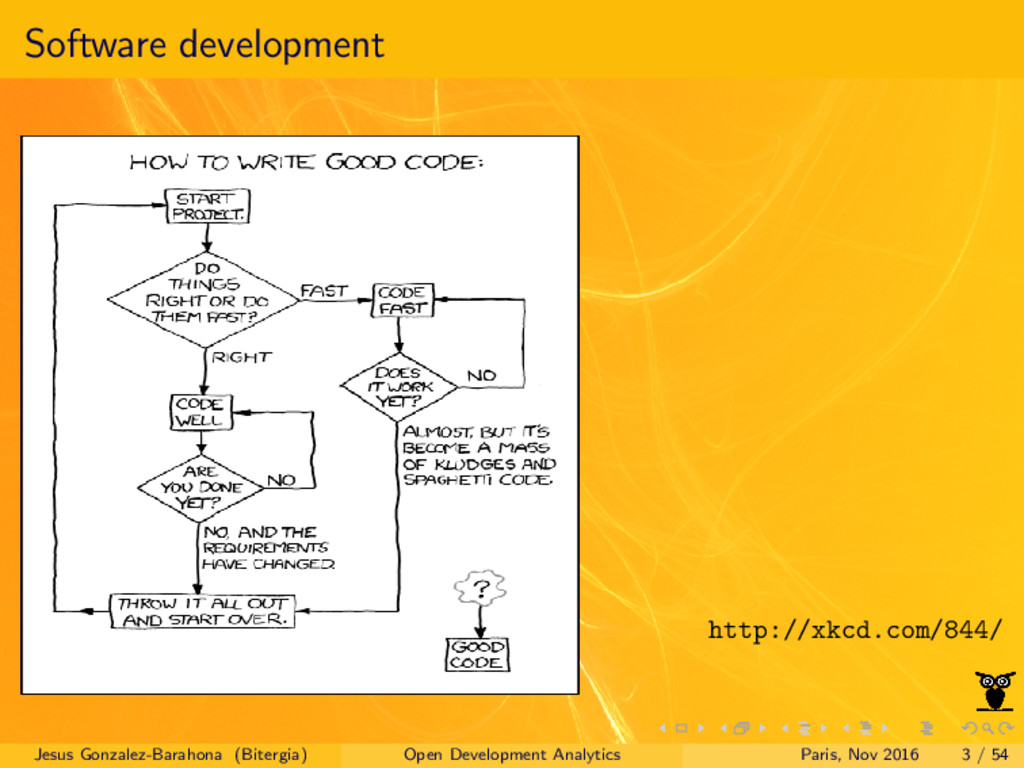
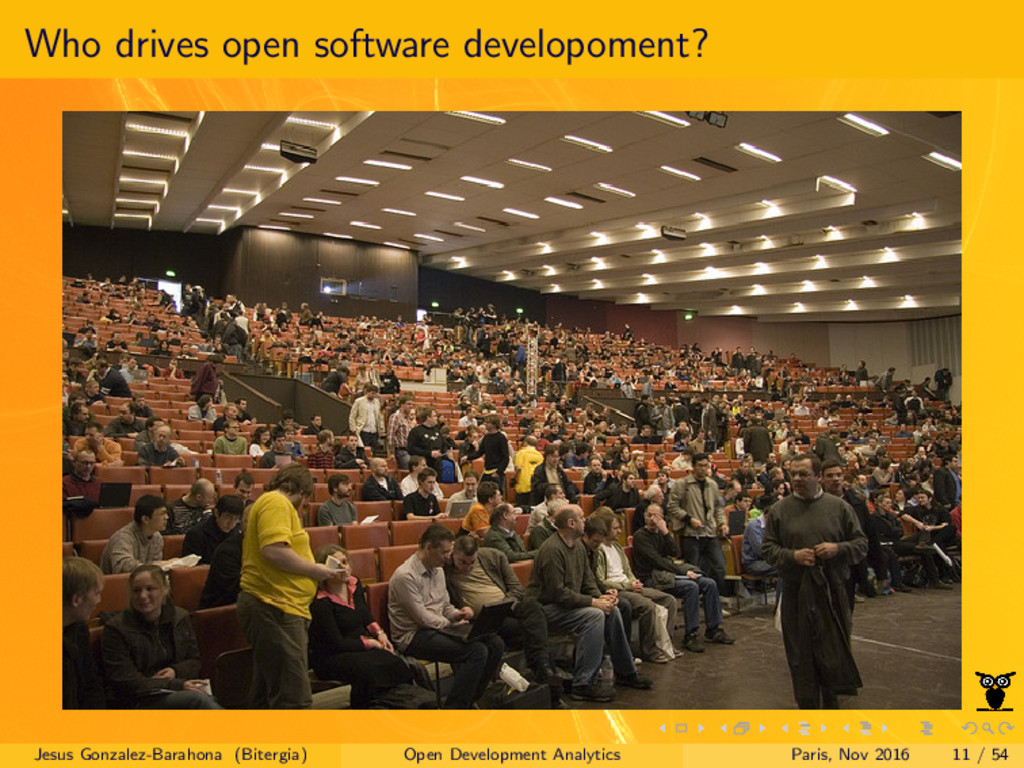
License: Creative Commons Attribution-NonCommercial 2.5 http://xkcd.com/844/ “Crowd at FOSDEM 2008” Picture by Jes´ us Corrius in Flickr Licenses: Creative Commmons Attribution 2.0 http://www.flickr.com/photos/jcorrius/2302302707/ “Elephant” Picture by ajoheyho License: Creative Commons Public Domain https://pixabay.com/en/elephant-african-bush-elephant-114543/ “Emiliano Zapata” License: Public Domain Jesus Gonzalez-Barahona (Bitergia) Open Development Analytics Paris, Nov 2016 54 / 54
![Diversity: Code “owned” [Linux kernel, July 2016, Zapata factor: 200]](https://files.speakerdeck.com/presentations/6f9f77dbd2df4d59bb92e37e079cf2a4/slide_34.jpg)