Upgrade to Pro — share decks privately, control downloads, hide ads and more …

PyData Südwest Meetup KA 2018-06-13

PyData Südwest Meetup KA 2018-06-13

Technology Insight · Document the Data – Creating Reports Using Docs Tooling

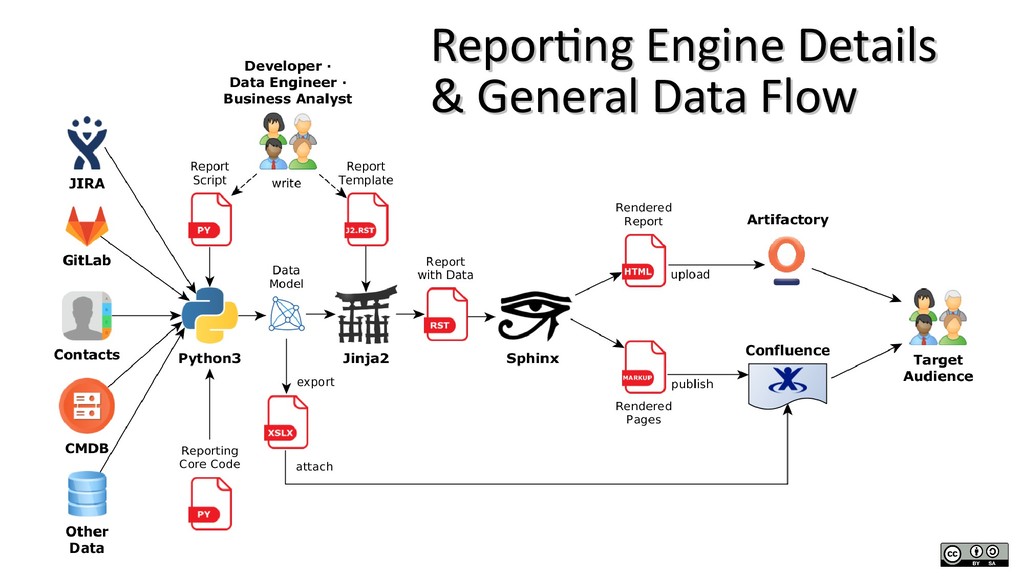
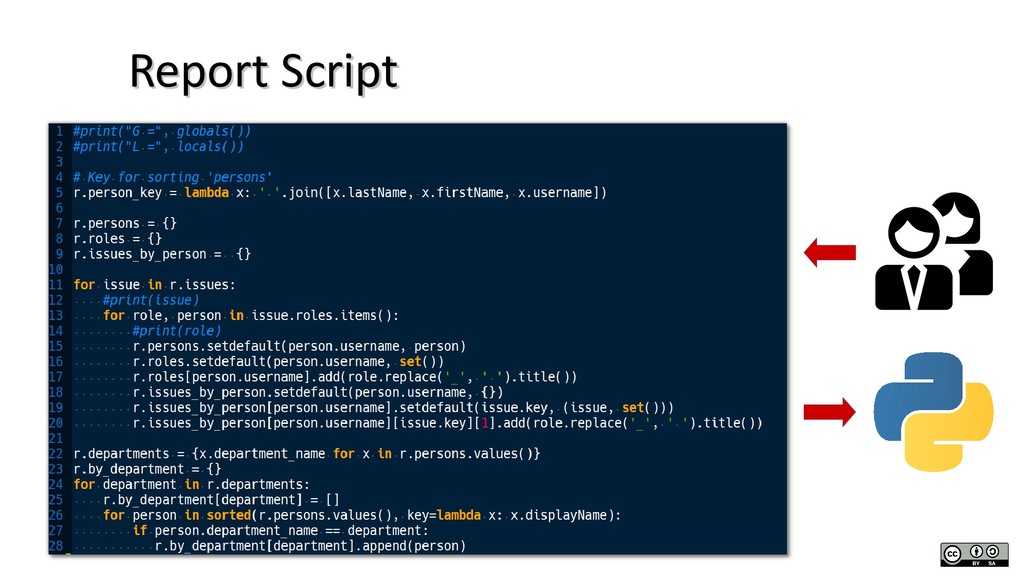
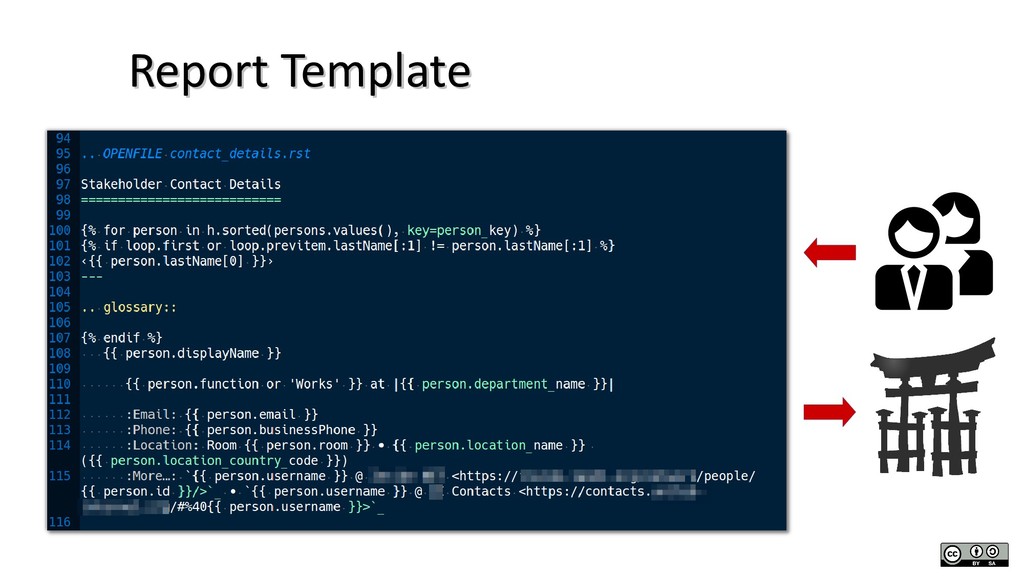
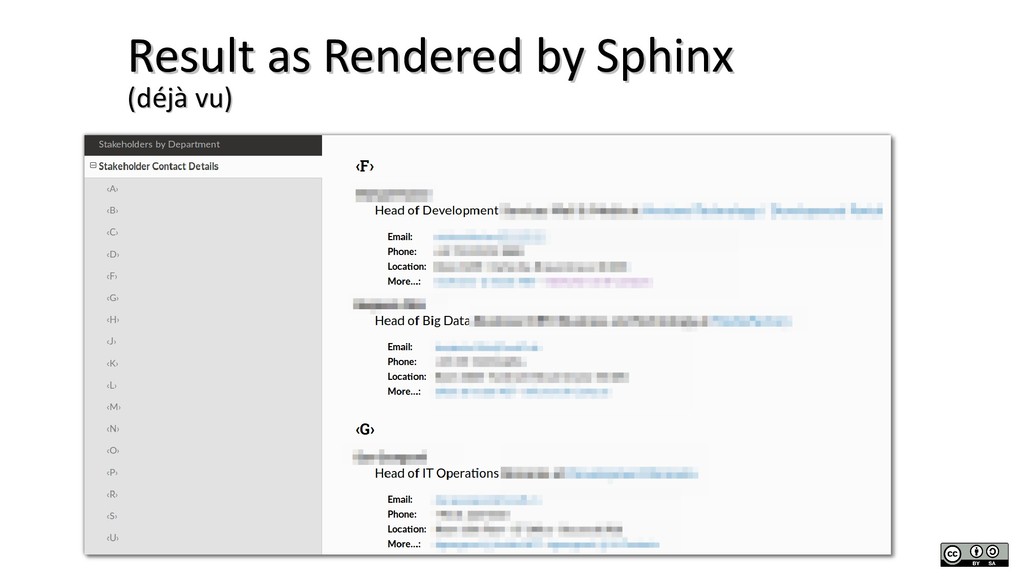
As a developer, use your existing skill set regarding programming and documentation to generate technical or business reports from distributed data sources.

https://www.meetup.com/PyData-Suedwest/events/250368244/

Jürgen Hermann

June 13, 2018
Tweet

More Decks by Jürgen Hermann

Other Decks in Technology

Transcript

  1. Architecture Board Application Monitoring Service Phase 1 – Metrics Gateway

    Jürgen Hermann PyData Meetup KA · 2018-06 Technology Insight Document the Data Creating Reports Using Docs Tooling jhermann [email protected]
  2. Goals & Requirements Goals & Requirements • Mine already existing

    but distributed data • Generate new insights… – by federation of isolated knowledge – by views specifically designed for different audiences • Avoid one-shot reporting efforts – Commonly done manually & thus expensive / not amortized – Sustainable & Continuous – “After the audit is before the audit” • Create demand for complete & correct data – Provide motivation for data entry and maintenance – Data quality is driven by data usage
  3. Basic Solution Idea: Basic Solution Idea: Use the Tools You

    Know Use the Tools You Know (as a Developer) (as a Developer) • Documentation tools have a lot of similarities with classic reporting tools • Most everything is text on the way to the final rendering, and thus easily worked with / debugged • Just another application domain of these tools – use existing / easily gained & retained working knowledge • Technology stack used here: Python3 · Jinja2 · Sphinx
  4. Python3 – Python3 – CLI and and Model / Model

    / Controller Logic Logic • Provides the foundational and per-report business logic • Development speed way more important than runtime performance • Full use of the Python software repository (e.g. API clients) • One of the big names in Data Science – Reuse the eco-system to create your data models – Many options to handle complex data models (Numpy/SciPy, ML frameworks, …) – Similar variety regarding data visualization
  5. Jinja2 – Templating Engine Jinja2 – Templating Engine • Create

    target-oriented views on the assembled data • Fill data into templates for rendering in the next step • Powerful built-in mechanisms – Template inclusion and inheritance for consistency – Macros to avoid repetition and hide technical complexity
  6. Sphinx – HTML Rendering Sphinx – HTML Rendering • Typically

    used for technical software documentation – User manuals, API references, … – Initially developed for the new Python documentation • Renders reStructured Text markup into usable documents • Cross-references, glossaries / indexes, themes, … • Extensible by plugins (e.g. charts) • Output formats: HTML, PDF, Confluence Publishing, …
  7. Use-Cases in the Wild Use-Cases in the Wild • Stakeholders

    (project contacts in different roles) • System Overview (views on architectural + technical data) • Progress Reporting (of large multi-team projects) – Aggregation by milestones and sub-systems – Multiple JIRAs and multiple queues – Driven by requirements linked to tasks
  8. Challenges… Challenges… • Writing your own configuration for an existing

    report – relatively easy • Otherwise, you need way more time, know-how, and reading the docs – Details on upcoming slides… • Understanding your source data, and finding a way to access it
  9. Required Know-How Required Know-How • As previously mentioned: Python, Jinja2,

    reStructured Text / Sphinx • Working in a command line environment • GitLab and GitLab CI • Things are only designed for and tested under Linux (Mac OSX & WSL should work though)