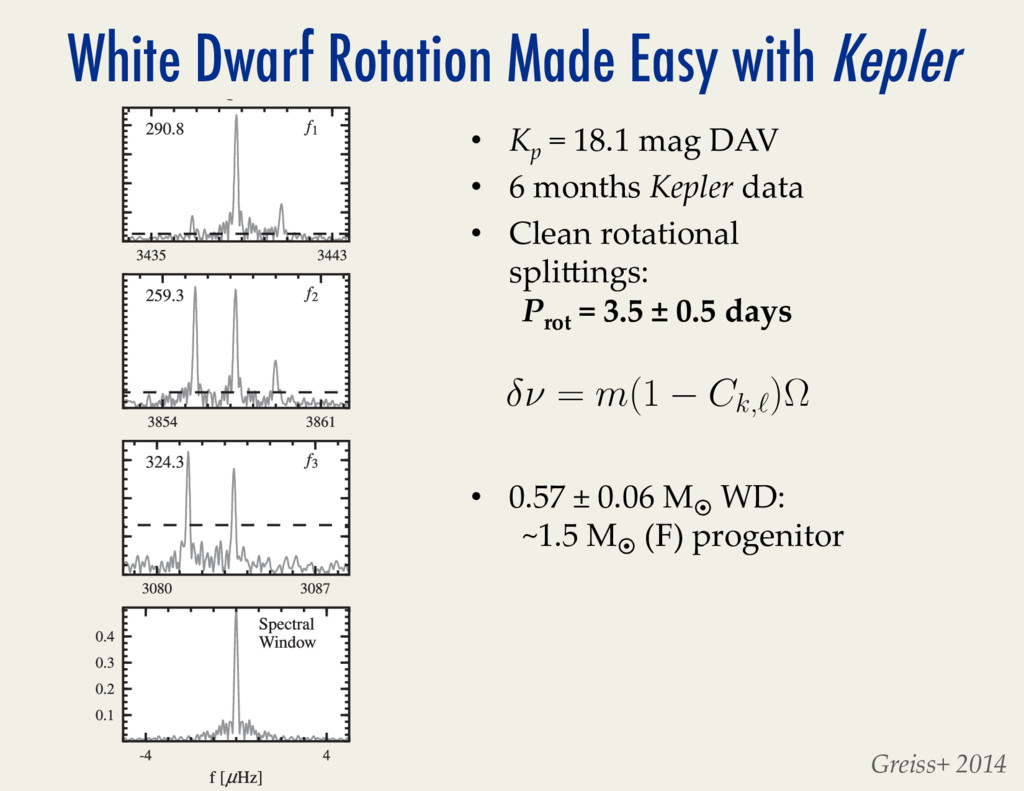
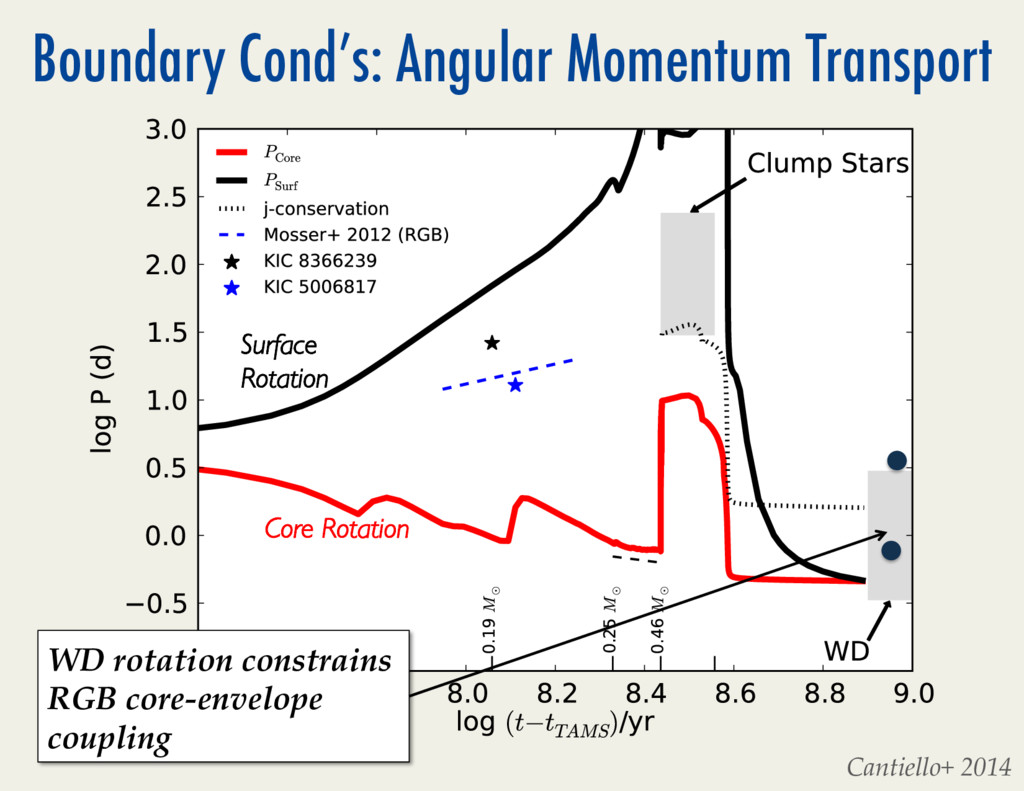
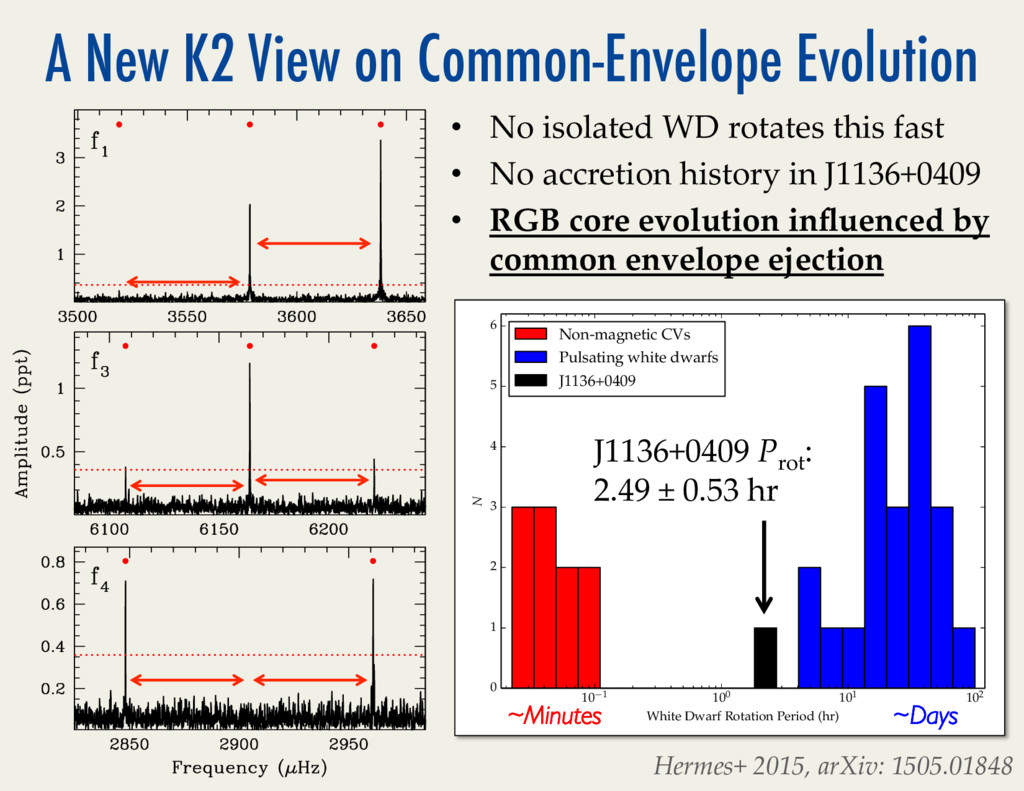
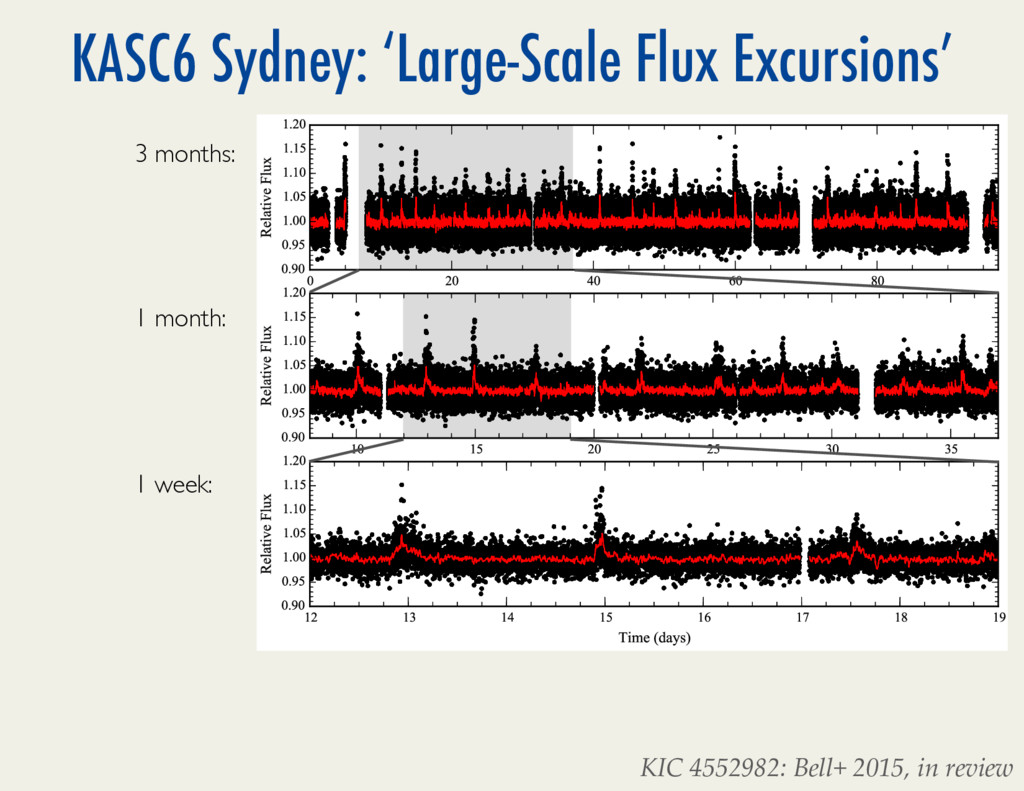
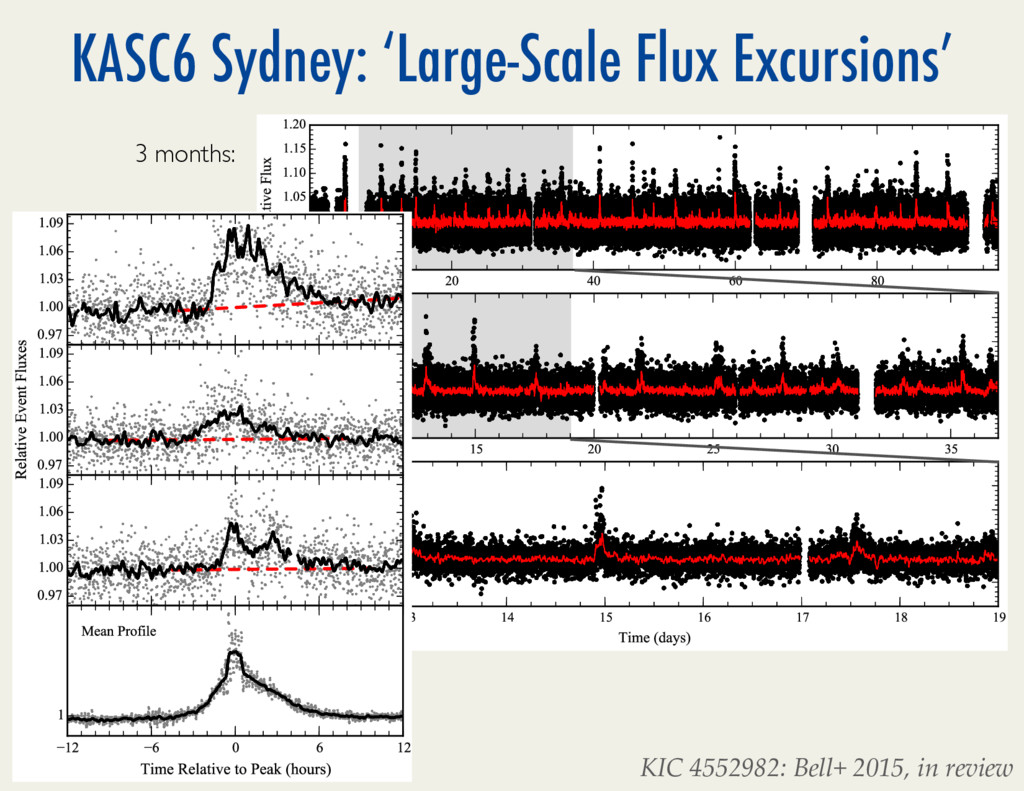
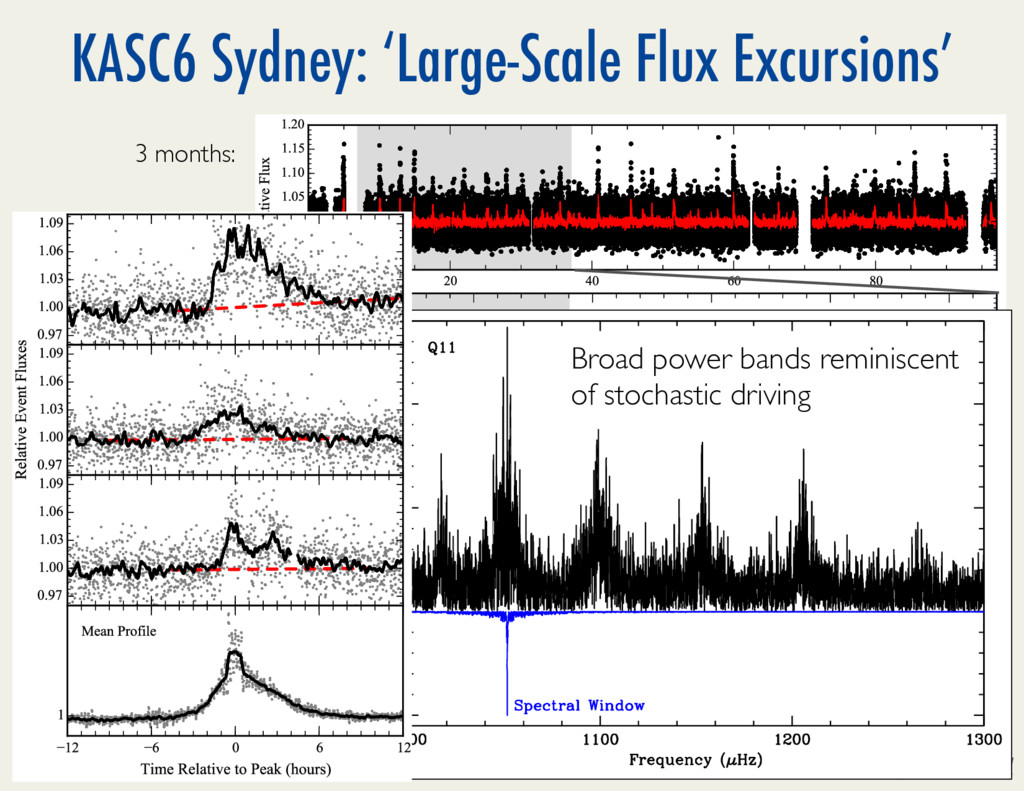
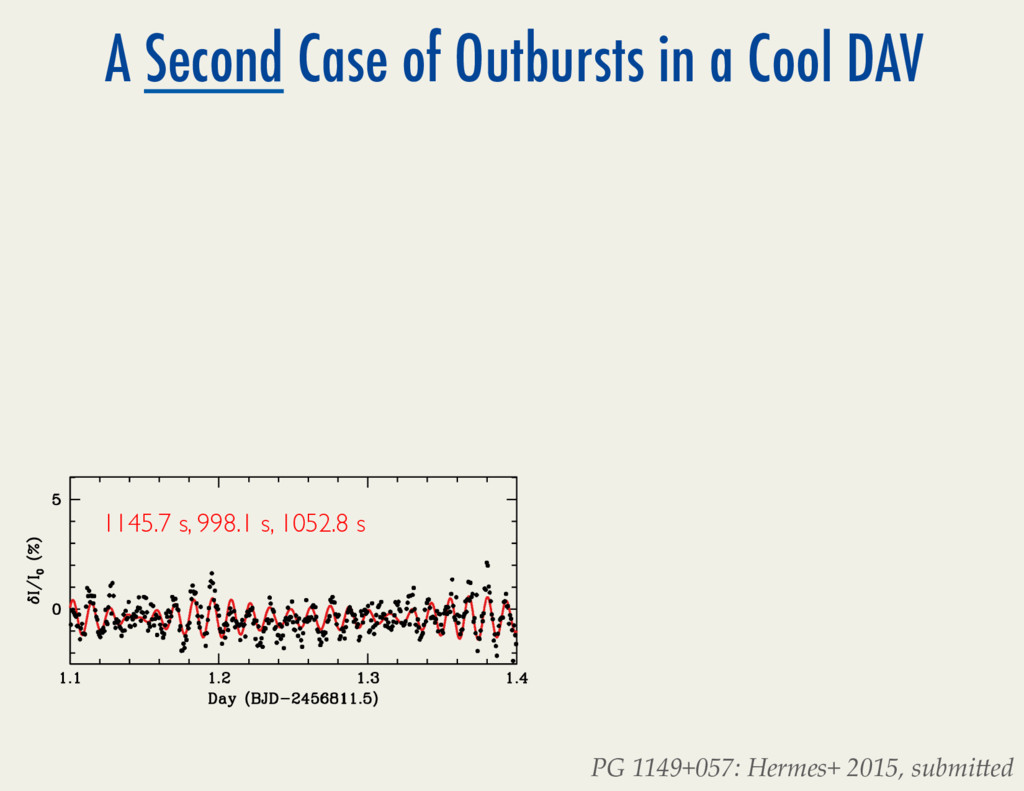
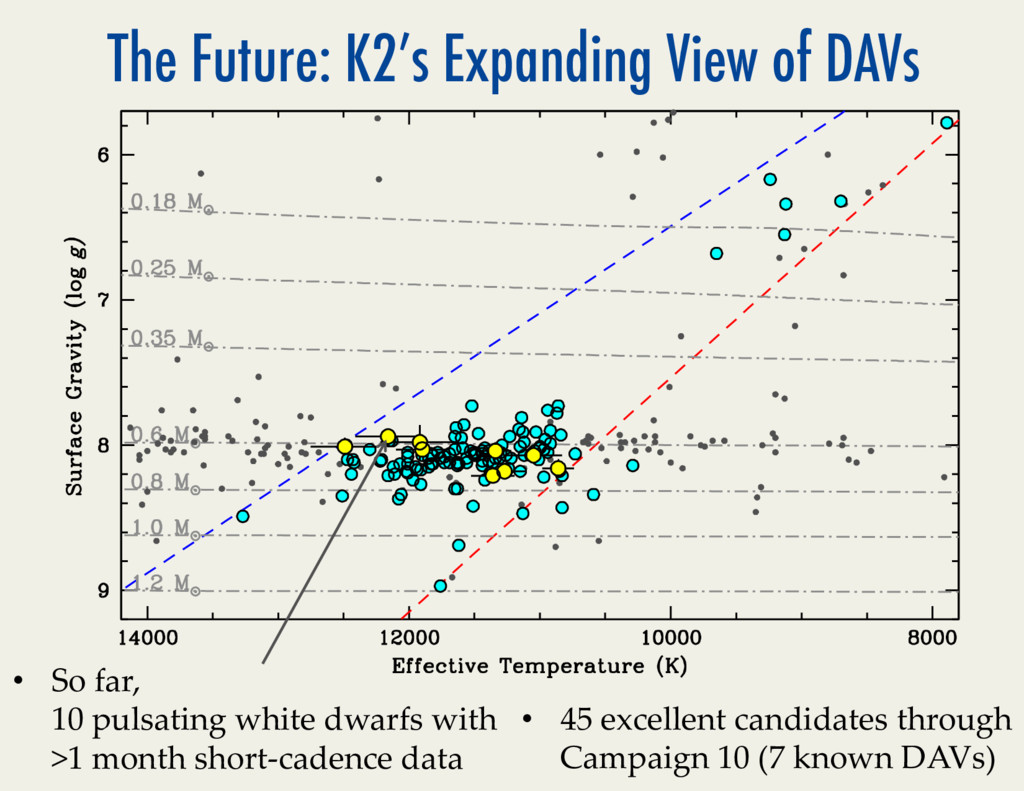
not exactly 0.5. If we adopt the Ck,l values of the model from Romero et al. (2012) discussed in Section 4.2, we obtain a rotation rate of 3.5 ± 0.2 d. To best reflect the systematic uncertainties, we adopt a rotation rate of 3.5 ± 0.5 d. Notably, the small but significant deviations in the observed fre- quency splittings provide additional asteroseismic information, es- pecially useful for constraining which modes are trapped by com- position transition zones (Brassard et al. 1992). The shorter-period g modes have lower radial order, and these splittings are observed to have values of 1.97 µHz for f1 , 1.77 µHz for f2 , 2.03 µHz for f3 and 1.94 µHz for f4 . This value is in agreement with previous rotation frequencies found in ZZ Ceti stars. Fontaine & Brassard (2008) give an overview on pulsating WDs and provide the asteroseismic rotation rates of seven ZZ Ceti stars, spanning from 9 to 55 h, i.e. 0.4 to 2.3 d. In the case of non-pulsating WDs, the sharp NLTE core of the Hα line in their spectra has been used in many studies to measure the projected rotation velocities of the stars (Heber, Napiwotzki & Reid 1997; Koester et al. 1998; Karl et al. 2005). In all cases, the same conclusion was drawn: isolated WDs are generally slow rotators. 5 CONCLUSION We report on the discovery of the second ZZ Ceti in the Kepler field: KIC 11911480. It was discovered using colour selections from the Kepler-INT Survey and confirmed with ground-based time series photometry from the RATS-Kepler survey. Follow-up Kepler short- cadence observations during Q12 and Q16 are analysed: five inde- • Kp /=*18.1*mag*DAV2 • 6*months*Kepler*data2 • Clean*rotational* spli\ings:* 2P rot (=(3.5(±(0.5(days. • 0.57*±*0.06*M! *WD:* 2~1.5*M! *(F)*progenitor2 Web Formulas ⌫ = m(1 Ck,` )⌦ l. 4.3 Rotation rate We see what appears to be multiplet splitting of some modes, which is a direct manifestation of the star’s rotation rate (Fig. 5). In the limit of slow rotation, the difference between the frequency of one mode of indices l, k, m (σk,lm ) and the frequency in the non-rotating case (σk,l ) is: σk,l,m − σk,l = m(1 − Ck,l ) (1) where Ck,l comes from the Coriolis force term in the momentum equation and is the rotation frequency (Winget et al. 1991; Vau- clair 1997). Note that this equation is the classical first-order ex- pansion. In the asymptotic limit for g modes, Ck,l only depends on the degree of the mode: Ck,l ≃ 1 l(l+1) . When a pulsating WD ro- tates, each mode of degree l can be split into 2l+1 components. We see splitting into three components in several modes in the power spectrum of KIC 11911480 (see Fig. 5), which likely corre- sponds to an ℓ = 1 mode in those cases, leading to Ck,l ≃ 0.5. The frequency spacing between the split components of the modes is quite consistent, 1.93 ± 0.10 µHz, suggesting these modes are all of the same spherical degree. This corresponds to a rotation rate of 3.0 ± 0.2 d. However, f1 − f4 (with periods from 172.9 to 324.5s) are likely low-radial-order and far from the asymptotic limit, so their Ck,l values should not be identical, and are not exactly 0.5. If we adopt the Ck,l values of the model from Romero et al. (2012) discussed in Section 4.2, we obtain a rotation rate of 3.5 ± 0.2 d. To best reflect the systematic uncertainties, we adopt a rotation rate of 3.5 ± 0.5 d. White Dwarf Rotation Made Easy with Kepler