Upgrade to Pro — share decks privately, control downloads, hide ads and more …

Meaningful performance metrics

Meaningful performance metrics

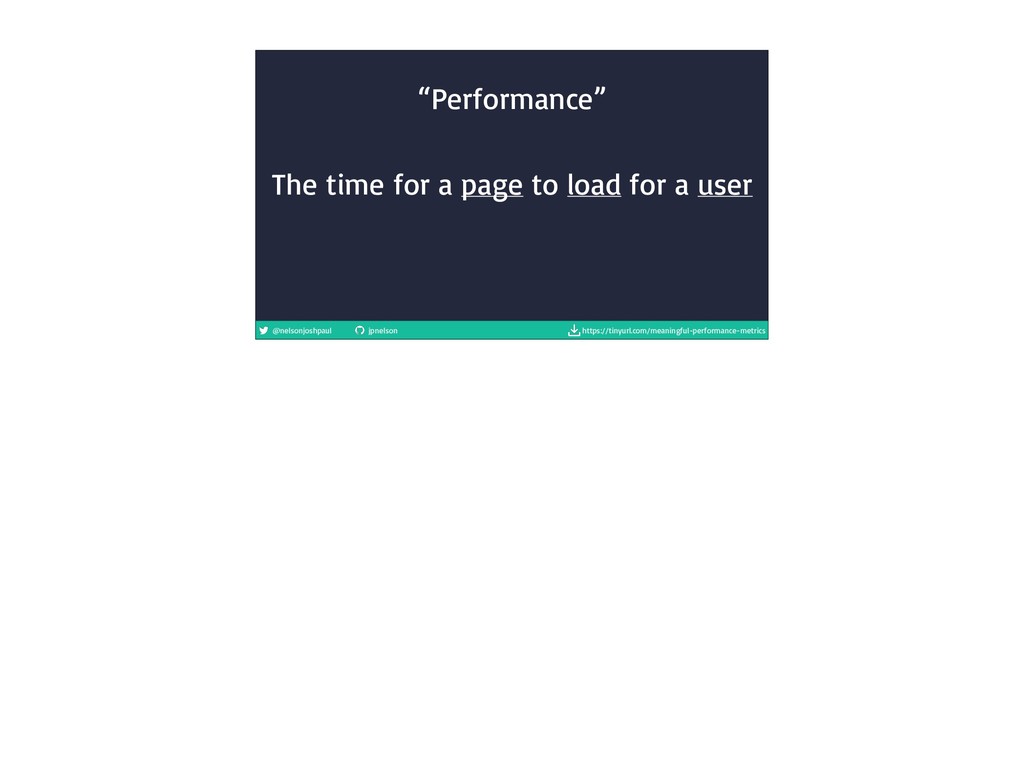
If you can't measure it, you can't improve it. But measuring load time is easy, right? "Load time" is an outdated concept, as single page app experiences take over the web. We need better metrics to measure what our users are really feeling.

Joshua Nelson

December 09, 2018
Tweet

More Decks by Joshua Nelson

Other Decks in Programming

Transcript

  1. @nelsonjoshpaul jpnelson https://tinyurl.com/meaningful-performance-metrics
    Josh Nelson Atlassian @nelsonjoshpaul he/him/his

    Meaningful performance metrics
    Measure the right stuff
    Illustrations designed by Freepik from flaticon.com

    View Slide

  2. @nelsonjoshpaul jpnelson https://tinyurl.com/meaningful-performance-metrics

    View Slide

  3. @nelsonjoshpaul jpnelson https://tinyurl.com/meaningful-performance-metrics
    15.6s

    View Slide

  4. @nelsonjoshpaul jpnelson https://tinyurl.com/meaningful-performance-metrics
    Median page load
    time on mobile

    View Slide

  5. @nelsonjoshpaul jpnelson https://tinyurl.com/meaningful-performance-metrics
    Let’s fix it

    View Slide

  6. @nelsonjoshpaul jpnelson https://tinyurl.com/meaningful-performance-metrics
    Developer @ Atlassian

    View Slide

  7. @nelsonjoshpaul jpnelson https://tinyurl.com/meaningful-performance-metrics
    * We make tools for teams

    * Hand up if you have ever used one of these tools

    * Honestly, even more stuff is out there than is listed here

    View Slide

  8. @nelsonjoshpaul jpnelson https://tinyurl.com/meaningful-performance-metrics
    * This is what Jira cloud looks like

    * If you haven’t used it for a while, check it out, we’ve made it even better

    View Slide

  9. @nelsonjoshpaul jpnelson https://tinyurl.com/meaningful-performance-metrics
    Performance
    We’re going to talk about performance.

    It’s an something we’re focusing on at Atlassian

    We’re looking to improve real user experiences

    View Slide

  10. @nelsonjoshpaul jpnelson https://tinyurl.com/meaningful-performance-metrics
    Who am I?
    But who am I to tell you about performance?

    View Slide

  11. @nelsonjoshpaul jpnelson https://tinyurl.com/meaningful-performance-metrics
    * Lived in Sydney Australia

    View Slide

  12. @nelsonjoshpaul jpnelson https://tinyurl.com/meaningful-performance-metrics
    Flat white

    View Slide

  13. @nelsonjoshpaul jpnelson https://tinyurl.com/meaningful-performance-metrics

    View Slide

  14. @nelsonjoshpaul jpnelson https://tinyurl.com/meaningful-performance-metrics
    Worlds tallest rubbish bin

    View Slide

  15. @nelsonjoshpaul jpnelson https://tinyurl.com/meaningful-performance-metrics
    * I know the pain of slow 
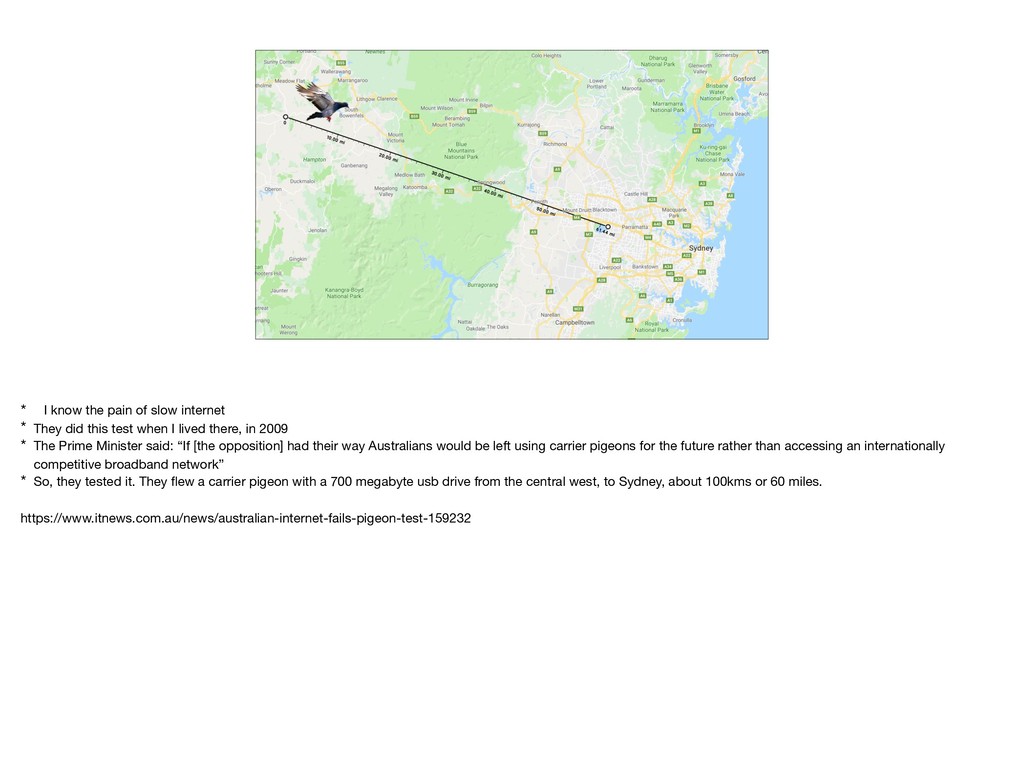
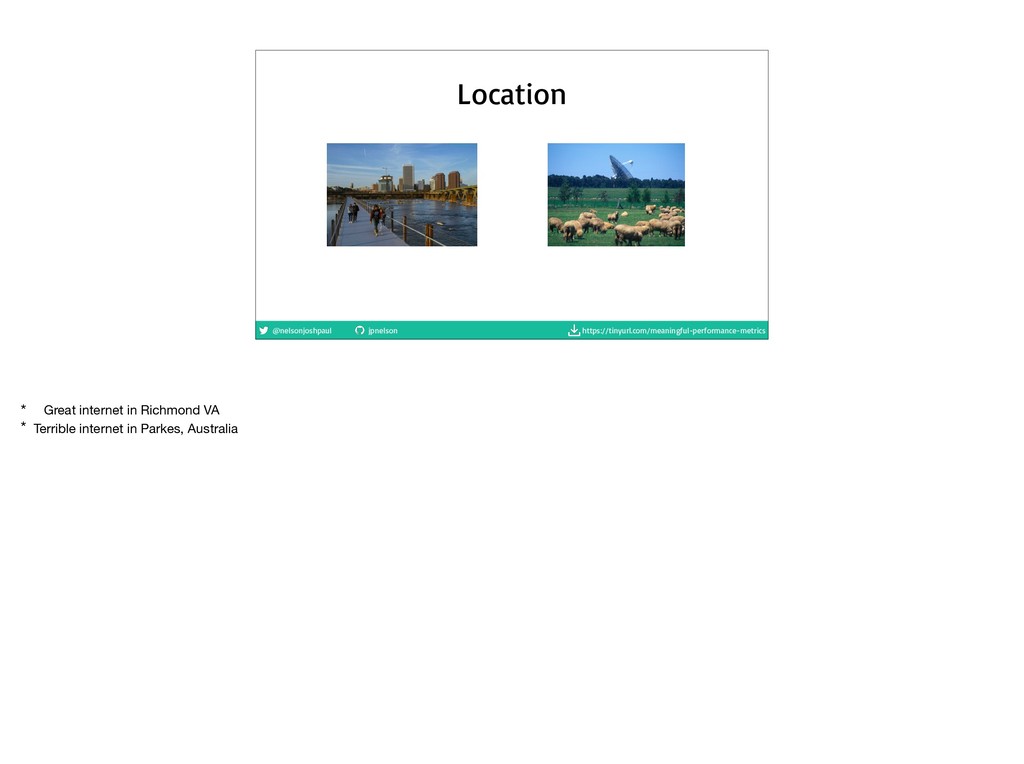
internet

    * They did this test when I lived there, in 2009

    * The Prime Minister said: “If [the opposition] had their way Australians would be left using carrier pigeons for the future rather than accessing an internationally
    competitive broadband network”

    * So, they tested it. They flew a carrier pigeon with a 700 megabyte usb drive from the central west, to Sydney, about 100kms or 60 miles.

    https://www.itnews.com.au/news/australian-internet-fails-pigeon-test-159232

    View Slide

  16. @nelsonjoshpaul jpnelson https://tinyurl.com/meaningful-performance-metrics
    * The pigeon won, in 1:05

    * They sent a car too, which took 2:10

    * The internet dropped out twice and didn’t even make it

    View Slide

  17. @nelsonjoshpaul jpnelson https://tinyurl.com/meaningful-performance-metrics
    * Internet speeds suck out there.


    “Never underestimate the bandwidth of a station wagon full of tapes hurtling down the highway.

    –Andrew Tanenbaum, 1981”

    View Slide

  18. @nelsonjoshpaul jpnelson https://tinyurl.com/meaningful-performance-metrics
    ADSL speed in Australia: ~7990kbps
    * This is kind of shocking for anyone who visits Australia from America

    View Slide

  19. @nelsonjoshpaul jpnelson https://tinyurl.com/meaningful-performance-metrics
    Good news! Internet gets faster
    over time
    * But don’t worry! As technology changes, things get better over time automatically!

    View Slide

  20. @nelsonjoshpaul jpnelson https://tinyurl.com/meaningful-performance-metrics
    * Internet speed in the US over time, in megabits per second. Going up!

    https://www.statista.com/statistics/616210/average-internet-connection-speed-in-the-us/

    View Slide

  21. @nelsonjoshpaul jpnelson https://tinyurl.com/meaningful-performance-metrics
    * And great! Thanks to Moore’s law, 
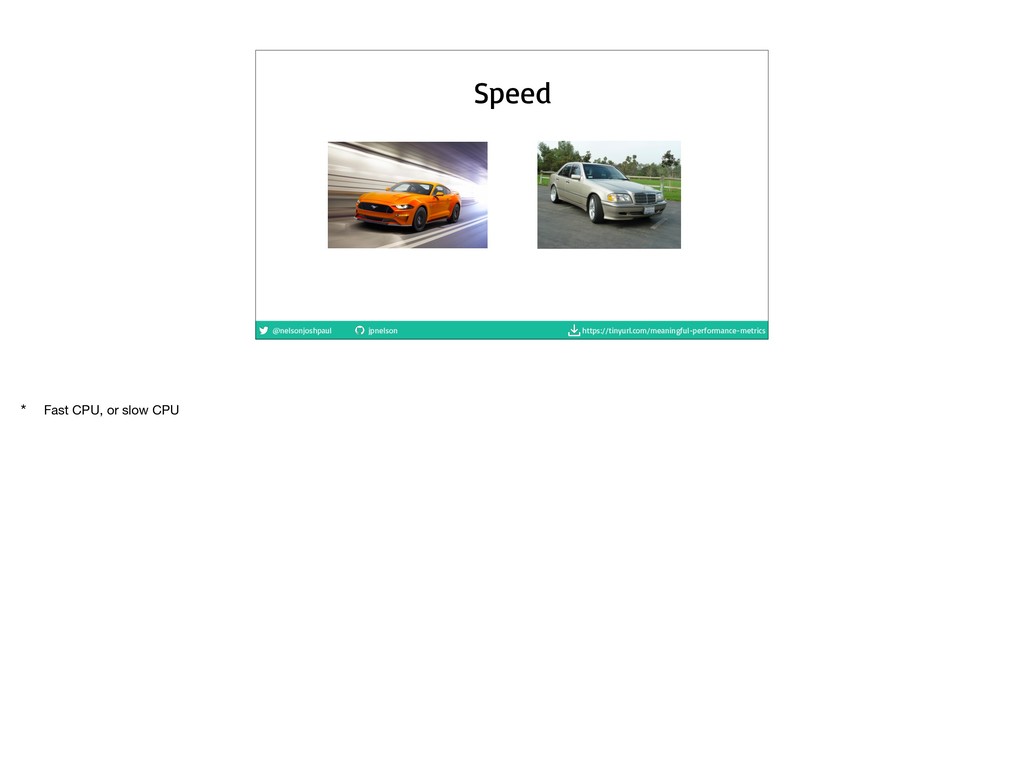
CPU speeds have been going up for years!

    * Sweet, problem solved, right?

    https://www.statista.com/statistics/616210/average-internet-connection-speed-in-the-us/

    View Slide

  22. @nelsonjoshpaul jpnelson https://tinyurl.com/meaningful-performance-metrics
    But the web isn’t getting faster!

    View Slide

  23. @nelsonjoshpaul jpnelson https://tinyurl.com/meaningful-performance-metrics
    * Massive survey on the state of 
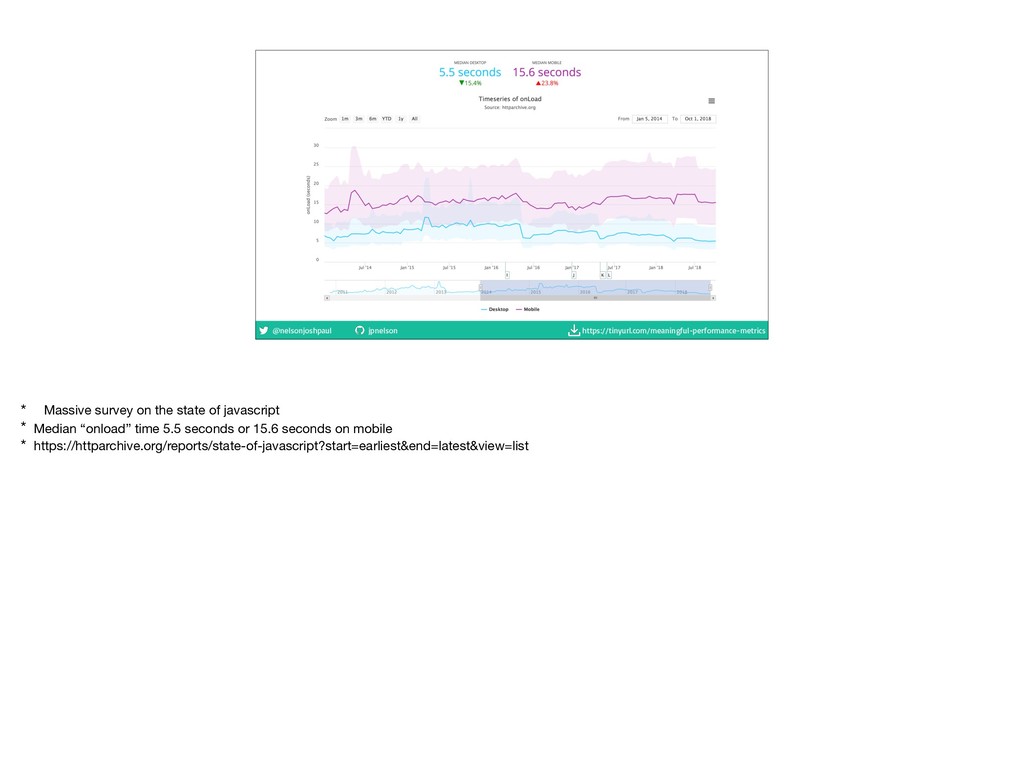
javascript

    * Median “onload” time 5.5 seconds or 15.6 seconds on mobile

    * https://httparchive.org/reports/state-of-javascript?start=earliest&end=latest&view=list

    View Slide

  24. @nelsonjoshpaul jpnelson https://tinyurl.com/meaningful-performance-metrics
    Why?
    * We’re getting

    View Slide

  25. @nelsonjoshpaul jpnelson https://tinyurl.com/meaningful-performance-metrics
    * There’s a similar thing with highways.

    * When they add highway lanes, traffic doesn’t improve

    View Slide

  26. @nelsonjoshpaul jpnelson https://tinyurl.com/meaningful-performance-metrics
    1% increase in capacity →

    Up to 
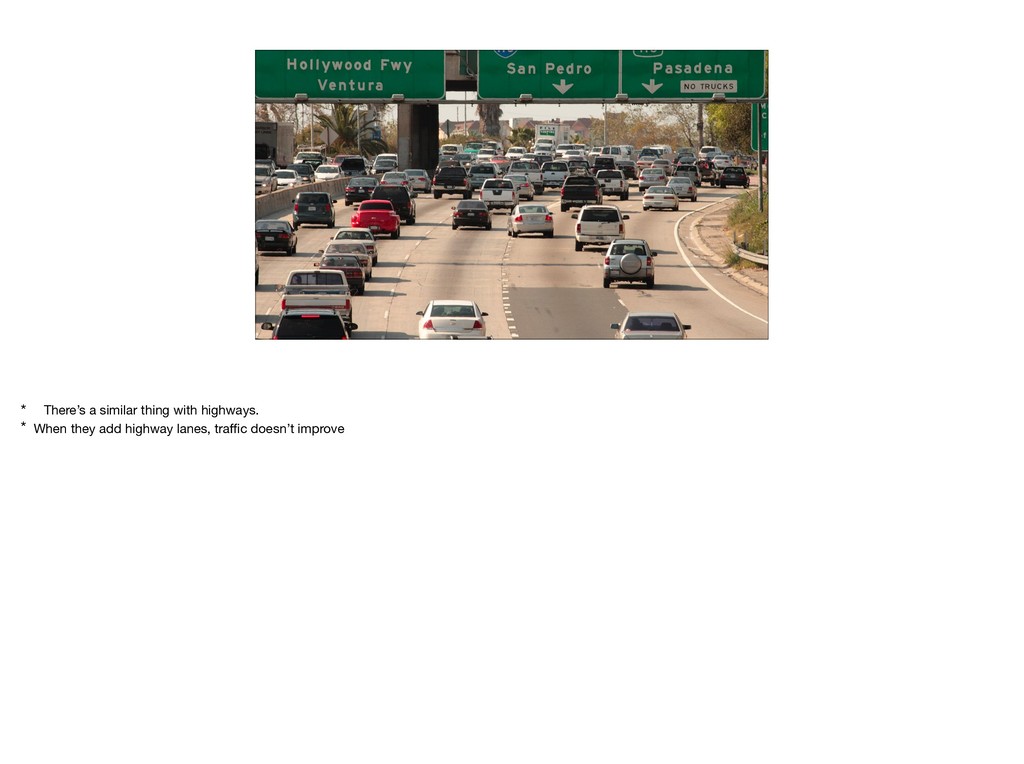
1.1% increase in demand
    * The “induced demand” effect

    for every 1 percent increase in highway capacity, traffic increases 0.29 to 1.1 percent in the long term (about five years out), and up to 0.68 percent in the short term (one
    or two years)

    https://trrjournalonline.trb.org/doi/abs/10.3141/2653-02?journalCode=trr

    View Slide

  27. @nelsonjoshpaul jpnelson https://tinyurl.com/meaningful-performance-metrics
    * Same survey shows us that page weight is going up too

    * https://httparchive.org/reports/state-of-javascript?start=earliest&end=latest&view=list

    View Slide

  28. @nelsonjoshpaul jpnelson https://tinyurl.com/meaningful-performance-metrics
    It’s not getting better

    View Slide

  29. @nelsonjoshpaul jpnelson https://tinyurl.com/meaningful-performance-metrics
    But for the sake of the user, it
    needs to.
    * Performance is a problem

    View Slide

  30. @nelsonjoshpaul jpnelson https://tinyurl.com/meaningful-performance-metrics
    Performance impacts
    1. Business goals

    2. User happiness

    3. The world
    * Performance is a problem

    View Slide

  31. @nelsonjoshpaul jpnelson https://tinyurl.com/meaningful-performance-metrics
    Business goals
    One second delay in Bing results in a
    2.8% drop in revenue. Two second delay
    results in 4.3% drop.
    * https://wpostats.com/tags/revenue/

    View Slide

  32. @nelsonjoshpaul jpnelson https://tinyurl.com/meaningful-performance-metrics
    Business goals
    Walmart: 2% increase in conversions 
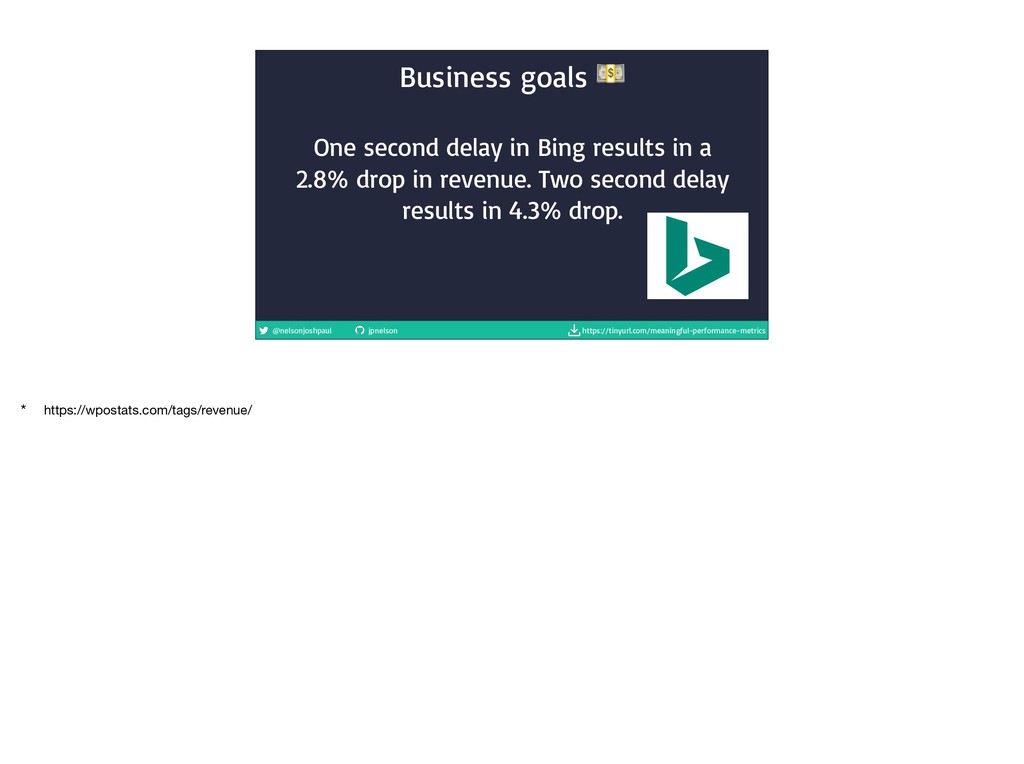
for
    every 1 second of improvement in load time.

    Every 100ms improvement also resulted in
    up to a 1% increase in revenue.
    * It’s a UX problem

    * https://wpostats.com/tags/revenue/

    View Slide

  33. @nelsonjoshpaul jpnelson https://tinyurl.com/meaningful-performance-metrics
    Business goals
    Google's DoubleClick found that publishers
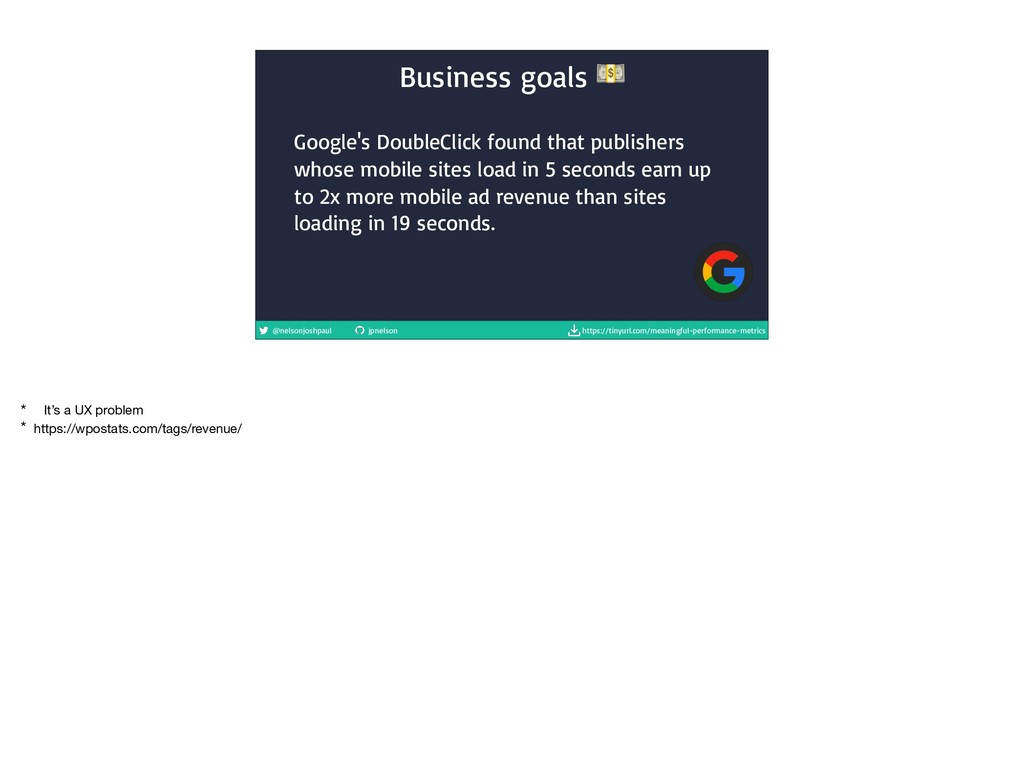
    whose mobile sites load in 5 seconds earn up
    to 2x more mobile ad revenue than sites
    loading in 19 seconds.
    * It’s a UX problem

    * https://wpostats.com/tags/revenue/

    View Slide

  34. @nelsonjoshpaul jpnelson https://tinyurl.com/meaningful-performance-metrics
    Business goals
    * Show this picture to your manager and they’ll be immediately convinced

    View Slide

  35. @nelsonjoshpaul jpnelson https://tinyurl.com/meaningful-performance-metrics
    The world
    “Youtube feather”
    * Made a version of youtube 90% lighter

    * Opt in to small % of traffic.

    * But average load time went up??

    View Slide

  36. @nelsonjoshpaul jpnelson https://tinyurl.com/meaningful-performance-metrics
    The world
    Southeast Asia, South America, Africa 
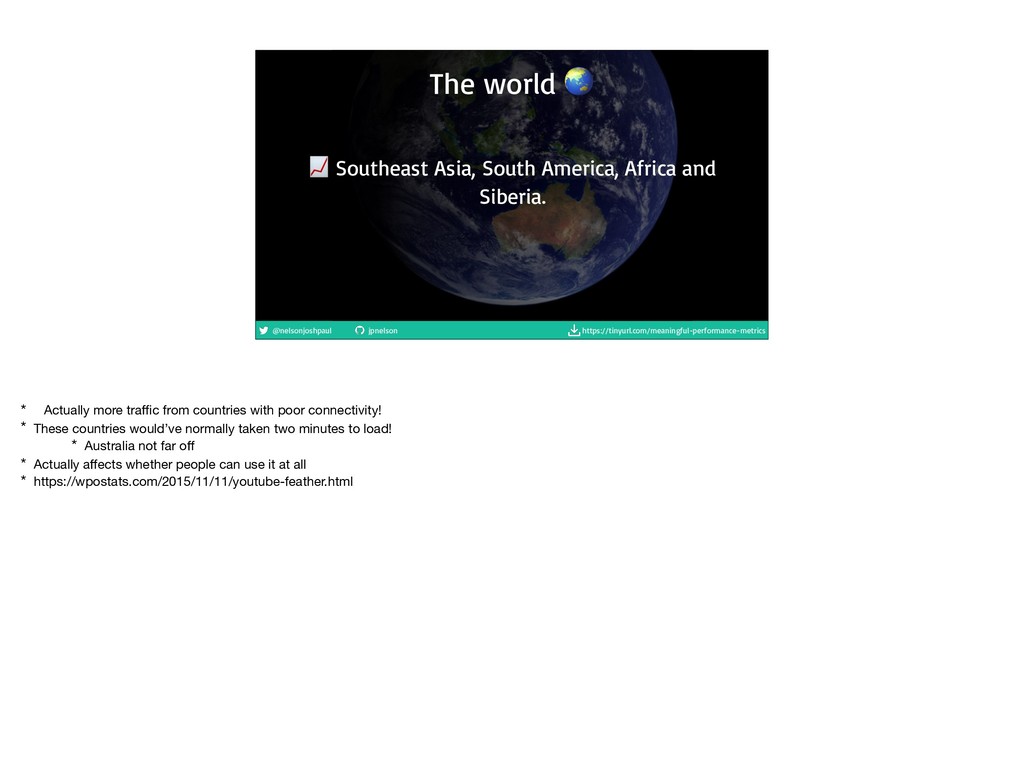
and
    Siberia.
    * Actually more traffic from countries with poor connectivity!

    * These countries would’ve normally taken two minutes to load!

    * Australia not far off

    * Actually affects whether people can use it at all

    * https://wpostats.com/2015/11/11/youtube-feather.html
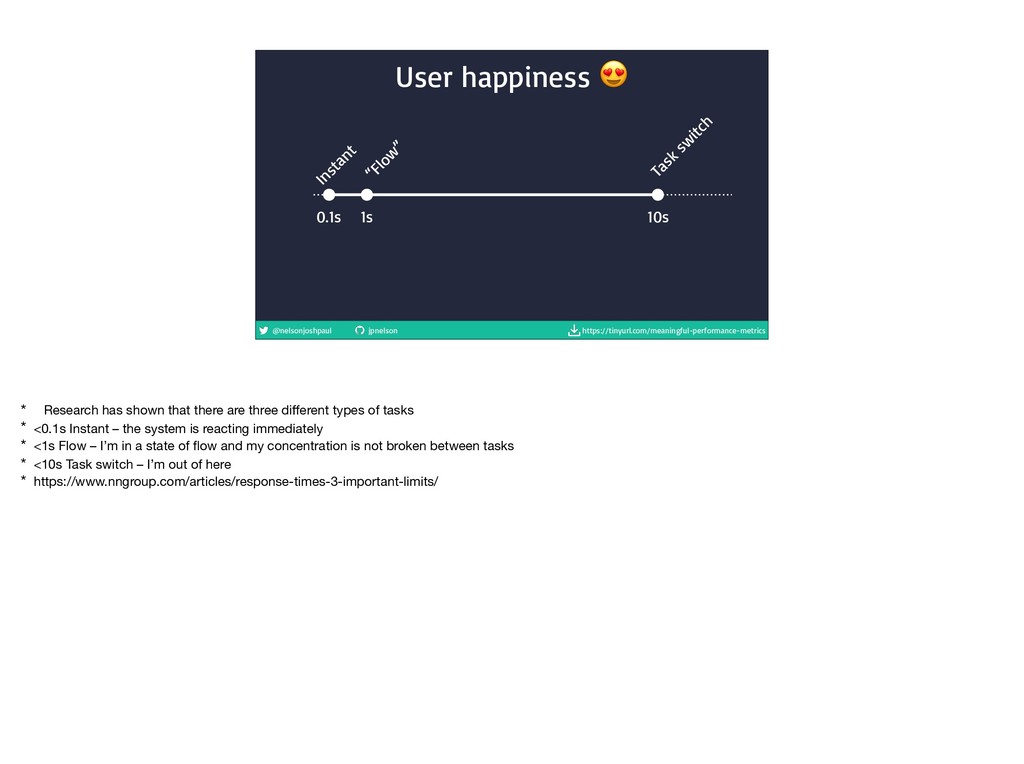
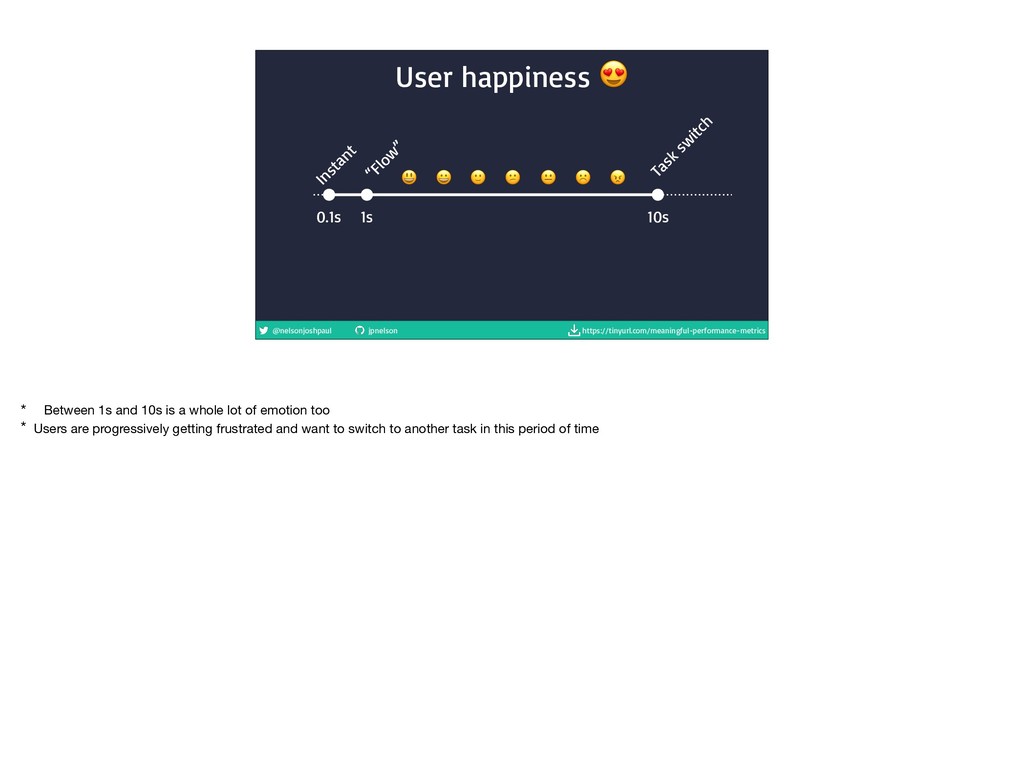
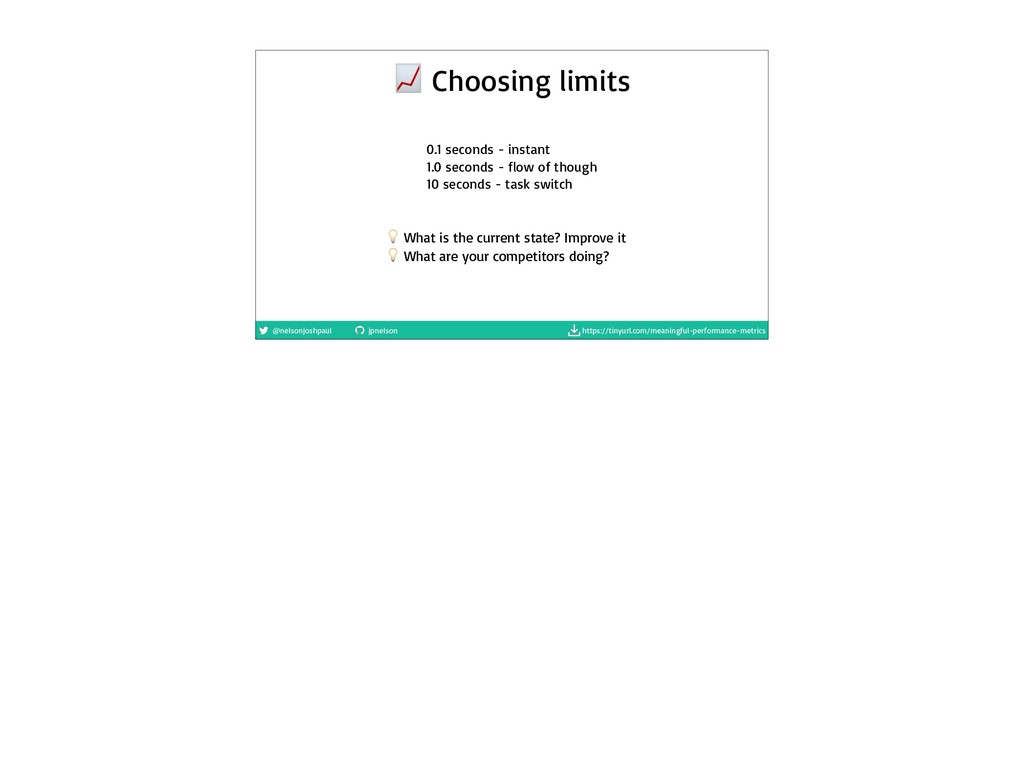
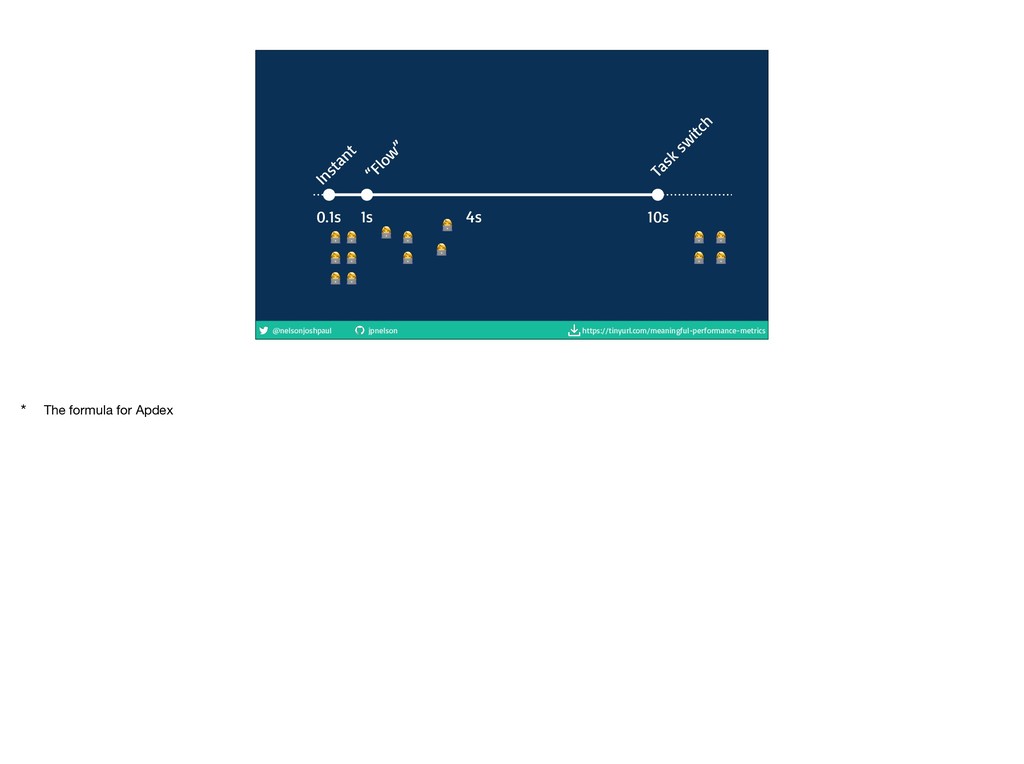
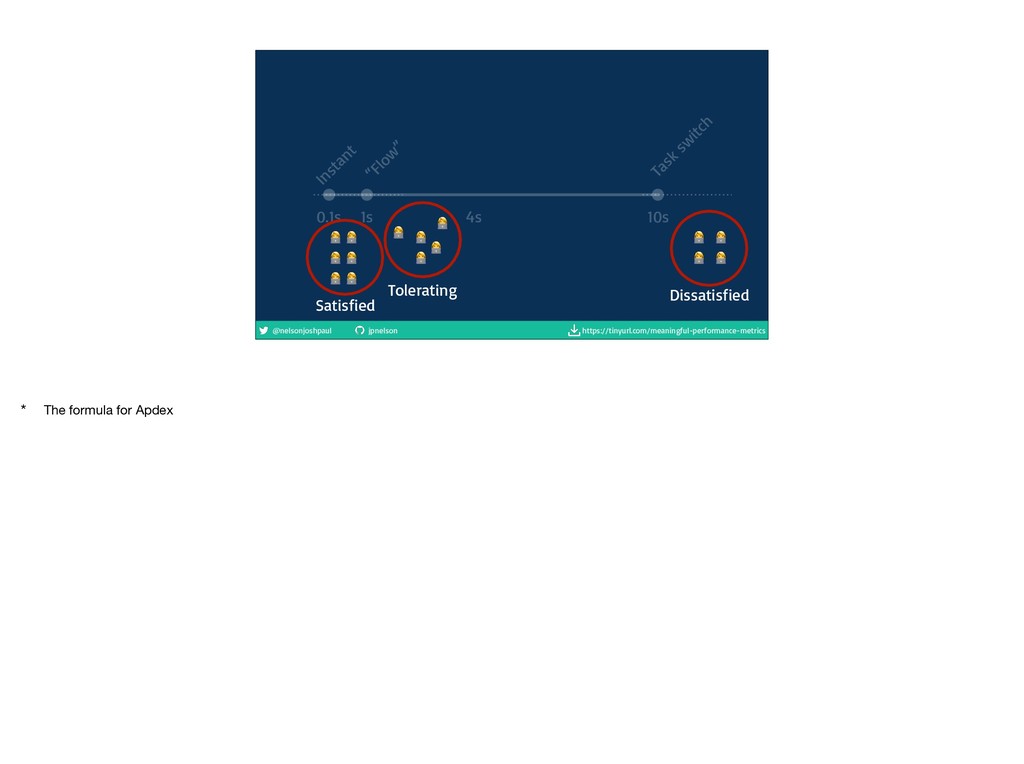
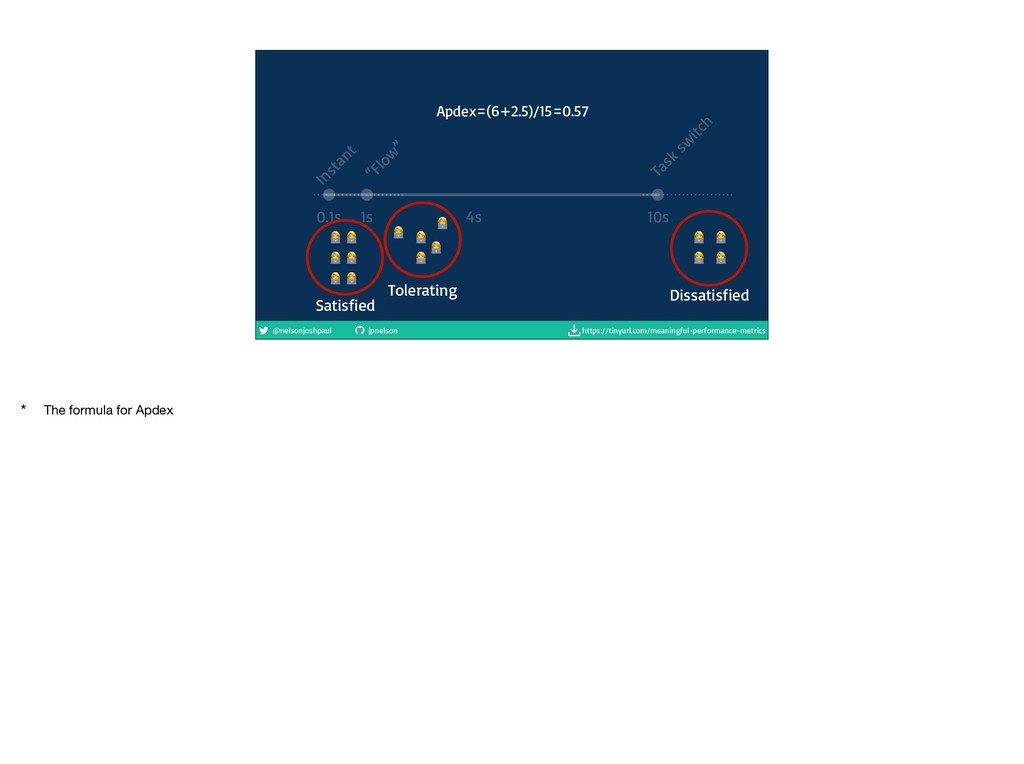
    View Slide

  37. @nelsonjoshpaul jpnelson https://tinyurl.com/meaningful-performance-metrics
    User happiness
    0.1s 1s 10s
    Instant
    “Flow

    Task
    sw
    itch
    * Research has shown that there are three different types of tasks

    * <0.1s Instant – the system is reacting immediately

    * <1s Flow – I’m in a state of flow and my concentration is not broken between tasks

    * <10s Task switch – I’m out of here

    * https://www.nngroup.com/articles/response-times-3-important-limits/

    View Slide

  38. @nelsonjoshpaul jpnelson https://tinyurl.com/meaningful-performance-metrics
    User happiness
    0.1s 1s 10s
    Instant
    “Flow

    Task
    sw
    itch

    * Between 1s and 10s is a whole lot of emotion too

    * Users are progressively getting frustrated and want to switch to another task in this period of time

    View Slide

  39. @nelsonjoshpaul jpnelson https://tinyurl.com/meaningful-performance-metrics
    User happiness
    0.1s 1s 10s
    Instant
    “Flow

    Task
    sw
    itch

    Median
    desktop
    5.5s 15.6s
    Median
    mobile
    * Between 1s and 10s is a whole lot of emotion too

    * Users are progressively getting frustrated and want to switch to another task in this period of time

    View Slide

  40. @nelsonjoshpaul jpnelson https://tinyurl.com/meaningful-performance-metrics
    Poor performance is an ignored
    problem
    * Not only is it a problem, it’s an ignored problem

    View Slide

  41. @nelsonjoshpaul jpnelson https://tinyurl.com/meaningful-performance-metrics
    Preaching to the choir
    * I’m sure I’m preaching to the choir here, if you’ve come to this talk.

    * Do you agree with these statistics that I’ve mentioned so far?

    * Have you already heard it before?

    * Do you really care?

    View Slide

  42. @nelsonjoshpaul jpnelson https://tinyurl.com/meaningful-performance-metrics
    Then, why?
    Then, why can’t we instigate change across our organizations?

    View Slide

  43. @nelsonjoshpaul jpnelson https://tinyurl.com/meaningful-performance-metrics
    “It’s such a big problem, we
    can’t tackle it”
    The “give up”
    Then, why?

    View Slide

  44. @nelsonjoshpaul jpnelson https://tinyurl.com/meaningful-performance-metrics
    “It’s ok, our users
    have fast internet”
    The denial
    Then, why?

    View Slide

  45. @nelsonjoshpaul jpnelson https://tinyurl.com/meaningful-performance-metrics
    1: Oh god “performance” is terrible

    2: We fixed performance!

    3: Wait

    4: GOTO 1
    The loop
    Then, why?

    View Slide

  46. @nelsonjoshpaul jpnelson https://tinyurl.com/meaningful-performance-metrics
    This continues until the inevitable heat death of the universe

    Ever expanding entropy claims all. Chaos reigns supreme

    We can’t control it. Performance will always regress

    View Slide

  47. @nelsonjoshpaul jpnelson https://tinyurl.com/meaningful-performance-metrics
    Or, we try
    Or, we try and beat it.

    View Slide

  48. @nelsonjoshpaul jpnelson https://tinyurl.com/meaningful-performance-metrics
    Meaningful metrics can save you
    Meaningful metrics can save you

    Let me explain how

    View Slide

  49. @nelsonjoshpaul jpnelson https://tinyurl.com/meaningful-performance-metrics
    Why measure
    What to measure
    ✅ “Good” metrics
    ⚖ Metric choices
    ⚒ Ways to measure
    Protect performance
    Here’s an overview of what I’m going to talk about today

    View Slide

  50. @nelsonjoshpaul jpnelson https://tinyurl.com/meaningful-performance-metrics
    Why measure
    What to measure
    ✅ “Good” metrics
    ⚖ Metric choices
    ⚒ Ways to measure
    Protect performance
    First, talk about why measure

    View Slide

  51. @nelsonjoshpaul jpnelson https://tinyurl.com/meaningful-performance-metrics
    “I already know what to fix,

    let’s just fix it!”
    This is really tempting

    You probably already have an idea of what changes you need to make.

    “Yeah, we need to get our bundle size down, and we need to speed up this particular endpoint”

    However! Don’t let the takeaway from this talk be “I should go back and improve my app’s performance in this specific way”

    View Slide

  52. @nelsonjoshpaul jpnelson https://tinyurl.com/meaningful-performance-metrics
    You can’t improve what

    you can’t measure
    This is a popular saying

    Meaning: changing (improving) something requires knowing what you want to change, and how you can tell if it worked.

    It’s useful because you can know if you’re doing the right things for your goals.

    However, I think it’s missing something

    View Slide

  53. @nelsonjoshpaul jpnelson https://tinyurl.com/meaningful-performance-metrics
    You can’t meaningfully improve what
    you can’t 
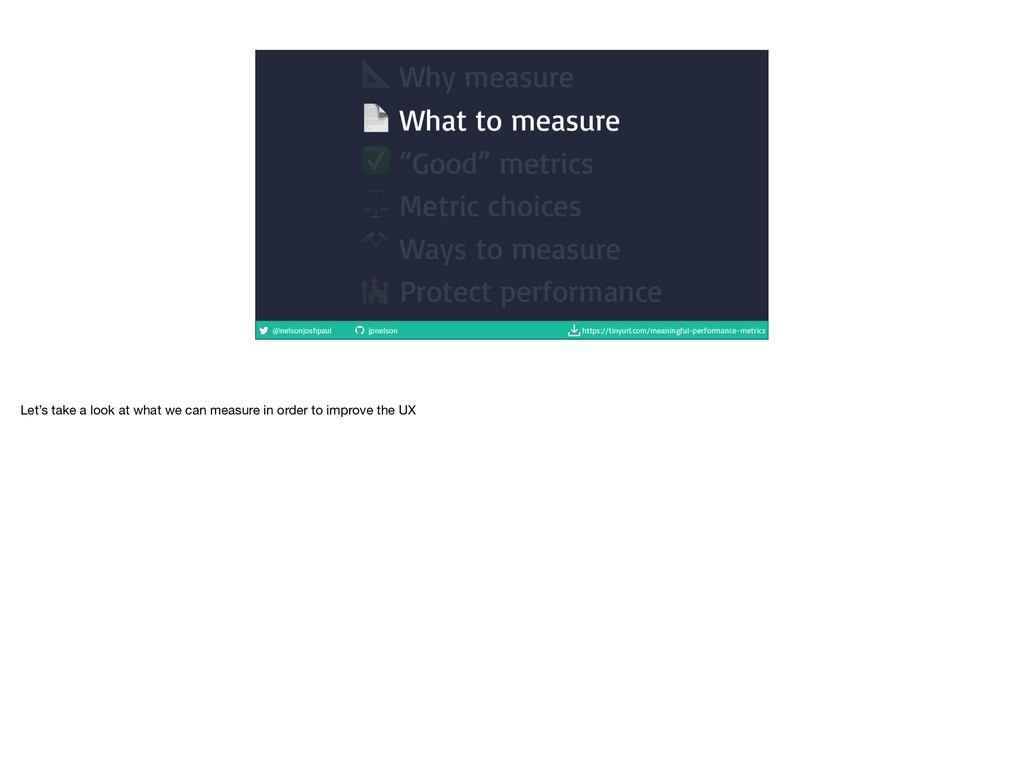
meaningfully measure
    I’m going to drop the word “meaningful” in there.

    It’s important that you’re measuring the right things

    Measuring something is easy, but measuring the right thing is hard

    You can’t make meaningful impacts without careful thought about what you’re measuring!

    You can’t change the right things if you’re not measuring the right things

    View Slide

  54. @nelsonjoshpaul jpnelson https://tinyurl.com/meaningful-performance-metrics
    You can’t meaningfully improve what
    you can’t meaningfully measure
    Just want to really emphasise that

    View Slide

  55. @nelsonjoshpaul jpnelson https://tinyurl.com/meaningful-performance-metrics
    You can’t meaningfully improve what
    you can’t meaningfully measure
    Like, really

    This slide deck contains the word meaningful 46 times

    View Slide

  56. @nelsonjoshpaul jpnelson https://tinyurl.com/meaningful-performance-metrics
    What is meaningful?
    As plato would say,

    View Slide

  57. @nelsonjoshpaul jpnelson https://tinyurl.com/meaningful-performance-metrics
    Better for users
    It’s what’s impactful for 
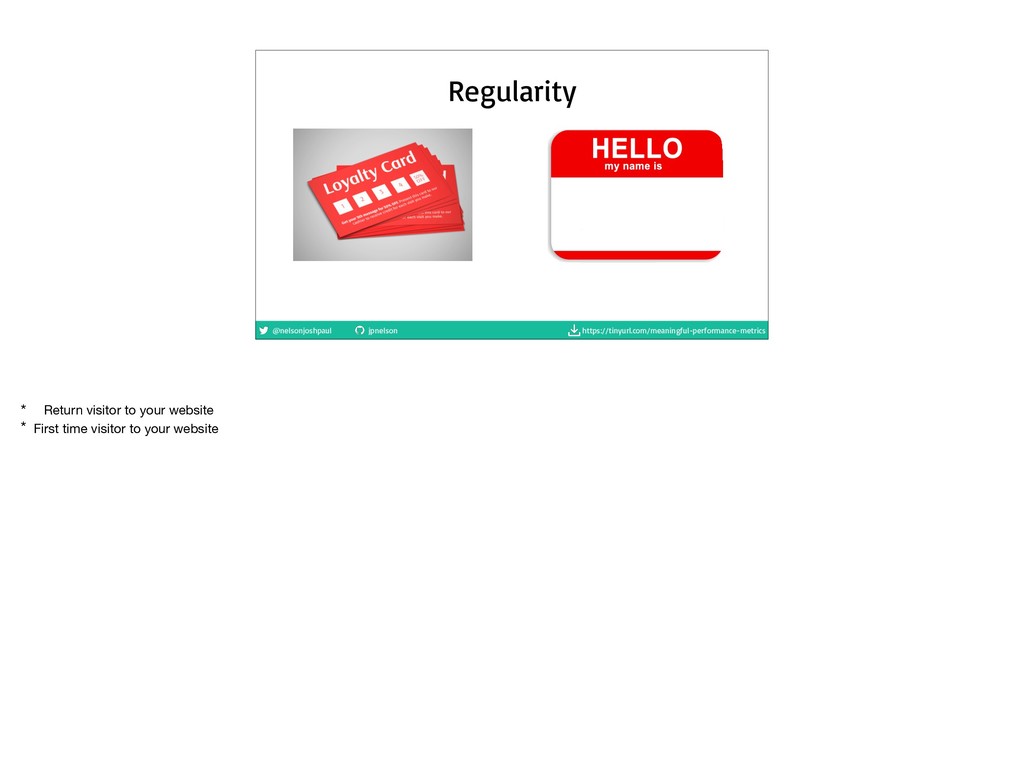
your users

    Ultimately, this is what it’s about

    Have a user centric metric

    As we said before, performance is a UX problem, so we need to measure what the users really are experiencing and put some thought into that

    View Slide

  58. @nelsonjoshpaul jpnelson https://tinyurl.com/meaningful-performance-metrics
    Why measure
    What to measure
    ✅ “Good” metrics
    ⚖ Metric choices
    ⚒ Ways to measure
    Protect performance
    Let’s take a look at what we can measure in order to improve the UX

    View Slide

  59. @nelsonjoshpaul jpnelson https://tinyurl.com/meaningful-performance-metrics
    “Performance”
    We often talk about “performance”. But how does that apply to our users?

    View Slide

  60. @nelsonjoshpaul jpnelson https://tinyurl.com/meaningful-performance-metrics
    The time for a page to load for a user
    “Performance”

    View Slide

  61. @nelsonjoshpaul jpnelson https://tinyurl.com/meaningful-performance-metrics
    The time for a page to load for a user
    “Performance”

    View Slide

  62. @nelsonjoshpaul jpnelson https://tinyurl.com/meaningful-performance-metrics
    This is a page, you might be familiar with it

    View Slide

  63. @nelsonjoshpaul jpnelson https://tinyurl.com/meaningful-performance-metrics
    Meaning Behaviour Appearance Media Information
    * If we’re going to think of it from the users perspective, it’s this

    View Slide

  64. @nelsonjoshpaul jpnelson https://tinyurl.com/meaningful-performance-metrics
    HTML Javascript CSS Assets Data
    { }
    * Which is, from our perspective, HTML, javascript, CSS, Assets, and data

    * So, how do these arrive in the users browser?

    View Slide

  65. @nelsonjoshpaul jpnelson https://tinyurl.com/meaningful-performance-metrics
    DNS lookup GET request Parse HTML Fetch 
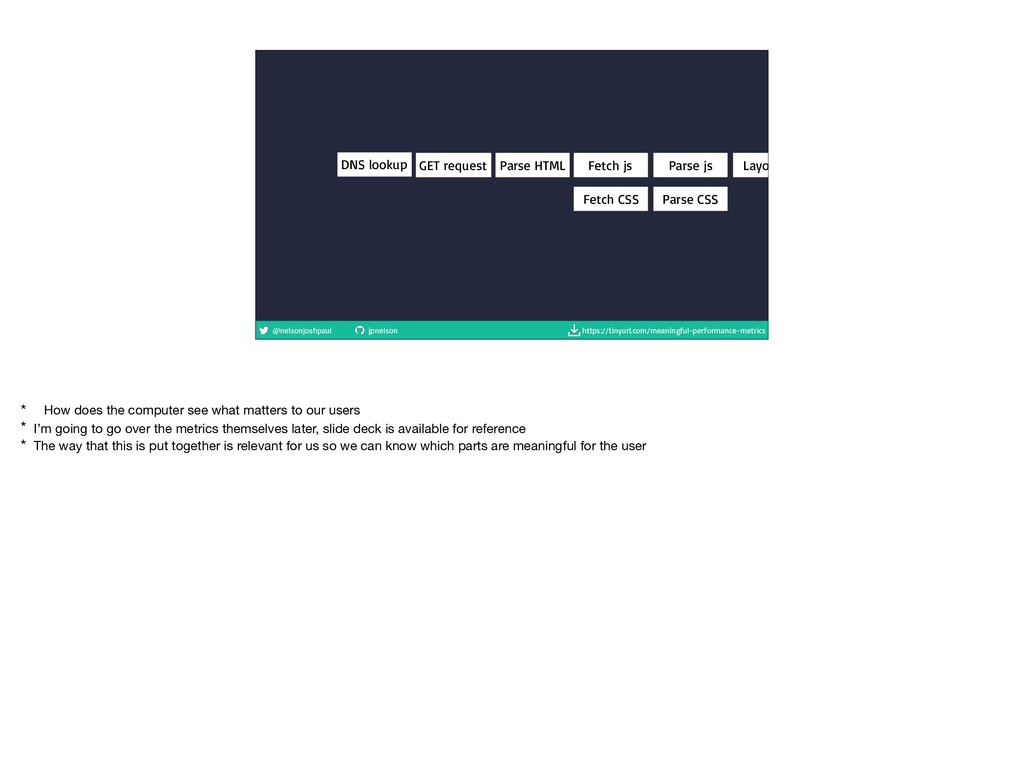
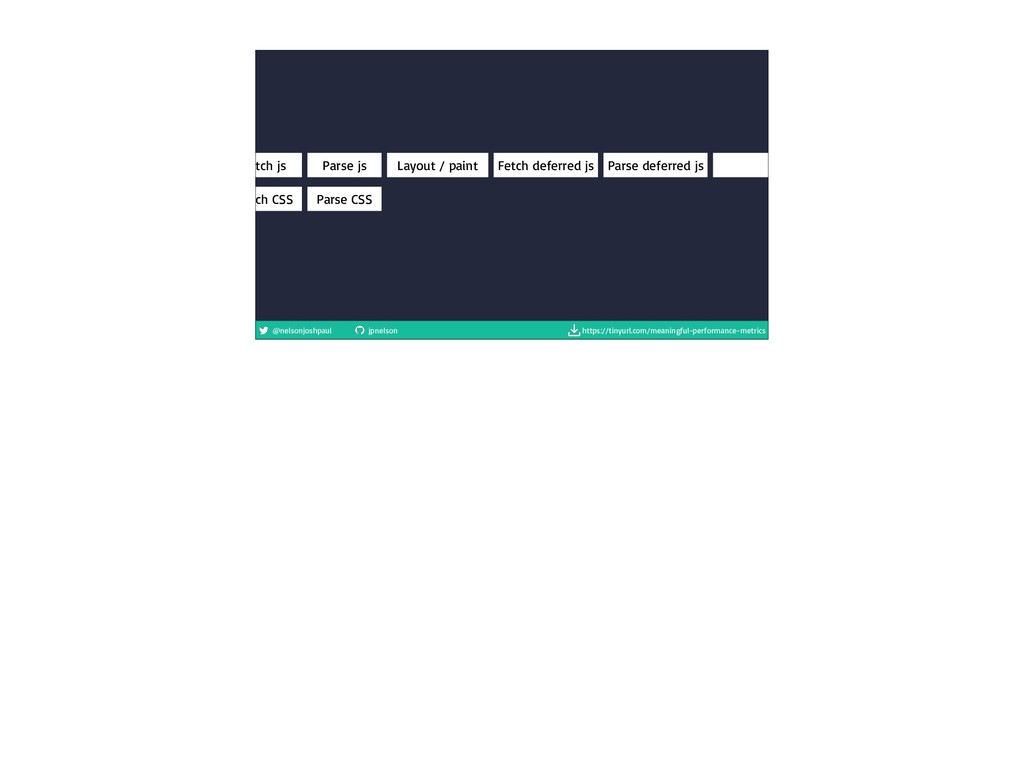
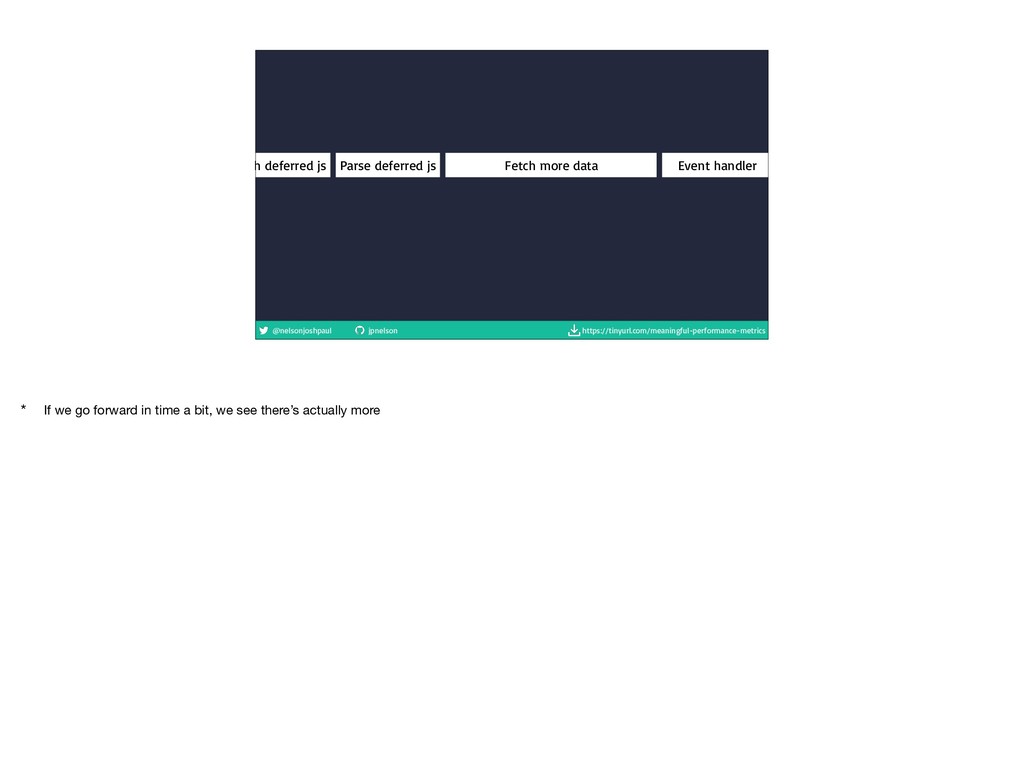
js
    Fetch CSS
    Parse js
    Parse CSS
    Layout / paint
    * How does the computer see what matters to our users

    * I’m going to go over the metrics themselves later, slide deck is available for reference

    * The way that this is put together is relevant for us so we can know which parts are meaningful for the user

    View Slide

  66. @nelsonjoshpaul jpnelson https://tinyurl.com/meaningful-performance-metrics
    Fetch js Fetch deferred js Parse deferred js
    Fetch CSS
    Parse js
    Parse CSS
    Fetch more data
    Layout / paint

    View Slide

  67. @nelsonjoshpaul jpnelson https://tinyurl.com/meaningful-performance-metrics
    Fetch deferred js Parse deferred js Fetch more data Event handler

    View Slide

  68. @nelsonjoshpaul jpnelson https://tinyurl.com/meaningful-performance-metrics
    Done?
    * This is what you’d traditionally consider a page to be

    * But, remember, we’re thinking about this in a meaningful context. What is meaningful to our users?

    * There’s more to what they might consider a “page”

    * With SPA’s and PWA’s, we need to be even more nuanced about what’s going on here

    View Slide

  69. @nelsonjoshpaul jpnelson https://tinyurl.com/meaningful-performance-metrics
    Fetch deferred js Parse deferred js Fetch more data Event handler
    * If we go forward in time a bit, we see there’s actually more

    View Slide

  70. @nelsonjoshpaul jpnelson https://tinyurl.com/meaningful-performance-metrics
    Fetch more data Event handler Push state
    Load data Rerender
    * You might reload data on button click

    * This is quite a different experience from the initial load, but a load nonetheless!

    *

    View Slide

  71. @nelsonjoshpaul jpnelson https://tinyurl.com/meaningful-performance-metrics
    • A HTML document

    • A single 
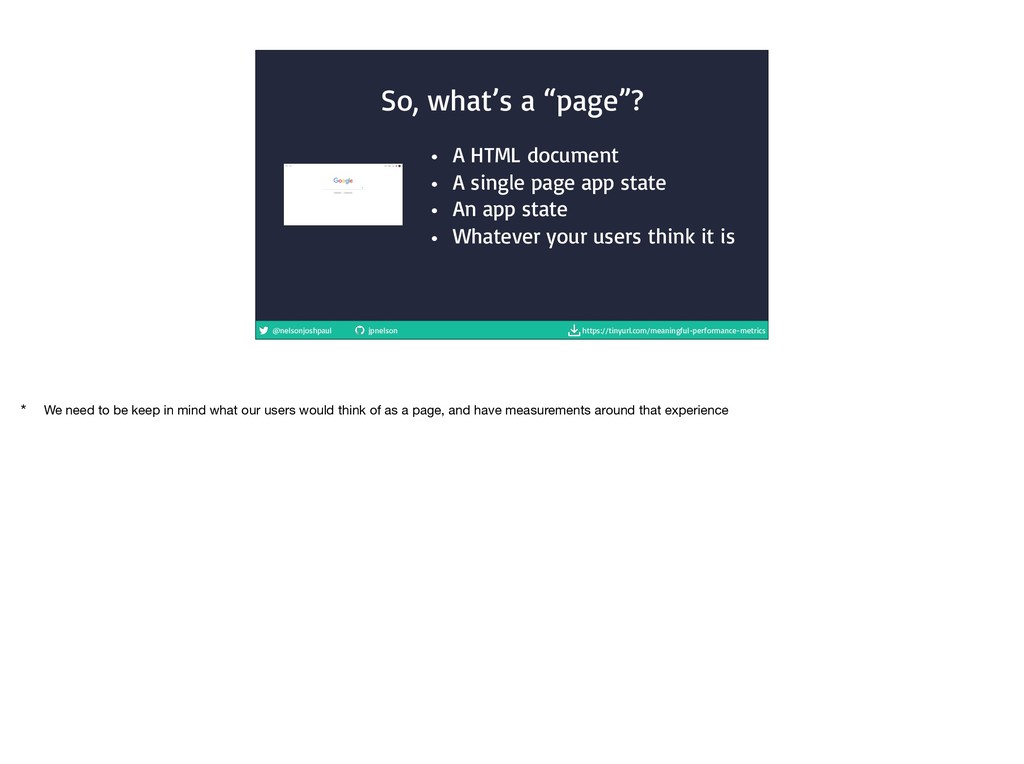
page app state

    • An app state

    • Whatever your users think it is
    So, what’s a “page”?
    * We need to be keep in mind what our users would think of as a page, and have measurements around that experience

    View Slide

  72. @nelsonjoshpaul jpnelson https://tinyurl.com/meaningful-performance-metrics
    The time for a page to load for a user
    “Performance”

    View Slide

  73. @nelsonjoshpaul jpnelson https://tinyurl.com/meaningful-performance-metrics
    This is a slowed down page load. Put your hand up, and lower it when you think the page is loaded

    View Slide

  74. @nelsonjoshpaul jpnelson https://tinyurl.com/meaningful-performance-metrics
    Load is not a single moment in 
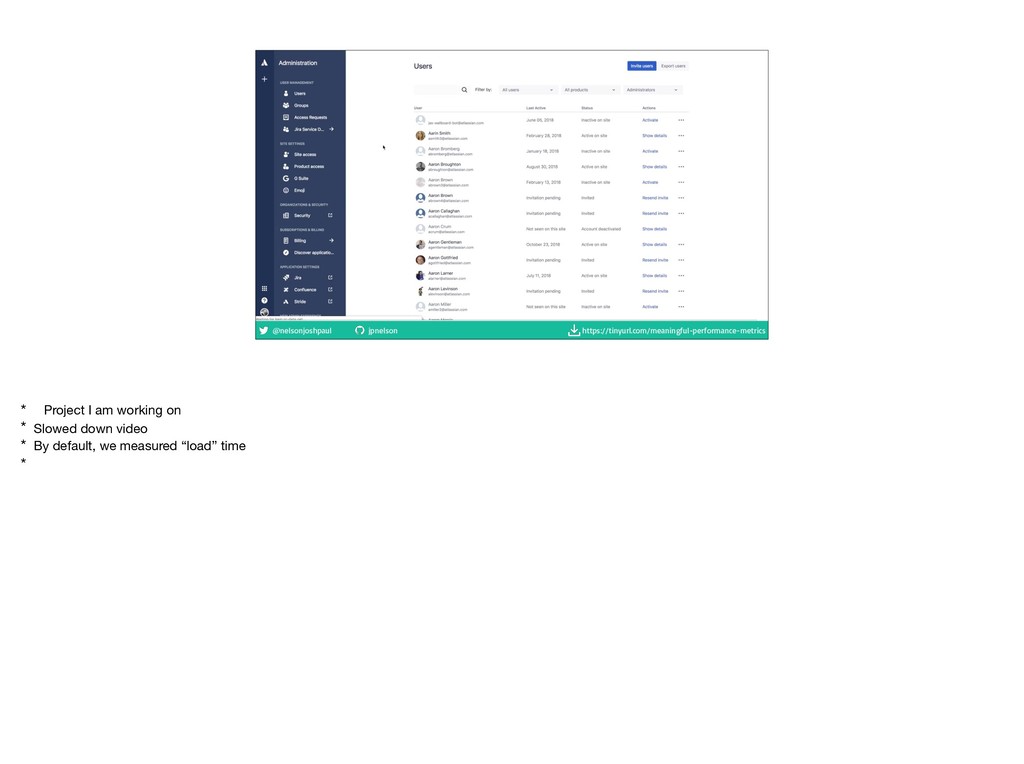
time — it’s an
    experience that no one metric can fully capture.
    There are multiple moments during the load
    experience that can affect whether a user
    perceives it as "fast" or “slow"

    – https://w3c.github.io/paint-timing/
    https://w3c.github.io/paint-timing/

    View Slide

  75. @nelsonjoshpaul jpnelson https://tinyurl.com/meaningful-performance-metrics
    Loading is not a boolean state
    There 
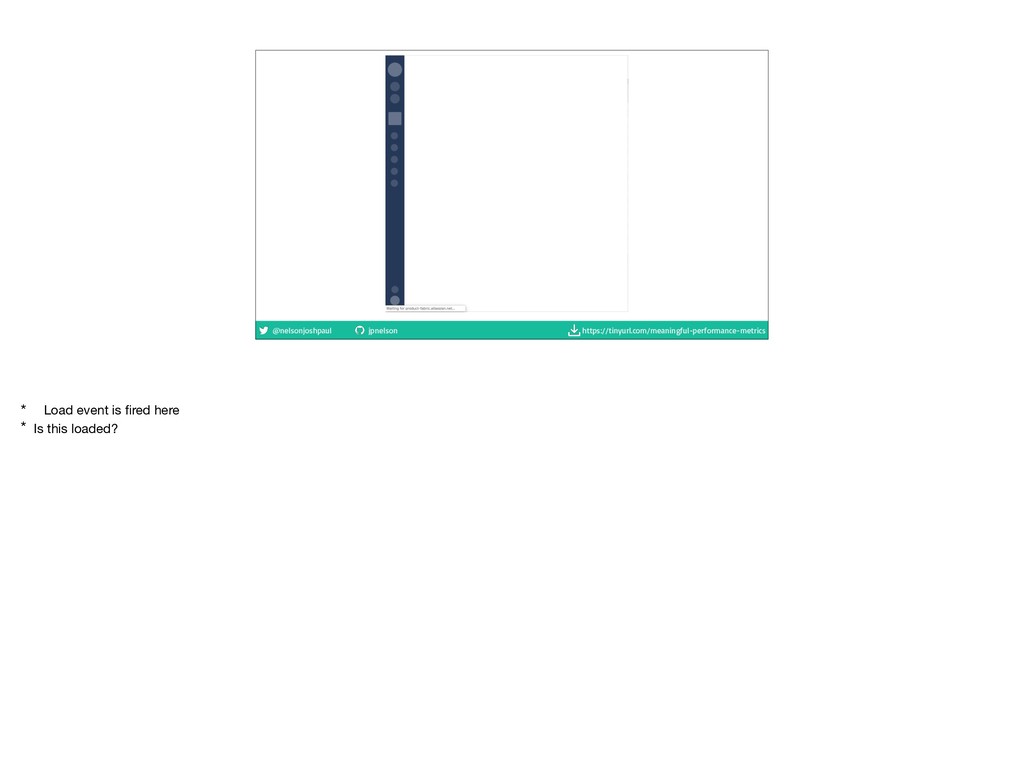
is no one event, or one easy answer to say when a page has loaded

    It might even require knowledge of the future!

    Loading is a spectrum

    Metrics compress this spectrum into a single number

    We need to be careful about how we choose this number

    View Slide

  76. @nelsonjoshpaul jpnelson https://tinyurl.com/meaningful-performance-metrics
    The time for a page to load for a user
    “Performance”

    View Slide

  77. @nelsonjoshpaul jpnelson https://tinyurl.com/meaningful-performance-metrics
    Who your users are might be obvious, but it might be hard to determine

    View Slide

  78. @nelsonjoshpaul jpnelson https://tinyurl.com/meaningful-performance-metrics
    Speed
    * Fast CPU, or slow CPU

    View Slide

  79. @nelsonjoshpaul jpnelson https://tinyurl.com/meaningful-performance-metrics
    Location
    * Great internet in Richmond VA

    * Terrible internet in Parkes, Australia

    View Slide

  80. @nelsonjoshpaul jpnelson https://tinyurl.com/meaningful-performance-metrics
    Regularity
    * Return visitor to your website

    * First time visitor to your website

    View Slide

  81. @nelsonjoshpaul jpnelson https://tinyurl.com/meaningful-performance-metrics
    Measure these things!
    * We need to measure these things!

    * We need to pick metrics that takes these user attributes into account

    View Slide

  82. @nelsonjoshpaul jpnelson https://tinyurl.com/meaningful-performance-metrics
    Why measure
    What to measure
    ✅ “Good” metrics
    ⚖ Metric choices
    ⚒ Ways to measure
    Protect performance
    Let’s take a look at what makes a good metric

    View Slide

  83. @nelsonjoshpaul jpnelson https://tinyurl.com/meaningful-performance-metrics
    ⚠ Bad metrics are out there!
    * Bad metrics are out there

    * The default way you think about it might be bad!

    * Your tools might be measuring it in a bad way

    View Slide

  84. @nelsonjoshpaul jpnelson https://tinyurl.com/meaningful-performance-metrics
    * Project I am working on

    * Slowed down video

    * By default, we measured “load” time

    *

    View Slide

  85. @nelsonjoshpaul jpnelson https://tinyurl.com/meaningful-performance-metrics
    * Load event is fired here

    * Is this loaded?

    View Slide

  86. @nelsonjoshpaul jpnelson https://tinyurl.com/meaningful-performance-metrics
    ⚠ Bad metrics are dangerous
    * You’ll focus on the wrong things, neglecting real issues

    * You’ll change random numbers, but users will remain dissatisfied!

    * Bad news is good for your health if you need it

    View Slide

  87. @nelsonjoshpaul jpnelson https://tinyurl.com/meaningful-performance-metrics
    Good metrics
    * Let’s look at some good metrics

    View Slide

  88. @nelsonjoshpaul jpnelson https://tinyurl.com/meaningful-performance-metrics
    Reflects real experiences
    * Meaningful = meaningful for users

    * We need to figure out what our users are really experiencing with our metrics

    * There are a number of ways that we can ensure we’re measuring this for real users

    View Slide

  89. @nelsonjoshpaul jpnelson https://tinyurl.com/meaningful-performance-metrics
    ✅ Real devices
    ✅ Real networks
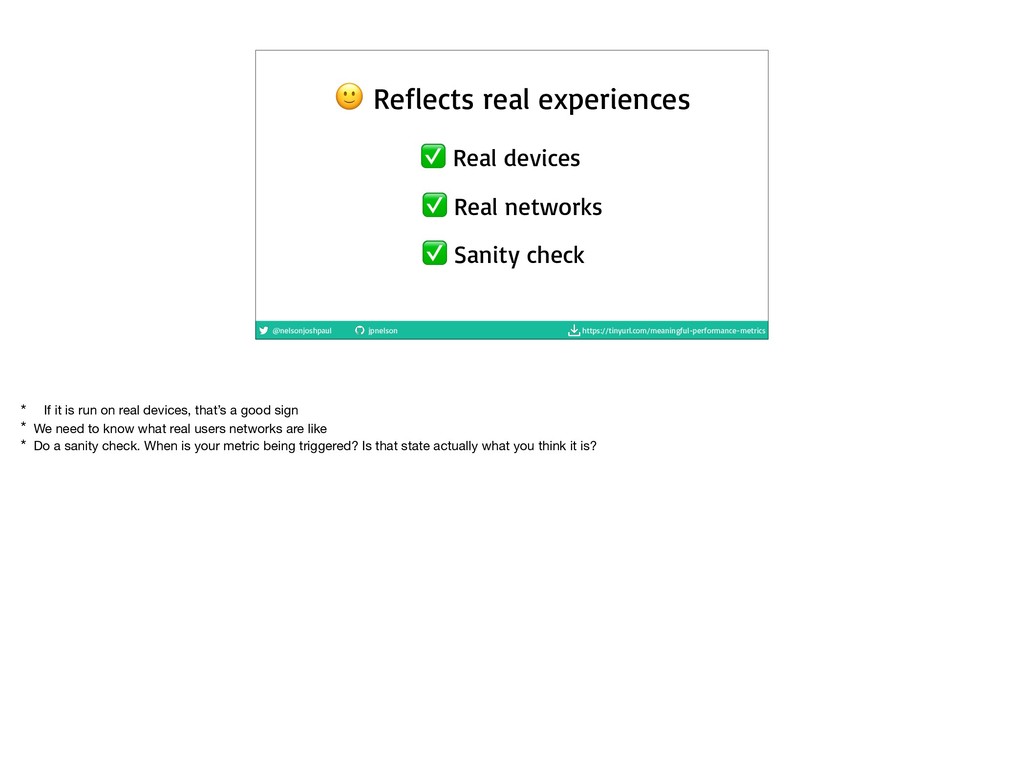
    ✅ Sanity check
    Reflects real experiences
    * If it is run on real devices, that’s a good sign

    * We need to know what real users networks are like

    * Do a sanity check. When is your metric being triggered? Is that state actually what you think it is?

    View Slide

  90. @nelsonjoshpaul jpnelson https://tinyurl.com/meaningful-performance-metrics
    Is a “continuous” function
    * Another quality of a good metric is one that is a continuous function

    View Slide

  91. @nelsonjoshpaul jpnelson https://tinyurl.com/meaningful-performance-metrics
    Is a “continuous” function
    A small improvement in the metric
    relates to a small improvement in
    the UX.
    * Example of something that isn’t this: total bundle size, if we’re code splitting and downloading. Reducing may do nothing

    View Slide

  92. @nelsonjoshpaul jpnelson https://tinyurl.com/meaningful-performance-metrics
    Is a “continuous” function
    Side effect: no cheating!
    * Think of the people looking at this metric as a greedy optimisation algorithm

    * If they can cheat, they will

    * The shortest path to improve the metric should be the one that will improve the user experience

    * You shouldn’t be rewarded for loading a loading spinner very quickly, if that doesn’t result in a correspondingly good UX

    View Slide

  93. @nelsonjoshpaul jpnelson https://tinyurl.com/meaningful-performance-metrics
    ♻ Is repeatable

    View Slide

  94. @nelsonjoshpaul jpnelson https://tinyurl.com/meaningful-performance-metrics
    Never send a human
    To do a 
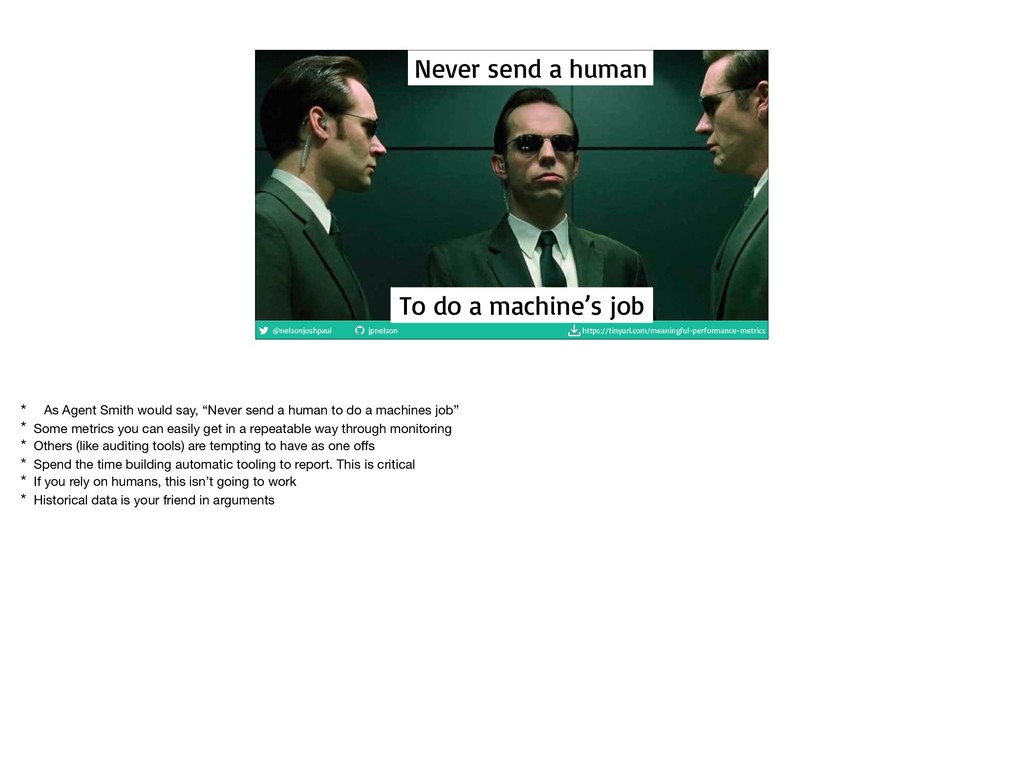
machine’s job
    * As Agent Smith would say, “Never send a human to do a machines job”

    * Some metrics you can easily get in a repeatable way through monitoring

    * Others (like auditing tools) are tempting to have as one offs

    * Spend the time building automatic tooling to report. This is critical

    * If you rely on humans, this isn’t going to work

    * Historical data is your friend in arguments

    View Slide

  95. @nelsonjoshpaul jpnelson https://tinyurl.com/meaningful-performance-metrics
    Why measure
    What to measure
    ✅ “Good” 
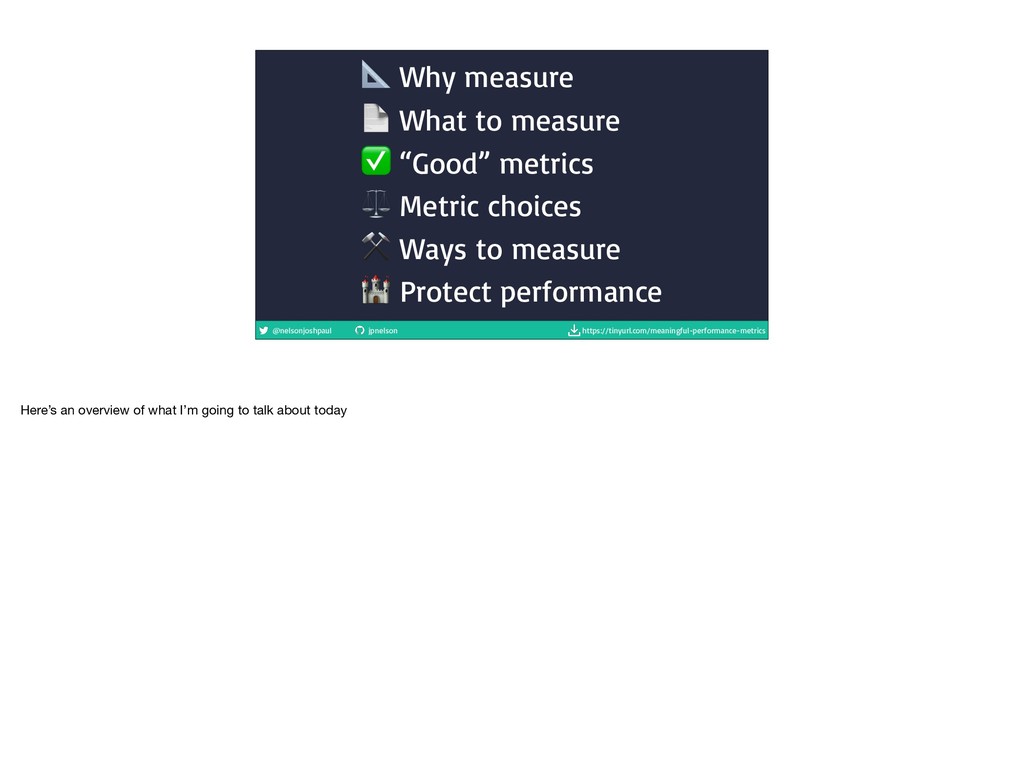
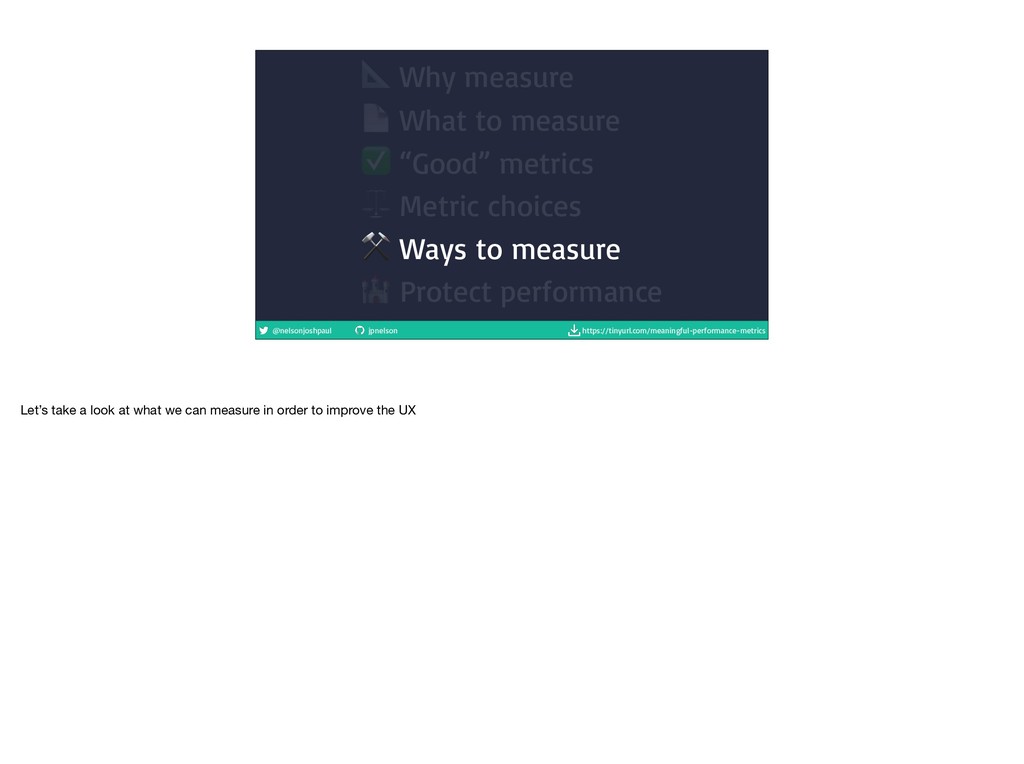
metrics
    ⚖ Metric choices
    ⚒ Ways to measure
    Protect performance
    With the knowledge of what is a good and bad metric, lets look and some, and think about it for our use cases

    View Slide

  96. @nelsonjoshpaul jpnelson https://tinyurl.com/meaningful-performance-metrics
    ⚡ Metric sound off!
    * Let’s finally have a look at some metrics

    View Slide

  97. @nelsonjoshpaul jpnelson https://tinyurl.com/meaningful-performance-metrics
    ⚡ Metric sound off!
    joshnelson.io/pages/metrics
    * Let’s finally have a look at some metrics

    View Slide

  98. @nelsonjoshpaul jpnelson https://tinyurl.com/meaningful-performance-metrics
    Good for all apps
    With the knowledge of what is a good and bad metric, lets look and some, and think about it for our use cases

    View Slide

  99. @nelsonjoshpaul jpnelson https://tinyurl.com/meaningful-performance-metrics
    Page weight
    ✅ Easy to measure

    ✅ js is expensive

    ⚠ Proxy for real experience
    * The cost of javascript blog by Addy Osmani

    View Slide

  100. @nelsonjoshpaul jpnelson https://tinyurl.com/meaningful-performance-metrics
    Paint timing!
    First paint
    First contentful paint
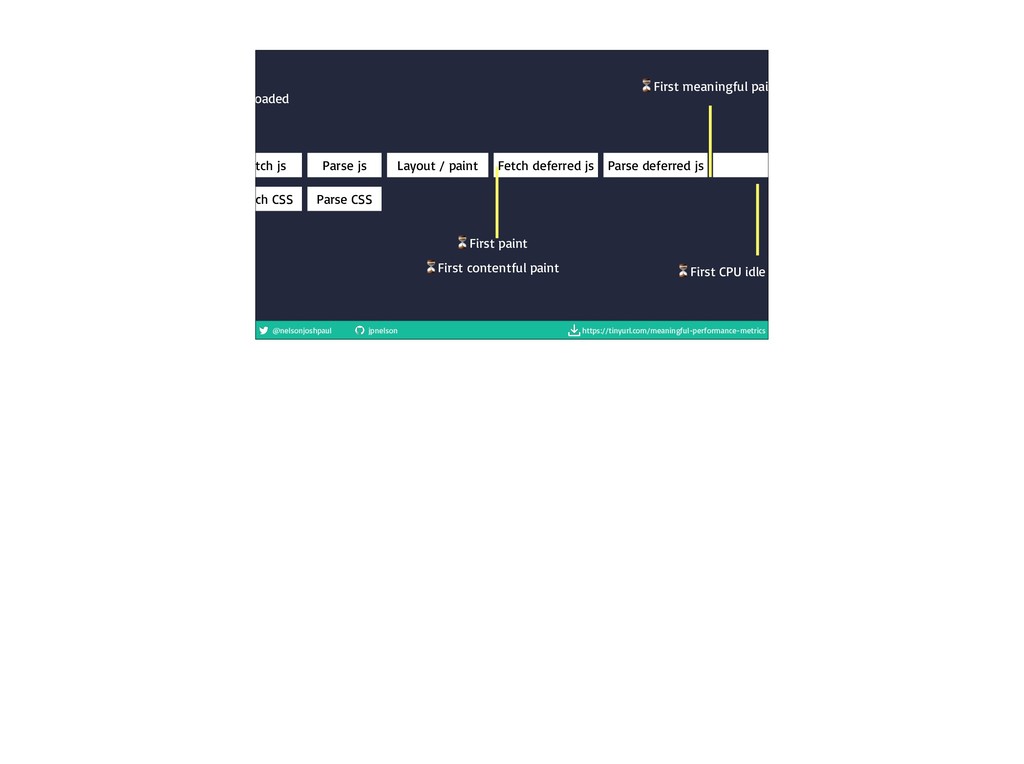
    First meaningful paint
    * You can guess my favourite (the one that has meaningful in the name)

    * First paint is when the browser first renders anything other than white

    * First contentful is when the browser renders any elements (eg. spinner)

    * First meaningful is when the browser renders something that is meaningful for the user (eg. data)

    * Easy to measure first two, but the last one is the real pot of gold. Harder to measure this in a consistent way.

    View Slide

  101. @nelsonjoshpaul jpnelson https://tinyurl.com/meaningful-performance-metrics
    Speed index
    Integrate the % of the page loaded over time
    * Speed index looks at what % of the page is loaded over time, retroactively

    * We then score it based on how much of it was delivered, and how soon

    * This really well maps to perceived load time

    * Optimizing for this number will help load time

    View Slide

  102. @nelsonjoshpaul jpnelson https://tinyurl.com/meaningful-performance-metrics
    Speed index
    ✅ Very reflective of real UX

    ✅ Reflects progressive loading

    ⚠ Hard to measure on real devices

    ⚠ Hard to understand (unitless)
    Integrate the % of the page loaded over time
    * It’s one of the best metrics for reflecting progressive loading

    View Slide

  103. @nelsonjoshpaul jpnelson https://tinyurl.com/meaningful-performance-metrics
    ATF render time
    ✅ Reflective of UX for initial load

    ✅ Easy to understand

    ⚠ Doesn’t deal with post initial load

    ⚠ Hard to measure in real browsers

    ⚠ Your users probably scroll
    Time until all content above the fold is rendered
    * http://abovethefold.fyi/

    *

    View Slide

  104. @nelsonjoshpaul jpnelson https://tinyurl.com/meaningful-performance-metrics
    Load event
    Triggered after DOMContentLoaded, and after 
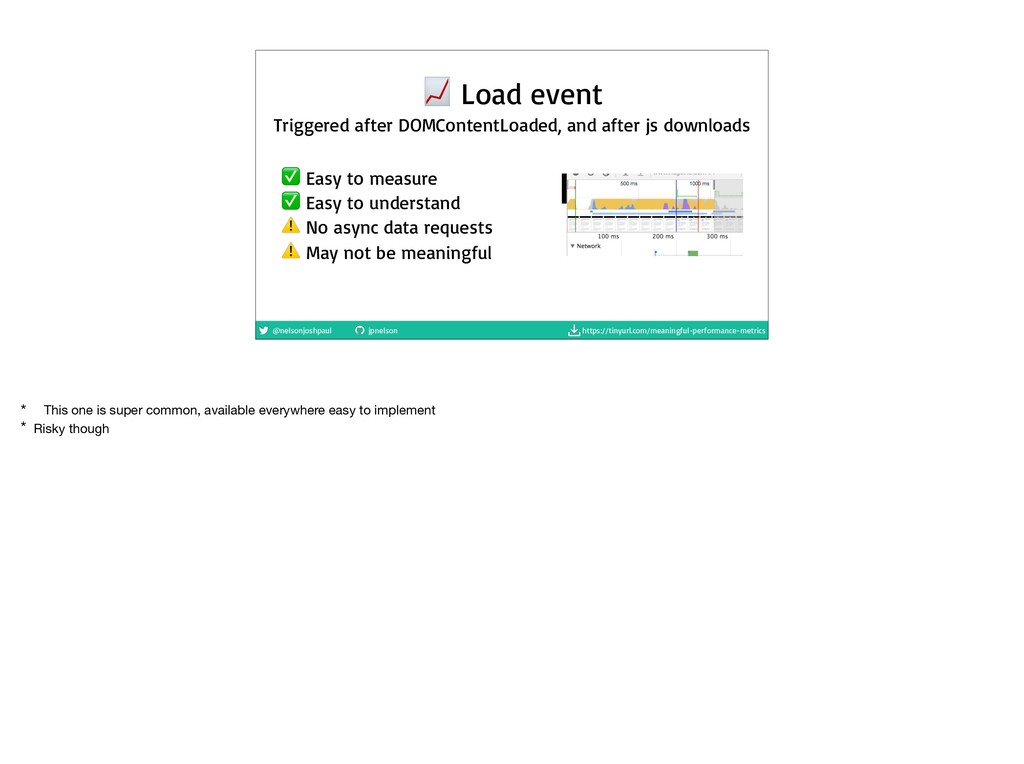
js downloads
    ✅ Easy to measure

    ✅ Easy to understand

    ⚠ No async data requests

    ⚠ May not be meaningful
    * This one is super common, available everywhere easy to implement

    * Risky though

    View Slide

  105. @nelsonjoshpaul jpnelson https://tinyurl.com/meaningful-performance-metrics
    Good for SSR apps

    View Slide

  106. @nelsonjoshpaul jpnelson https://tinyurl.com/meaningful-performance-metrics
    First byte
    When did the first byte 
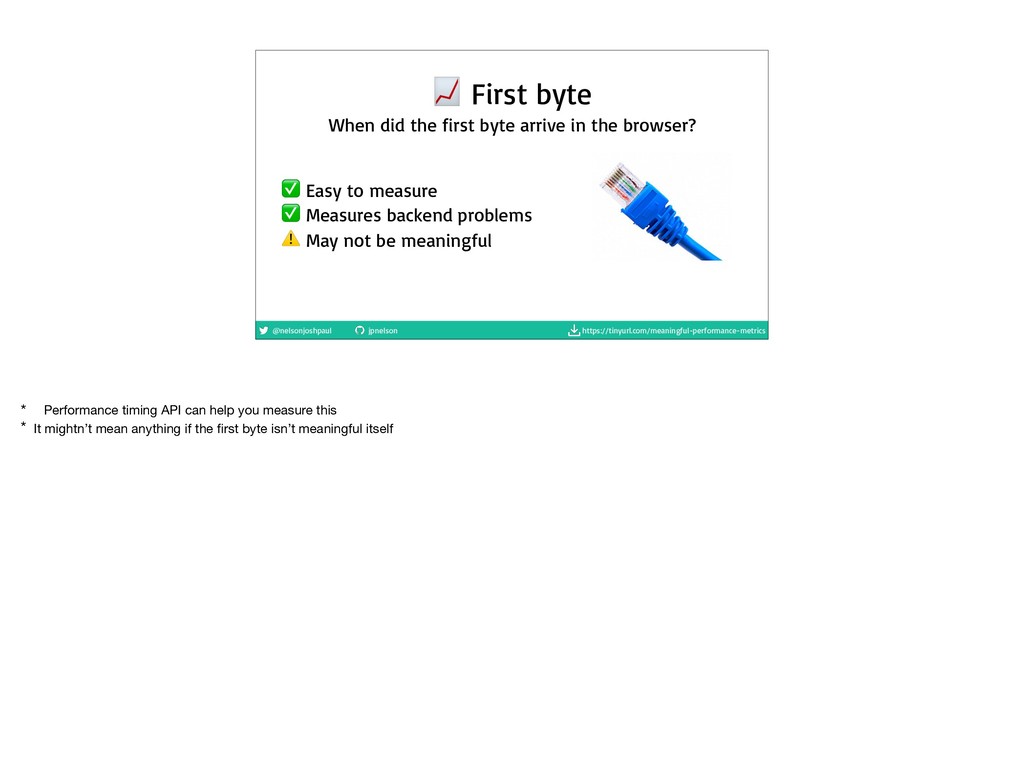
arrive in the browser?
    ✅ Easy to measure

    ✅ Measures backend problems

    ⚠ May not be meaningful
    * Performance timing API can help you measure this

    * It mightn’t mean anything if the first byte isn’t meaningful itself

    View Slide

  107. @nelsonjoshpaul jpnelson https://tinyurl.com/meaningful-performance-metrics
    Time to interactive
    The time it takes 
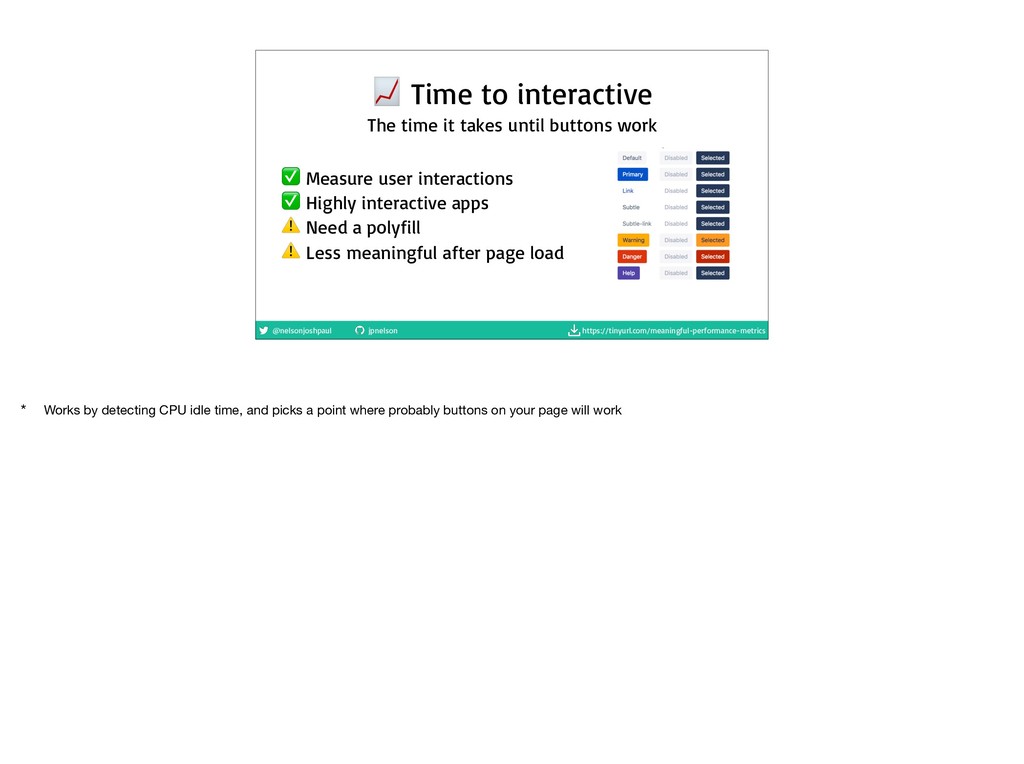
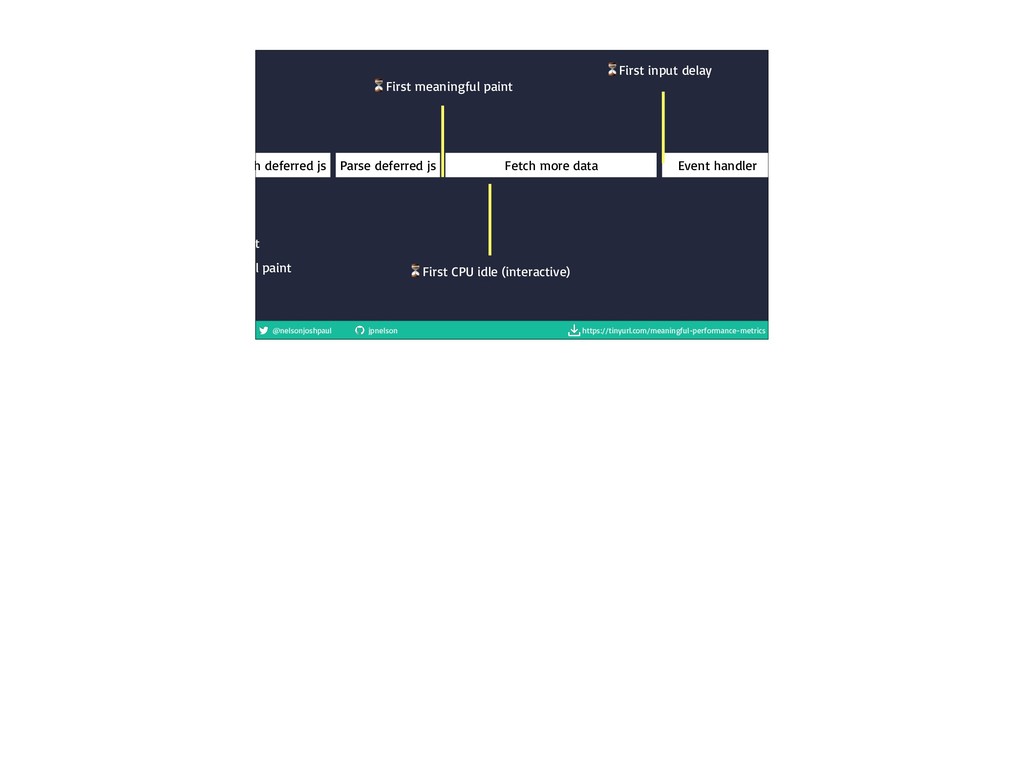
until buttons work
    ✅ Measure user interactions

    ✅ Highly interactive apps

    ⚠ Need a polyfill

    ⚠ Less meaningful after page load
    * Works by detecting CPU idle time, and picks a point where probably buttons on your page will work

    View Slide

  108. @nelsonjoshpaul jpnelson https://tinyurl.com/meaningful-performance-metrics
    First input delay
    On the first click, 
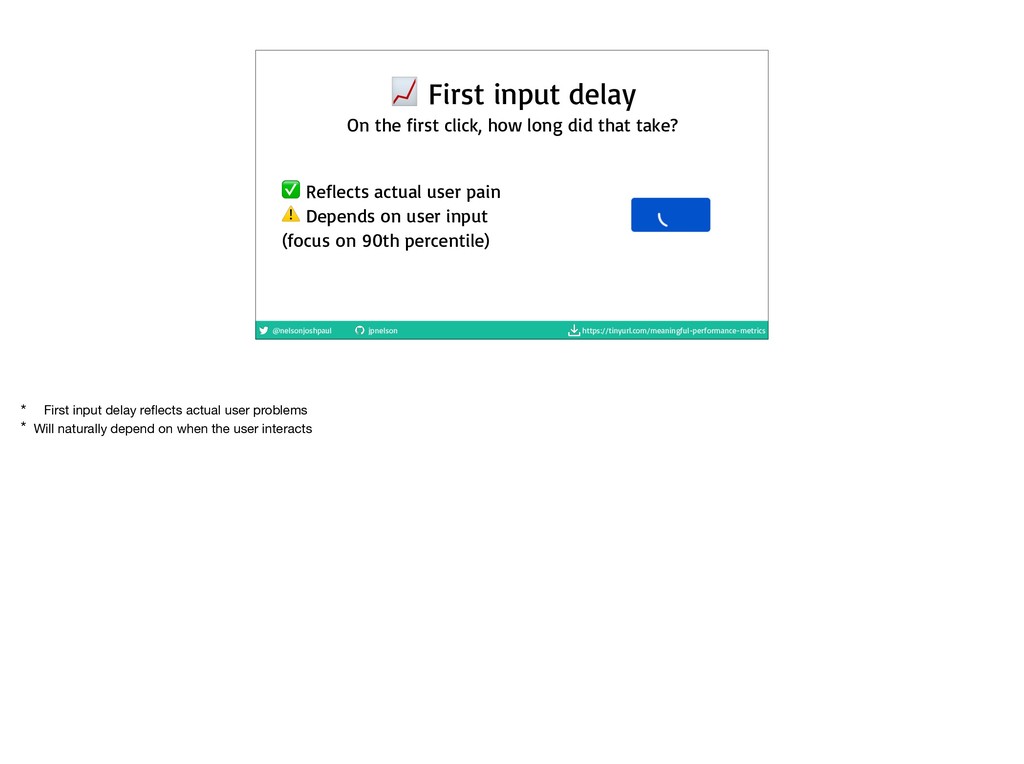
how long did that take?
    ✅ Reflects actual user pain

    ⚠ Depends on user input

    (focus on 90th percentile)
    * First input delay reflects actual user problems

    * Will naturally depend on when the user interacts

    View Slide

  109. @nelsonjoshpaul jpnelson https://tinyurl.com/meaningful-performance-metrics
    Avoid
    With the knowledge of what is a good and bad metric, lets look and some, and think about it for our use cases

    View Slide

  110. @nelsonjoshpaul jpnelson https://tinyurl.com/meaningful-performance-metrics
    DOMContentLoaded
    ⚠ Basically never what you want

    ⚠ Try and use the load event instead
    Parse HTML and Synchronous js

    View Slide

  111. @nelsonjoshpaul jpnelson https://tinyurl.com/meaningful-performance-metrics
    DNS lookup GET request Parse HTML Fetch 
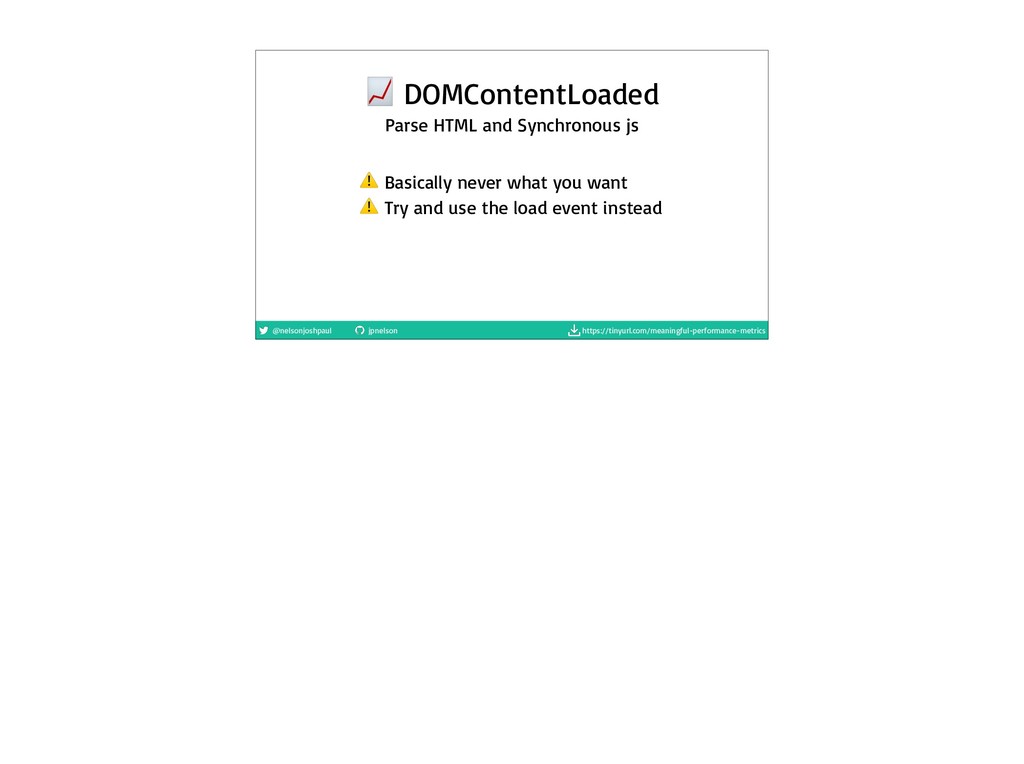
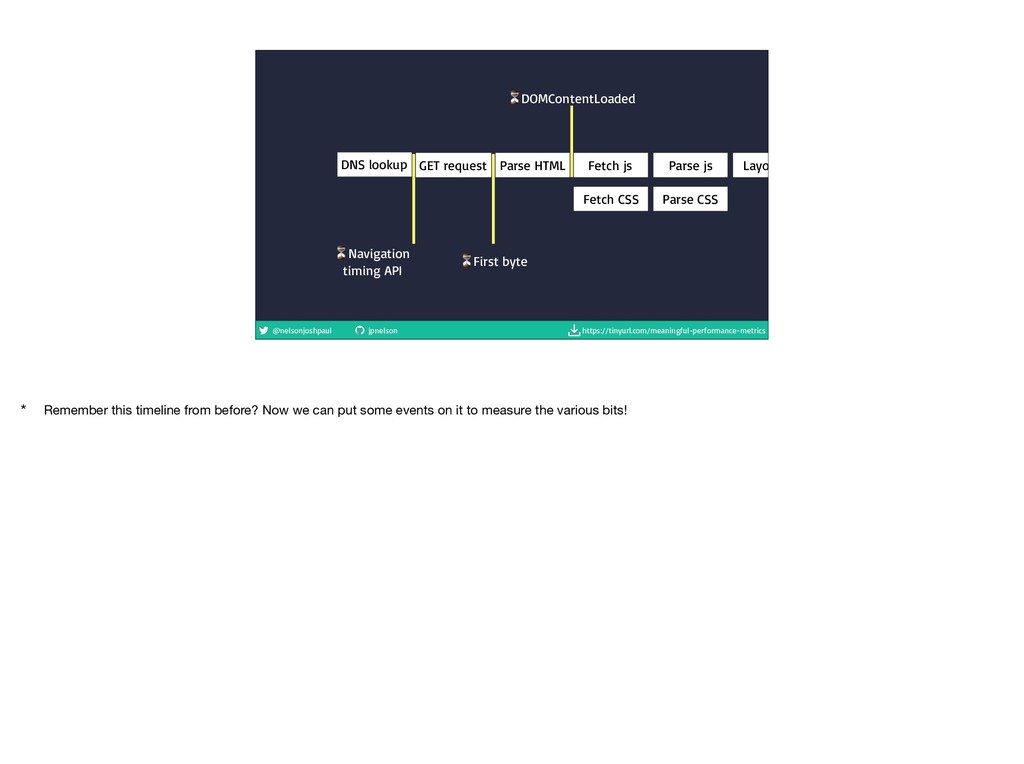
js
    ⏳DOMContentLoaded
    ⏳First byte
    Fetch CSS
    ⏳Navigation

    timing API
    Parse js
    Parse CSS
    Layout / paint
    ⏳First contentful paint
    * Remember this timeline from before? Now we can put some events on it to measure the various bits!

    View Slide

  112. @nelsonjoshpaul jpnelson https://tinyurl.com/meaningful-performance-metrics
    Fetch js Fetch deferred js
    ⏳DOMContentLoaded
    Parse deferred js
    Fetch CSS
    Parse js
    Parse CSS
    Fetch more data
    Layout / paint
    ⏳First paint
    ⏳First meaningful paint
    ⏳First CPU idle (interactive)
    ⏳First contentful paint

    View Slide

  113. @nelsonjoshpaul jpnelson https://tinyurl.com/meaningful-performance-metrics
    Fetch deferred js Parse deferred js Fetch more data
    ⏳First paint
    ⏳First meaningful paint
    ⏳First CPU idle (interactive)
    ⏳First contentful paint
    ⏳First input delay
    Event handler

    View Slide

  114. @nelsonjoshpaul jpnelson https://tinyurl.com/meaningful-performance-metrics
    Fetch more data
    ⏳First input delay
    Event 
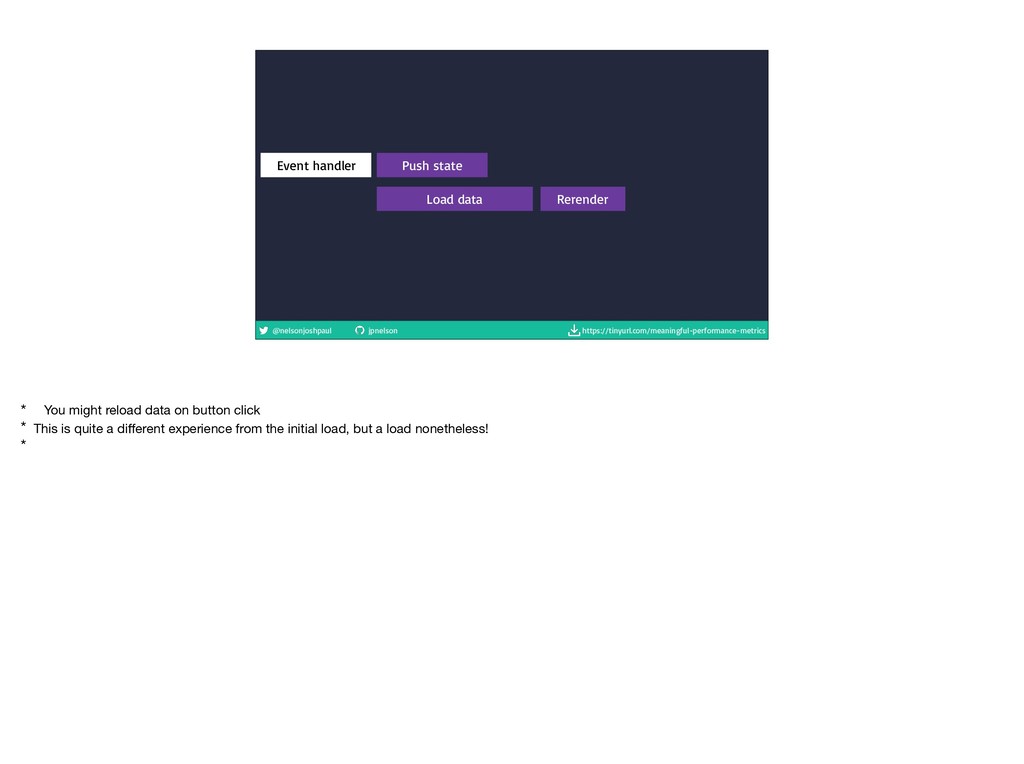
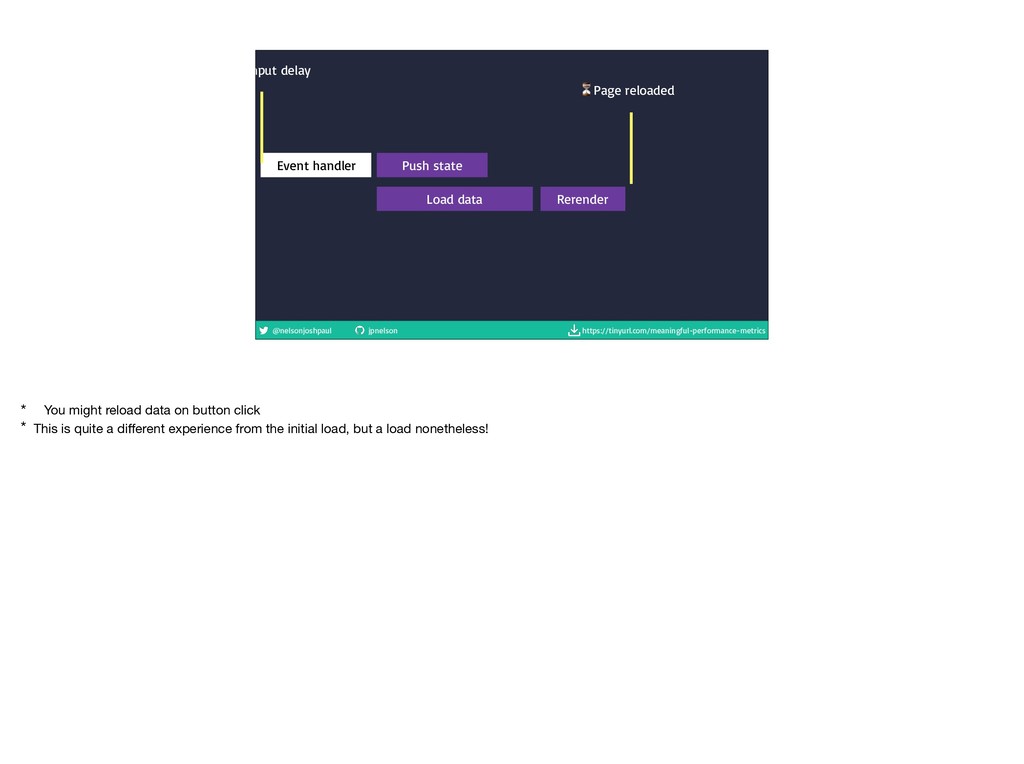
handler Push state
    Load data Rerender
    ⏳Page reloaded
    * You might reload data on button click

    * This is quite a different experience from the initial load, but a load nonetheless!

    View Slide

  115. @nelsonjoshpaul jpnelson https://tinyurl.com/meaningful-performance-metrics
    joshnelson.io/pages/metrics
    * Let’s finally have a look at some metrics

    View Slide

  116. @nelsonjoshpaul jpnelson https://tinyurl.com/meaningful-performance-metrics
    Metric starter pack
    Time to interactive

    Bundle 
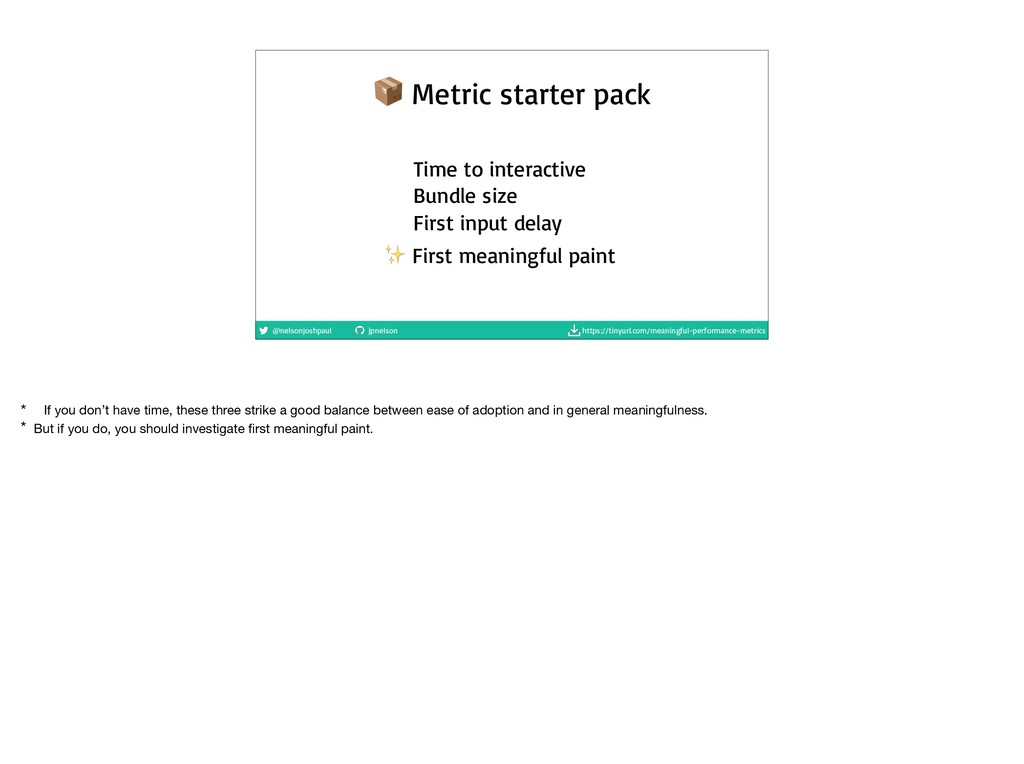
size

    First input delay
    ✨ First meaningful paint
    * If you don’t have time, these three strike a good balance between ease of adoption and in general meaningfulness.

    * But if you do, you should investigate first meaningful paint.

    View Slide

  117. @nelsonjoshpaul jpnelson https://tinyurl.com/meaningful-performance-metrics
    Why measure
    What to measure
    ✅ “Good” metrics
    ⚖ Metric choices
    ⚒ Ways to measure
    Protect performance
    Let’s take a look at what we can measure in order to improve the UX

    View Slide

  118. @nelsonjoshpaul jpnelson https://tinyurl.com/meaningful-performance-metrics
    ⚒ Tools
    * A metric is only as good as your ability to measure it

    * We may need to make compromises in order to be able to measure things

    View Slide

  119. @nelsonjoshpaul jpnelson https://tinyurl.com/meaningful-performance-metrics
    Devtools
    ✅ debug

    ❌ repeatable

    ❌ actual 
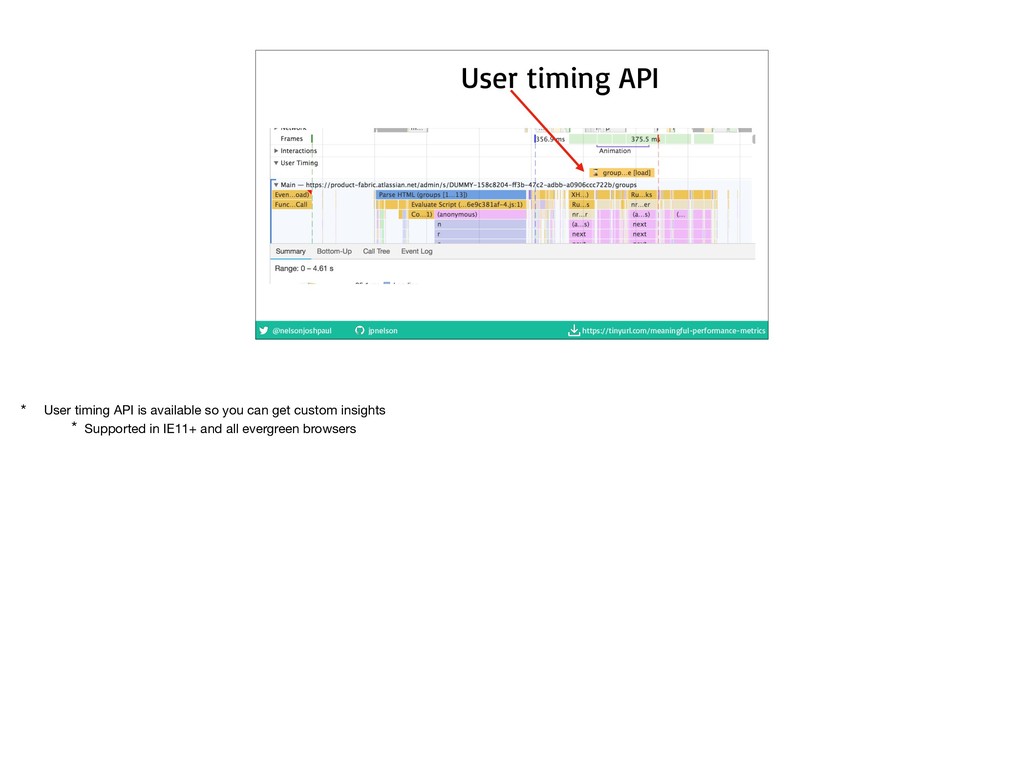
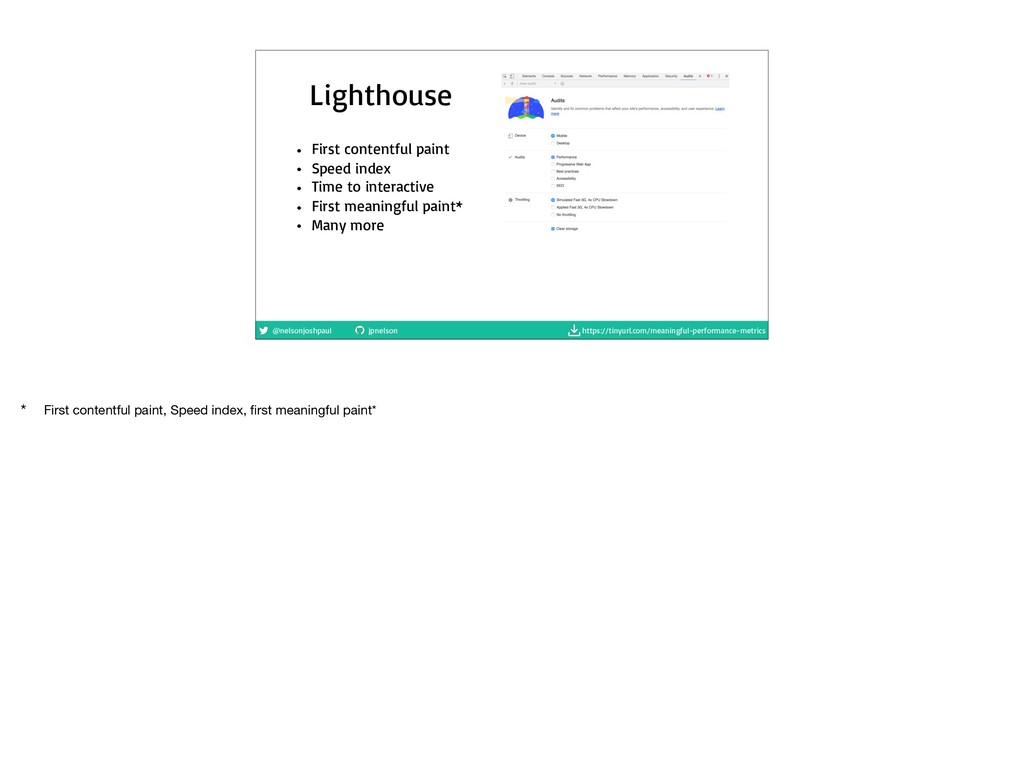
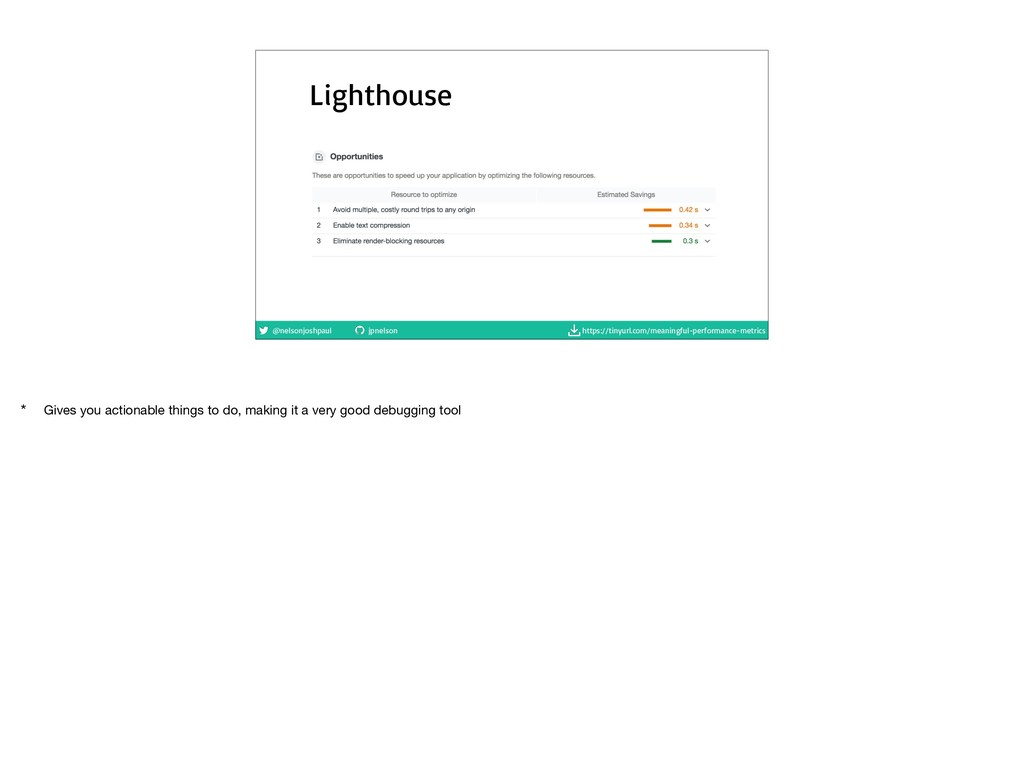
users
    * One of the best tools is right under your nose

    * Measure just about all of the previous metrics in a debugging context

    * You can simulate real devices, but ultimately isn’t real

    * Hard to make a business case from the devtools

    View Slide

  120. @nelsonjoshpaul jpnelson https://tinyurl.com/meaningful-performance-metrics
    User timing API
    * User timing API is available so you can get custom insights

    * Supported in IE11+ and all evergreen browsers

    View Slide

  121. @nelsonjoshpaul jpnelson https://tinyurl.com/meaningful-performance-metrics
    github.com/jpnelson/react-component-timing
    * We have a tool that 
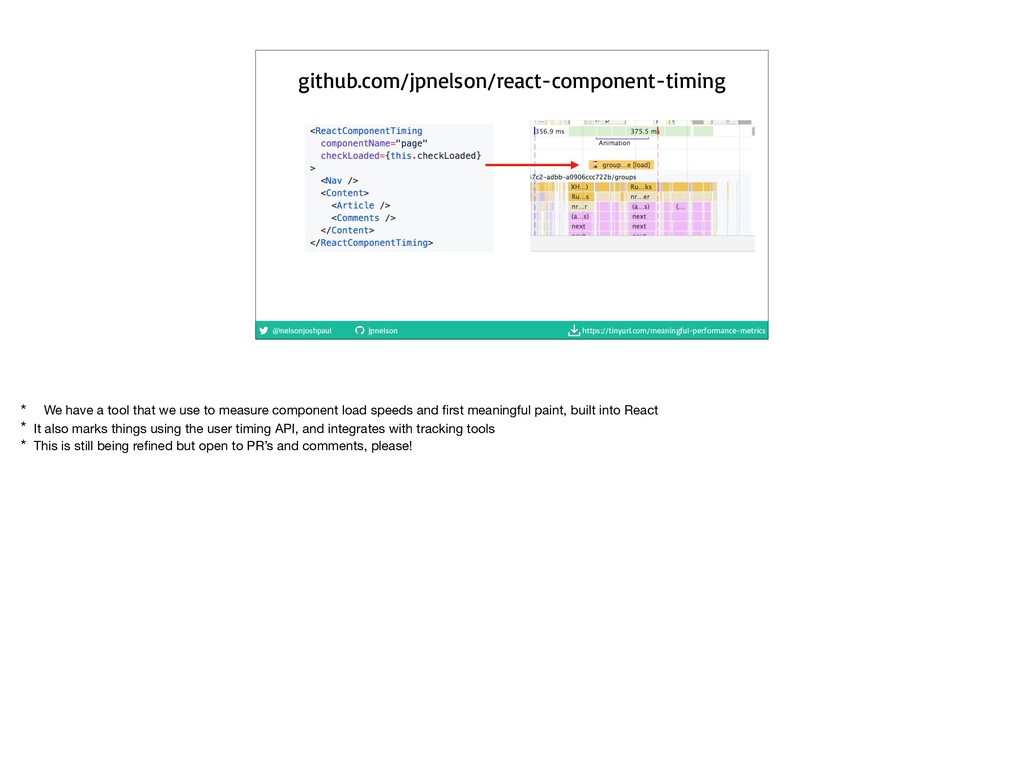
we use to measure component load speeds and first meaningful paint, built into React

    * It also marks things using the user timing API, and integrates with tracking tools

    * This is still being refined but open to PR’s and comments, please!

    View Slide

  122. @nelsonjoshpaul jpnelson https://tinyurl.com/meaningful-performance-metrics
    Lighthouse
    ✅ debug

    ❌ repeatable

    ❌ actual 
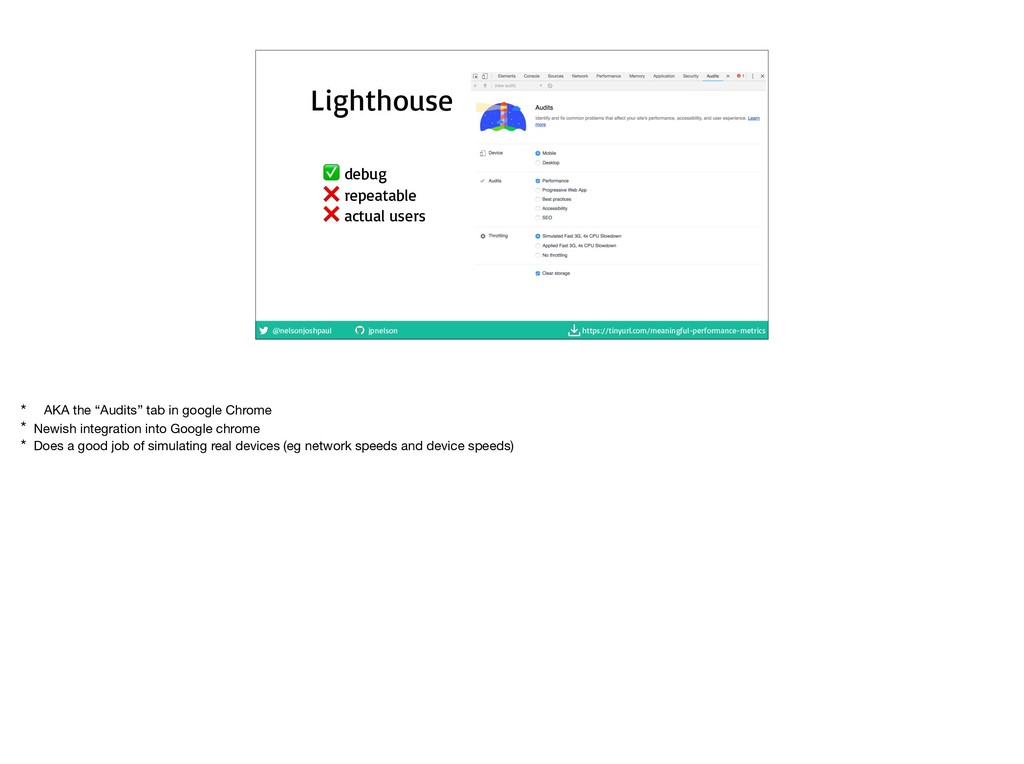
users
    * AKA the “Audits” tab in google Chrome

    * Newish integration into Google chrome

    * Does a good job of simulating real devices (eg network speeds and device speeds)

    View Slide

  123. @nelsonjoshpaul jpnelson https://tinyurl.com/meaningful-performance-metrics
    Lighthouse
    • First contentful paint

    • Speed index

    • Time to interactive

    • First meaningful paint*

    • Many more
    * First contentful paint, Speed index, first meaningful paint*

    View Slide

  124. @nelsonjoshpaul jpnelson https://tinyurl.com/meaningful-performance-metrics
    Lighthouse
    * Gives you actionable things to do, making it a very good debugging tool

    View Slide

  125. @nelsonjoshpaul jpnelson https://tinyurl.com/meaningful-performance-metrics
    Lighthouse CI
    ✅ debug

    ✅ repeatable

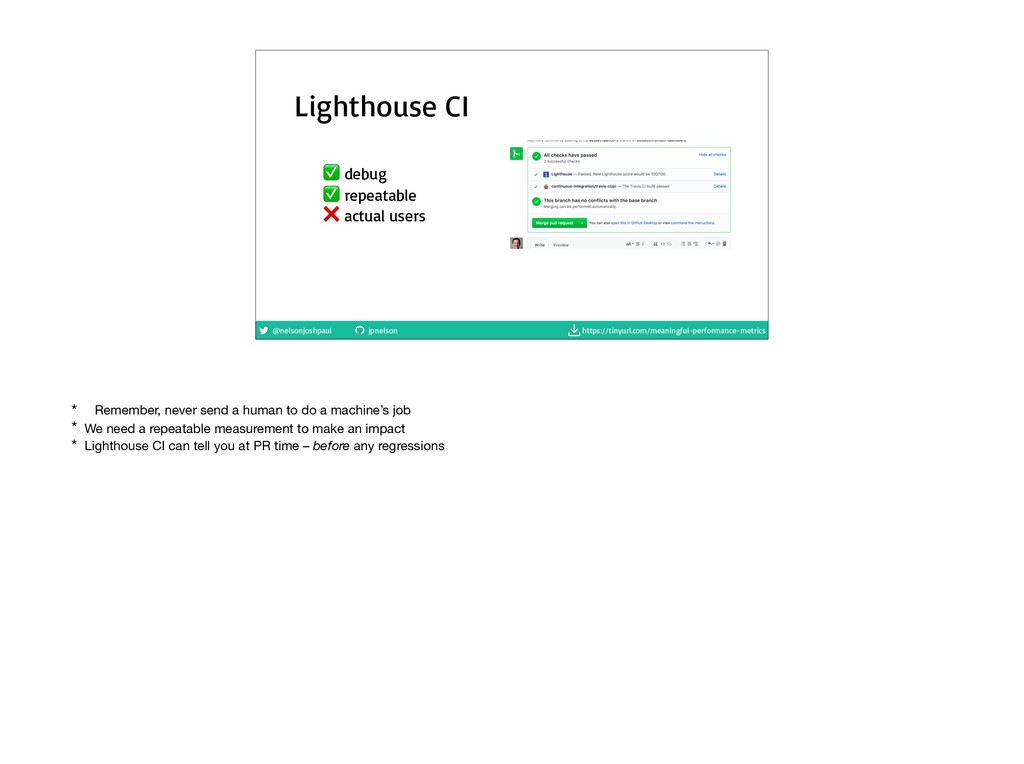
    ❌ actual users
    * Remember, never send a human to do a machine’s job

    * We need a repeatable measurement to make an impact

    * Lighthouse CI can tell you at PR time – before any regressions

    View Slide

  126. @nelsonjoshpaul jpnelson https://tinyurl.com/meaningful-performance-metrics
    webpagetest.org
    ✅ debug

    ✅ repeatable

    ❌ actual users
    * webpagetest.org is an amazing tool for testing your website’s performance

    View Slide

  127. @nelsonjoshpaul jpnelson https://tinyurl.com/meaningful-performance-metrics
    webpagetest.org
    ✅ debug

    ✅ repeatable

    ❌ actual 
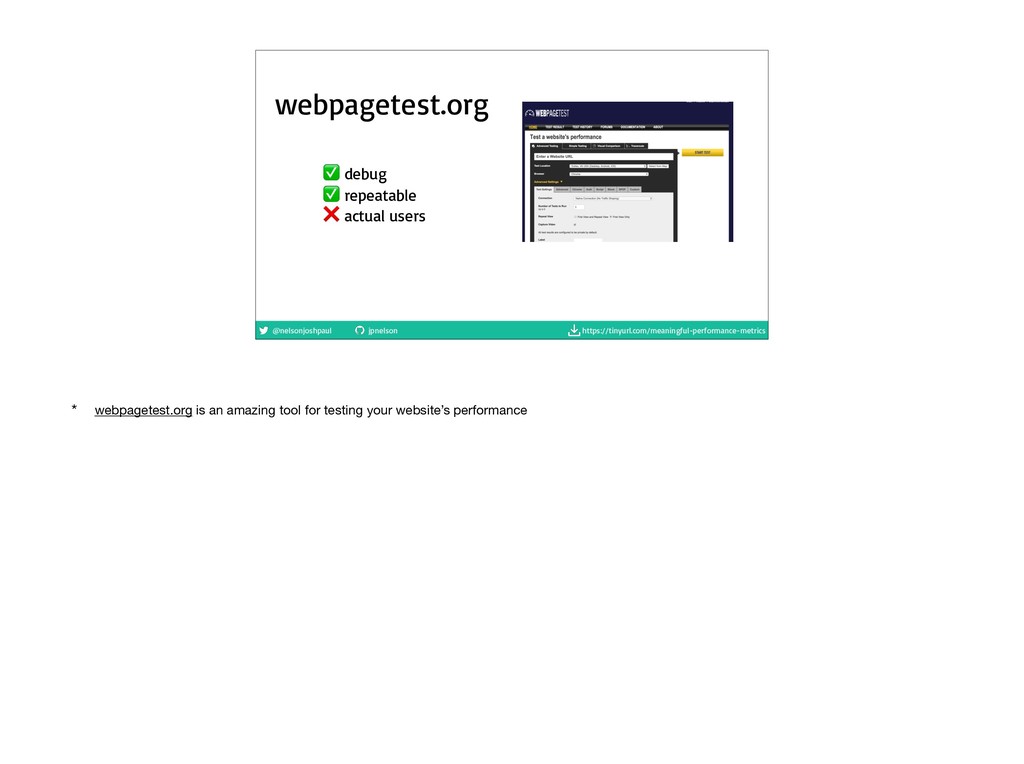
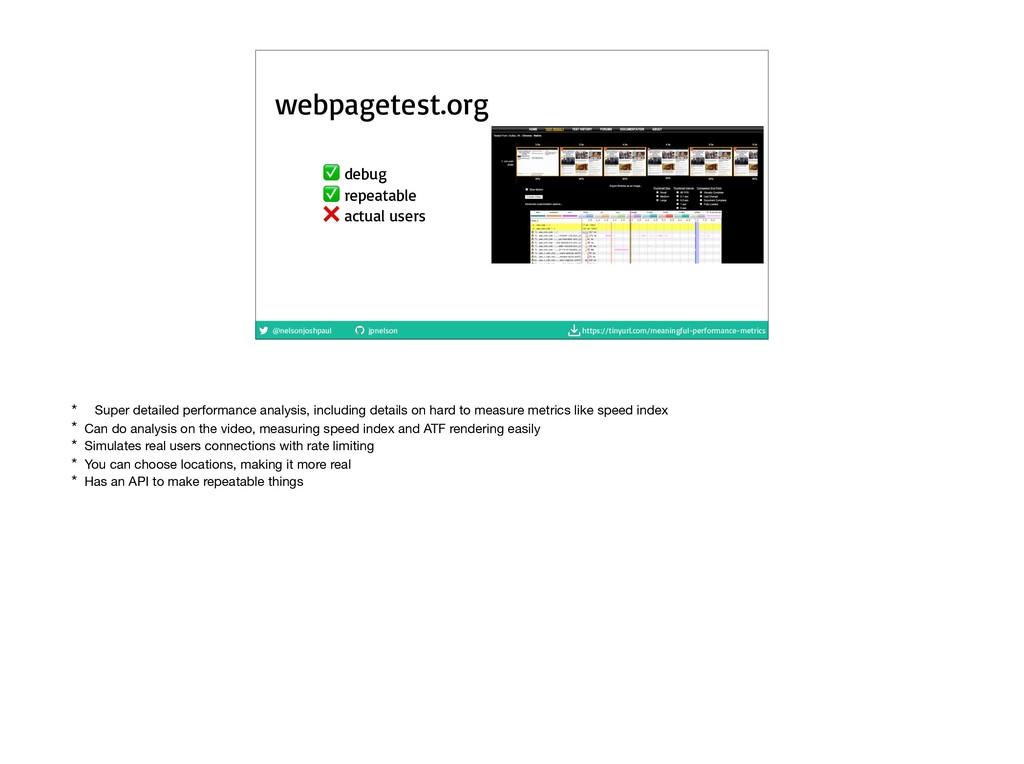
users
    * Super detailed performance analysis, including details on hard to measure metrics like speed index

    * Can do analysis on the video, measuring speed index and ATF rendering easily

    * Simulates real users connections with rate limiting

    * You can choose locations, making it more real

    * Has an API to make repeatable things

    View Slide

  128. @nelsonjoshpaul jpnelson https://tinyurl.com/meaningful-performance-metrics
    Sentry / Google
    Analytics / New relic
    ❌ debug

    ✅ repeatable

    ✅ actual users
    * We use new relic

    * Can send custom page actions

    * Really useful for measuring data on your actual users

    View Slide

  129. @nelsonjoshpaul jpnelson https://tinyurl.com/meaningful-performance-metrics
    Why measure
    What to measure
    ✅ “Good” metrics
    ⚖ Metric choices
    ⚒ Ways to measure
    Protect performance
    Finally, protecting performance

    View Slide

  130. @nelsonjoshpaul jpnelson https://tinyurl.com/meaningful-performance-metrics
    Now what?
    ✅ Meaningful metric

    ✅ Tool to measure it
    Great, you’ve chosen a meaningful metric and you have the tools to measure it. Now what?

    View Slide

  131. @nelsonjoshpaul jpnelson https://tinyurl.com/meaningful-performance-metrics
    We need to actually fix the stuff!
    Great, you’ve chosen a meaningful metric and you have the tools to measure it. Now what?

    * You need to fix performance issues

    * This is the easy bit! Plenty of info (including later today) about how to do that

    View Slide

  132. @nelsonjoshpaul jpnelson https://tinyurl.com/meaningful-performance-metrics
    How much time will it take?
    How much time will it take?

    ..

    Not the right question to be asking. This is not a one off effort

    View Slide

  133. @nelsonjoshpaul jpnelson https://tinyurl.com/meaningful-performance-metrics
    In it for the long run
    You need to build a culture of performance

    Metrics can help you do this

    View Slide

  134. @nelsonjoshpaul jpnelson https://tinyurl.com/meaningful-performance-metrics
    Let’s make this new page! And maybe we have the background put a video in instead?

    View Slide

  135. @nelsonjoshpaul jpnelson https://tinyurl.com/meaningful-performance-metrics
    Can we add a video?
    Design: ✅
    Product: ✅
    Eng: “It’ll be slower”
    Designers think it’s great

    Product people think it’d be cool

    Engineer: Wait, this will be slower…

    View Slide

  136. @nelsonjoshpaul jpnelson https://tinyurl.com/meaningful-performance-metrics
    Performance budgets
    Performance budgets are a structured way to have this conversation

    View Slide

  137. @nelsonjoshpaul jpnelson https://tinyurl.com/meaningful-performance-metrics
    1. Choose the right metrics

    2. Get 
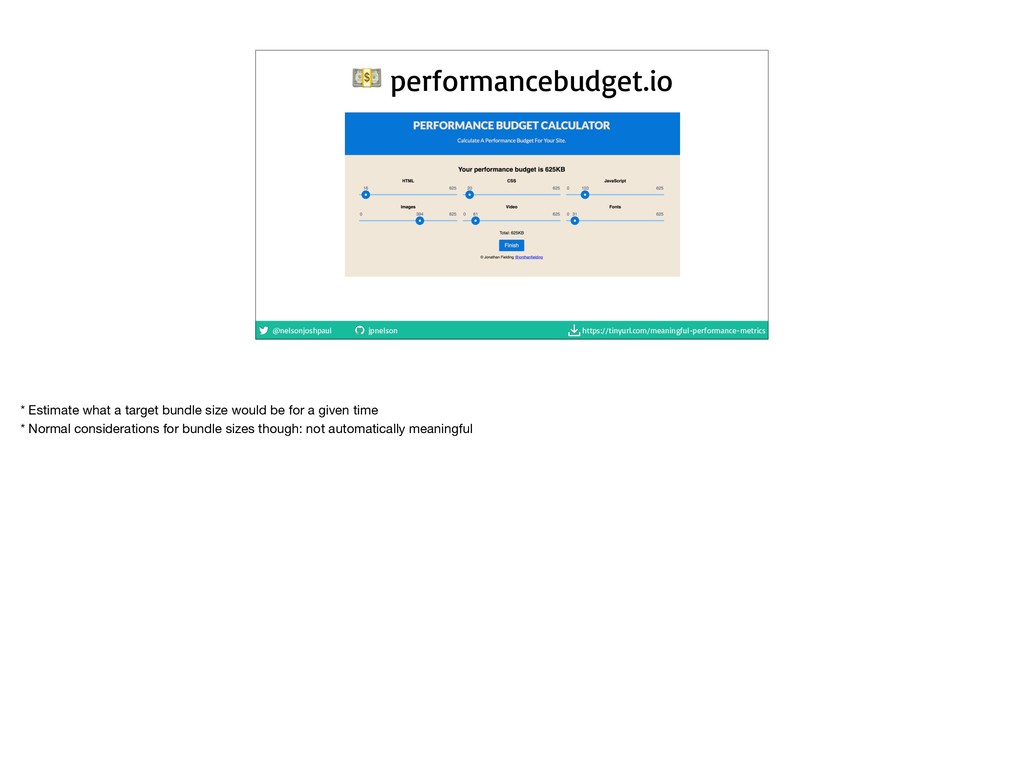
everyone to agree on a limit

    3. Bring it up during planning

    4. Figure out how to stay in budget
    Performance budgets
    * Getting people to agree might be easier than you think. People will agree to a meaningful metric.

    Eg, “Our time to interactive budget will be <=1 second” or “<= 1mb” (assuming the page weight is linked to a better UX)


    https://speedcurve.com/blog/performance-budgets-in-action/

    View Slide

  138. @nelsonjoshpaul jpnelson https://tinyurl.com/meaningful-performance-metrics
    Choosing limits
    I can’t just tell you :(

    View Slide

  139. @nelsonjoshpaul jpnelson https://tinyurl.com/meaningful-performance-metrics
    Choosing limits
    0.1 seconds - instant

    1.0 seconds - flow of though

    10 seconds - task switch
    What is the current state? Improve it

    What are your competitors doing?

    View Slide

  140. @nelsonjoshpaul jpnelson https://tinyurl.com/meaningful-performance-metrics
    performancebudget.io
    * Estimate what a target bundle size would be for a given time

    * Normal considerations for bundle sizes though: not automatically meaningful

    View Slide

  141. @nelsonjoshpaul jpnelson https://tinyurl.com/meaningful-performance-metrics
    Apdex
    * A huge part of performance metrics I haven’t mentioned yet: What about Apdex?

    View Slide

  142. @nelsonjoshpaul jpnelson https://tinyurl.com/meaningful-performance-metrics
    Load time < “T value” means satisfied

    Load time < T*4 means tolerating
    * The formula for Apdex

    View Slide

  143. @nelsonjoshpaul jpnelson https://tinyurl.com/meaningful-performance-metrics
    0.1s 1s 10s
    Instant
    “Flow

    Task
    sw
    itch
    < <
    < <
    <
    <
    <
    <
    <
    < <
    < <
    4s
    <
    <
    * The formula for Apdex

    View Slide

  144. @nelsonjoshpaul jpnelson https://tinyurl.com/meaningful-performance-metrics
    0.1s 1s 10s
    Instant
    “Flow

    Task
    sw
    itch
    < <
    < <
    <
    <
    <
    <
    <
    < <
    < <
    4s
    <
    <
    Tolerating
    Satisfied
    Dissatisfied
    * The formula for Apdex

    View Slide

  145. @nelsonjoshpaul jpnelson https://tinyurl.com/meaningful-performance-metrics
    0.1s 1s 10s
    Instant
    “Flow

    Task
    sw
    itch
    < <
    < <
    <
    <
    <
    <
    <
    < <
    < <
    4s
    <
    <
    Tolerating
    Satisfied
    Dissatisfied
    Apdex=(6+2.5)/15=0.57
    * The formula for Apdex

    View Slide

  146. @nelsonjoshpaul jpnelson https://tinyurl.com/meaningful-performance-metrics
    ⚠ Pick your T value meaningfully

    ⚠ Pick your load metric meaningfully

    View Slide

  147. @nelsonjoshpaul jpnelson https://tinyurl.com/meaningful-performance-metrics
    ⚠ Pick your T value meaningfully

    ⚠ Pick your load metric meaningfully

    View Slide

  148. @nelsonjoshpaul jpnelson https://tinyurl.com/meaningful-performance-metrics
    0.1s 1s 10s
    Instant
    “Flow

    Task
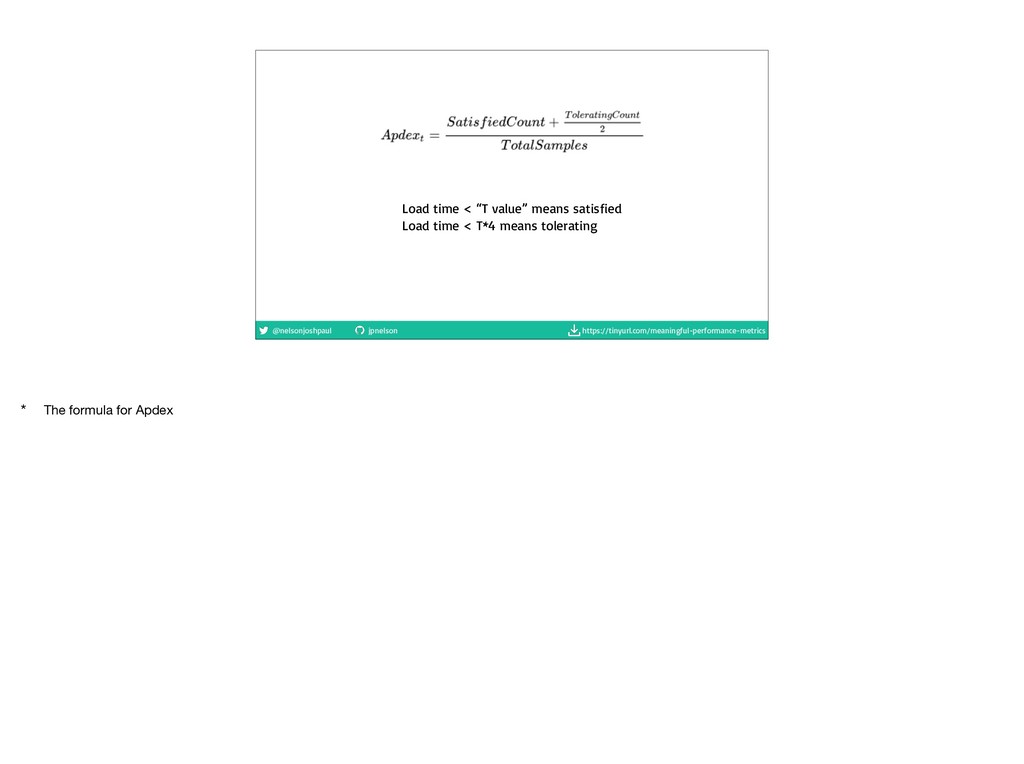
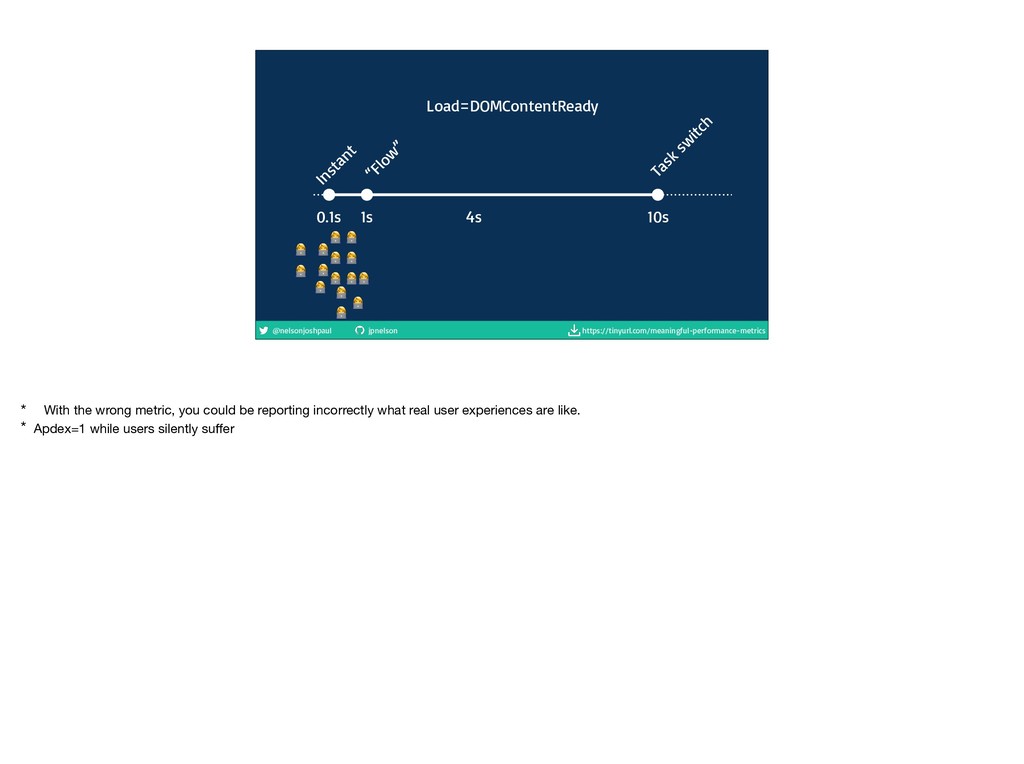
    sw
    itch
    < <
    < <
    <
    <
    <
    <
    <
    < <
    < <
    4s
    <
    <
    Load=DOMContentReady
    * With the wrong metric, you could be reporting incorrectly what real user experiences are like.

    * Apdex=1 while users silently suffer

    View Slide

  149. @nelsonjoshpaul jpnelson https://tinyurl.com/meaningful-performance-metrics
    0.1s 1s 10s
    Instant
    “Flow

    Task
    sw
    itch
    < <
    < <
    <
    <
    <
    <
    <
    < <
    < <
    4s
    <
    <
    <
    <
    <
    <
    <
    T=2
    8s
    <
    Tolerating
    Satisfied
    * Remember, tolerating = 4*t

    * Users with load times of up to 8 seconds are going to be happy

    View Slide

  150. @nelsonjoshpaul jpnelson https://tinyurl.com/meaningful-performance-metrics
    You only get out what you put in

    View Slide

  151. @nelsonjoshpaul jpnelson https://tinyurl.com/meaningful-performance-metrics
    Useful as a tool for businesses

    View Slide

  152. @nelsonjoshpaul jpnelson https://tinyurl.com/meaningful-performance-metrics
    Company apdex =

    Jira * 0.2 + 
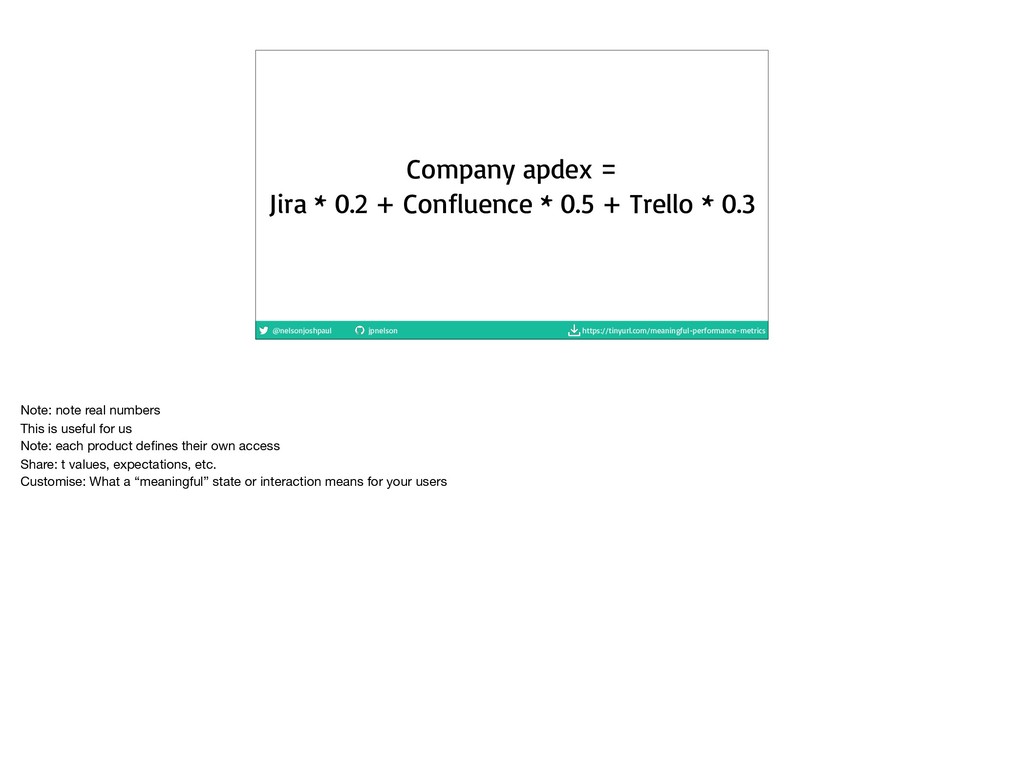
Confluence * 0.5 + Trello * 0.3
    Note: note real numbers

    This is useful for us

    Note: each product defines their own access

    Share: t values, expectations, etc.

    Customise: What a “meaningful” state or interaction means for your users

    View Slide

  153. @nelsonjoshpaul jpnelson https://tinyurl.com/meaningful-performance-metrics
    Summary

    View Slide

  154. @nelsonjoshpaul jpnelson https://tinyurl.com/meaningful-performance-metrics
    Measure real user experiences

    View Slide

  155. @nelsonjoshpaul jpnelson https://tinyurl.com/meaningful-performance-metrics
    Pick the right metric
    * Check what your metric is. Sanity check it. Is that really capturing the true user experience?

    *

    View Slide

  156. @nelsonjoshpaul jpnelson https://tinyurl.com/meaningful-performance-metrics
    Grow a performance culture
    * You need to institute a performance culture.

    * Performance needs to be something thought about during planning and design – not just engineering

    View Slide

  157. @nelsonjoshpaul jpnelson https://tinyurl.com/meaningful-performance-metrics
    Let’s make the internet better
    * The internet is a vehicle for free information for all

    * For me, $’s aren’t inspiring. But the free internet, the open exchange of information, is literally impossible for some people, unless the internet is fast.

    View Slide

  158. @nelsonjoshpaul jpnelson https://tinyurl.com/meaningful-performance-metrics
    Josh Nelson Atlassian @nelsonjoshpaul he/him/his

    Thanks! Questions?
    Illustrations designed by Freepik from flaticon.com

    tinyurl.com/meaningful-performance-metrics

    View Slide