Upgrade to Pro — share decks privately, control downloads, hide ads and more …

JUGNsk Meetup#6. Алексей Игнатенко: "Что такое Latency и с чем ее едят?"

jugnsk
February 27, 2019

JUGNsk Meetup#6. Алексей Игнатенко: "Что такое Latency и с чем ее едят?"

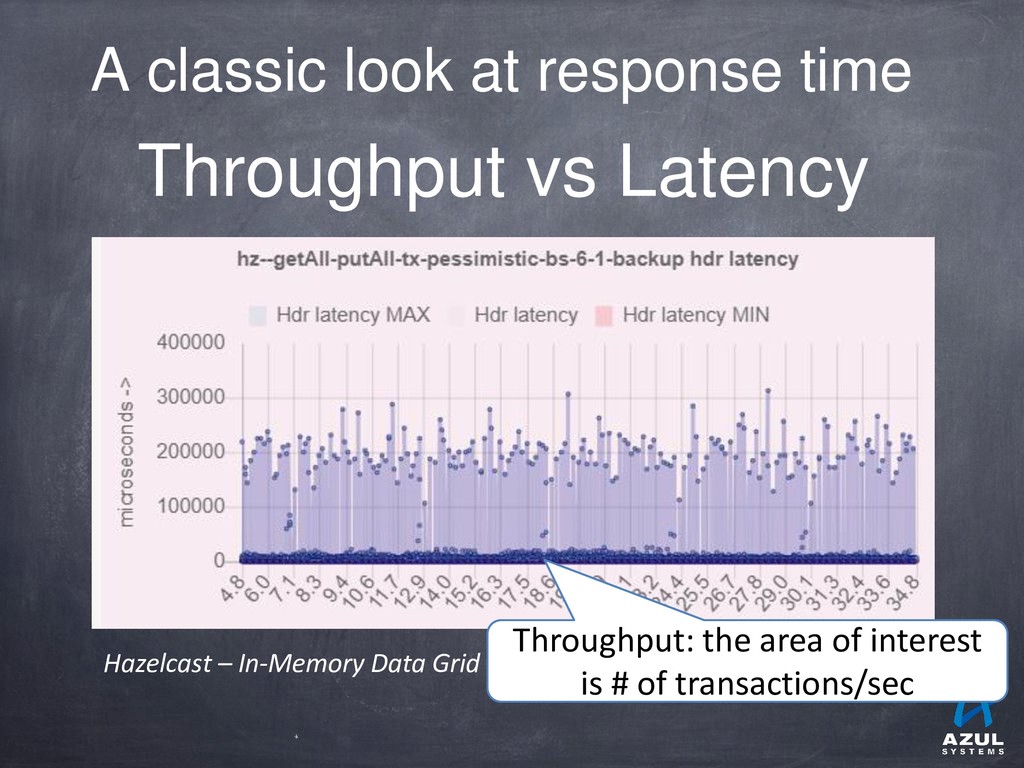
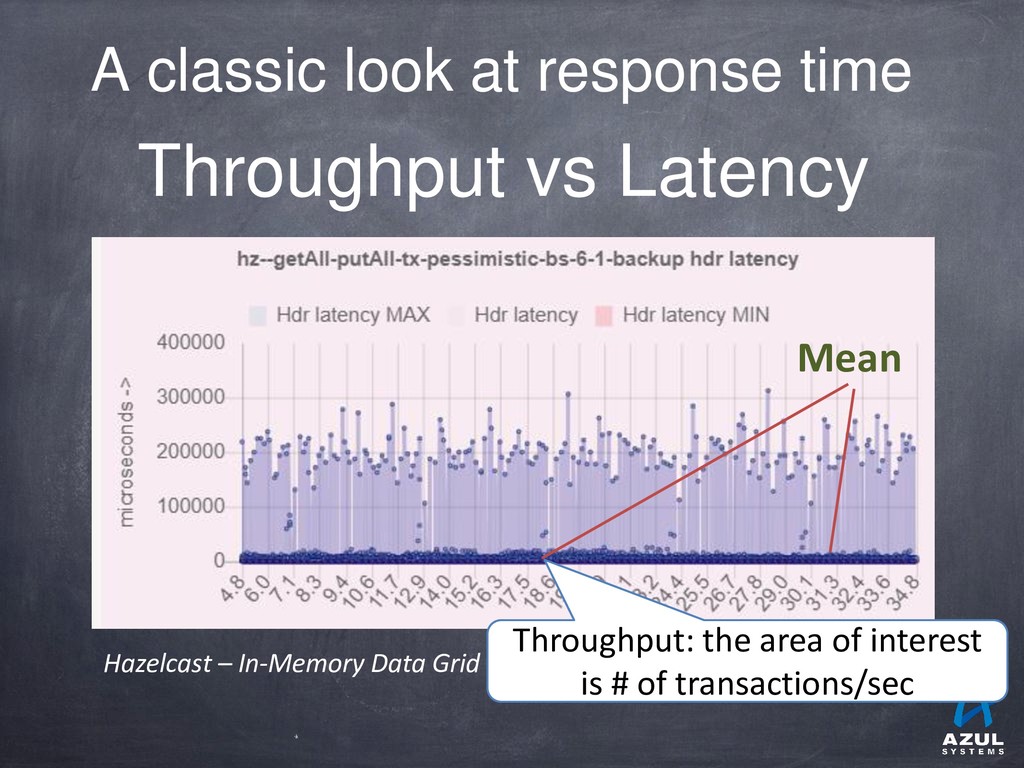
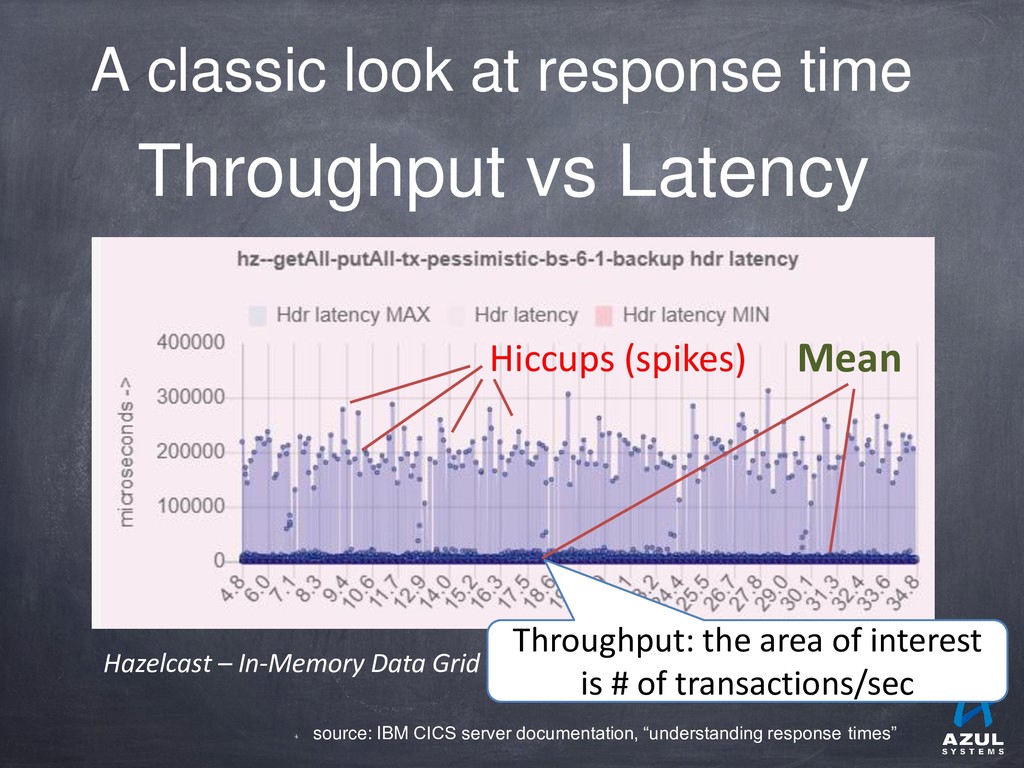
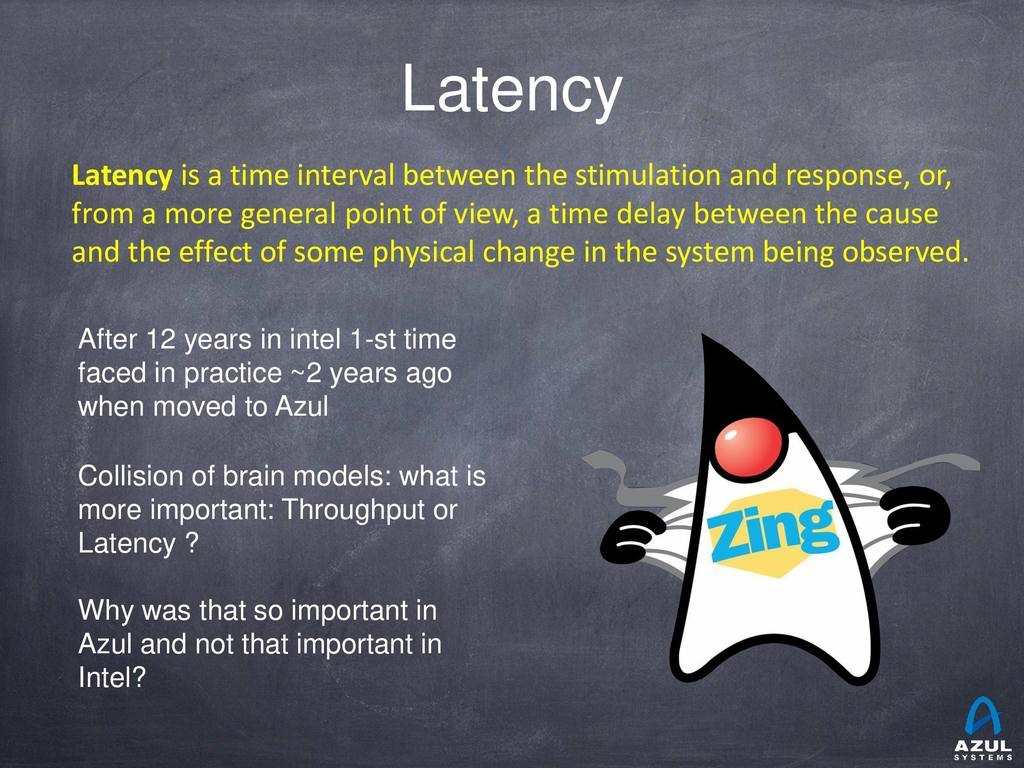
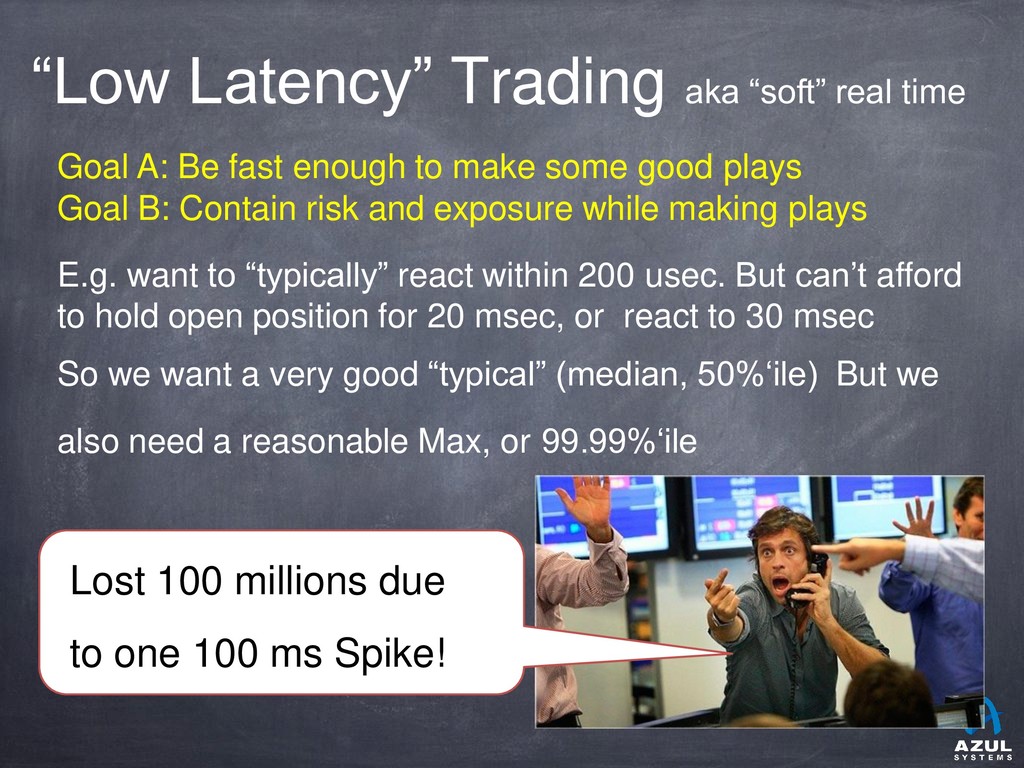
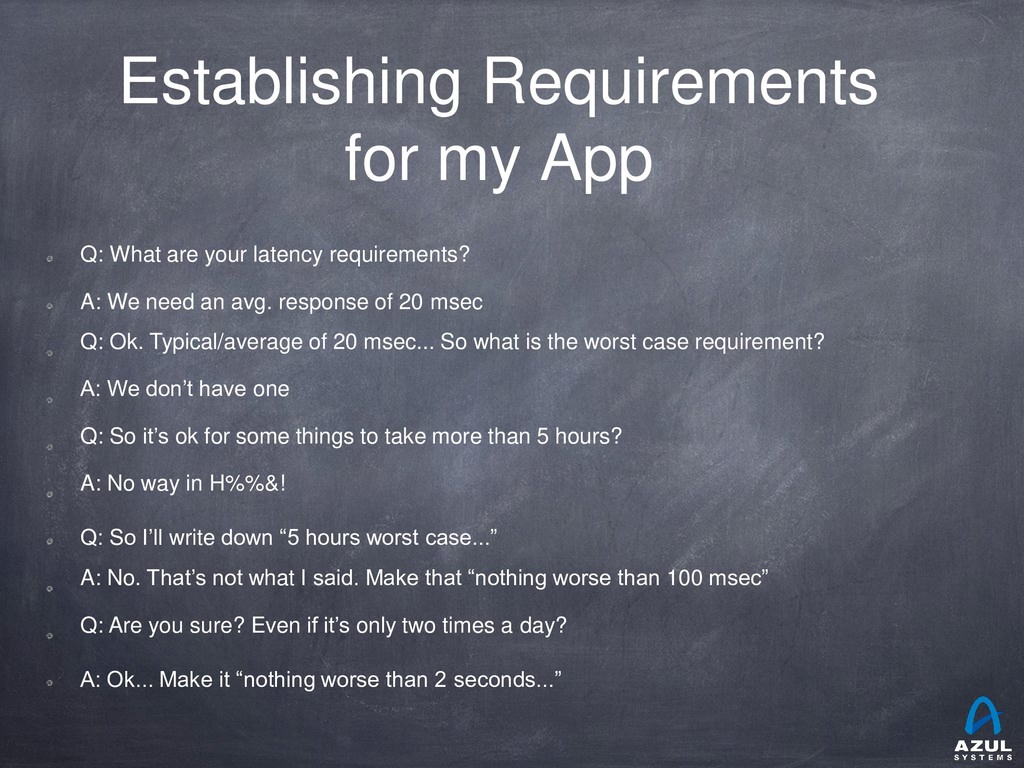
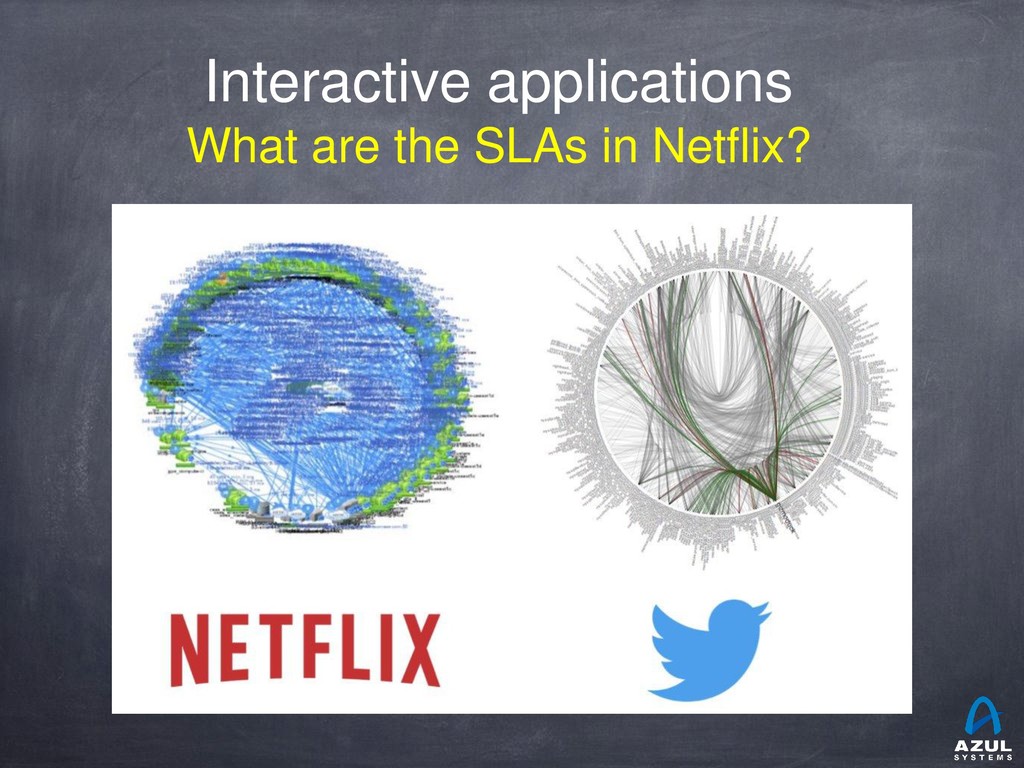
Что такое Latency? Зачем ее измерять уже на этапе разработки Вашего продукта, что такое SLA, какие инструменты использовать, какие подводные камни существуют и главное, как ее правильно измерять. В данном докладе ответим на все эти вопросы, а также посмотрим на реальные данные измерений latency на примере ElasticSearch.

Tags: latency, SLA, ElasticSearch, tools
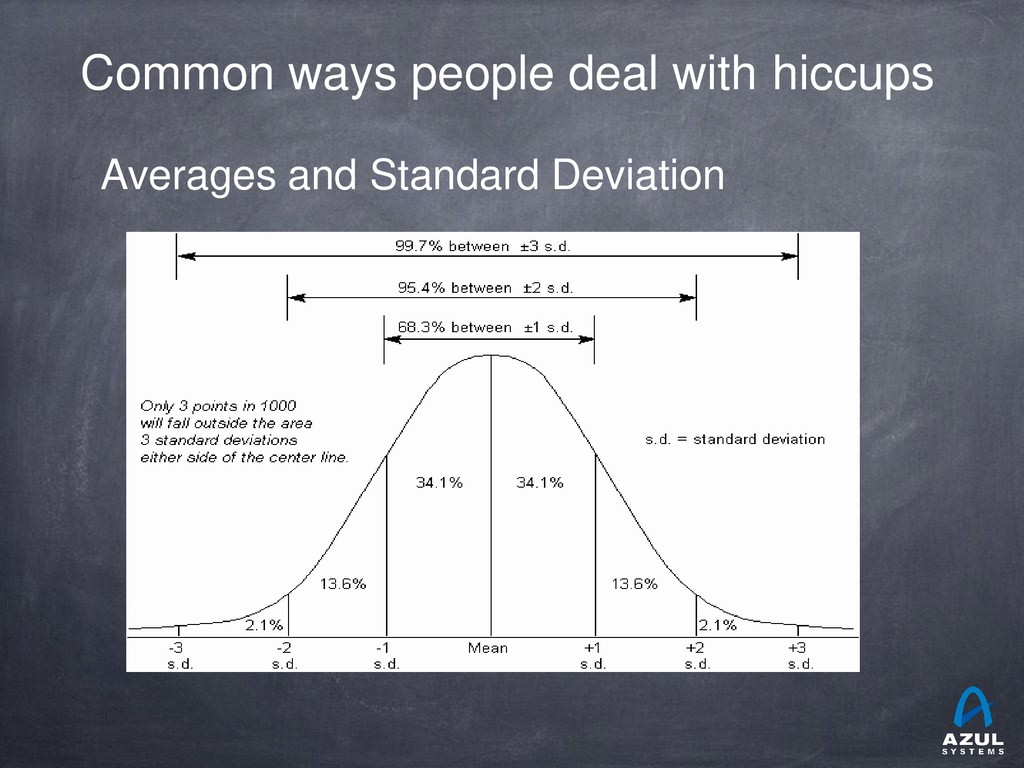
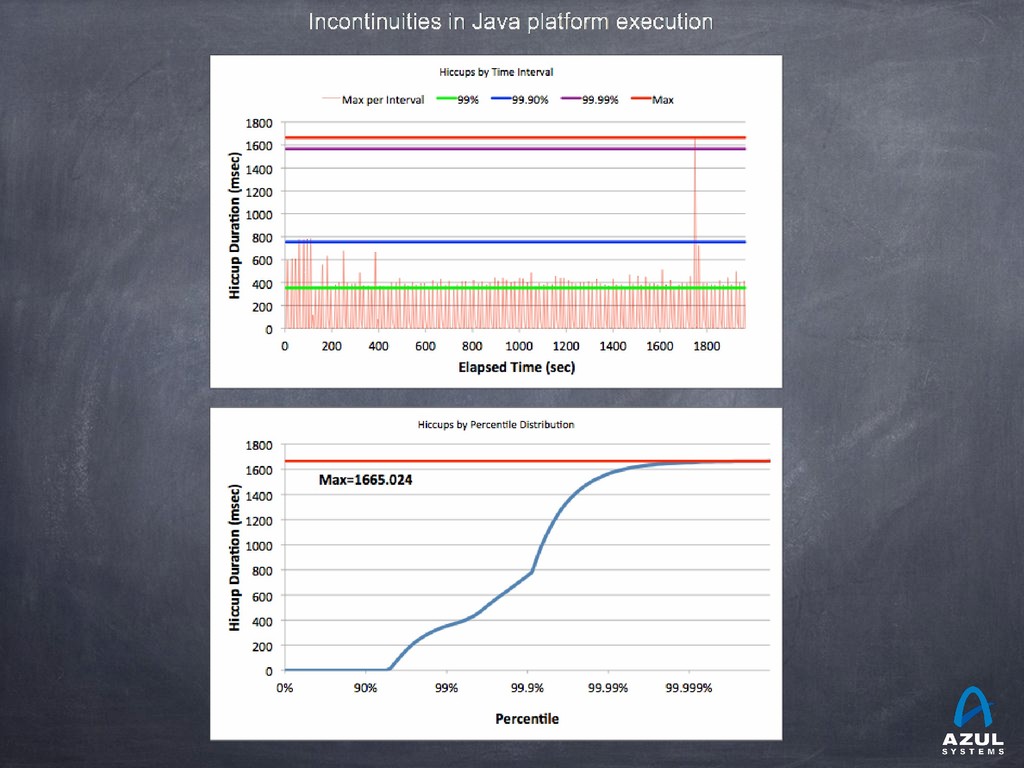
jugnsk

February 27, 2019
Tweet

More Decks by jugnsk

Other Decks in Programming

Transcript

  1. Что такое latency и с чем ее едят… Готовим бизнес

    ланч на практических примерах... Алексей Игнатенко, Performance Team manager, компания Azul Systems
  2. Меню на сегодня На первое: Latency vs Throughput На второе:

    Tools проблема Coordinated Omission на десерт … Эта фотография, автор: Неизвестный автор, лицензия: CC BY-NC Эта фотография, автор: Неизвестный автор, лицензия: CC BY-NC
  3. Готовить сегодня будет Aleksey Ignatenko 12 yeas in Intel Novosibirsk

    working on Java Runtimes Experience in all major JVM components: JIT, GC, Runtime ~7 years of Performance related projects Now Engineering Manager @Azul Systems Leading Performance and recently Compiler Teams
  4. A classic look at response time Hazelcast – In-Memory Data

    Grid Response time is the total amount of time it takes to respond to a request for service (Wikipedia).
  5. A classic look at response time Throughput vs Latency Hazelcast

    – In-Memory Data Grid Throughput: the area of interest is # of transactions/sec
  6. A classic look at response time Throughput vs Latency Mean

    Hazelcast – In-Memory Data Grid Throughput: the area of interest is # of transactions/sec
  7. A classic look at response time Throughput vs Latency source:

    IBM CICS server documentation, “understanding response times” Hiccups (spikes) Hazelcast – In-Memory Data Grid Throughput: the area of interest is # of transactions/sec Mean
  8. Latency After 12 years in intel 1-st time faced in

    practice ~2 years ago when moved to Azul Collision of brain models: what is more important: Throughput or Latency ? Why was that so important in Azul and not that important in Intel? Latency is a time interval between the stimulation and response, or, from a more general point of view, a time delay between the cause and the effect of some physical change in the system being observed.
  9. Hiccups are [typically] strongly multi-modal They don’t look anything like

    a normal distribution They usually look like periodic freezes A complete shift from one mode/behavior to another Mode A: “good”. Mode B: “Somewhat bad” Mode C: “terrible”, ... ....
  10. Hazelcast – move to percentile A percentile (or a centile)

    is a measure used in statistics indicating the value below which a given percentage of observations in a group of observations falls. For example, the 20th percentile is the value (or score) below which 20% of the observations may be found.
  11. Latency tells us how long something took But what do

    we WANT the latency to be? What do we want the latency to BEHAVE like? Latency requirements are usually a PASS/FAIL test of some predefined criteria Different applications have different needs Requirements should reflect application needs Measurements should provide data to evaluate requirements
  12. Where the sysadmin is willing to go What the marketing

    benchmarks will say SustainableHow much load can this system handle? Throughput Level Where users complain Better ways people can deal with hiccups
  13. Better ways people can deal with hiccups Actually measuring percentiles

    Requirements Response Time Percentile plot line
  14. Interactive applications aka “squishy” real time Goal: Keep users happy

    enough to not complain/leave Need to have “typically snappy” behavior Ok to have occasional longer times, but not too high, and not too often Example: 90% of responses should be below 0.2 sec, 99% should be below 0.5 sec, 99.9 should be better than 2 seconds. And a >10 second response should never happen. Remember: A single user may have 100s of interactions per session...
  15. “Low Latency” Trading aka “soft” real time Goal A: Be

    fast enough to make some good plays Goal B: Contain risk and exposure while making plays E.g. want to “typically” react within 200 usec. But can’t afford to hold open position for 20 msec, or react to 30 msec So we want a very good “typical” (median, 50%‘ile) But we also need a reasonable Max, or 99.99%‘ile What if we the Max spike observed is ~100 ms?
  16. “Low Latency” Trading aka “soft” real time Goal A: Be

    fast enough to make some good plays Goal B: Contain risk and exposure while making plays E.g. want to “typically” react within 200 usec. But can’t afford to hold open position for 20 msec, or react to 30 msec So we want a very good “typical” (median, 50%‘ile) But we also need a reasonable Max, or 99.99%‘ile Lost 100 millions due to one 100 ms Spike!
  17. Establishing Requirements for my App Q: What are your latency

    requirements? A: We need an avg. response of 20 msec Q: Ok. Typical/average of 20 msec... So what is the worst case requirement? A: We don’t have one Q: So it’s ok for some things to take more than 5 hours? A: No way in H%%&! Q: So I’ll write down “5 hours worst case...” A: No. That’s not what I said. Make that “nothing worse than 100 msec” Q: Are you sure? Even if it’s only two times a day? A: Ok... Make it “nothing worse than 2 seconds...”
  18. Comparing behavior under different throughputs and/or configurations Hazelcast, OpenJDK, target

    throughput: 5000, 6000, 7000 reqs/sec ParallelGC Max SLA All SLAs are broken!
  19. Comparing behavior under different throughputs and/or configurations Hazelcast, OpenJDK, target

    throughput: 5000, 6000, 7000 reqs/sec CMS GC Max SLA 90% SLA 99.99% SLA 99.9% SLA
  20. Comparing behavior under different throughputs and/or configurations Hazelcast, OpenJDK, target

    throughput: 5000, 6000, 7000 reqs/sec G1 GC Max SLA 90% SLA 99.99% SLA 99.9% SLA
  21. The Apache JMeter™ application is open source software, a 100%

    pure Java application designed to load test functional behavior and measure performance. It was originally designed for testing Web Applications but has since expanded to other test functions.
  22. The coordinated omission problem Common Example A (load testing): -

    build/buy load tester to measure system behavior - each “client” issues requests one by one at a certain rate measure and log response time for each request - results log used to produce histograms, percentiles, etc.
  23. Common Example B: Coordinated Omission in Monitoring Code Long operations

    only get measured once delays outside of timing window do not get measured at all
  24. How bad can this get? Avg. is 1 msec over

    1st 100 sec System Stalled for 100 Sec System easily handles 100 requests/sec Responds to each in 1msec ~50%‘ile is 1 msec Elapsed Time ~75%‘ile is 50 sec 99.99%‘ile is ~100sec Avg. is 50 sec. over next 100 sec How would you characterize this system? Overall Average response time is ~25 sec.
  25. Measurement in practice System Stalled for 100 Sec System easily

    handles 100 requests/sec Responds to each in 1msec Naïve Characterization 10,000 @ 1msec 1 @ 100 second Std. Dev. is 0.99sec! 99.99%‘ile is 1 msec! (should be ~100sec) Elapsed Time Average. is 10.9msec! (should be ~25 sec)
  26. Proper measurement System Stalled for 100 Sec System easily handles

    100 requests/sec Responds to each in 1msec 10,000 results Varying linearly from 100 sec to 10 msec 10,000 results @ 1 msec each Elapsed Time ~75%‘ile is 50 sec ~50%‘ile is 1 msec 99.99%‘ile is ~100sec
  27. Proper measurement System Stalled for 100 Sec System easily handles

    100 requests/sec Responds to each in 1msec 10,000 results Varying linearly from 100 sec to 10 msec 10,000 results @ 1 msec each Coordinated Omission Elapsed Time ~75%‘ile is 50 sec ~50%‘ile is 1 msec 99.99%‘ile is ~100sec
  28. HdrHistogram A High Dynamic Range Histogram Covers a configurable dynamic

    value range At configurable precision (expressed as number of significant digits) For Example: Track values between 1 microsecond and 1 hour With 3 decimal points of resolution Built-in [optional] compensation for Coordinated Omission Open Source On github, released to the public domain, creative commons CC0
  29. HdrHistogram If you want to be able to produce graphs

    like this... You need both good dynamic range and good resolution
  30. jHiccup A tool for capturing and displaying platform hiccups Records

    any observed non-continuity of the underlying platform Plots results in simple, consistent format Simple, non-intrusive As simple as adding jHiccup.jar as a java agent: % java -javaagent=jHiccup.jar myApp myflags or attaching jHiccup to a running process: % jHiccup -p <pid> Adds a background thread that samples time @ 1000/sec into an HdrHistogram Open Source. Released to the public domain ©2013 Azul Systems, Inc.
  31. Takeaways Standard Deviation and application latency should never show up

    on the same page... If you haven’t stated percentiles and a Max, you haven’t specified your requirements ALWAYS measure Max time. Consider what it means... Measuring throughput without latency behavior is [usually] meaningless Mistakes in measurement/analysis can cause orders-of- magnitude errors and lead to bad business decisions Measure %‘iles. Lots of them. jHiccup and HdrHistogram are pretty useful
  32. Comparing behavior under different throughputs and/or configurations ©2013 Azul Systems,

    Inc. Hazelcast, OpenJDK, target throughput: 5000, 6000, 7000 reqs/sec Zing low pause GC (C4)