Upgrade to Pro — share decks privately, control downloads, hide ads and more …

psb_chervoneva

Julia Wrobel
December 24, 2023

 psb_chervoneva

Julia Wrobel

December 24, 2023
Tweet

More Decks by Julia Wrobel

Other Decks in Education

Transcript

  1. Quantile biomarkers based on single-cell multiplex immunofluorescence imaging data Inna

    Chervoneva, PhD Professor Division of Biostatistics Department of Pharmacology, Physiology and Cancer Biology Sidney Kimmel Medical College Thomas Jefferson University, Philadelphia, PA Pacific Symposium of Biocomputing (PSB), January 3, 2024 (Professor Division of Biostatistics Department of Pharmacology, Physiology and Cancer Biology Sidney Kimmel Medical College Thomas Jefferson University, Phil Pacific Symposium of Biocomputing (PSB), January 1 / 23
  2. Breast cancer TMA data A tissue bank of invasive breast

    cancer (BC) tissue specimens from 1988-2012 was collected into core-based tissue microarrays (TMAs). Progression free survival up to 240 months follow-up for 1,000+ patients. None of the patients received anti-cancer treatment prior to surgery The post-surgery treatments were captured by indicator variables for chemotherapy, radiation therapy, and hormone therapy. The data also included commonly employed clinical-pathological prognostic factors: age, race (white vs. non-white), hormone receptor (HR) status, HER2 positivity, histologic grade, node status, tumor size (< 2cm, 2 − 5cm, > 5cm). (Professor Division of Biostatistics Department of Pharmacology, Physiology and Cancer Biology Sidney Kimmel Medical College Thomas Jefferson University, Phil Pacific Symposium of Biocomputing (PSB), January 2 / 23
  3. Functional vs. phenotypic protein biomarkers Information generated by the advanced

    quantitative pathology platforms include: Cellular signal intensity (CSI) of each protein expression in each compartment of interest (e.g. nucleus, membrane, cytoplasm of every cancer cell). The spatial coordinates of the cell centroids Additional characteristics of the cells (area, shape factor, etc) Phenotypic markers (identify cell types) Cytokeratin “Cluster of differentiation” (CD) markers Other proteins characterizing immune or other stromal cells Functional markers (proteins of interest in potentially multiple cell types) Proliferation markers (Ki-67, PCNA) Checkpoint proteins (PD-1, PD-L1, CTLA-4) Growth factors and receptors (EGFR, HER2, HER3) Variety of spatial analysis approaches have been recently developed for phenotyped immune and cancer cells Spatial analysis of quantitative functional markers is less explored and often proceeds with spatial analysis of ”marker-positive” cells. (Professor Division of Biostatistics Department of Pharmacology, Physiology and Cancer Biology Sidney Kimmel Medical College Thomas Jefferson University, Phil Pacific Symposium of Biocomputing (PSB), January 3 / 23
  4. Marked point processes framework A marked point processes is a

    point process combined with some associated quantities (‘marks’) measured at each point. Categorical marks capturing cell phenotypes combined with point pattern of cell centroids => multitype marked point pattern (MMPP). Point pattern of cell centroids + continuous measures of CSI levels of protein expression => marked point pattern (MPP) Ki67− Ki67+ 5 10 15 20 (Professor Division of Biostatistics Department of Pharmacology, Physiology and Cancer Biology Sidney Kimmel Medical College Thomas Jefferson University, Phil Pacific Symposium of Biocomputing (PSB), January 4 / 23
  5. Phosphorylated Stat5 (pYStat5) in breast cancer Representative IF IHC images

    of normal human breast tissue and two primary breast cancers pYStat5 (red), cytokeratin (green), and DAPI (blue). pYStat5 is a latent cytoplasmic transcription factor and a primary mediator of prolactin signaling in breast epithelia. prolactin-induced Stat5 activation has been well documented (Fig. 4C) and in breast cancer (Fig. 4D). Colocalization provides further evidence for direct upregulation of PTHrP by Stat5, and also indicates a role for prolactin in maintaining nuclear PTHrP in lactating mammary glands, a condition under which large amounts of PTHrP are also secreted into milk and bloodstream. Although Stat5 was required for PTHrP expression, prolactin- Neither U0126 nor LY294002 blocked p PTHrP protein expression, whereas the blocked prolactin-induced phosphorylatio (Fig.4E). Collectively, these data indicate th of PTHrP expression is mediated by Stat5 an either Erk or Akt signaling pathways. Normal Case 2 Case 1 PTHrP / CK pY-Stat5/ CK SE ¼ 0.078 regression cohort 2 (B pY-Stat5 (l SE ¼ 0.067 (middle; slo SE ¼ 0.038 Stat5b (rig SE ¼ 0.041 Representa analysis of n and two pr stained for Stat5 (red, (green), an (Professor Division of Biostatistics Department of Pharmacology, Physiology and Cancer Biology Sidney Kimmel Medical College Thomas Jefferson University, Phil Pacific Symposium of Biocomputing (PSB), January 5 / 23
  6. Sample distributions of pYStat5 CSI levels The standard approach for

    analysis of functional biomarkers: Mean Signal Intensity (MSI) is computed within the region of interest (i.e. cancer cell compartment of the tumor). But the same MSI levels may correspond to different CSI distributions. Recurrence in 24 mo 4 6 8 10 0.0 0.2 0.4 4 6 8 10 0.0 0.2 0.4 Density 4 6 8 10 0.0 0.2 0.4 L og CSI NO Recurrence in 147 mo 4 6 8 10 0.0 0.2 0.4 4 6 8 10 0.0 0.2 0.4 Density 4 6 8 10 0.0 0.2 0.4 Log CSI distribution of Log CSIs in two sample tissues blue lines show the kernel density estimates black vertical lines show the MSIs Distributions of CSI levels may be represented with densities or quantile functions Lines of the same color show the kernel density estimate and the sample quantile function for pYStat5 CSI levels in the same sample tissue (Professor Division of Biostatistics Department of Pharmacology, Physiology and Cancer Biology Sidney Kimmel Medical College Thomas Jefferson University, Phil Pacific Symposium of Biocomputing (PSB), January 6 / 23
  7. Functional Regression Quantile Index (FR-QI) For kth subject, let the

    empirical quantile function Qk (p) of CSI expressions be defined as the jth order statistic, where j is such that (j − 1)/n < p < j/n. FR-QI is defined as the functional regression [James, 2002] predictor, QIk = 1 0 β(p)Qk (p)dp where β(p) is an unknown functional coefficient function [Yi et al, 2023a] β(p) is represented by a spline or by a piece-wise linear function and estimated as part of fitting a model to a data set that includes clinical outcomes. For continuous or categorical outcomes, β(p) may be estimated using the R package refund or using the gam function in the R package mgcv For survival outcomes, β(p) is estimated by flitting a proportional hazard functional regression model [Gellar et al, 2015], a.k.a. Linear Functional Cox Model (LFCM): loghk (t, β()) = logh0(t) + 1 0 β(p)Qk (p)dp where hk [t|β, Qk ] is the hazard function for the kth subject at time t and h0(t) is a non-parametric baseline hazard function. LFCM can be fitted using the gam function in the R package mgcv James G. Generalized linear models with functional predictor variables. Journal of the Royal Statistical Society. 2002; 64(Series B):411-32. Yi, M., Zhan, T., Peck, A. R., Hooke, J. A., Kovatich, A. J., Shriver, C. D., ... Chervoneva, I. (2023a). Quantile Index Biomarkers Based on Single-Cell Expression Data. Laboratory Investigation, 103(8), 100158. Gellar, J. E., Colantuoni, E., Needham, D. M., and Crainiceanu, C. M. (2015), “Cox Regression Models With Functional Covariates for Survival Data,Statistical Modelling, 15, 256–278. (Professor Division of Biostatistics Department of Pharmacology, Physiology and Cancer Biology Sidney Kimmel Medical College Thomas Jefferson University, Phil Pacific Symposium of Biocomputing (PSB), January 7 / 23
  8. Illustration of computing FR-QI (Professor Division of Biostatistics Department of

    Pharmacology, Physiology and Cancer Biology Sidney Kimmel Medical College Thomas Jefferson University, Phil Pacific Symposium of Biocomputing (PSB), January 8 / 23
  9. Nonlinear Functional Regression Quantile Index (nlFR-QI) nlFR-QI is defined as

    a nonlinear functional regression predictor, nlFR-QIk = 1 0 F(p, Qk (p))dp where F(·,·) is an unspecified bivariate twice differentiable function. F(·,·) is represented by a tensor product of univariate P-splines [McLean et al, 2014] F(s, x) = ∑Ns i=1 ∑Nx l=1 θi,l Bi (s)Bl (x) where Bi and Bl are univariate splines on the domains of s and x, respectively. Then nlFR-QIk can be re-written as 1 0 ∑Ns i=1 ∑Nx l=1 θi,l Bi (p)Bl (Qk (p))dp = ∑Ns i=1 ∑Nx l=1 θi,l 1 0 Bi (p)Bl (Qk (p))dp =VT k θ For survival outcomes, F(·,·) is estimated by fitting an Additive Functional Cox Model (AFCM) [Cui et al, 2020] loghk (t, F, Qk ) = logh0(t) + 1 0 F(p, Qk (p))dp maximizing the penalized partial log-likelihood using gam function in the R package mgcv. The gam function may be also used with continuous or categorical outcomes Identifiability constraints are imposed by default in R mgcv package. Cui, E., Crainiceanu, C.M. and Leroux, A., 2020. Additive Functional Cox Model. Journal of Computational and Graphical Statistics, pp.1-14. McLean, M. W., Hooker, G., Staicu, A.-M., Scheipl, F., and Ruppert, D. (2014), “Functional Generalized Additive Models,” Journal of Computational and Graphical Statistics, 23, 249–269. (Professor Division of Biostatistics Department of Pharmacology, Physiology and Cancer Biology Sidney Kimmel Medical College Thomas Jefferson University, Phil Pacific Symposium of Biocomputing (PSB), January 9 / 23
  10. Estimated F(·,·) surfaces for nlFR-QIs as predictors of PFS Estimated

    surface from AFCM using pYStat5 CSI quantile function pYStat5 Estimates from AFCM ...--- ...--- 0 ...-- CJ) ,.Jr . � --- CD tmat 0.Cl 02 0-4 0_6 O_H 1 _O tmat pYStat5 Q(p) function as linear functional regression predictor in LFCM: p < 0.001 as nonlinear functional regression predictor in AFCM: p < 0.001 Estimated surface from AFCM using PR CSI quantile function PR Q(p) function as linear functional regression predictor in LFCM: p = 0.039 as nonlinear functional regression predictor in AFCM: p = 0.007 (Professor Division of Biostatistics Department of Pharmacology, Physiology and Cancer Biology Sidney Kimmel Medical College Thomas Jefferson University, Phil Pacific Symposium of Biocomputing (PSB), January 10 / 23
  11. R package Qindex for computing FR-QI and nlFR-QI R package

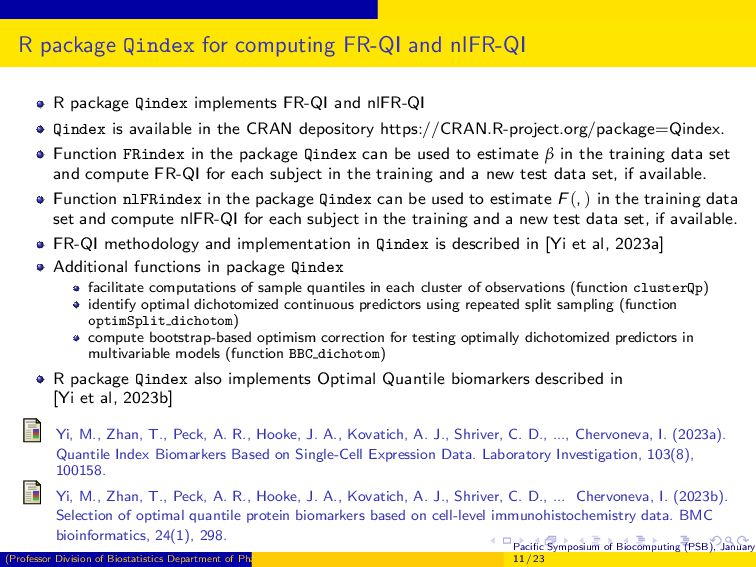
    Qindex implements FR-QI and nlFR-QI Qindex is available in the CRAN depository https://CRAN.R-project.org/package=Qindex. Function FRindex in the package Qindex can be used to estimate β in the training data set and compute FR-QI for each subject in the training and a new test data set, if available. Function nlFRindex in the package Qindex can be used to estimate F(, ) in the training data set and compute nlFR-QI for each subject in the training and a new test data set, if available. FR-QI methodology and implementation in Qindex is described in [Yi et al, 2023a] Additional functions in package Qindex facilitate computations of sample quantiles in each cluster of observations (function clusterQp) identify optimal dichotomized continuous predictors using repeated split sampling (function optimSplit dichotom) compute bootstrap-based optimism correction for testing optimally dichotomized predictors in multivariable models (function BBC dichotom) R package Qindex also implements Optimal Quantile biomarkers described in [Yi et al, 2023b] Yi, M., Zhan, T., Peck, A. R., Hooke, J. A., Kovatich, A. J., Shriver, C. D., ..., Chervoneva, I. (2023a). Quantile Index Biomarkers Based on Single-Cell Expression Data. Laboratory Investigation, 103(8), 100158. Yi, M., Zhan, T., Peck, A. R., Hooke, J. A., Kovatich, A. J., Shriver, C. D., ... Chervoneva, I. (2023b). Selection of optimal quantile protein biomarkers based on cell-level immunohistochemistry data. BMC bioinformatics, 24(1), 298. (Professor Division of Biostatistics Department of Pharmacology, Physiology and Cancer Biology Sidney Kimmel Medical College Thomas Jefferson University, Phil Pacific Symposium of Biocomputing (PSB), January 11 / 23
  12. Effects of FR-QI and nlFR-QI in the external validation cohort

    The external validation cohort includes 273 ER+ patients with 31 progression events Results for Ki67, PD-L2, and Ki67 FR-QIs are reported in [Yi et al, 2023a] Protein Biomarker HR (#) 95%LL 95%UL p-value Continuous FR-QI pYStat5 cont. FR-QI 0.47 0.25 0.88 0.019 PD-L2 cont. FR-QI 1.75 1.04 2.94 0.035 Ki67 cont. FR-QI 1.22 0.90 1.66 0.208 PR cont. FR-QI 0.61 0.29 1.28 0.194 Continuous non-linear FR-QI pYStat5 cont. nlFR-QI 0.48 0.26 0.87 0.016 PD-L2 cont. nlFR-QI 1.34 0.82 2.20 0.244 Ki67 cont. nlFR-QI 1.15 0.70 1.89 0.586 PR cont. nlFR-QI 0.65 0.35 1.20 0.167 Dichotomized FR-QI pYStat5 High vs. Low FR-QI 0.69 0.287 1.635 0.394 PD-L2 High vs. Low FR-QI 1.86 0.88 3.96 0.107 Ki67 High vs. Low FR-QI 2.28 0.95 5.51 0.067 PR High vs. Low FR-QI 0.71 0.32 1.61 0.417 Dichotomized non-linear FR-QI pYStat5 High vs. Low nlFR-QI 0.59 0.25 1.39 0.225 PD-L2 High vs. Low nlFR-QI 0.95 0.43 2.13 0.905 Ki67 High vs. Low nlFR-QI 3.16 0.74 13.44 0.120 PR High vs. Low nlFR-QI 0.55 0.24 1.27 0.163 (#) HR corresponds to increase equal to IQR for continuous FR-QI or nlFR-QI Yi, M., Zhan, T., Peck, A. R., Hooke, J. A., Kovatich, A. J., Shriver, C. D., ... Chervoneva, I. (2023a). Quantile Index Biomarkers Based on Single-Cell Expression Data. Laboratory Investigation, 103(8), 100158. (Professor Division of Biostatistics Department of Pharmacology, Physiology and Cancer Biology Sidney Kimmel Medical College Thomas Jefferson University, Phil Pacific Symposium of Biocomputing (PSB), January 12 / 23
  13. Optimal quantile biomarkers [Yi et al, 2023b] Algorithm to identify

    the optimal Q(p) predictor of an outcome in a screening data set: Select the set of quantiles to be evaluated as predictors. For each random split into training/test set pair and each considered quantile, Determine the optimal cutoff (e.g. using the R package rpart) in the combined training set. Apply the optimal cutoff to the test set and estimate the effect size (e.g. log odds ratio). Repeat for 100 training/test splits, compute the median effect size for each quantile. Select the optimal quantile with the highest effect size. Perform bootstrap-based optimism correction if there are no external validation data. Screening cohort: 845 non-metastatic hormone positive (HR+) breast cancer patients with 142 progressions and the clinical follow-up ranging from 2 months to 238 months with median follow-up time of 115 months. External validation cohort: 340 non-metastatic HR+ breast cancer patients with 42 progression events and clinical follow-up ranging from 0.8 months to 297.5 months with a median follow-up time of 148 months. Yi, M., Zhan, T., Peck, A. R., Hooke, J. A., Kovatich, A. J., Shriver, C. D., ... Chervoneva, I. (2023b). Selection of optimal quantile protein biomarkers based on cell-level immunohistochemistry data. BMC bioinformatics, 24(1), 298. (Professor Division of Biostatistics Department of Pharmacology, Physiology and Cancer Biology Sidney Kimmel Medical College Thomas Jefferson University, Phil Pacific Symposium of Biocomputing (PSB), January 13 / 23
  14. Results from [Yi et al, 2023b] Page 9 of 15

    Yi et al. BMC Bioinformatics (2023) 24:298 Table 3 Performance of the dichotomized optimal quantiles, ccMSIs, and percentages of Ki-67 positive cells in Cox model fitted to the external validation cohort *Apparent cutoff based on the entire screening cohort without any bootstrap procedure ** Prespecified cutoffs for percentages of Ki-67 positive cells Univariate Cox model Multivariable Cox model Marker Quantile Cutoff∗ Optimal quantile Optimal quantile HR 95% Confidence Limits p-value HR 95% Confidence Limits p-value Ki-67 30 607.1 2.409 0.894 6.494 0.082 2.720 0.990 7.468 0.052 PCNA 5 1065.6 1.323 0.460 3.804 0.603 1.737 0.524 5.757 0.366 PD-L2 45 3938.5 2.331 1.121 4.846 0.023 2.110 0.977 4.557 0.057 PR 55 1052.6 0.431 0.188 0.985 0.046 0.447 0.187 1.068 0.070 Cutoff∗ ccMSI ccMSI HR 95% Confidence Limits p-value HR 95% Confidence Limits p-value Ki-67 676.0 1.454 0.673 3.143 0.341 1.101 0.484 2.506 0.819 PCNA 8313.6 1.218 0.593 2.501 0.591 1.366 0.653 2.857 0.407 PD-L2 4309.2 1.607 0.798 3.234 0.184 1.375 0.664 2.846 0.391 PR 1119.0 0.402 0.179 0.903 0.027 0.406 0.171 0.961 0.040 Cutoff∗∗ Ki-67 positive cells (%) Ki-67 positive cells (%) HR 95% Confidence Limits p-value HR 95% Confidence Limits p-value Ki-67 5 0.596 0.291 1.220 0.157 0.598 0.287 1.247 0.171 Ki-67 15 0.754 0.290 1.959 0.563 0.693 0.264 1.818 0.456 Ki-67 20 0.859 0.301 2.451 0.776 0.718 0.246 2.095 0.545 Ki-67 30 1.198 0.163 8.791 0.859 1.149 0.145 9.099 0.895 (Professor Division of Biostatistics Department of Pharmacology, Physiology and Cancer Biology Sidney Kimmel Medical College Thomas Jefferson University, Phil Pacific Symposium of Biocomputing (PSB), January 14 / 23
  15. Design of the simulation studies A 0.05 0.10 0.15 0.20

    0.25 6 8 10 log CSI Density 6 8 10 0.00 0.25 0.50 0.75 1.00 percentile p Q(p) B 0.0 0.1 0.2 0.3 2.5 5.0 7.5 10.0 12.5 log CSI Density 2.5 5.0 7.5 10.0 12.5 0.00 0.25 0.50 0.75 1.00 percentile p Q(p) C 0.0 0.1 0.2 5.0 7.5 10.0 12.5 15.0 log CSI Density 5.0 7.5 10.0 12.5 15.0 0.00 0.25 0.50 0.75 1.00 percentile p Q(p) D 0.0 0.1 0.2 4 6 8 10 12 log CSI Density 4 6 8 10 12 0.00 0.25 0.50 0.75 1.00 percentile p Q(p) Survival times were generated using the R package survsim [Morina and Navarro, 2014] Each simulated data set included high-risk and low-risk groups such that the hazard ratio associated with high-risk group ranged in (i) [2,3] or (ii) [3,4]. CSIs per subject: N = 20, 100, 200, 500, 1000. Distributions of CSI values were simulated as mixtures of two 4-parameter Tukey’s g-&-h distributions using the R package QuantileGH For scenario A, low- and high-risk groups had the same CSI distribution. For scenarios B,C,D, simulated CSI densities are shown as blue curves for low-risk group and as red curves for high-risk group. FR-QI biomarkers were based on a small (19) or a large (99) number of percentiles. 1000 pairs of training and test sets with 120 subjects per risk group were simulated per each scenario. Morina, D. and Navarro, A., 2014. The R package survsim for the simulation of simple and complex survival data. Journal of Statistical Software, 59, pp.1-20. (Professor Division of Biostatistics Department of Pharmacology, Physiology and Cancer Biology Sidney Kimmel Medical College Thomas Jefferson University, Phil Pacific Symposium of Biocomputing (PSB), January 15 / 23
  16. Mixtures of Tukey’s g-&-h distributions Tukey’s g-&-h random variable T(A,B,g,h)

    [Tukey, 1977] is defined through a monotone transformation of the standard normal variable Z, T(A,B,g,h) =      A + B · G(Z) · Z g ̸= 0, g-distribution A + B · H(Z) · Z h > 0, h-distribution A + B · G(Z) · H(Z) · Z g ̸= 0, h > 0, gh-distribution where A is the location and B > 0 is the scale parameter. The skewness is introduced by G(z) = (egz − 1)/gz with G0(z) = limg→0 Gg̸=0 (z) = 1. The kurtosis is introduced by H(z) = ehz2/2, h ≥ 0 [Hoaglin, 1985]. The quantile function of T(A,B,g,h) is t(A,B,g,h) (p) =      A + BzpG(zp) g ̸= 0 A + BzpH(zp) h > 0 A + BzpG(zp)H(zp) g ̸= 0, h > 0 (1) where zp, 0 < p < 1, is the p-th quantile of the standard normal distribution. K-component Tukey’s g-&-h mixture has the distribution function ∑K k=1 wk Pr TAk ,Bk ,gk ,hk < t , where ∑k wk = 1, A1 < A2 < · · · < AK , Bk > 0, hk ≥ 0, k = 1, · · · , K. Tukey, J.W.: Modern Techniques in Data Analysis. In: NSF-sponsored Regional Research Conference at Southeastern Massachusetts University, North Dartmouth, MA. (1977) Hoaglin, D.C.: Summarizing Shape Numerically: The g-and-h Distributions, pp. 461–513. John Wiley Sons, Ltd (1985). Chap. 11 (Professor Division of Biostatistics Department of Pharmacology, Physiology and Cancer Biology Sidney Kimmel Medical College Thomas Jefferson University, Phil Pacific Symposium of Biocomputing (PSB), January 16 / 23
  17. AUC ROC estimates for High vs. Low risk group with

    HR=2-3 based on a small number of percentiles (p = 0.05, 0.1, . . . , 0.95) A 0.50 0.55 0.60 0.65 AUC B 0.5 0.6 0.7 0.8 AUC C 0.5 0.6 0.7 0.8 AUC D 0.5 0.6 0.7 0.8 20 100 200 500 1000 Number of CSIs per subject AUC Methods QI nlQI OQ MSI (Professor Division of Biostatistics Department of Pharmacology, Physiology and Cancer Biology Sidney Kimmel Medical College Thomas Jefferson University, Phil Pacific Symposium of Biocomputing (PSB), January 17 / 23
  18. AUC ROC estimates for High vs. Low risk group with

    HR=2-3 based on a large number of percentiles (p = 0.01, 0.02, . . . , 0.99) A 0.50 0.55 0.60 0.65 AUC B 0.5 0.6 0.7 0.8 AUC C 0.5 0.6 0.7 0.8 AUC D 0.5 0.6 0.7 0.8 20 100 200 500 1000 Number of CSIs per subject AUC Methods QI nlQI OQ MSI (Professor Division of Biostatistics Department of Pharmacology, Physiology and Cancer Biology Sidney Kimmel Medical College Thomas Jefferson University, Phil Pacific Symposium of Biocomputing (PSB), January 18 / 23
  19. Misclassification error for High vs. Low risk group with HR=2-3

    based on a small number of percentiles (p = 0.05, 0.1, . . . , 0.95) A 0.45 0.50 0.55 ME B 0.0 0.1 0.2 0.3 0.4 0.5 ME C 0.0 0.1 0.2 0.3 0.4 0.5 ME D 0.0 0.1 0.2 0.3 0.4 0.5 20 100 200 500 1000 Number of CSIs per subject ME Methods QI nlQI OQ MSI (Professor Division of Biostatistics Department of Pharmacology, Physiology and Cancer Biology Sidney Kimmel Medical College Thomas Jefferson University, Phil Pacific Symposium of Biocomputing (PSB), January 19 / 23
  20. Misclassification error for High vs. Low risk group with HR=2-3

    based on a large number of percentiles (p = 0.01, 0.02, . . . , 0.99) A 0.45 0.50 0.55 ME B 0.0 0.1 0.2 0.3 0.4 0.5 ME C 0.0 0.1 0.2 0.3 0.4 0.5 ME D 0.0 0.1 0.2 0.3 0.4 0.5 20 100 200 500 1000 Number of CSIs per subject ME Methods QI nlQI OQ MSI (Professor Division of Biostatistics Department of Pharmacology, Physiology and Cancer Biology Sidney Kimmel Medical College Thomas Jefferson University, Phil Pacific Symposium of Biocomputing (PSB), January 20 / 23
  21. Conclusions and future directions Biomarkers based on entire distributions of

    CSI values of the protein of interest provide more information than the ones based on MSI or optimal quantiles. Linear FR-QI and nonlinear nlFR-QI performed similarly in our simulation scenarios. Performance was similar for FR-QI and nlFR-QI biomarkers based on a small (p = 0.05, 0.1, . . . , 0.95) or a large (p = 0.01, 0.02, . . . , 0.99) number of percentiles. The level of separation of survival curves between high vs. low risk groups had limited effect on performance of FR-QI biomarkers. In data with moderate sample sizes, FR-QI tends to be more efficient than nlFR-QI. Interpretation of nlFR-QI biomarkers is potentially more challenging. Dichotomized versions of FR-QI biomarkers are more informative for some proteins, but continuous FR-QI biomarkers tend to be more reproducible in an external validation. For valid new biomarkers, it is necessary to validate FR-QI and nlFR-QI metrics in a test set. Proposed FR-QI and nlFR-QI are applicable to any technology that captures protein or gene expression levels in individual cells or cell compartments (e.g. flow cytometry) Additional work is needed to address aggregation of information from multiple cores or regions of interest per subject. Linear and nonlinear functional regression indices can be derived using functional predictors other than CSI quantile functions. (Professor Division of Biostatistics Department of Pharmacology, Physiology and Cancer Biology Sidney Kimmel Medical College Thomas Jefferson University, Phil Pacific Symposium of Biocomputing (PSB), January 21 / 23
  22. Acknowledgments Misung Yi, PhD1,3 Amy R. Peck, PhD2,3 Tingting Zhan,

    PhD1,3 Yunguang Sun, PhD4 Hallgeir Rui, MD, PhD2,3 Brenton Maisel, MD, PhD5 Funding: Promise grant Therapy-relevant stratification of breast cancer patients: Integrating pathology and biomarker analyses (PI: Rui) NIH/NCI R01 CA222847 (PI: Chervoneva) NIH/NCI R01 CA267549 (MPIs: Rui, Chervoneva) 1 Division of Biostatistics, 2 Division of Cancer Biology, 3 Department of Pharmacology, Physiology and Cancer Biology, Sidney Kimmel Medical College, Thomas Jefferson University 4 Department of Pathology, Medical College of Wisconsin 5 Department of Neurology, University of California Irvine (Professor Division of Biostatistics Department of Pharmacology, Physiology and Cancer Biology Sidney Kimmel Medical College Thomas Jefferson University, Phil Pacific Symposium of Biocomputing (PSB), January 22 / 23
  23. Thank you! (Professor Division of Biostatistics Department of Pharmacology, Physiology

    and Cancer Biology Sidney Kimmel Medical College Thomas Jefferson University, Phil Pacific Symposium of Biocomputing (PSB), January 23 / 23