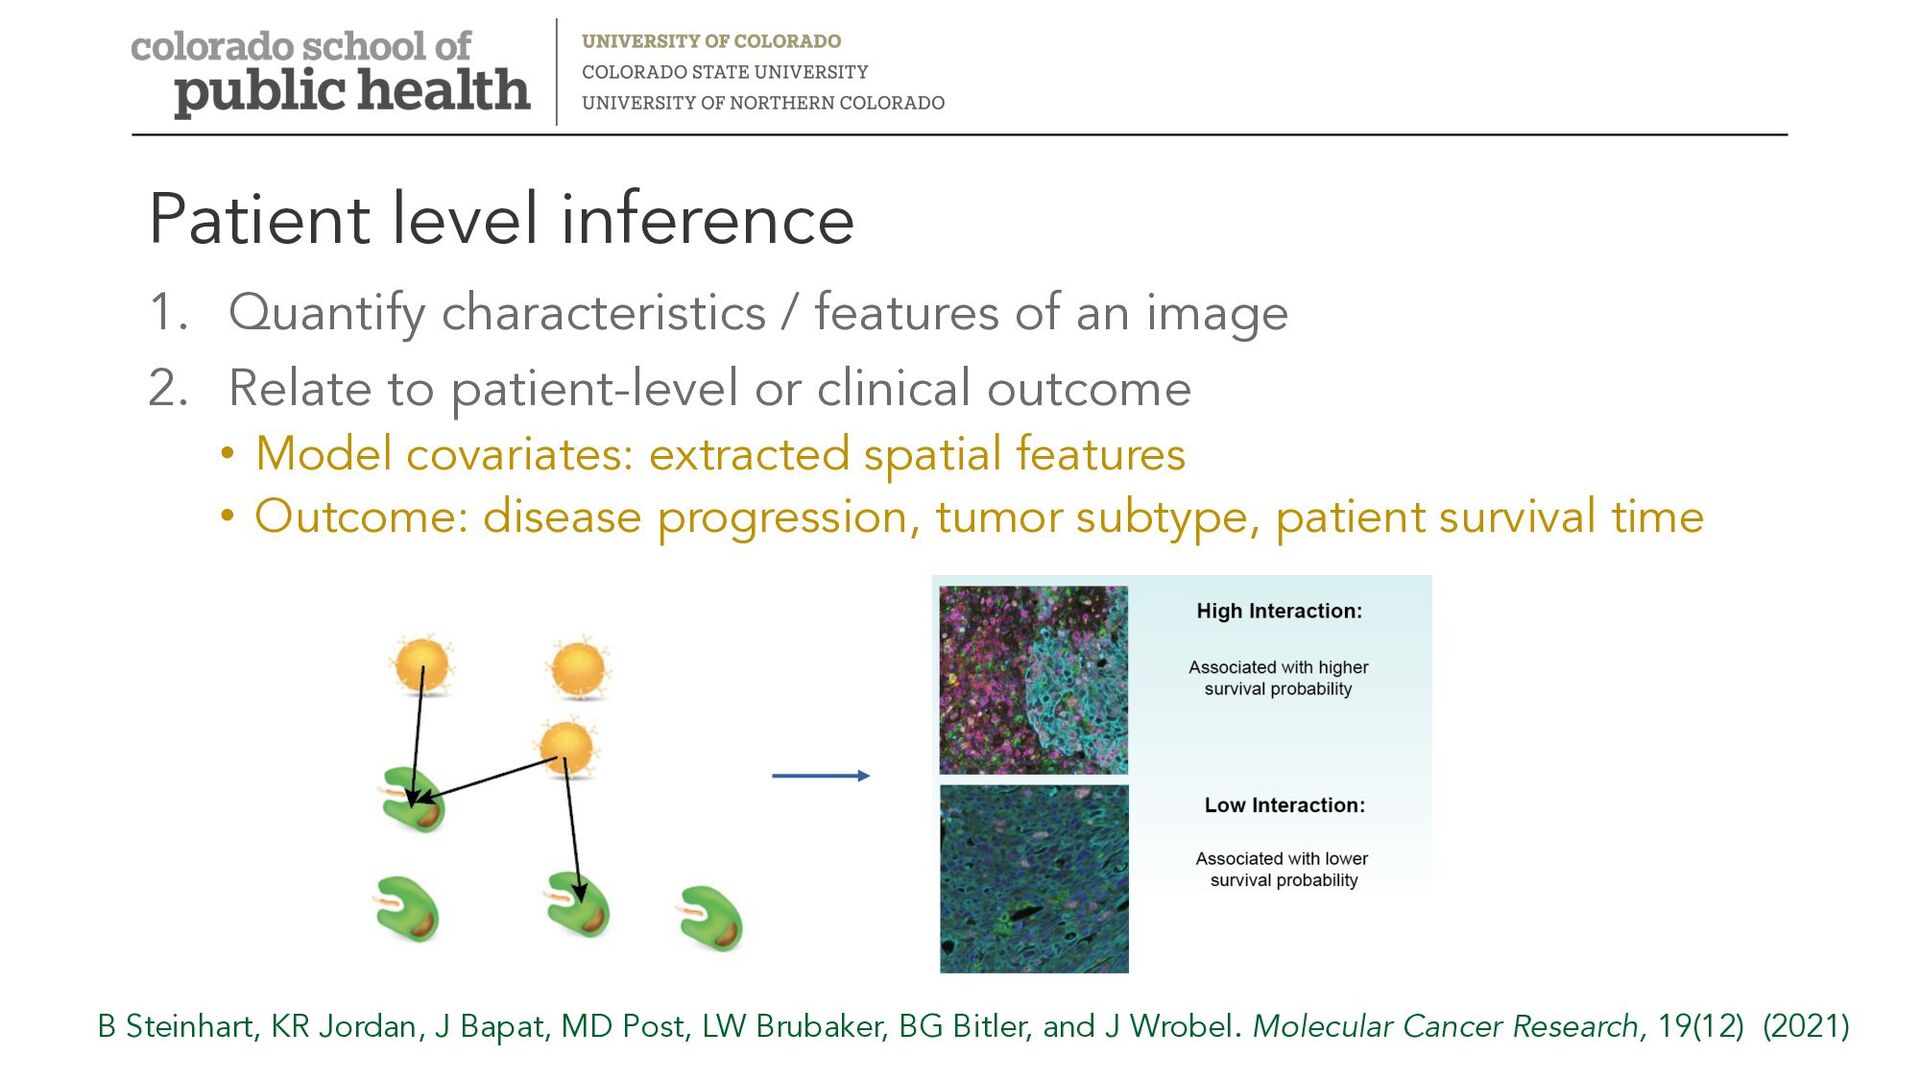
to patient-level or clinical outcome • Model covariates: extracted spatial features • Outcome: disease progression, tumor subtype, patient survival time Patient level inference B Steinhart, KR Jordan, J Bapat, MD Post, LW Brubaker, BG Bitler, and J Wrobel. Molecular Cancer Research, 19(12) (2021)
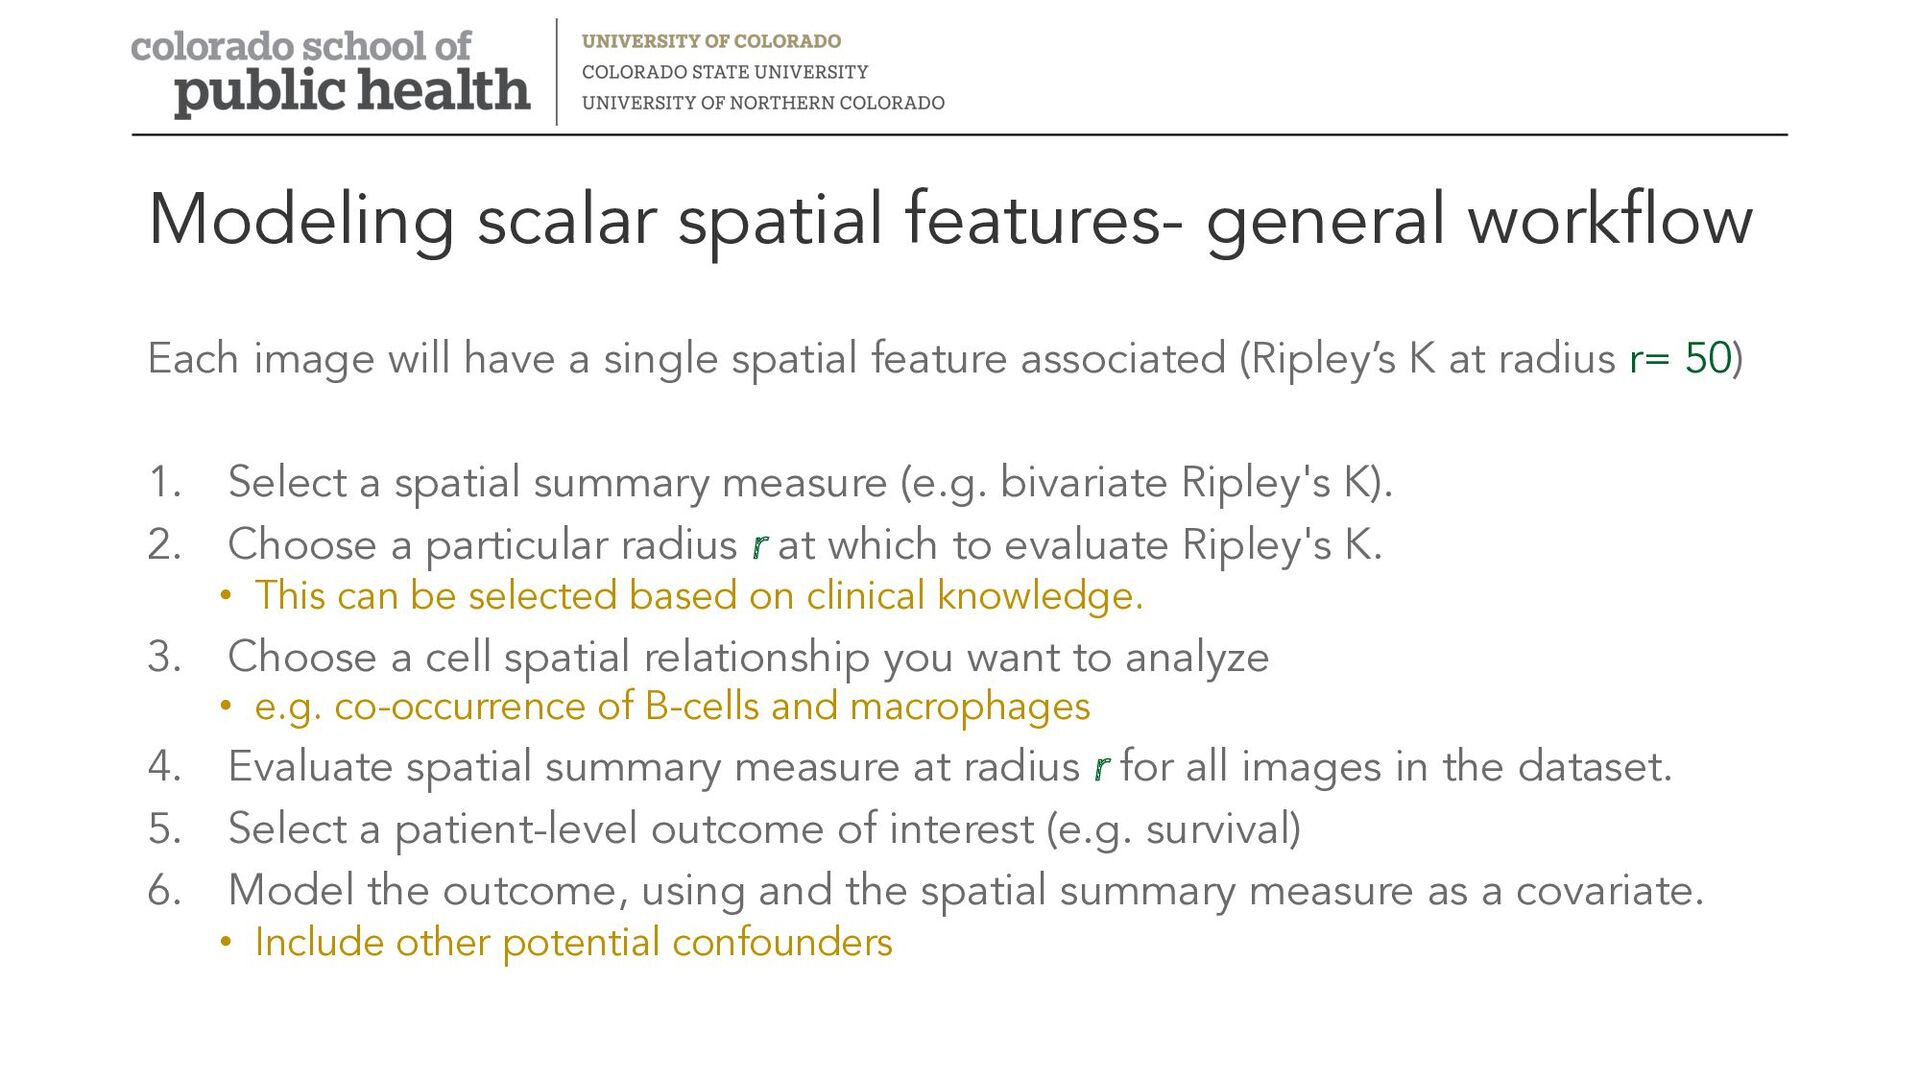
a single spatial feature associated (Ripley’s K at radius r= 50) 1. Select a spatial summary measure (e.g. bivariate Ripley's K). 2. Choose a particular radius r at which to evaluate Ripley's K. • This can be selected based on clinical knowledge. 3. Choose a cell spatial relationship you want to analyze • e.g. co-occurrence of B-cells and macrophages 4. Evaluate spatial summary measure at radius r for all images in the dataset. 5. Select a patient-level outcome of interest (e.g. survival) 6. Model the outcome, using and the spatial summary measure as a covariate. • Include other potential confounders
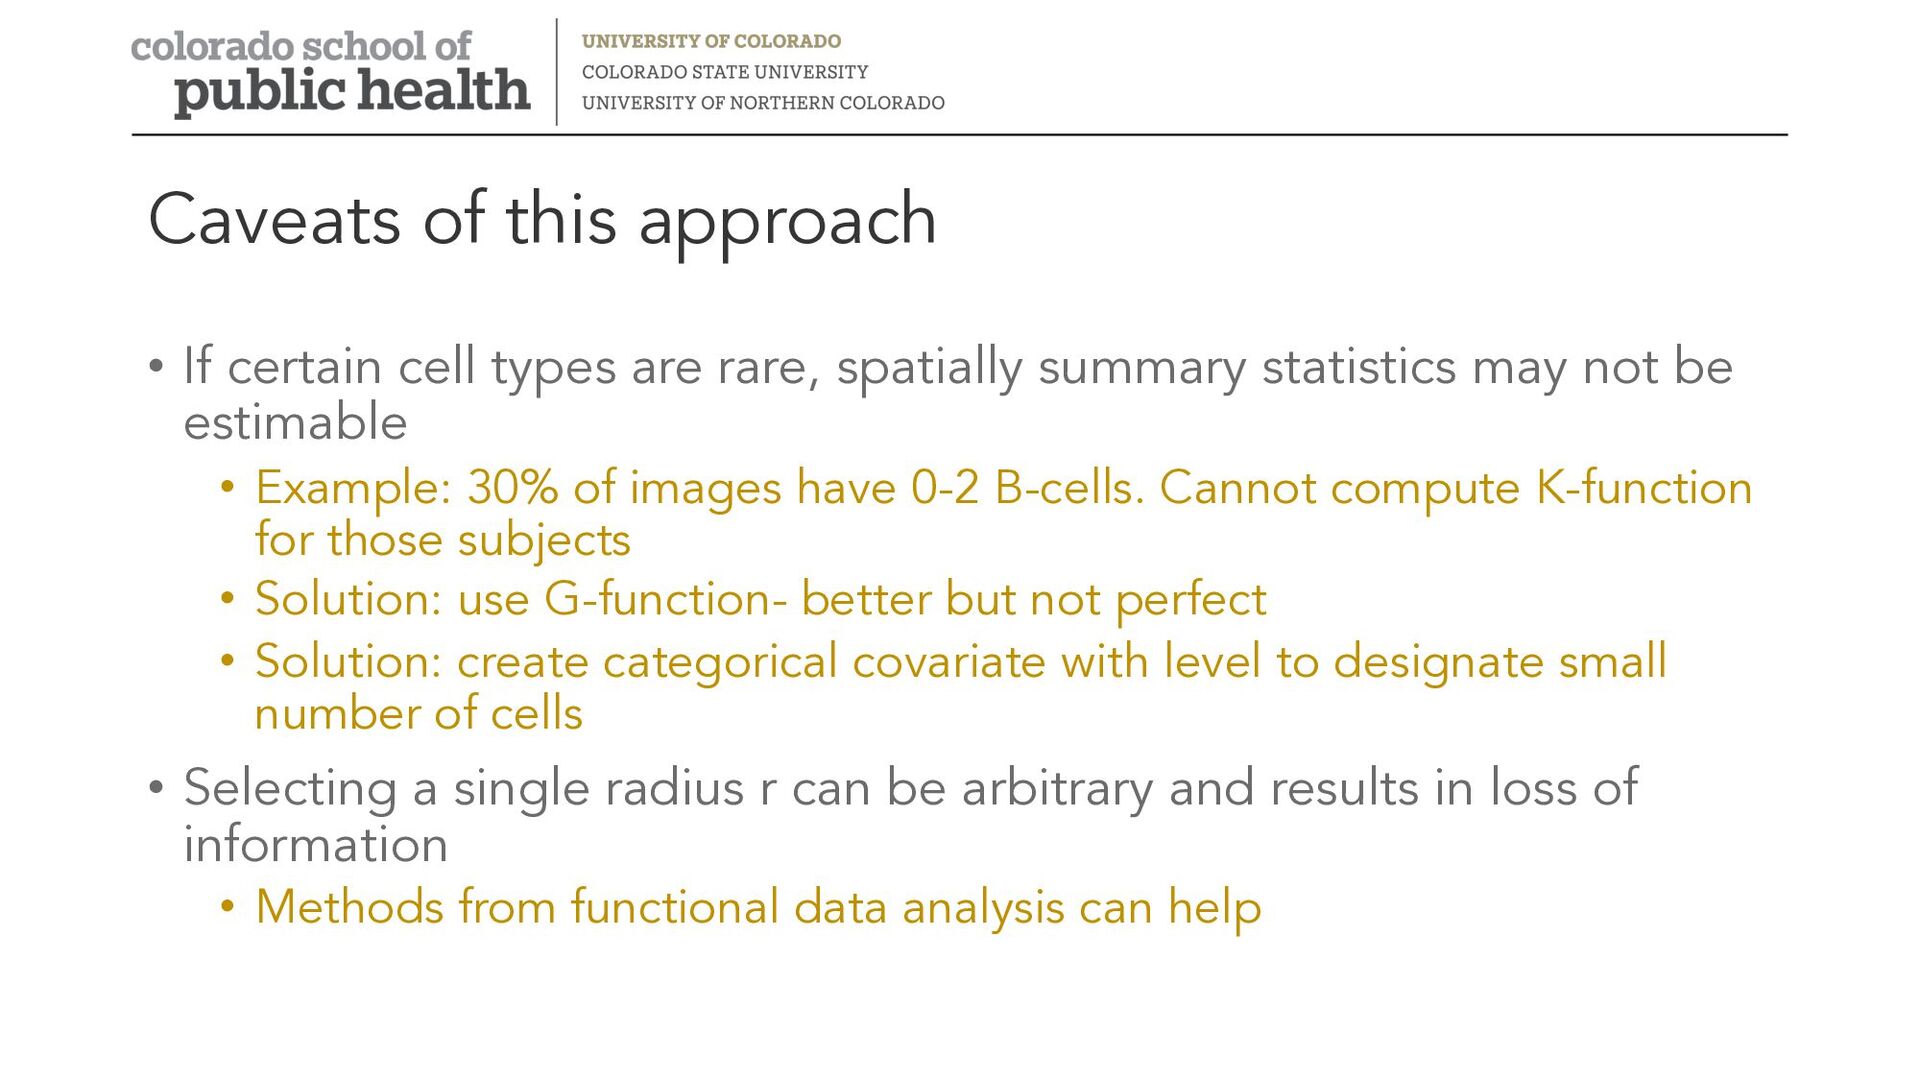
rare, spatially summary statistics may not be estimable • Example: 30% of images have 0-2 B-cells. Cannot compute K-function for those subjects • Solution: use G-function- better but not perfect • Solution: create categorical covariate with level to designate small number of cells • Selecting a single radius r can be arbitrary and results in loss of information • Methods from functional data analysis can help
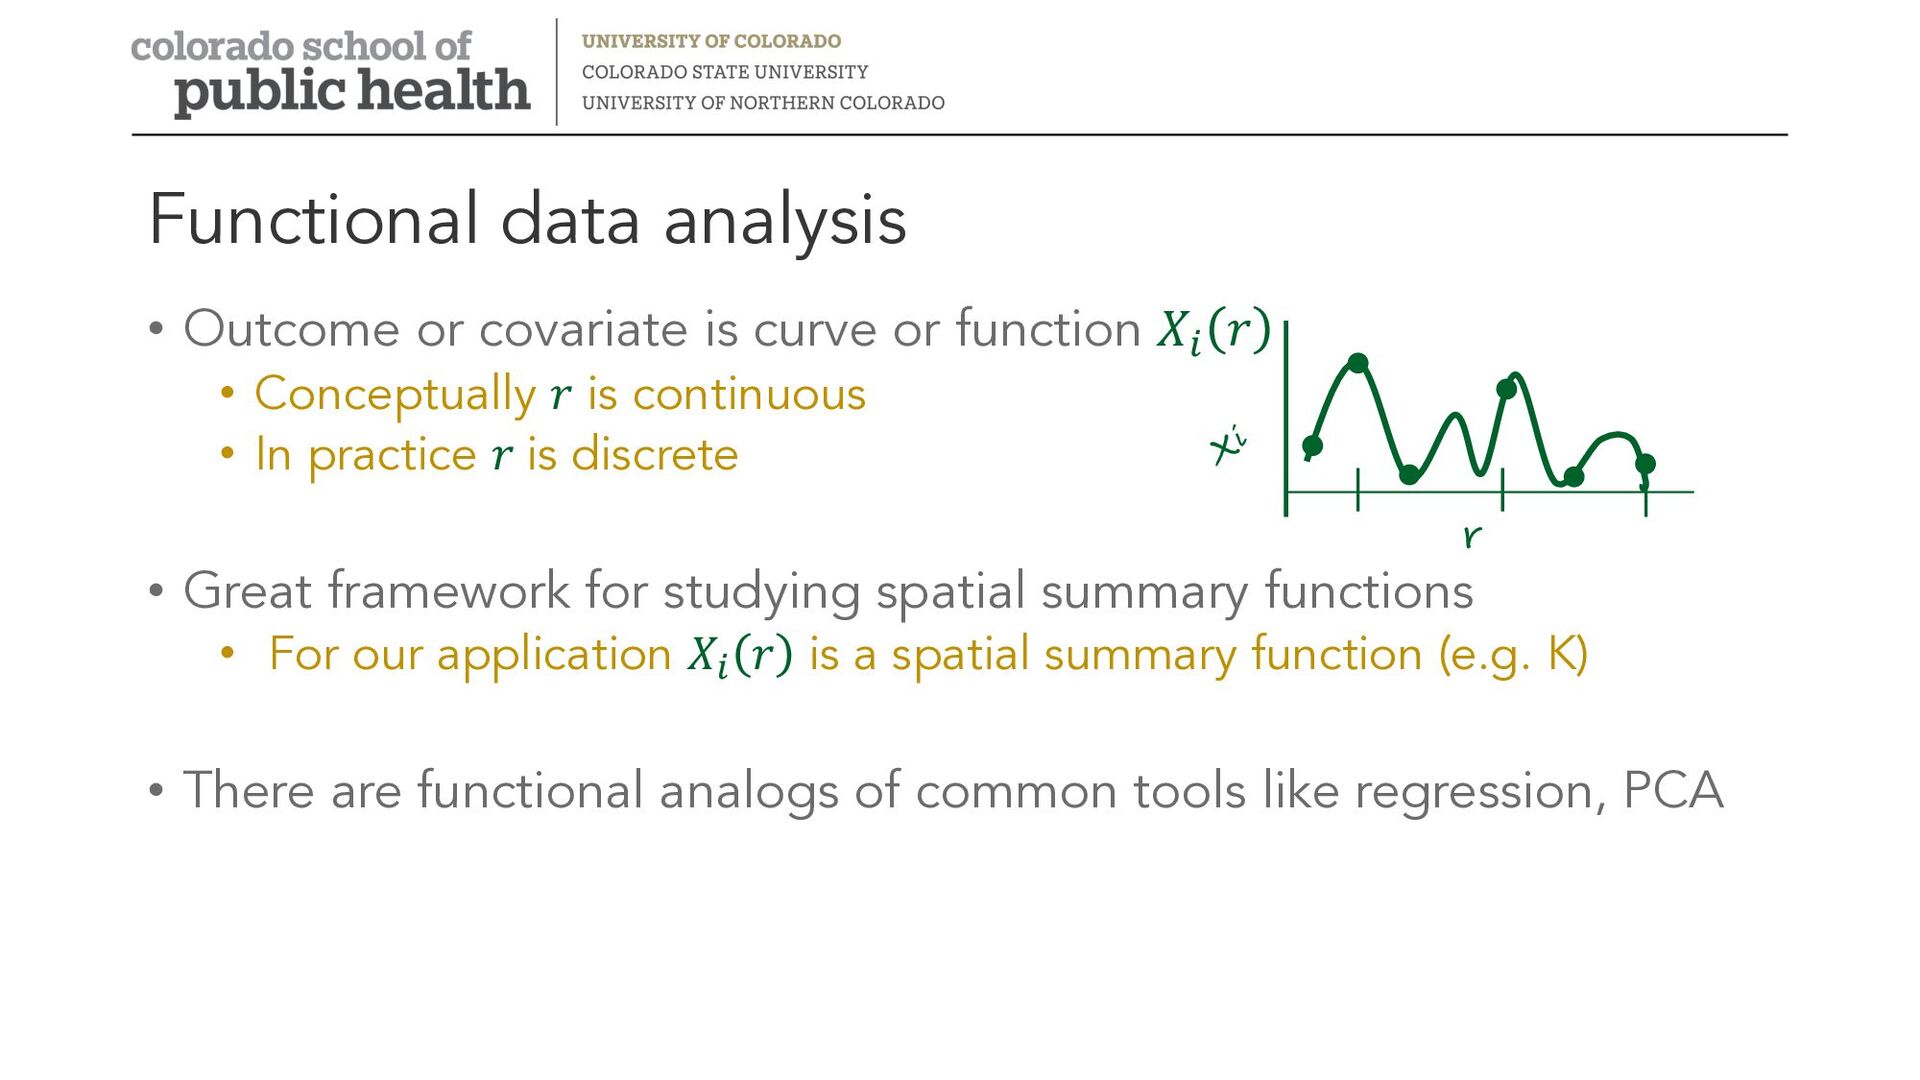
function 𝑋! 𝑟 • Conceptually 𝑟 is continuous • In practice 𝑟 is discrete • Great framework for studying spatial summary functions • For our application 𝑋! 𝑟 is a spatial summary function (e.g. K) • There are functional analogs of common tools like regression, PCA Xi r
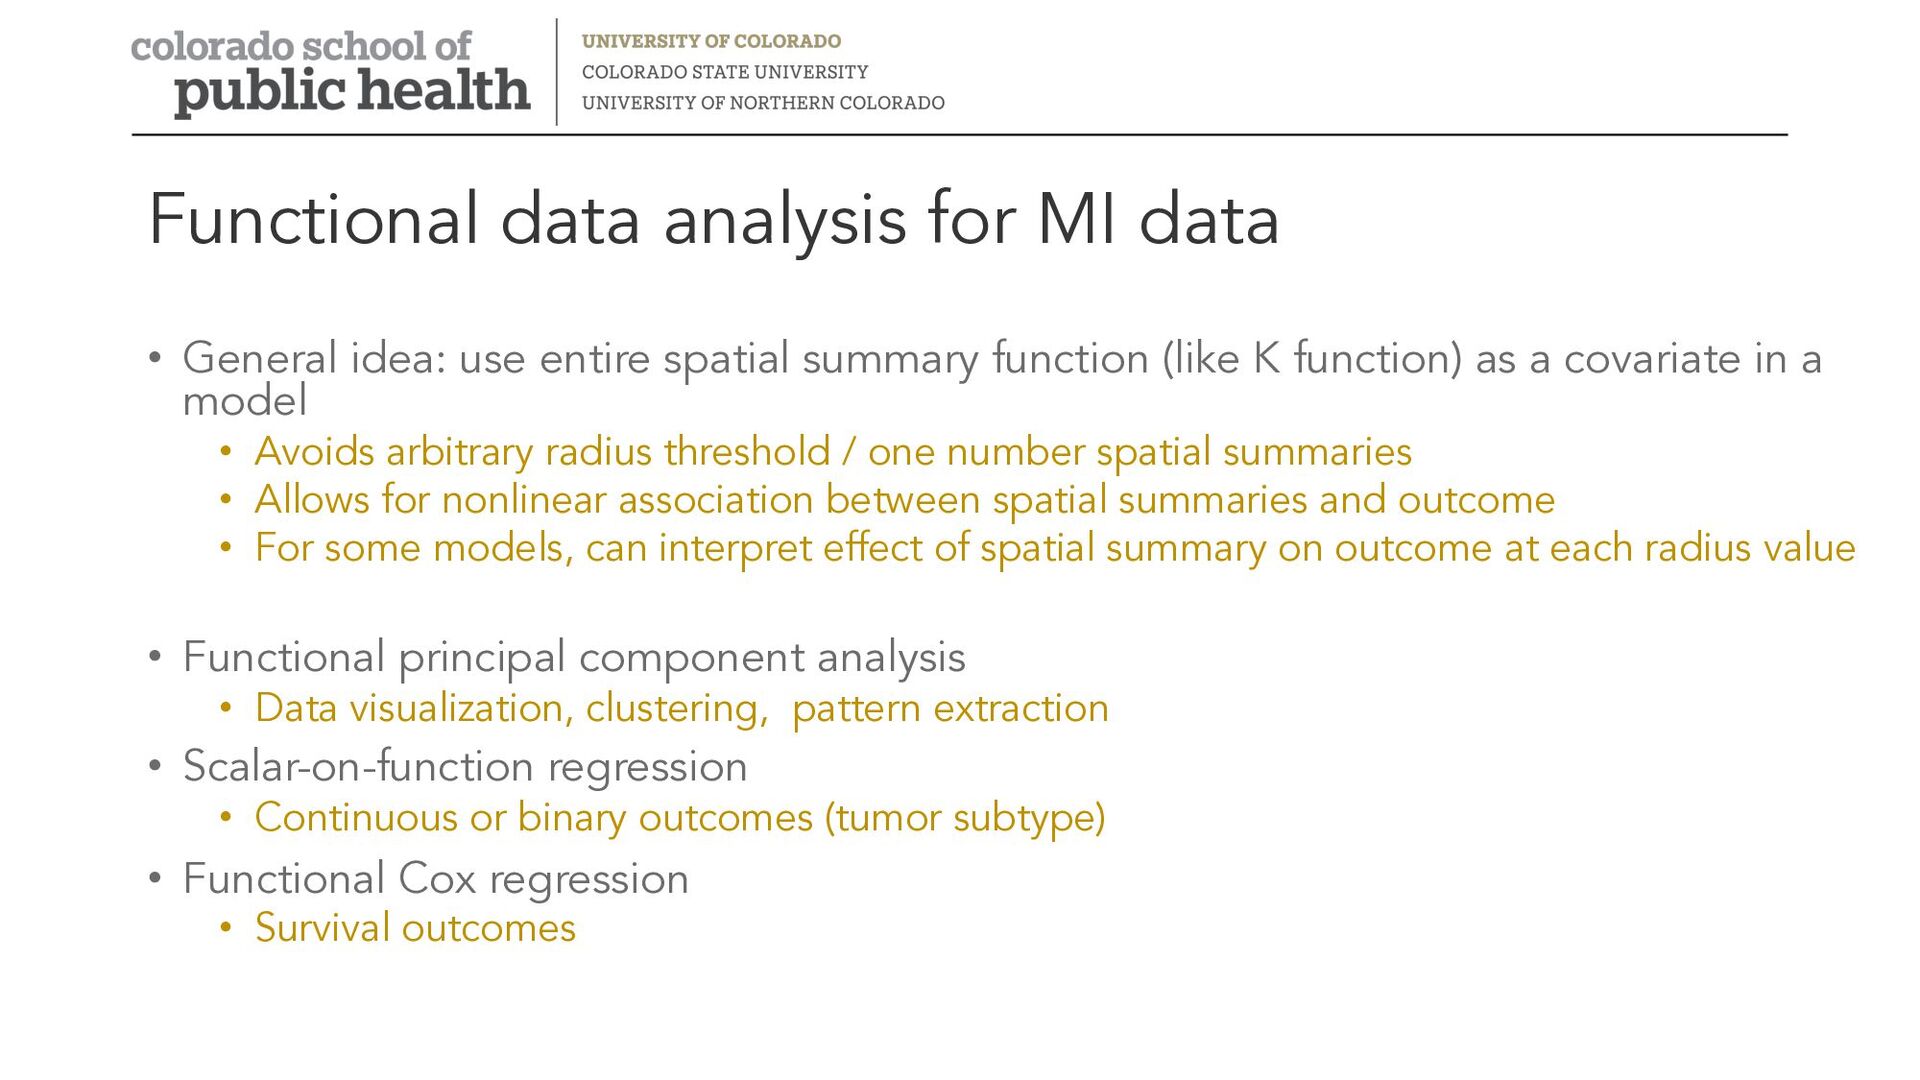
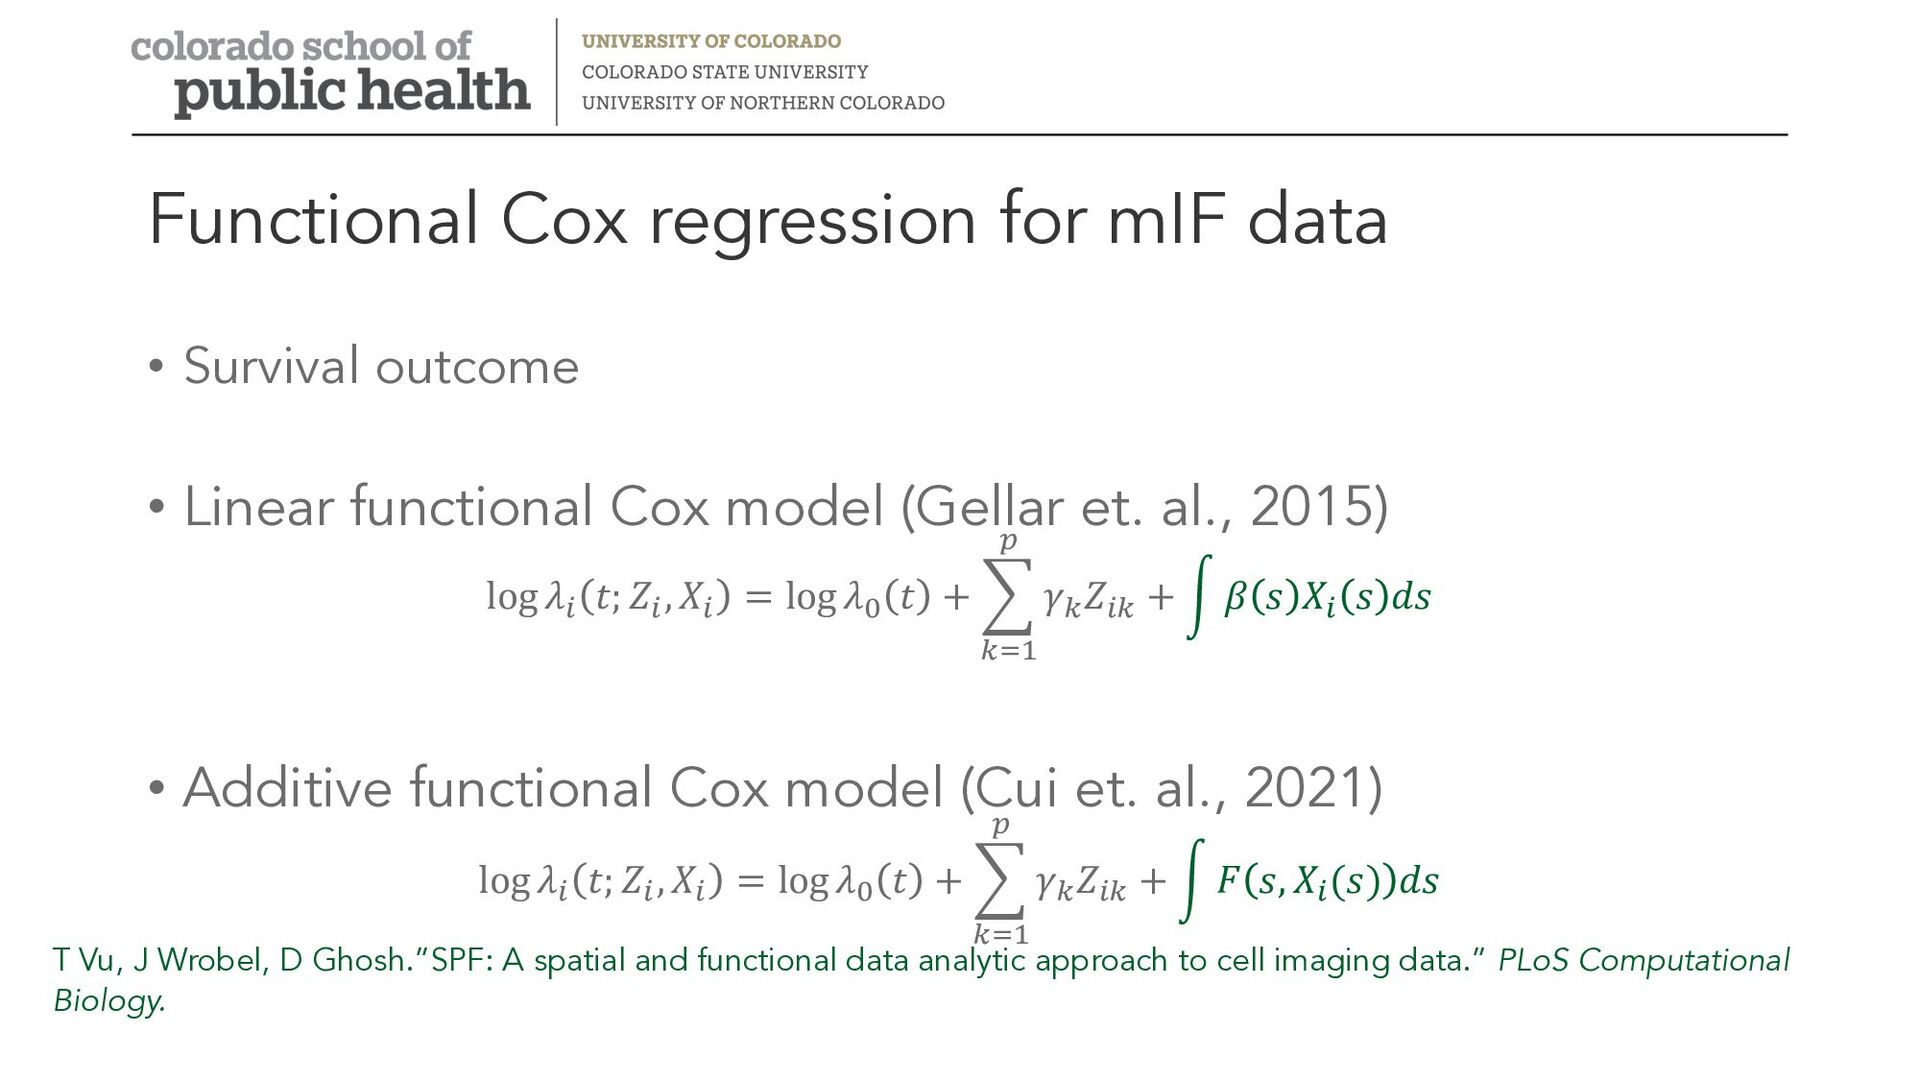
entire spatial summary function (like K function) as a covariate in a model • Avoids arbitrary radius threshold / one number spatial summaries • Allows for nonlinear association between spatial summaries and outcome • For some models, can interpret effect of spatial summary on outcome at each radius value • Functional principal component analysis • Data visualization, clustering, pattern extraction • Scalar-on-function regression • Continuous or binary outcomes (tumor subtype) • Functional Cox regression • Survival outcomes
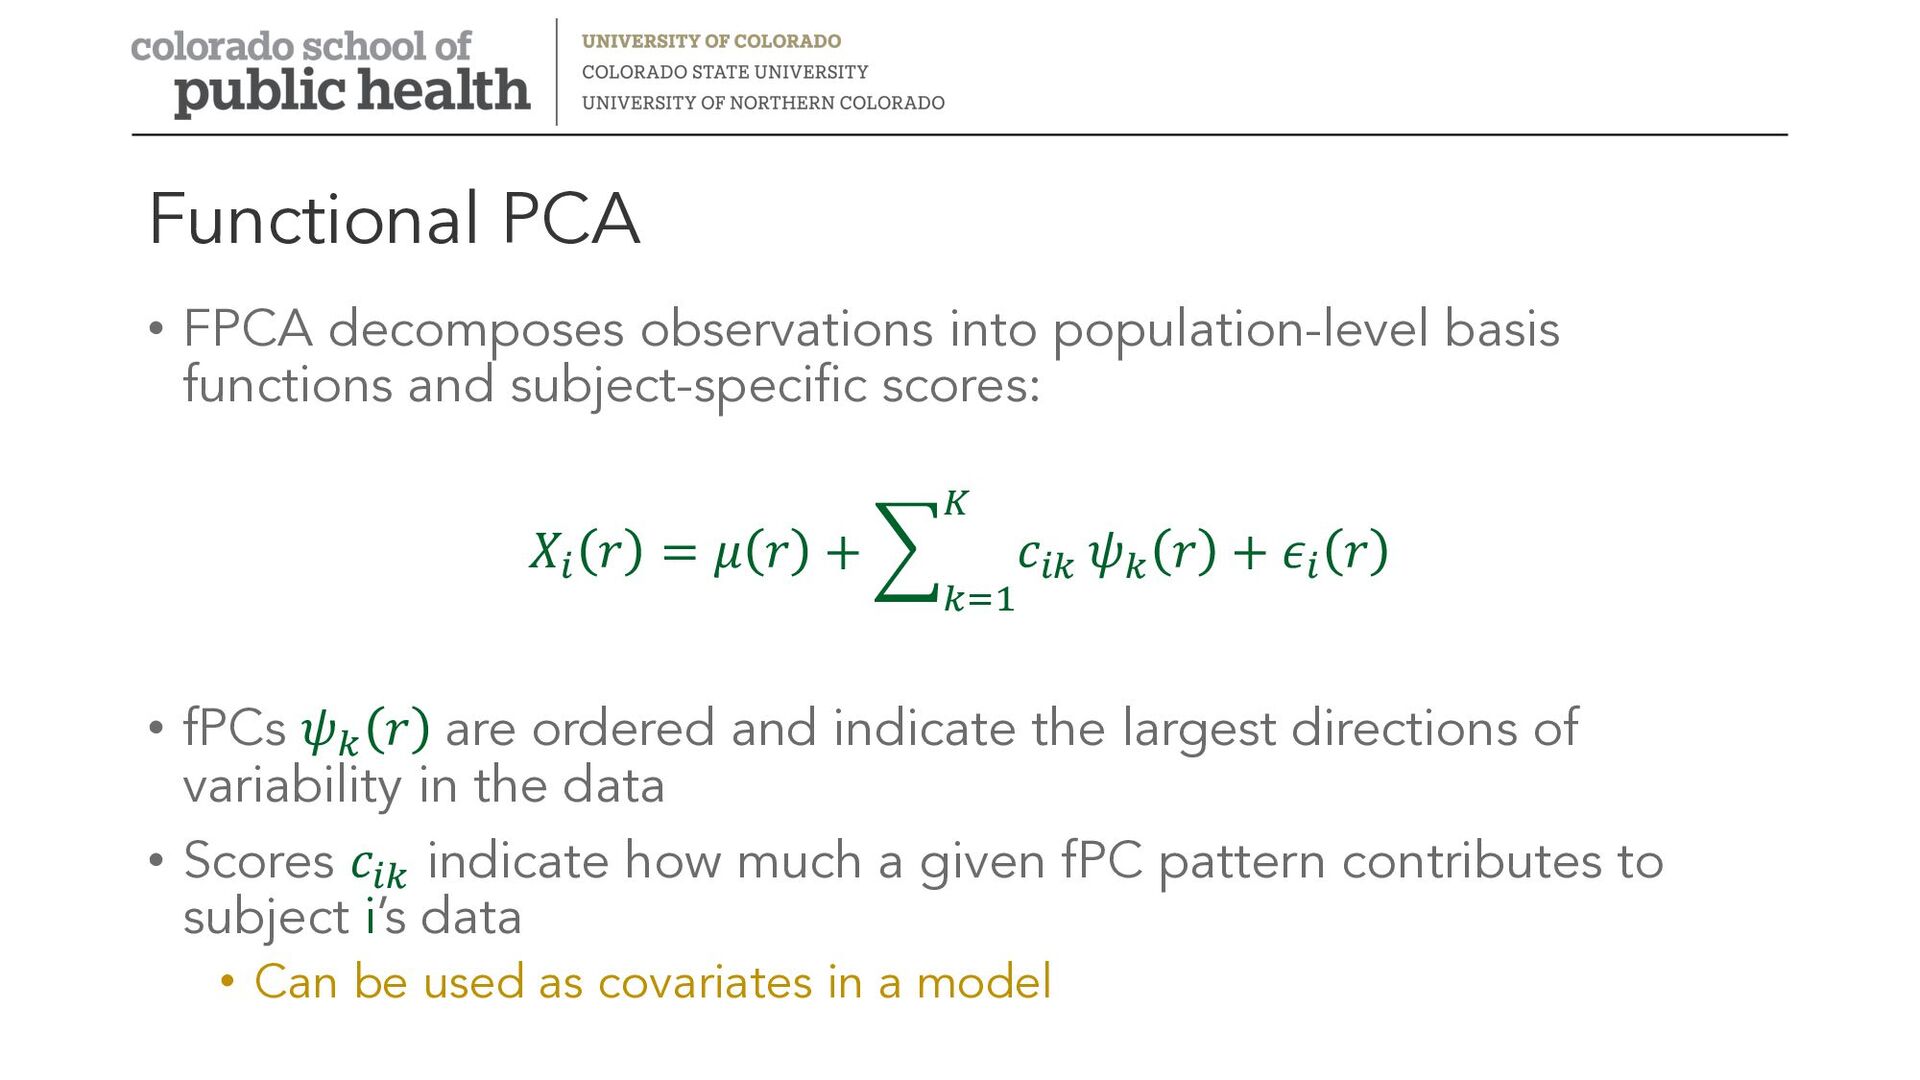
and subject-specific scores: 𝑋! 𝑟 = 𝜇 𝑟 + & "#$ % 𝑐!" 𝜓" 𝑟 + 𝜖! 𝑟 • fPCs 𝜓" 𝑟 are ordered and indicate the largest directions of variability in the data • Scores 𝑐!" indicate how much a given fPC pattern contributes to subject i’s data • Can be used as covariates in a model
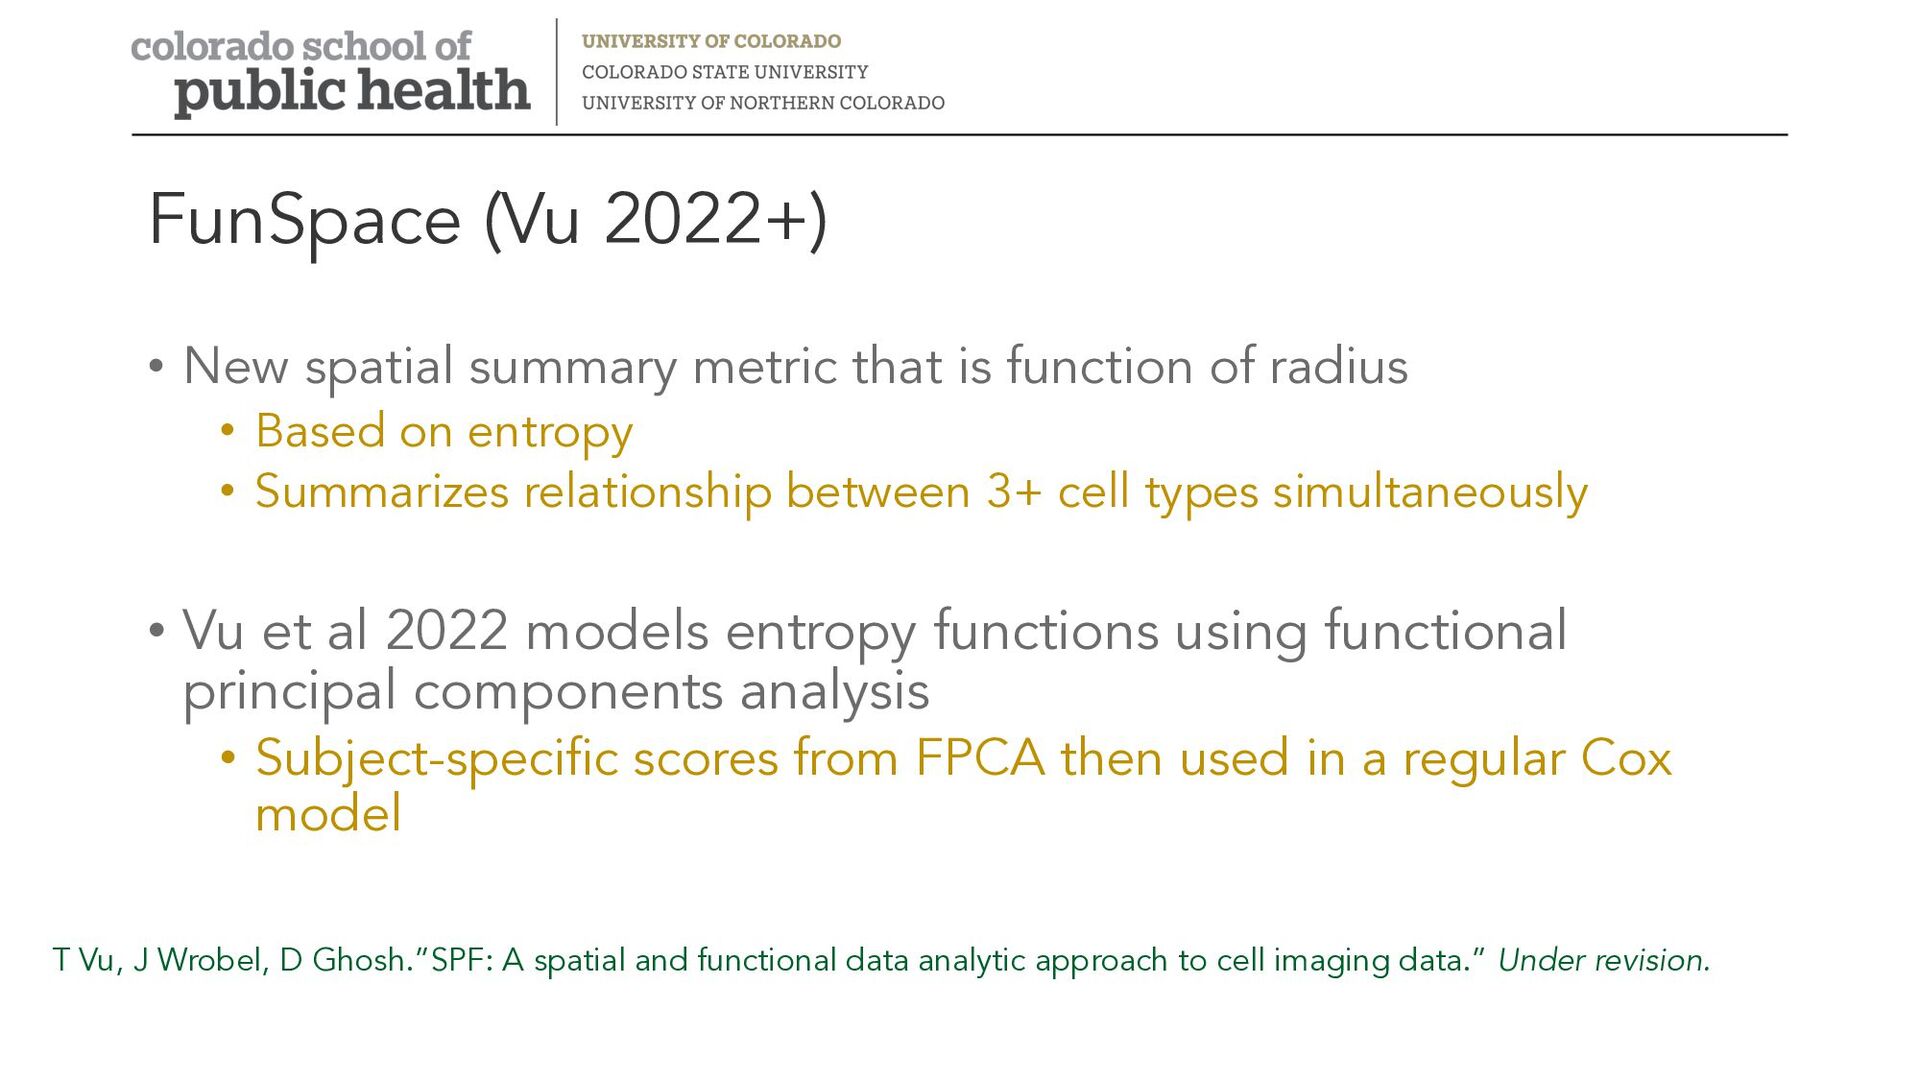
function of radius • Based on entropy • Summarizes relationship between 3+ cell types simultaneously • Vu et al 2022 models entropy functions using functional principal components analysis • Subject-specific scores from FPCA then used in a regular Cox model T Vu, J Wrobel, D Ghosh.”SPF: A spatial and functional data analytic approach to cell imaging data.” Under revision.
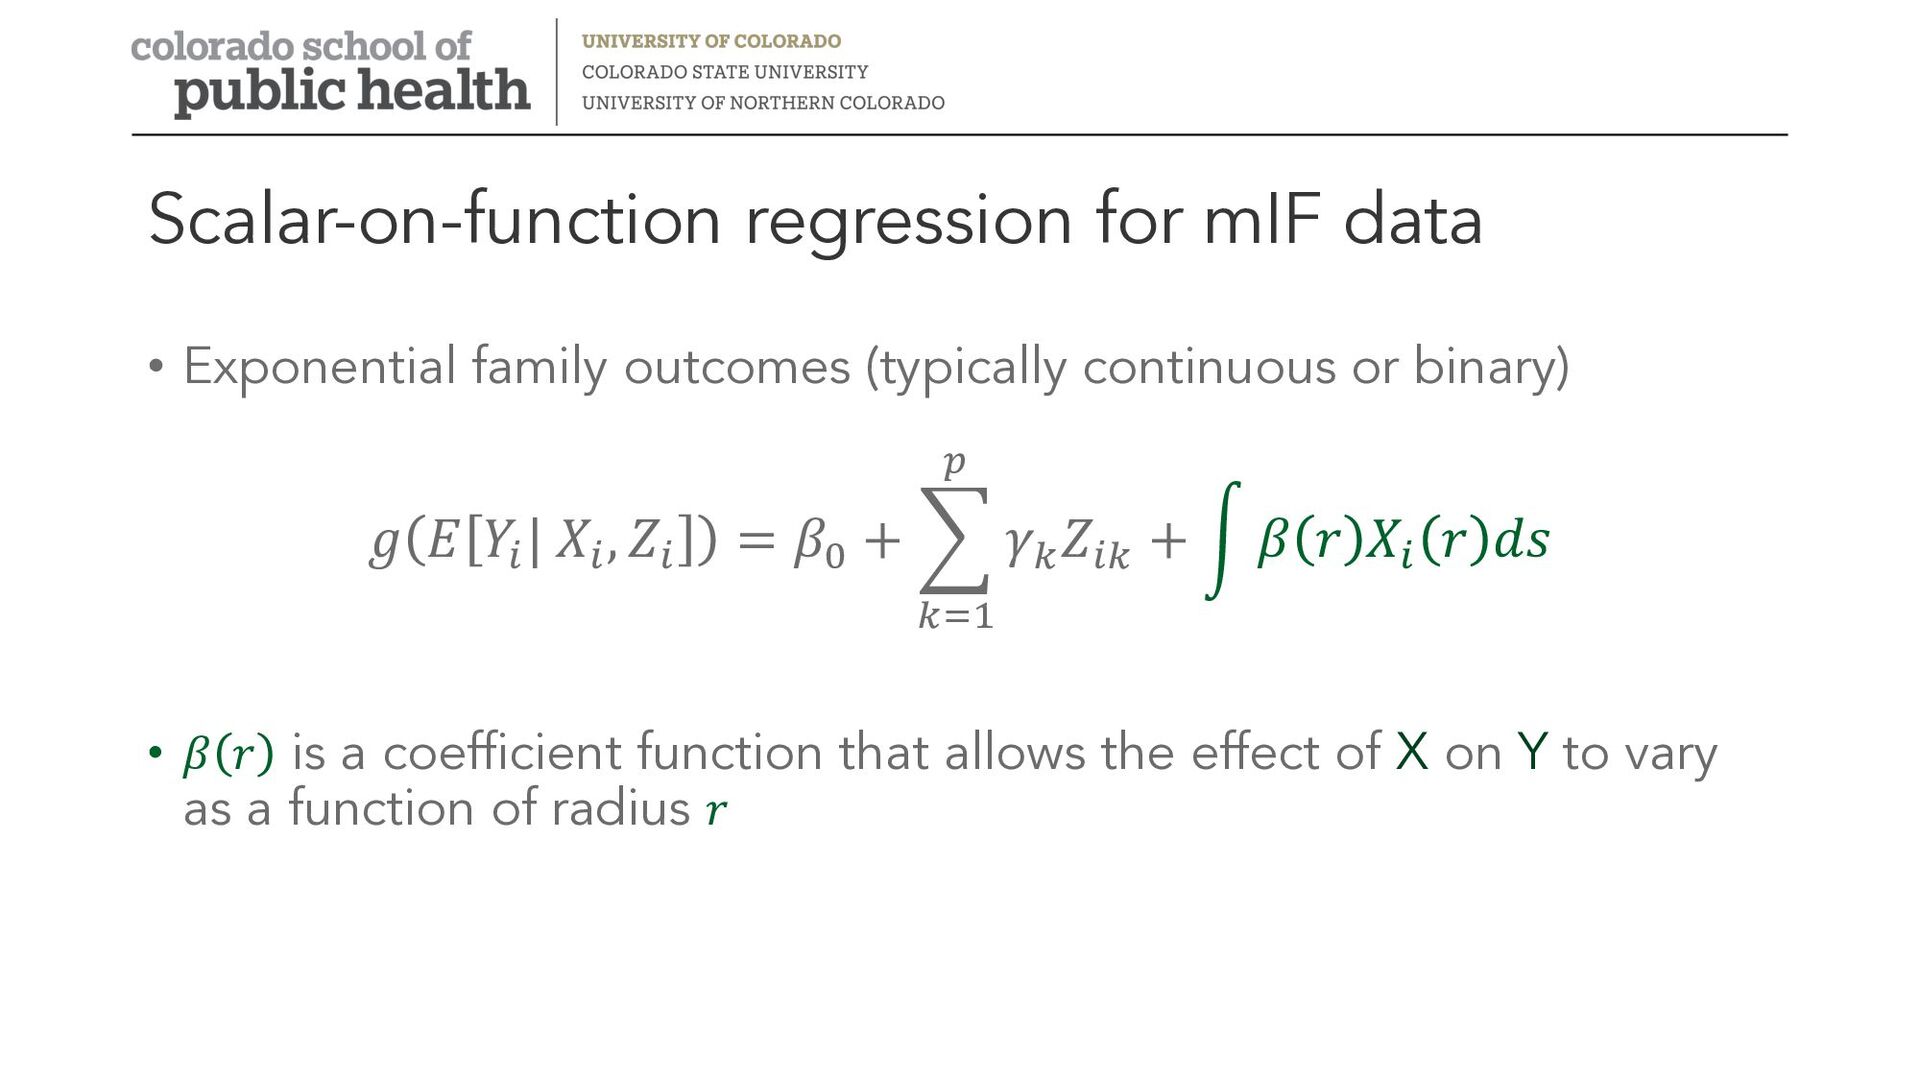
continuous or binary) 𝑔 𝐸 𝑌! | 𝑋! , 𝑍! = 𝛽" + + #$% & 𝛾# 𝑍!# + - 𝛽 𝑟 𝑋! 𝑟 𝑑𝑠 • 𝛽 𝑟 is a coefficient function that allows the effect of X on Y to vary as a function of radius 𝑟